Embed Size (px)
Citation preview

The Quality of Institutions and Foreign Direct Investment
Christian Daude (*) University of Maryland at College Park
Ernesto Stein
Inter-American Development Bank
March 2001 This Version: February 2004
Abstract We study the role of the quality of institutions as a determinant of the location of FDI, using bilateral FDI stocks from OECD countries around the world. While the literature has placed special emphasis on the role of corruption on FDI, we explore a wider range of institutional aspects. We find that better institutions have overall a positive and significant effect on FDI. Especially, unpredictability of policies, excessive regulatory burden, deficient enforcement of property rights, and lack of commitment on the part of the government play a major role in deterring FDI flows. JEL Codes: F15, F23 Key Words: Foreign Direct Investment, Institutions We gratefully acknowledge helpful comments and suggestions made by Eduardo Levy Yeyati, Eduardo Lora, Alejandro Micco and Shang-Jin Wei, as well as participants at the 2001 Latin American Meeting of the Econometric Society and the VI Annual Meeting of the LACEA. The views expressed in this document are the authors� and do not necessarily reflect those of the Inter-American Development Bank. (*) Corresponding Author. Email: [email protected], 3105 Tydings Hall., Department of Economics, University of Maryland at
College Park, MD 20742, USA.
1
1. Introduction
One of the most notorious features of the trend towards globalization in recent times has
been the increased importance of foreign direct investment (FDI) around the world. Over
the last couple of decades, worldwide FDI flows have grown by a factor of almost 10. To
put this evolution in perspective, trade flows around the world, by comparison, only
doubled during a similar period. In this context, a deeper understanding of the
determinants of the location of multinational enterprises is becoming more and more
relevant for the design of successful policies to attract investors.
While the literature has focused mainly on the effects of corruption on FDI, we analyze a
broader set of institutional variables that may affect the decision of foreign investors to
undertake investment projects in a particular country. This allows us to assess what
dimensions of the quality of governance institutions affect foreign investors� location
decisions more. In addition, we use institutional indicators from several different sources
such that we can analyze the robustness of our results.
Corruption may deter investment by increasing the cost of doing business, as investors
need to bribe officials in order to obtain licenses and permits. In addition, corruption may
increase uncertainty, which may deter investment as well. According to Shleifer and
Vishny (1993), the secrecy of corruption is what makes it much more distortionary than
taxes. A standard reference in the empirical literature of FDI location decisions is
Wheeler and Mody (1992). They find that a composite measure of risk factors, which

2
includes institutional variables such as the extent of bureaucratic red tape, political
instability, corruption and the quality of the legal system, does not affect the location of
US foreign affiliates.1 However, their index aggregates these variables together with
others such as attitudes towards the private sector, living environment, inequality, risk of
terrorism, etc, making it impossible to assess the role of individual variables. In
particular, the question of whether any of the institutional aspects have a significant
impact on FDI is left unanswered. The first systematic empirical study on this topic is
Mauro (1995) who shows that corruption has a negative impact on the ratio of total and
private investment to GDP and therefore causes harm to economic growth. Wei (2000),
using data on bilateral FDI stocks from OECD countries, finds that corruption has a
significant and negative impact on FDI. He finds that an increase in the level of
corruption from Singapore to that of Mexico is equivalent to increasing the tax rate on
multinationals by more than twenty percentage points. In addition, Wei (1997) using the
same database, finds that uncertainty regarding corruption has also important negative
effects on FDI location.
However, investment decisions may depend on different dimensions of public institutions
in addition to corruption, like the regulatory framework, the predictability of economic
policy, the protection of property right, or the efficiency of law enforcement. In this
paper, we provide evidence on the impact of these different dimensions of governance
institutions on the location of FDI. In addition, we use different types of institutional
1 Wheeler and Mody's risk factor variables are from the Country Assessment Service of Business International.
3
variables based on experts� reports, surveys and a combination of both in order to ensure
the robustness of our results.
A different literature that is related to the present paper includes Albuquerque (2003),
Aizmann and Spiegel (2002), Hausmann and Fernández-Arias (2000), as well as Mody et
al (2003). This literature focuses on the effects of institutions on the composition of
capital flows. Albuquerque's paper develops an imperfect enforcement model, where FDI
has a risk-sharing advantage over other capital flows, because it contains more intangible
assets that are inalienable and make FDI therefore less attractive to expropriation. The
optimal contract implies that share of FDI in total capital flows is higher for financially
constrained countries. In a set of cross-country regressions with the average FDI shares in
gross private capital flows as dependent variable and controlling by GDP per capita and
trade openness, he finds that the ICRG variable of Law and Order2 has a negative but not
significant effect. However, once credit ratings are included in the regression, the
institutional quality has a positive and significant effect on the FDI share. Mody et al
present a model where multinational firms have an advantage over domestic firms in the
screening process of projects with a noisy signal concerning their real level of
profitability. In this context, the value of this advantage is decreasing in the host country's
degree of corporate transparency. Thus, their model predicts that the proportion of FDI in
comparison to portfolio investment is lower in countries where institutions are more
transparent. They present empirical evidence in favor of this prediction, using an index of
creditors' rights from La Porta et al (2000) in a gravity model to explain the ratio of FDI
flows to trade. Aizmann and Spiegel present an efficiency wage model where ex-post 2 Since we also use this variable, we will explain its construction in more detail in the next section.
4
monitoring costs and enforcement of labor contracts are lower for domestic firms than for
multinationals, but the later are more productive. In this situation, multinationals will be
more sensitive to changes in the enforcement cost (quality of institutions) and pay higher
wages than domestic firms do. They find that the share of FDI to gross fixed investment,
as well as the ratio of FDI to private domestic investment, is negatively and significantly
correlated with the level of corruption, such that FDI seems to be more sensitive than
domestic investment to the institutional quality. Finally, Hausmann and Fernández-Arias
study the effects of institutional variables on the composition of capital inflows, using six
different institutional variables compiled by Kaufmann et al (1999a), as well as indices of
creditor and shareholder rights from La Porta et al (1998).3 The authors find that better
institutions lead to a reduction of the share of inflows represented by FDI. They conclude
that, in comparison to FDI, other forms of capital are more sensitive to the quality of
institutions. When they look at the effects of their institutional variables on FDI as a share
of GDP, only a small subset of the institutional variables � regulatory quality,
government effectiveness and shareholder rights - remain significant after including some
controls. Their summary index of institutions, the first principal component of the six
institutional variables of Kaufmann et al, does not have significant effects on the ratio of
FDI to GDP.
One limitation of these studies is that they all test some prediction of their models in an
ad-hoc econometric model controlling for other possible determinants of FDI as GDP per
capita, openness, size, etc. Given this ad-hoc formulation and the fact that they use
3 The institutional variables from Kaufmann et al (1999a) are regulatory quality, voice and accountability, government effectiveness, political stability and lack of violence, control of corruption and rule of law. We will describe these in more detail below, as we will use them here as well.

5
different institutional variables, it is difficult to determine the source of the qualitative
and quantitative differences in their results.
Unlike these studies, our focus is on FDI per se, rather than on the composition of capital
inflows. As in Wei (1997, 2000), we use bilateral data on FDI stocks from the OECD
International Direct Investment Statistics, but we use a wider range of institutional
indicators. The use of bilateral data allows us to use a much richer set of control
variables.
Another contribution of our paper is that we avoid the shortcoming of the existing
empirical literature, especially the studies that analyze the effects of the some
institutional dimensions on FDI as Wheeler and Mody (1992), Hausmann and Fernández-
Arias (2000), Wei (1997, 2000), and Mody el al (2003), that they rely on ad-hoc
empirical formulations. In this sense, we test the significance of the quality of institutions
on FDI in an empirical model that follows recent developments in the theory of
multinational enterprise location (see Markusen, 1997 and 2001) more closely. Carr, et al
(2001) and Blonigen et al (2002) have used very similar econometrics specifications
recently.
The rest of the paper is organized as follows: In Section 2, we present the data, and
discuss our empirical strategy. Section 3 presents our main results on the institutional
quality as a determinant of the location of FDI. Section 4 presents some sensitivity
analysis, and Section 5 concludes.

6
2. Data and Empirical Strategy
FDI Data
We use bilateral outward FDI stocks for 1998 from the OECD International Direct
Investment Statistics in millions of dollars. The dataset covers FDI from 20 source
countries, all of them from the OECD, to 58 host countries.4 By using outward stocks, we
ensure that differences across countries in the definition and measurement of FDI do not
alter the relative allocation of FDI for each of the source countries. Wei (1997, 2000) has
used this database previously to study the effect of corruption on FDI. Levy Yeyati et al
(2003) use these data to analyze the relationship between FDI and regional integration,
while Blonigen et al (2002) have used it to test empirically different theories of FDI.
Institutional Variables
In order to assess the role of institutions as a determinant of the location of FDI, we will
use several institutional variables drawn from different sources. The first set of
institutional variables is the governance indicators database developed by Kaufmann et al
(1999a). These indicators are constructed based on information gathered through a wide
variety of cross-country surveys as well as polls of experts. The authors use a model of
unobserved components, based primarily on data for 1997 and 1998, which enables them
to achieve levels of coverage, for each of their indicators, of approximately 160
4 Thus the number of observations is 20x(58-1)=1140. However, data availability in our regressions will reduce the effective number of observations to around 700.
7
countries.5 They construct six different indicators, each representing a different
dimension of governance: Voice and Accountability, Political Stability and Lack of
Violence, Government Effectiveness, Regulatory Quality, Rule of Law, and Control of
Corruption. This clustering of institutional indicators into different dimensions allows us
to study whether some dimensions of governance matter for FDI location, while others do
not. Kaufmann et al (1999a) standardized their indicators so that they all have mean zero
and a standard deviation of one; in all cases larger values indicate better institutions.6
Voice and Accountability, as well as Political Stability and Lack of Violence aggregate
those aspects related to the way authorities are selected and replaced. The first variable
focuses on different indicators related to the political process, civil rights, and institutions
that facilitate citizens� control of government actions, such as media independence. The
second variable combines indicators that measure the risk of a destabilization or removal
from power of the government in a violent or unconstitutional way.
The indicators clustered in Government Effectiveness and in Regulatory Quality are
related to the ability of the government to formulate and implement policies. The first
variable aggregates indicators on the quality of bureaucracy, the competence of civil
servants, the quality of public service provision and the credibility of the government�s
commitment to its policies. The second brings together indicators related to the content of
5 For more technical details see Kaufmann et al (1999b). 6 In our empirical work, we re-standardize these variables to have mean zero and standard deviation of one in our own sample, in order to simplify the interpretation of the coefficients, as well as the comparison of their relative importance.
8
policies, like the existence of market-unfriendly regulations such as price controls and
other forms of excessive regulation.
The last two variables, Rule of Law and Control of Corruption, consider aspects related to
the respect, on the part of both citizens and the government, for the institutions that
resolve their conflicts and govern their interactions. The first one includes variables that
measure the perceptions on the effectiveness and predictability of the judiciary, as well as
enforceability of contracts, while the second aggregates different indicators of corruption.
In Table A.1 of the Appendix, we present the simple correlations between the six
variables, and the partial correlation between them controlling for GDP per capita. There
is a remarkably significant correlation between the variables, even when controlling for
GDP per capita. For example, in our sample, the simple correlation between Rule of Law
and Control of Corruption is 0.93 and it remains at 0.76 once we control for GDP per
capita.
As Mauro (1995) points out, there may be good reasons to expect this positive correlation
between most variables. For example, Krueger (1993) argues that corruption may induce
a less efficient bureaucracy since officials may introduce requirements and additional
obstacles in order to receive bribes. However, from an econometric point of view this
correlation induces serious problems of multicollinearity and limits the extent to which
the relevance of each institutional dimension can be identified. The most standard
solution is to group those variables that capture similar dimensions. In this sense, in
9
several regressions we will use the average of Voice and Accountability and Political
Stability and Lack of Violence as Political Stability and Freedom, while we group Rule of
Law, Control of Corruption, Government Effectiveness and Regulatory Quality as
Government Efficiency.7
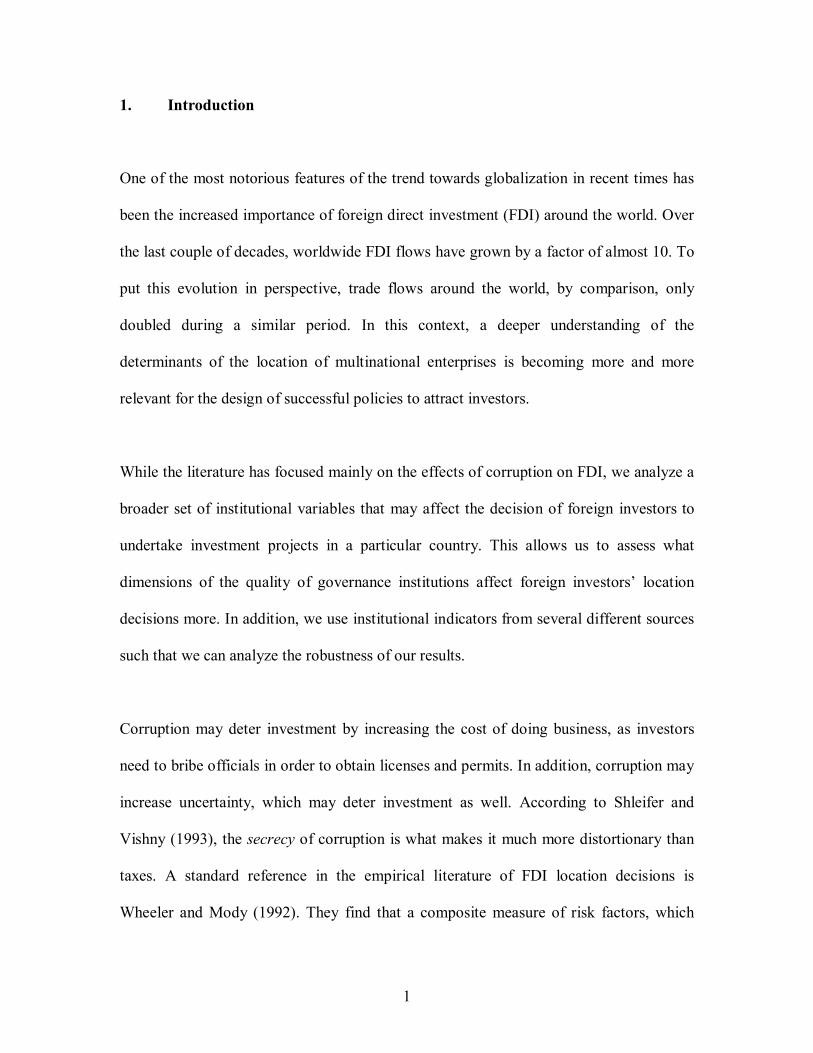
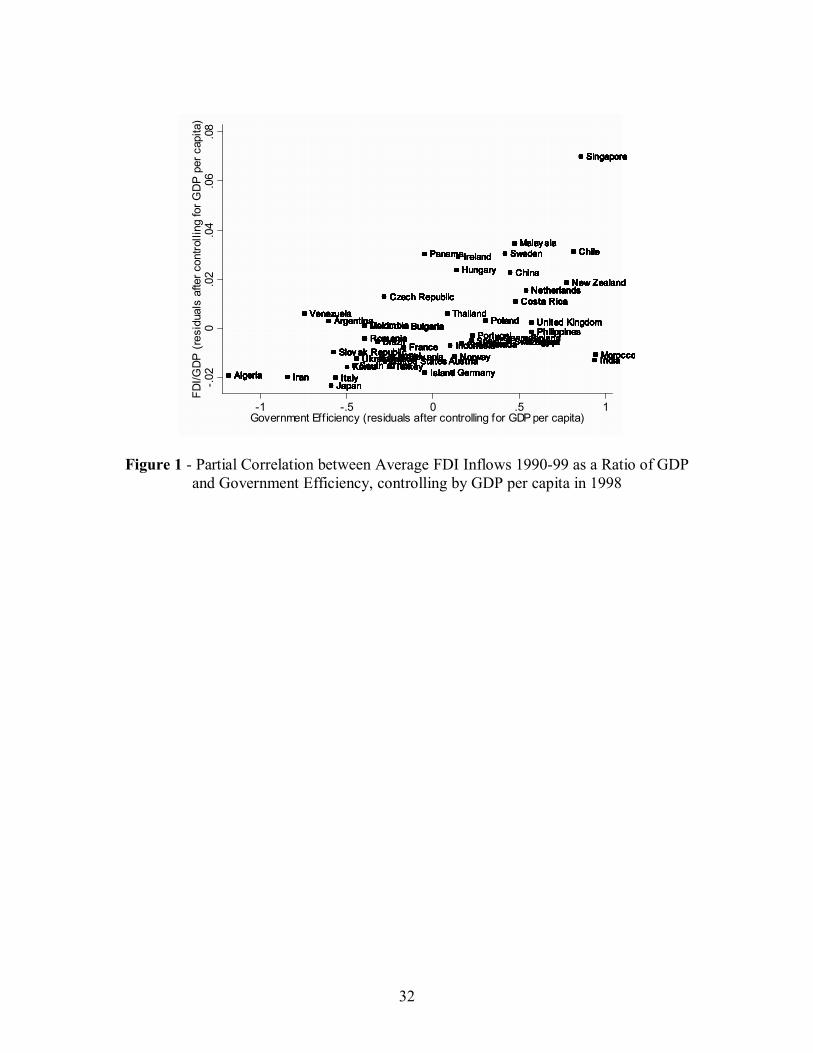
In Figure 1 we plot the ratio of average FDI inflows to GDP in the 1990's and
Government Efficiency � after controlling for GDP per capita - for the countries that will
be considered in our subsequent regression analysis. There is a strong positive and
significant partial correlation between this institutional variable and the rate of FDI to
GDP.8
[Insert Figure 1]
A second source for institutional variables is the International Country Risk Guide
(ICRG) compiled by the PRS Group. Unlike those of Kaufmann et al (1999a), these
indicators rely exclusively on polls of experts. The variables we consider are a subset of
the ones available from the ICRG database for the year 1995. Specifically, we use the
Risk of Repudiation of Contracts by the Government, Risk of Expropriation, Corruption
in Government, Law and Order, Bureaucratic Quality, and Democratic Accountability.9
While the first three variables are coded on a 0 to 10 scale, the last three are coded
7 This grouping may also reduce measurement problems of the individual components. 8 These results are reasonably robust to the fact that Singapore could be an influent outlier. The partial correlations between government efficiency and the ratio of FDI to GDP are 0.48 and 0.43 if we include or not Singapore, respectively. Both coefficients are significant at 99% of confidence. 9 Knack and Keefer (1995) use most of these variables: Risk of Repudiation of Contracts by the Government, Risk of Expropriation, Corruption in Government, Rule of Law, and Bureaucratic Quality.

10
between 0 and 6. In order to facilitate comparability we standardize all variables in our
sample to mean 0 and unit variance. In all cases, higher rankings imply better institutions.
In Table A.2 we present the correlation matrix for these indicators. As in the case of the
previous dataset, the ICRG variables are all positively correlated.
A third source of institutional variables is the World Business Environment Survey from
the Worldbank. This survey was conducted between 1999 and 2000, collecting
information regarding constraints to business activities that firms face, including
institutional and governance aspects. The sample covers 80 countries and approximately
100 enterprises in each country. The advantage of this kind of surveys is that they report
in a more accurate way the perception of entrepreneurs about the different risks and
constraints their business faces rather then relying on an expert�s perception about these
issues. In this sense, by using variables constructed on survey information it is possible to
reduce the subjectivity bias mentioned above. However, it should be kept in mind that the
main purpose of this survey is to ensure a representative measure at a country level, but
their comparability across countries may be lower than in the case of indicators based on
subjective perceptions of experts.
We consider the average by country of the answers to the following questions in the
survey: i) Quality of the courts (1 very good to 6 very bad); ii) Quality of central
government (1 very good to 6 very bad), iii) Corruption is a general constraint to do
business (1 no obstacle to 4 major obstacle), iv) Changes in economic and financial
policies are predictable (1 completely predictable to 6 completely unpredictable); v)
11
Change in law and regulations are predictable (1 completely predictable to 6 completely
unpredictable).10 The correlation matrix is presented in Table A.3.
A fourth group of variables is composed by some more �objective� measures that have
been used in the literature as proxies and/or instruments for institutions. From Barro
(1991) we consider the average number of revolutions and successful coups per year, as
well as the number of assassinations per thousand inhabitants per year during the 1980�s.
These variables have been used in the empirical growth literature (see Barro, 1991) to
analyze the effects of political instability and crime on cross-country growth rates. From
Hall and Jones (1999) we take the fraction of the population that speaks English. Hall and
Jones use these variables to instrument their variable of social infrastructure in cross-
country regressions to explain the difference in GDP per capita levels. We also include
dummies regarding the origin of the legal code that have been used by La Porta et al
(1999) as explanatory variables of the quality of governance institutions. In addition, we
consider an index of ethnic fragmentation by Mauro (1995) who uses this indicator as an
instrument for his institutional variables. Finally, Acemoglu et al (2001) provide an
interesting instrument for institutions that is the mortality of settlers in former colonies.
We use this group of variables as instruments for institutions in our regression analysis.
10 Note that in this case, higher values of the variables represent a lower level of institutional quality. The database, a detailed description of the survey and related papers can be downloaded at http://www.worldbank.org/privatesector/ic/ic_resources.htm. We have also considered the WDR 1997 database that formulates very similar questions but covers fewer countries. The results do not differ from those presented here for the WBES and are available upon request.

12
The use of these different types of variables to study the effects of institutional variables
on the location of FDI should provide us with a good sense of the robustness of our
results.
Empirical Strategy
Most of the empirical studies of FDI location are based on the gravity model, which is a
standard specification in empirical models of bilateral trade.11 In its simplest formulation,
it states that bilateral trade flows (in our case bilateral FDI stocks) depend positively on
the product of the GDPs of both economies and negatively on the distance between them.
Typical variables added to the simplest gravity specification in the trade literature include
GDP per capita, as well as dummies indicating whether the two countries share a
common border, a common language, past colonial links, etc.
While in the trade literature the gravity model has good theoretical foundations, the use
of this model for the case of FDI is somewhat ad-hoc. Although we will look at the
results of the standard gravity model for reasons of robustness, we base our empirical
evaluation of the effects of the different institutional variables on FDI on an empirical
model recently developed by Carr et al (2001) which in turn follows closely a theoretical
model of location of multinational activity developed by Markusen (1997, 2001).
11 For a discussion of the empirical application and theoretical foundations of the gravity equation in trade theory see Frankel (1997). Papers that have used the gravity model to study the location of FDI include Wei (1997, 2000), Mody et al (2003), Stein and Daude (2002) and Levy-Yeyati et al (2003).
13
The model incorporates horizontal and vertical motives for FDI. The type of FDI that is
observed between two countries is determined endogenously in a general equilibrium
framework considering a two-country, two-factor, two-good world. The types of firms
that can arise in this context are: horizontal firms with plants in both countries and
headquarters in one, vertical firms that have a single production facility in one country
and headquarters in the other country, and national firms that maintain headquarters and
the production plant in only one country and may serve the other market through trade.
One good (A) is produced in a competitive industry with constant returns to scale using
unskilled labor, while the other good (B) is produced under imperfect competition with
increasing returns to scale at the firm level due to R&D, and management services. The
model includes similar assumptions as earlier models of vertical FDI as Helpman (1984),
Helpman, and Krugman (1985) such as the possibility of fragmenting the production and
the location of the headquarters and the operational plant. Also, plant scale economies are
assumed for this sector. Finally, a key assumption of the model is the factor intensity in
the different production facilities. In this sense, headquarters activities are the most
skilled-labor intense, followed by the firm that produces good B and has headquarters in
the same location. Moreover, a production plant in sector B is supposed to be less skilled-
labor intensive than the former, but more intensive than one in sector A. It is clear that
while differences in factor endowments tend to favor vertical FDI, firm level economies
of scale would favor horizontal FDI, given the existence of trade costs.
The type and volume of FDI between two countries depends on the size of each
economy, differences in the size between the host and the source country, relative factor
14
endowments, trade costs and investment costs. When countries differ in size, but not in
factor endowments, there is an inverted U-shaped relation, indicating that horizontal FDI
is highest between countries that are of the same size. In this sense, the empirical
specification should include the squared difference in size in order to account for this
relationship. Additionally, vertical FDI takes place if the difference in the size of the
economies is significant and the small country is skilled labor intensive, so that the
production facility tends to be installed abroad. Notice that since headquarters location
decisions are based on factor endowments and plant location on the basis of the factor
endowments and the market size, an interaction term between both variables should be
included in the empirical specification of the model.
As in the pure horizontal model (see Horstmann and Markusen, 1987, 1992), trade costs
in the host country encourage horizontal FDI, while investment restrictions in the host
country � captured in our institutional variable - and trade costs in the source country
restrict FDI activity of vertical nature. However, since trade costs favor horizontal FDI
but not vertical FDI, and horizontal FDI increases if factor endowments are similar, Carr
et al (2001) include an interaction between trade costs and the squared endowment
differences.
To the benchmark model of Carr et al (2001), we add our measure of institutional quality,
such that the empirical specification is as follows:
0 1 2 3 4
5 6 7 8
ln(1 )
ln( )ij ij ij ij ij ij
ij j j ij j i ij
FDI SUMGDP SQDIFGDP ADIFGDP ADIFSKILL ADIFSKILL
Distance TARIFF TARIFF SQDIFSKILL institutions
β β β β ββ β β β ϕ ε
+ = + + + × +
+ + + × + + + (1)

15
The definitions of the variables are as follows. FDI is the outward stock of FDI from
country i (source) in country j (host) from the OECD database. SUMGDP is the sum of
the logs of the host country and the source country GDPs, in current dollars from the
WDI database in 1998. The variable SQDIFGDP is the squared difference in the GDPs of
the host and the source country, while ADIFGDP is the absolute difference between
them. Similarly, ADIFSKILL is the absolute difference between the countries�
endowments of skilled labor and SQDIFSKILL is the corresponding squared difference.
We use the average percentage of the labor force with secondary education from the WDI
database over 1990 and 1995 as our variable of skilled labor endowment. DISTANCE is
the great circle distance between the countries� capitals.12 Trade costs are measured by
the average TARIFF level between 1990 and 1998.13 Finally, source country dummies
( iϕ ) are included in order to capture the effects of possible systematic differences in the
FDI accounting methodology of reporting countries, as well as other relevant source
country characteristics.
The log specification is used because it has typically shown the best adjustment to the
data in the empirical literature. A problem that arises when using the log of FDI as a
dependent variable, however, is how to deal with the observations with zero values. Our
dataset includes about one third of observations where FDI stocks are zero14, which
would be dropped by taking logs. The problem of zero values of the dependent variable is
typical in gravity equations for trade, and it has been dealt with in different ways. 12 The only exceptions are the U.S. and China, where we consider Chicago and Shanghai respectively. 13 Tariff data are from the Worldbank available at http://www.worldbank.org/data/wdi2001/pdfs/tab6_6.pdf 14 More specifically, there are 315 zero values in 1140 total observations.
16
Some authors (see for example Rose, 2000) simply exclude the observations in which the
dependent variable takes a value of zero. A problem with this approach is that those
observations may convey important information for the problem under consideration.
Given the importance of zero observations in our sample, this strategy could lead to a
serious estimation bias. We will follow Eichengreen and Irwin (1995, 1997) who use a
simple transformation to deal with the zeros problem: work with log (1 + trade), instead
of the log of trade. This has the advantage that the coefficients can be interpreted as
elasticities when the values of trade tend to be large, since in this case log (1 + trade) is
approximately equal to log (trade). Another approach has been to use Tobit instead of
OLS. In a subsequent section, we show that our results are robust to the use of alternative
estimation techniques.
3. Empirical Results
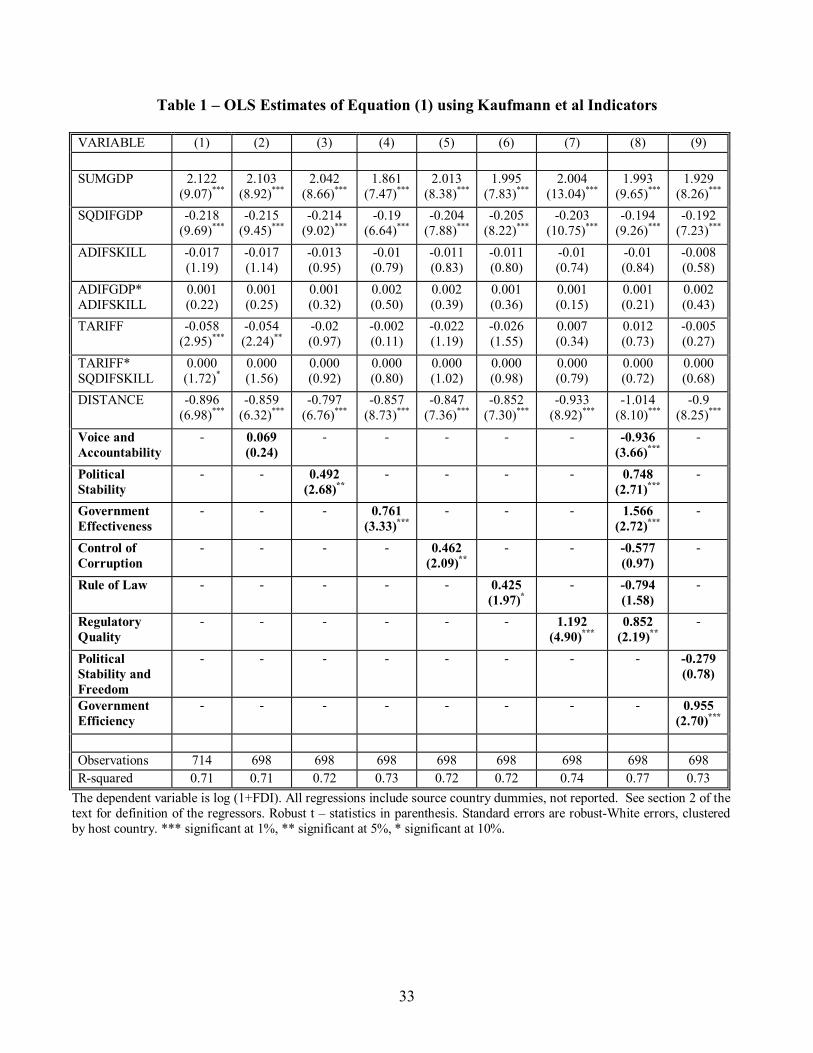
In the first column of Table 1, we present our estimate of equation (1) without including
any institutional indicator. A first interesting point is that the model explains a high
proportion - approximately 71 percentage points - of the total variation in FDI stocks.15
The significant variables are the sum of GDPs, the squared difference of GDPs, and
distance, tariffs in the host country, and - marginally - the interaction between tariffs and
15 While the source country dummies are jointly significant, they do not drive this result, since an estimation of equation (1) without fixed effects explains approximately 61 percent of the variation in the dependent variable, while a regression with only source country dummies as explanatory variables explains 31 percent of the total variation. In addition, the signs, levels of significance, and magnitudes of the estimated coefficients are very similar to those of column 1.

17
the squared absolute difference in factor endowments. The signs of the estimates are
consistent with those obtained by Blonigen et al (2002).
In columns 2 to 7 we introduce the Kaufmann et al (1999a) variables into equation (1).
The estimates show that overall the quality of institutions has a significant and positive
impact on FDI, except for Voice and Accountability whose effect is not significant and
Rule of Law, which has a positive impact, but is significant only at a 10 percent level. The
largest effect seems to be associated to Regulatory Quality where a one standard
deviation increase in this dimension of governance would increase FDI stocks by a factor
of 3.3.16 While initially the magnitude of this effect seems too extreme, it should be kept
in mind that a one standard deviation improvement in the regulatory quality of
government implies a substantial change in the regulatory framework, e.g. from the level
of Thailand to that of Canada or Germany. Slightly lower effects correspond to
Government Effectiveness and Corruption, where a one standard deviation improvement
would imply an increase in FDI stocks by a factor of 2.1 and 1.6 respectively.
Furthermore, Rule of Law and Political Stability and Lack of Violence have a positive
significant impact on FDI. This first evidence indicates that several dimensions of
government institutions clustered in Government Efficiency seem to be especially
relevant in explaining the location of FDI.
There are however at least two possible problems with the preceding regressions. On the
one hand, if various institutional dimensions determine simultaneously the location of
FDI, by including them one by one as before there might be an omitted variable bias, 16 exp(1.192)=3.294.
18
especially severe given the correlation among the different indicators reported in the
previous section. On the other hand, as mentioned previously, the different variables
might be subject to measurement errors. In order to address these problems, we run two
additional regressions, one including the six regressors simultaneously, and the other
clustering all variables into Political Stability and Freedom or Government Efficiency as
previously mentioned.
In column 8, we present the results from including all six variables together. Given the
high correlation among them, there might be important multicollinearity problems, as
indicated by the negative sign of Voice and Accountability or Rule of law. Taking into
account this caveat it is still interesting to point out that the variables Regulatory Quality
and Government Effectiveness seem to the most relevant governance dimensions. In the
last column of Table 1 we estimate equation (1) incorporating the clusters Political
Stability and Freedom and Government Efficiency. A one standard deviation
improvement in Government Efficiency � e.g. from Slovenia to Sweden or Argentina to
Chile - would increase FDI by a factor of 2.6. While the magnitude of the effect seems to
be very large, the previous examples show that it is reasonable. For 1998, the FDI stock
of OECD countries in Slovenia is approximately 0.30 percentage points of its GDP, while
in the case of Sweden it is 0.90 percent. Therefore, an improvement in Slovenia's
institutions to the level of Sweden would yield an FDI stock in Slovenia only slightly
below that of Sweden as a ratio of GDP. Similarly, the ratio of the OECD countries' FDI
stock in 1998 is 0.52 percentage points of GDP for Argentina, while in the case of Chile
it is 1.22. An improvement in Argentina's institutional quality to the level of Chile would
19
therefore lead to an FDI stock to GDP ratio of approximately 1.35 percent, quite similar
to that of Chile. Political stability and freedom has no significant effect on FDI.17
In Table 2, we consider alternatives measures of institutional quality from the ICRG. As
illustrated in columns 1 to 6, at a 10% level the only variable is Risk of Repudiation of
Contracts by the Government. The estimated effect is that an improvement in the Risk of
Repudiation of Contracts by the Government by one standard deviation � e.g. from the
level of Egypt to that of Finland - increases FDI by a factor of 1.4.18 This indicates that
the predictability of policies and the respect for contracts by the government are relevant
aspects of countries� institutions that foreign investors take into account in their location
decisions. Another significant result � given the relevance in the existing literature of
corruption - is that the estimated effect of Corruption in Government is not statistically
different from zero. Similar results hold for Law and Order, Expropriation Risk,
Bureaucratic Quality, and Democratic Accountability.19 In column 7, we present the
estimation including the simple average of the ICRG variables. Again, the resulting
estimate is not significant at conventional levels.
The low overall significance of these variables might be explained by the fact that these
variables are constructed to rank a wider range of countries than those in our sample. For
example, most less developed countries from Africa, the Middle East and North Africa
17 The fact that Political Stability and Freedom is not significant in our regression means that it has no direct effect on FDI. This does not exclude the possibility that it might still have an important indirect effect, for example via the accumulation of human capital. 18 exp(.356)=1.428 19 These results are robust to considering e.g. the average of these variables over 1982 to 1995 as Knack and Keefer (1995).
20
and Asia are not included in the sample.20 Since it is likely that these countries have bad
institutions and actually do not receive important FDI flows from the OECD, our
estimates would be biased against the hypothesis that the quality of institutions affects
FDI location by this sample selection bias. This leads to a low variation in the
institutional variables that does not allow to capture their effects on FDI properly. This
appears to be particularly relevant in the case of Risk of Repudiation of Contracts by the
Government and Risk of Expropriation by the Government. These variables are originally
rated on a scale from 1-10. However, in our sample the lowest ratings are 7 and 8,
respectively.
In the last column, we use the simple average between the aggregate average value of
Corruption in Government, Expropriation Risk, Bureaucratic Quality, Risk of
Repudiation of Contracts by the Government, and Law and Order from the ICRG during
1986-1995 and an indicator of economic openness by Sachs and Warner (1995). Hall and
Jones (1999) construct this variable to measure the social infrastructure understanding as
such the institutions and government policies that determine the relevant environment of
well functioning market economy.21 This variable has a positive and significant effect on
FDI, with a one-standard-deviation improvement in the quality of institutions increasing
FDI by a factor of 2.2.22
20 For example from Sub-Saharan Africa the sample only includes South Africa, which is the country with the relatively highest institutional quality in that region. 21 See Hall and Jones (1999) for more details. 22 This result seems is mainly driven by the Sachs and Warner variable, since regressions that consider the averages of the ICRG variables over the period 1986-1995 yield results that are identical to ours; only Risk of repudiation of contracts is significant at a 10% level.

21
Another problem that may be determining the overall low significance in the case of the
ICRG variables is that the quality of institutions might be endogenous. This problem
might arise because of two distinct causes. First, the presence of foreign investors might
constitute a group of interest that lobbies for better enforcement of property rights, such
that there might be a feedback effect from FDI to the quality of institutions. We will deal
with this problem in the robustness section. In addition, institutional indicators based on
polls of experts might be subject to a "subjectivity" bias. This may occur when the
amount of FDI a country receives affects the rating of a country's institutions made by the
expert. For example, the expert might infer that property rights are efficiently enforced
given that the amount of FDI is very high. Although the ICRG indicators we considered
above are not directly related to the macroeconomic performance of the country selected,
they might still be affected this subjectivity bias. In order to overcome this potential
problem, we use the survey-based variables from the WBES.
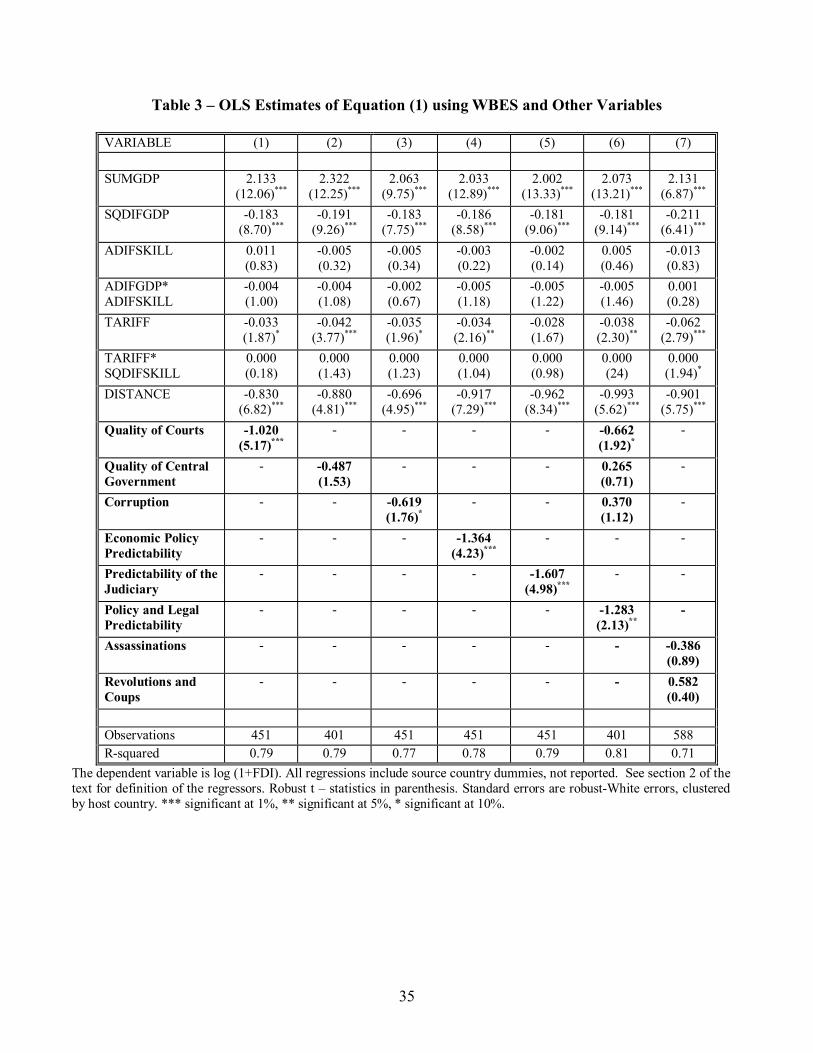
In Table 3, we present the estimates for this set of indicators. The estimates show that the
most relevant institutions seem to be those related to the predictability and stability of
policies and the legal framework. An improvement in the predictability of laws and
regulations in one standard deviation increases FDI by a factor of 2.23 Corruption is only
significant at a 10 percent level, and the Quality of Central Government � a variable
closely related to the red tape and the quality of bureaucracy in general � has no
significant impact on FDI, as we found also for the ICRG data. In addition, the Quality of
the Courts also has a significant impact on FDI. In column 6, we aggregate Economic
Policy Predictability and Predictability of the Judiciary into Policy and Legal 23 Given that the standard deviation of Law Predictability is .42, we have exp(-1.607*(-.42))=1.964.

22
Predictability and estimate equation (1) incorporating all additional variables.24 At a 5
percent level of significance, only the predictability of the rules that determine the
economic and legal environment have a significant impact on FDI, while the quality of
the legal system has a significant impact at a 10 percent level.
In the last column of Table 3, we include the average number of assassinations as well as
the number of revolutions and coups. We do not find a significant direct effect of these
more objective measures of political and social violence.
From the regressions we analyzed in this section, we can conclude the following. First,
the evidence shows that overall the quality of institutions has a significant and
economically important impact on the location of FDI. Second, not all dimensions of the
institutional framework have the same direct importance for foreign investors� investment
decisions. We find that the regulatory framework, the predictability of policies, laws and
regulations, the effectiveness of the government in �getting things done� and the
enforcement of property rights are the most sensitive aspects to foreign investors. This
finding is robust to a large variety of different indicators. Third, the results show no
evidence of a direct effect of civil liberties and the degree of democratic accountability of
FDI. However, as we already pointed out, there could be important indirect effects.
Finally, while several previous papers have focused exclusively on the level of corruption
as a deterrent to FDI, we find that this effect is weaker and less consistent across
24 From the correlations in Table A.3., it seems that in this case multicollinearity seems not to be a great problem among these variables.

23
indicators than the effect of the variables mentioned above. In the next section, we
analyze the robustness of these results.
4. Robustness
The first issue we address in our robustness tests is whether our results are sensitive to the
solution used to deal with the observations with zero FDI. In the first two columns of
Table 4, we present estimates of equation (1) considering simply the log of the bilateral
FDI stock, so that all zero-value observations are dropped, and the estimates considering
the transformation log(1+FDI) but restricting the sample to those observations with
strictly positive FDI stocks. Focusing on the institutional variables, the estimates are
virtually identical in both cases. Government Efficiency continues being significant and
Political Stability and Freedom does not, as in our benchmark case of the last column in
Table 1. In addition, the fact that the point estimate of the effect of both institutional
variables is lower shows that the sample selection bias goes in the assumed direction. If a
country that has bad institutions is less likely to receive positive FDI, the estimates in first
two columns of Table 3 are downward biased.
As we mentioned above, an alternative approach could be the estimation of a TOBIT
model of equation (1). In column 4 of Table 4, we present the estimates considering this
alternative estimation method. The estimated coefficient for Government Efficiency is
similar to that obtained by OLS, although it is slightly higher. However, if we consider
the correction proposed by Greene (1980) of rescaling the OLS estimates to make them

24
comparable to the TOBIT estimates, we would obtain very similar results. This
adjustment would be to divide the OLS estimate by the proportion of non-censored
observations in our estimation, which is 0.72.25 Thus, the estimated coefficient of
Government Efficiency from Table 1 would be 1.328, very similar to the point estimate of
the TOBIT model.26 In addition, as in the OLS case, Political Stability and Freedom has
no significant effect on FDI.
In the next column of Table 4, we estimated a standard gravity model in order to explore
the sensitiveness of our results to the specification of our baseline regression. We include
the GDP and GDP per capita of the host country, a common language dummy, a dummy
that equals unity if the source country was the colonizer of the host country, a common
border dummy, and a dummy for common membership in a Free Trade Area.27 The
estimates show that overall the gravity equation is successful in explaining the variation
in FDI across countries with an R-squared of 0.72.28 Regarding our variables of interest,
the estimates show that a one standard deviation improvement in the degree of efficiency
of the government would increase FDI by a factor of 3.8, which is higher than our
25 502/698=0.719. 26 .955/.719=1.328. 27 The common language, colonial links, and border dummies where constructed using information from the CIA�s World Factbook available at www.cia.gov/cia/publications/factbook/index.html. The Same FTA dummy is taken from Levy Yeyati et al (2003), GDP is 1998 GDP in current dollars while GDP per capita is for 1998 PPP adjusted from the WDI database. 28 It is important to point out that the estimate of GDP per capita of the host country is negative and significant. This reflects multicollinearity problems, due to the high correlation between GDP per capita and the institutional indicators. The correlation coefficients are 0.84 and 0.76 with Government Efficiency and Political Stability and Freedom, respectively.

25
estimate estimates in Table 1.29 As before, the estimated effect of Political Stability and
Freedom on FDI is not significant.
In the previous section, we presented evidence that our results hold over a wide range of
alternative measures of the quality of institutions. However, as we mentioned earlier, it
seems reasonable to consider the possibility that the quality of institutions might be
endogenous for two reasons. First, once foreign investors are located in a country, they
might become a constituency that demands better institutions. Therefore, there could be a
feedback effect on the quality of institutions. Second, the previously mentioned
subjectivity bias, where experts report a better score on the quality of institutions because
they observe a high level of FDI, generates the same econometric problems.
In order to address these possible endogeneity problems, we estimate 2SLS regressions of
equation (1), considering instrumental variables for the institutional quality indicators
that are standard in the literature. La Porta et al (1999) find that the origin of the legal
code is an important and significant determinant of a series of government institutions
and economic outcomes. Chong and Zanforlin (2000) find that countries with law
tradition based on the French Civil code display significantly lower levels of bureaucratic
development and the credibility of the government and higher levels of corruption, while
countries with English Common Law show a higher level of institutional quality. Thus,
we consider a set of dummy variables for Common Law, French Law, German Law and
29 exp(1.325)=3.762. While the quantitative difference with the previous estimates seems larger, we have to keep in mind that in general the precision of all estimates for the institutional variables is relatively low, given that we use robust clustered standard errors to account for the fact that the institutional variables vary only on a host country level. Also, the multicollinearity with GDP per capita might inflate the variance of the relevant estimates.

26
Scandinavian Law as one set of instruments. The simple correlations with Political
Stability and Freedom and Government Efficiency are 0.04, 0.19; -0.45, -0.54; 0.27, 0.19;
0.39, 0.38, respectively. From Hall and Jones (1999) we consider the fraction of the
population that speaks English (ENGFRAC), since it seems natural to assume that the
extent to which this constitutes the mother tongue of a country is positively correlated
with the degree of influence of Western Europe. For this instrument the correlations with
Political Stability and Freedom and Government Efficiency are 0.40 and 0.39,
respectively. In addition, we consider Mauro�s (1995) index of Ethnolinguistic
Fragmentation (FRAG), since ethnic conflict might induce more political violence and,
as Mauro argues, might also imply a higher level of corruption as officials favor members
of their same group. In this case, the correlations with the two institutional variables are -
0.30 and -0.29. Finally, from Acemoglu et al (2001), we consider the mortality rate of
European settlers (SETTLERM). These authors argue that the quality of early institutions
in the former colonies depends critically on the type of settlements that where installed.
In regions with very high mortality rates, colonizers only tried to extract the goods they
were interested in without building any institutional framework, which happened in
colonies with lower degrees of mortality. Since institutions are highly persistent, early
institutions are highly correlated with those observed today. The correlations of the
settlers� mortality (in logs) with our institutional variables are -0.64 and -0.76,
respectively. Although this seems to be the most appealing instrument, its limitation is
that it is only available for a small number of countries.

27
In column 5, we present the instrumental variables estimates using the legal code
dummies and the English-speaking fraction of the population. The results show that the
impact of Government Efficiency is positive and marginally significant, while in the case
of Political Stability and Freedom it is not significant. In column 6, we consider
alternatively the index of Ethnolinguistic Fragmentation and the English-speaking
fraction of the population. The results again show a positive and significant effect of
Government Efficiency and a non-significant effect of Political Stability and Freedom.
Finally, in the last column we present the estimates using the Ethnolinguistic
Fragmentation index and the logs of settlers� mortality. Again, only Government
Efficiency has a significant and positive effect on FDI, at a 10 percent level of
significance.
5. Conclusions
In this paper, we have shown the relevance of the institutional quality as a factor of
attraction of FDI. We find that the quality of institutions has positive effects on FDI. The
impact of institutional variables is statistically significant, and economically very
important. Additionally, not all institutional dimensions have the same importance for the
decision of where to invest. We find that unpredictable policies, excessive regulatory
burden, deficient enforcement of property rights and lack of commitment on the part of
the government seem to play a major role in deterring FDI flows. These results are robust
28
to the use of a wide variety of institutional variables, collected from different sources, and
using different methodologies. Furthermore, they are also robust to different
specifications, and different estimation techniques. Finally, unlike the previous empirical
literature, that has focused its attention nearly exclusively on corruption, we find that
although corruption has a negative impact on FDI, its magnitude and significance
depends on the specific indicator used to measure this institutional dimension.
29
References Acemoglu, D., S. Johnson and J.A. Robinson, 2001. �The Colonial Origins of Comparative Development: An Empirical Investigation�. American Economic Review, Vol. 91, 1369-1401. Aizmann, J. and M. Spiegel, 2002. �Institutional Efficiency, Monitoring Costs, and the Share of FDI�. NBER Working Paper 9324. Albuquerque, R., 2003. �The Composition of International Capital Flows: Risk Sharing Through Foreign Direct Investment�. Journal of International Economics, Vol. 61, 2:353-383. Barro, R., 1991. �Economic Growth in a Cross-section of Countries�. Quarterly Journal of Economics (May), Vol. 106, 2: 407-443. Blonigen, B.A., R.B. Davies and K. Head, 2002. �Estimating the Knowledge-Capital Model of the Multinational Enterprise: Comment�. NBER Working Paper 8929. Carr, D.L., J.R. Markusen and K.E. Maskus, 2001. �Estimating the Knowledge-Capital Model of the Multinational Enterprise�. American Economic Review, Vol. 87, 4 (September): 520-544. Chong, A. and L. Zanforlin, 2000. �Law Tradition and the Quality of Institutions: Some Empirical Evidence�. Journal of International Development, Vol. 12, 1057-1068. Eichengreen, B. and D. Irwin, 1995. �Trade Blocks, Currency Blocs and the Reorientation of Trade in the 1930s�. Journal of International Economics 38, no. 1-2 (February): 1-24. Eichengreen, B and D. Irwin. 1997. �The Role of History in Bilateral Trade Flows�, in The Regionalization of the World Economy, J. Frankel (ed.), University of Chicago Press, Chicago. Frankel, J. with E. Stein, and S. Wei. 1997. Regional Trading Blocs in the World Economic System. Institute for International Economics, Washington, DC Greene, W.H., 1980. �On the Asymptotic Bias of the Ordinary Least Squares Estimator of the Tobit Model.� Econometrica, Vol. 48: 505-14. Hall, R.E. and C.I. Jones, 1999. �Why Do Some Countries Produce So Much More Output Per Worker Than Others?�. Quarterly Journal of Economics (February), Vol. 114, 1: 83-116.
30
Hausmann, R. and E. Fernandez-Arias, 2000. �Foreign Direct Investment: Good Cholesterol?� Inter-American Development Bank, Research Department Working Paper 417, Washington D.C. Helpman, E., 1984. �A Simple Theory of Trade with Multinational Corporations�. Journal of Political Economy, Vol. 92: 451-71. ---------- and P. Krugman, 1985. Market Structure and International Trade. Cambridge, United States: MIT Press. Horstmann, I. and J.R. Markusen, 1987. �Strategic Investments and the Development of Multinationals." International Economic Review (February), Vol. 28, 1: 109-121 ---------- and J.R. Markusen, 1992. �Endogenous Market Structures in International Trade." Journal of International Economics (February), Vol. 32, 1-2: 109-129 Kaufmann, D., A. Kraay, and P. Zoido-Lobatón, 1999a. �Governance Matters.� World Bank Policy Research Working Paper 2196. Washington DC. ----------, A. Kraay, and P. Zoido-Lobatón, 1999b. �Aggregating Governance Indicators.� Policy Research Working Paper 2195. Washington DC Knack, S. and P. Keefer. 1995. �Institutions and Economic Performance: Cross-Country Tests Using Alternative Institutional Measures�. Economics and Politics 7, No. 3: p. 207-28. Krueger, A.O., 1993. �Virtuous and Vicious Circles in Economic Development�. Papers and Proceedings of the American Economic Association (1993), 351-56. La Porta, R., F. Lopez de Silvanes, A. Shleifer and R.W. Vishny, 1998. �Law and Finance�. Journal of Political Economy (December), Vol. 106, 6: 1113-55. ----------, F. Lopez de Silvanes, A. Shleifer and R.W. Vishny, 1999. �The Quality of Government�. Journal of Law, Economics and Organization (April). ----------, F. Lopez de Silvanes, A. Shleifer and R.W. Vishny, 2000. �Investor Protection: Origins, Consequences, and Reform�. Journal of Financial Economics (October) Levy Yeyati, E., E. Stein and C. Daude, 2003. �Regional Integration and the Location of FDI�. Inter-American Development Bank, Research Department Working Paper 492, Washington D.C. Markusen, J.R., 1997. �Trade versus Investment Liberalization�. NBER Working Paper 6231. ----------, 2001. Multinationals and the Theory of International Trade, Cambridge: MIT Press.
31
Mauro, P., 1995. �Corruption and Growth�. Quarterly Journal of Economics (August), Vol. 110, 3: 681-712. Mody, A., A. Razin and E. Sadka, 2003. �The Role of Information in Driving FDI Flows: Host-Country Transparency and Source-Country Specialization�. NBER Working Paper 9962. Rose, A., 2000. �One market, one money: the effect of common currencies on trade� Economic Policy, Vol. 14, 30: 7 � 46. Sachs, J.D. and A. Warner, 1995. �Economic Reform and the Process of Global Integration�. Brookings Papers on Economic Activity, 1: 1-118. Shleifer, A. and R.W. Vishny, 1993. �Corruption�. Quarterly Journal of Economics, Vol. 109, 599-617. Stein, E. and C. Daude, 2002. �Institutions, Integration and the Location of FDI�, in New Horizonts of Foreign Direct Investment, OECD Global Forum on International Investment, OECD, Paris. Wei, S., 1997. �Why is Corruption so Much More Taxing than Tax? Arbitrariness Kills�. NBER Working Paper 6255. ----------, 2000. �How taxing is corruption to international investors?� Review of Economics and Statistics, Vol. 0, 1:1-11. Wheeler, D. and A. Mody, 1992. �International Investment Location Decisions�. Journal of International Economics 33: 57-76
32
PhilippinesSwitzerlandIndonesia
Thailand
Japan
DenmarkSlov ak Republic
Poland
Singapore
Romania
IndiaIndia
Sweden
New Zealand
ColombiaFinland
India
Bulgaria
New Zealand
Greece Norway
PhilippinesFinland
Iran IslandSouth Af ricaKorea
Norway
Iran
Panama
Czech Republic
ThailandBulgaria
Israel
ColombiaMexicoPortugal
IndonesiaSlov ak Republic
Mexico
Czech Republic
Malay sia
Denmark
ChileChile
Turkey
Chile
Venezuela
Norway
MexicoVenezuela
Korea IslandAustriaSouth Af rica
Colombia
Japan
TurkeyUkraine
Iran
Greece
Australia
Sweden
Canada
India
Singapore
Thailand
Hungary
Iran
New Zealand
Switzerland
South Af rica
DenmarkIndonesia
TurkeySlov ak RepublicSlov ak Republic
Austria
Netherlands
Malay sia
China
India
SpainBulgaria
IsraelSwitzerland
Chile
Czech Republic
Germany
CanadaUkraine
Chile
Indonesia
BulgariaBulgaria
Slov eniaSouth Af rica
New Zealand
Thailand
New Zealand
UkraineSlov ak Republic
Denmark
Germany
Chile
Ukraine
Argentina
Island
Slov enia
New Zealand
Egy pt
Argentina
Slov enia MoroccoKorea
Malay sia
Japan
Portugal
Venezuela
Hungary
South Af ricaItaly
Turkey
Venezuela
Portugal
Japan
Australia
South Af ricaKorea
Philippines
Malay sia
Poland
Ireland
VenezuelaArgentina
Iran
MoroccoFrance
China
Japan
Venezuela
Greece
Hungary
South Af rica
Panama Chile
Italy
Poland
FinlandAustralia
United Kingdom
Slov ak Republic
Chile
United States
SpainMorocco
Hungary
Malay sia
Bulgaria
Australia
Chile
Egy ptPhilippines
Slov ak RepublicRomania
United States
New Zealand
Ukraine
Singapore
Thailand
Morocco
Japan
Argentina
RomaniaMexico
SpainIsrael Morocco
Thailand
FranceIndia
China
IsraelBrazil
MoroccoCanada
Italy
BrazilRomania
Sweden
South Af rica
ChileIreland
Thailand
IndiaSlov ak Republic
RomaniaColombia
Slov eniaBrazil Indonesia
Malay sia
Mexico
SingaporeSingapore
Brazil Switzerland
Hungary
Canada
United StatesKorea
Spain
Sweden
Norway
Mexico
New Zealand
United Kingdom
Ukraine
ThailandPoland
Ukraine
Italy
Egy pt
China
SpainRomaniaColombia
IndonesiaFrance
Malay sia
Australia
South Af rica Austria
Portugal
Algeria
Hungary
Morocco
Venezuela
Singapore
Egy pt
Germany
Egy ptBrazilPhilippines
KoreaIsrael India
Czech Republic
Italy
GreeceSouth Af rica
China
Netherlands
China
Malay sia
Slov enia
Malay sia
CanadaFranceAustria
Philippines
IndiaKorea
Ireland
Singapore
Australia
Austria
Mexico
Spain
United Kingdom
Japan
Romania Portugal
VenezuelaVenezuela
DenmarkEgy pt
Poland
Chile
Indonesia
Poland
FinlandDenmark
JapanItaly
Denmark
Czech Republic
IndiaIndia
Italy
ThailandVenezuela Thailand
Denmark
Germany
CanadaSlov ak Republic
Austria
Finland
Slov enia Norway
Colombia PolandPortugal
China
Chile
Romania
Czech Republic
Colombia
Korea
CanadaPhilippines
SwedenIreland
South Af rica
Finland
TurkeyKoreaGreece
Sweden
Japan
Canada
ChinaNew Zealand
Malay sia
Korea
IndonesiaIndonesia
Ireland
Japan
Australia
South Af rica
Chile
Netherlands
Greece Norway
Malay sia
FrancePortugal
Mexico Poland
Italy
ColombiaThailand
Portugal
Turkey
United Kingdom
Netherlands
PhilippinesMexico Poland
Hungary
Argentina
Ireland
Netherlands
Singapore
India
ChinaHungary
Canada
Thailand
Finland
AustriaGreeceSlov ak Republic
Singapore
Finland
Poland
Switzerland
Turkey
France
Philippines
Norway
Sweden
SpainMoroccoIndia
China
Austria
Finland
China
Turkey
Malay sia
CanadaFrance Indonesia
Mexico
Norway
Portugal
TurkeyGreece
Germany
Switzerland
Poland
Norway India
Czech Republic
Austria
New Zealand
Thailand
NorwayFrance
Czech Republic
GreeceUnited States
Czech Republic
Indonesia
Hungary
Indonesia
Mexico PhilippinesPortugalSpain
Austria
Japan
Hungary
Canada
Hungary
Argentina
Germany
United KingdomArgentina
India
FinlandPortugalUnited Kingdom
Korea
Argentina
Switzerland
Ireland
Portugal
Japan
South Af rica
Brazil
PolandMexico
Czech Republic
Chile
Argentina
Sweden
Egy pt
Singapore
Italy
Mexico Poland
Singapore
Australia
Costa RicaNetherlands
Japan
Argentina
SwitzerlandDenmark
Austria
Singapore
Australia
Singapore
Spain
South Af rica
PhilippinesAustraliaAustralia
Sweden
FranceBrazil Denmark
Germany
Brazil
Colombia
GermanyJapan
Ireland
Canada
New Zealand
Argentina
South Af rica
DenmarkBrazilIsrael
Sweden
JapanGermany
Netherlands
United States
Australia
Sweden
PortugalFrance
Sweden
Mexico
Brazil
Chile
Algeria
United Kingdom
Spain
Malay sia
China
Colombia
Australia
Austria
DenmarkPhilippines
China
Canada
Ireland
United States
Brazil Denmark
Korea
Canada
Singapore
Italy
Netherlands
Malay sia
CanadaFrance
Germany
Denmark
NorwayCanada
Poland
NetherlandsCzech Republic
Sweden
New Zealand
Thailand
Sweden
Italy
Brazil
Japan
Brazil
United States
Hungary
Italy
Malay sia
Spain
Ireland
ThailandVenezuela
GermanyUnited States
New Zealand
Switzerland
China
Ireland
Norway
United Kingdom
Finland
Korea
Brazil
Singapore
SpainBrazil SpainIndonesia SwitzerlandAustraliaCanada
Germany
Chile
Italy
Netherlands
Singapore
France
Sweden
Spain
United Kingdom
Ireland
SwitzerlandSpainIndonesia
United Kingdom
NetherlandsNetherlands
Argentina
Germany
Ireland
France
GermanyAustria
Spain
Italy
SwitzerlandSwitzerland
GermanyItaly Germany
Australia
United States
United Kingdom
France Switzerland
United States
Singapore
China
France
Ireland
United KingdomUnited Kingdom
France
United KingdomUnited Kingdom
Panama
Netherlands
United Kingdom
Netherlands
Mexico
United States
Netherlands
United Kingdom
AustraliaBrazil Switzerland
Japan
United StatesFrance
GermanyUnited StatesUnited StatesUnited States
NetherlandsNetherlands
United States
Canada
United States
United Kingdom
United States
Denmark
Hungary
South Af ricaIran
Venezuela
IslandKorea
Venezuela
Panama
Switzerland
Algeria
MoroccoEgy pt
Island
NorwaySlov enia India
Singapore
Panama
South Af rica
Romania
New Zealand
Romania
New Zealand
SpainPhilippines
Costa Rica
Morocco
Venezuela
Panama
Portugal
PanamaIrelandPanama
Thailand
IndonesiaSlov ak Republic
Czech Republic
Slov ak Republic
PhilippinesDenmarkBulgaria
Egy pt
Island
Netherlands
Philippines
GreeceIsland
MoroccoMoroccoIsrael
Thailand
ChinaHungary
Romania
Algeria
China
Slov enia
Malay sia
Slov ak Republic Slov enia
Thailand
Slov enia
Poland
KoreaSlov ak Republic Slov enia
Bulgaria
Greece
Argentina Bulgaria
Iran Italy
Chile
Korea
Romania Egy ptSpain
Turkey
Sweden
Austria
Romania
Israel
RomaniaColombia
SpainMorocco
Bulgaria Poland
Ireland
Romania
Turkey
Poland
Ukraine
Argentina
Germany
ThailandBulgaria
Egy ptSlov ak Republic
AlgeriaTurkey
Czech Republic
IndonesiaGreeceGreeceGreece Norway
Turkey
Sweden
Costa Rica
GreeceSlov enia
Island
Slov enia
Colombia
Ireland
Colombia
Algeria
Slov ak Republic
Malay sia
South Af ricaIsland
Egy pt
MexicoMexico
Hungary
MoroccoBrazil
Slov enia
Philippines
Costa Rica
Island
MoroccoIsrael Morocco
Panama
Mexico
NorwaySlov enia
Bulgaria
Israel
BulgariaRomania
Panama
Thailand
Egy pt
China
Portugal
Iran
Brazil
Panama
Czech Republic
Ukraine
Romania Egy ptAustralia
Ukraine
ItalyTurkey
Czech Republic
ItalyAlgeriaKorea
Italy
Ukraine
Venezuela
Algeria
IsraelIsraelTurkeyIsrael
Singapore
Costa Rica
Philippines
IsraelIsrael
Finland
TurkeyIslandIsland
Czech Republic
ColombiaColombiaArgentina
Island
Netherlands
Iran
Czech Republic
Morocco
Denmark
Chile
Slov enia
FinlandFinlandColombiaArgentina
PanamaIreland
IndiaAlgeria
Turkey
Ireland
Czech RepublicCzech Republic
Iran
India
Panama
Costa Rica
Malay sia
IranTurkey
Romania
Hungary
Mexico
Panama
Indonesia
Chile
India
Panama
Ukraine
Costa Rica
HungaryNew Zealand
ChilePanama
Iran IslandUkraineSouth Af rica
Iran Island
Romania
Hungary China
Morocco
Venezuela
UkraineSlov ak Republic
Bulgaria
New Zealand
Iran
Hungary
Colombia
CanadaGreece
Malay sia
DenmarkSlov ak Republic
FinlandFinland
Slov enia
FinlandAustralia FinlandSlov ak Republic
VenezuelaCosta Rica
Finland
Turkey
Philippines
Costa Rica
Iran
Portugal
Iran
Egy pt
Czech Republic
Greece
Poland
Norway
Panama
JapanAlgeriaAlgeria
China
Ukraine
JapanAlgeriaAlgeriaAlgeriaAlgeriaAlgeriaAlgeria
Switzerland
Panama
NorwayAustria
Portugal
Panama
NorwayTurkey
PortugalIndonesia
Mexico
IslandAlgeria
Portugal
Costa Rica
Korea
Singapore
Costa Rica
Iran
Ireland
Ukraine
Bulgaria Poland
Ukraine
Costa RicaCosta Rica
Egy pt
Malay sia
Egy ptIsrael
Romania
Costa Rica
PhilippinesBrazil
Island
Morocco
Denmark
Panama
Austria
Colombia
Costa Rica
Brazil
New Zealand
Slov eniaEgy pt
Colombia PolandArgentina Bulgaria
Ukraine India
Switzerland
Greece
Switzerland
United Kingdom
Algeria
Venezuela
Greece
Venezuela
Indonesia
Germany
Indonesia
Sweden
Iran
Sweden
NorwaySouth Af rica
Israel
Costa Rica
United States
Egy ptSlov eniaFrance
Bulgaria
Hungary
Israel
Bulgaria
Israel Austria
Bulgaria
AustriaSlov ak Republic
Iran
Egy pt
Venezuela
GreeceIsland
Philippines
MoroccoAustria
New Zealand
Algeria IslandUkraine
Argentina
Costa Rica
ArgentinaArgentina
Costa Rica
Australia
Bulgaria
IranKorea
Slov eniaFrance
Costa Rica
Colombia
IsraelUkraine
Costa Rica
-.02
0.0
2.0
4.0
6.0
8FD
I/GDP
(res
idua
ls a
fter c
ontro
lling
for G
DP
per
cap
ita)
-1 -.5 0 .5 1Government Eff iciency (residuals after controlling for GDP per capita)
Figure 1 - Partial Correlation between Average FDI Inflows 1990-99 as a Ratio of GDP and Government Efficiency, controlling by GDP per capita in 1998
33
Table 1 � OLS Estimates of Equation (1) using Kaufmann et al Indicators
VARIABLE (1) (2) (3) (4) (5) (6) (7) (8) (9) SUMGDP 2.122
(9.07)*** 2.103
(8.92)*** 2.042
(8.66)*** 1.861
(7.47)*** 2.013
(8.38)*** 1.995
(7.83)*** 2.004
(13.04)*** 1.993
(9.65)*** 1.929
(8.26)***
SQDIFGDP -0.218 (9.69)***
-0.215 (9.45)***
-0.214 (9.02)***
-0.19 (6.64)***
-0.204 (7.88)***
-0.205 (8.22)***
-0.203 (10.75)***
-0.194 (9.26)***
-0.192 (7.23)***
ADIFSKILL -0.017 (1.19)
-0.017 (1.14)
-0.013 (0.95)
-0.01 (0.79)
-0.011 (0.83)
-0.011 (0.80)
-0.01 (0.74)
-0.01 (0.84)
-0.008 (0.58)
ADIFGDP* ADIFSKILL
0.001 (0.22)
0.001 (0.25)
0.001 (0.32)
0.002 (0.50)
0.002 (0.39)
0.001 (0.36)
0.001 (0.15)
0.001 (0.21)
0.002 (0.43)
TARIFF -0.058 (2.95)***
-0.054 (2.24)**
-0.02 (0.97)
-0.002 (0.11)
-0.022 (1.19)
-0.026 (1.55)
0.007 (0.34)
0.012 (0.73)
-0.005 (0.27)
TARIFF* SQDIFSKILL
0.000 (1.72)*
0.000 (1.56)
0.000 (0.92)
0.000 (0.80)
0.000 (1.02)
0.000 (0.98)
0.000 (0.79)
0.000 (0.72)
0.000 (0.68)
DISTANCE -0.896 (6.98)***
-0.859 (6.32)***
-0.797 (6.76)***
-0.857 (8.73)***
-0.847 (7.36)***
-0.852 (7.30)***
-0.933 (8.92)***
-1.014 (8.10)***
-0.9 (8.25)***
Voice and Accountability
- 0.069 (0.24)
- - - - - -0.936 (3.66)***
-
Political Stability
- - 0.492 (2.68)**
- - - - 0.748 (2.71)***
-
Government Effectiveness
- - - 0.761 (3.33)***
- - - 1.566 (2.72)***
-
Control of Corruption
- - - - 0.462 (2.09)**
- - -0.577 (0.97)
-
Rule of Law - - - - - 0.425 (1.97)*
- -0.794 (1.58)
-
Regulatory Quality
- - - - - - 1.192 (4.90)***
0.852 (2.19)**
-
Political Stability and Freedom
- - - - - - - - -0.279 (0.78)
Government Efficiency
- - - - - - - - 0.955 (2.70)***
Observations 714 698 698 698 698 698 698 698 698 R-squared 0.71 0.71 0.72 0.73 0.72 0.72 0.74 0.77 0.73
The dependent variable is log (1+FDI). All regressions include source country dummies, not reported. See section 2 of the text for definition of the regressors. Robust t � statistics in parenthesis. Standard errors are robust-White errors, clustered by host country. *** significant at 1%, ** significant at 5%, * significant at 10%.

34
Table 2 � OLS Estimates of Equation (1) using ICRG Variables
Variable (1) (2) (3) (4) (5) (6) (7) (8) SUMGDP 2.041
(7.22)*** 2.104
(8.74)*** 1.951
(6.67)*** 2.05
(8.44)*** 2.076
(8.30)*** 2.076
(7.17)*** 2.003
(7.45)*** 1.575
(5.56)*** SQDIFGDP -0.209
(7.76)*** -0.215
(9.01)*** -0.201
(7.02)*** -0.212
(8.45)*** -0.213
(8.55)*** -0.213
(8.04)*** -0.208
(7.80)*** -0.143
(5.54)*** ADIFSKILL -0.017
(1.20) -0.017 (1.16)
-0.015 (1.08)
-0.017 (1.19)
-0.017 (1.23)
-0.016 (1.16)
-0.016 (1.10)
-0.005 (0.36)
ADIFGDP* ADIFSKILL
0.002 (0.42)
0.001 (0.29)
0.003 (0.62)
0.002 (0.50)
0.002 (0.40)
0.002 (0.38)
0.002 (0.57)
-0.001 (0.30)
TARIFF -0.057 (2.85)***
-0.060 (2.58)**
-0.039 (2.29)**
-0.045 (2.31)**
-0.058 (2.59)**
-0.056 (3.00)***
-0.045 (2.36)**
-0.012 (0.60)
TARIFF* SQDIFSKILL
0.000 (1.71)*
0.000 (1.70)*
0.000 (1.44)
0.000 (1.47)
0.000 (1.70)*
0.000 (1.71)*
0.000 (1.45)
0.000 (0.75)
DISTANCE -0.903 (6.87)***
-0.910 (6.83)***
-0.914 (7.25)***
-0.851 (6.07)***
-0.902 (6.83)***
-0.902 (6.53)***
-0.875 (6.49)***
-0.897 (6.96)***
Expropriation Risk
0.138 (0.59)
- - - - - - -
Corruption - -0.026 (0.12)
- - - - - -
Risk of Repudiation
- - 0.356 (1.93)*
- - - - -
Law and Order - - - 0.213 (1.29)
- - - -
Democratic Accountability
- - - - 0.065 (0.25)
- - -
Bureaucratic Quality
- - - - - 0.047 (0.19)
- -
Average ICRG variables
- - - - - - 0.277 (1.09)
-
Social Infrastructure
- - - - - - - 3.27 (3.14)***
Observations 698 698 698 698 698 698 698 636 R-squared 0.71 0.71 0.72 0.71 0.71 0.71 0.71 0.72
The dependent variable is log (1+FDI). All regressions include source country dummies, not reported. See section 2 of the text for definition of the regressors. Social Infrastructure is from Hall and Jones (1999). Robust t � statistics in parenthesis. Standard errors are robust-White errors, clustered by host country. *** significant at 1%, ** significant at 5%, * significant at 10%.
35
Table 3 � OLS Estimates of Equation (1) using WBES and Other Variables
VARIABLE (1) (2) (3) (4) (5) (6) (7) SUMGDP 2.133
(12.06)*** 2.322
(12.25)*** 2.063
(9.75)*** 2.033
(12.89)*** 2.002
(13.33)*** 2.073
(13.21)*** 2.131
(6.87)*** SQDIFGDP -0.183
(8.70)*** -0.191
(9.26)*** -0.183
(7.75)*** -0.186
(8.58)*** -0.181
(9.06)*** -0.181
(9.14)*** -0.211
(6.41)*** ADIFSKILL 0.011
(0.83) -0.005 (0.32)
-0.005 (0.34)
-0.003 (0.22)
-0.002 (0.14)
0.005 (0.46)
-0.013 (0.83)
ADIFGDP* ADIFSKILL
-0.004 (1.00)
-0.004 (1.08)
-0.002 (0.67)
-0.005 (1.18)
-0.005 (1.22)
-0.005 (1.46)
0.001 (0.28)
TARIFF -0.033 (1.87)*
-0.042 (3.77)***
-0.035 (1.96)*
-0.034 (2.16)**
-0.028 (1.67)
-0.038 (2.30)**
-0.062 (2.79)***
TARIFF* SQDIFSKILL
0.000 (0.18)
0.000 (1.43)
0.000 (1.23)
0.000 (1.04)
0.000 (0.98)
0.000 (24)
0.000 (1.94)*
DISTANCE -0.830 (6.82)***
-0.880 (4.81)***
-0.696 (4.95)***
-0.917 (7.29)***
-0.962 (8.34)***
-0.993 (5.62)***
-0.901 (5.75)***
Quality of Courts -1.020 (5.17)***
- - - - -0.662 (1.92)*
-
Quality of Central Government
- -0.487 (1.53)
- - - 0.265 (0.71)
-
Corruption - - -0.619 (1.76)*
- - 0.370 (1.12)
-
Economic Policy Predictability
- - - -1.364 (4.23)***
- - -
Predictability of the Judiciary
- - - - -1.607 (4.98)***
- -
Policy and Legal Predictability
- - - - - -1.283 (2.13)**
-
Assassinations - - - - - - -0.386 (0.89)
Revolutions and Coups
- - - - - - 0.582 (0.40)
Observations 451 401 451 451 451 401 588 R-squared 0.79 0.79 0.77 0.78 0.79 0.81 0.71
The dependent variable is log (1+FDI). All regressions include source country dummies, not reported. See section 2 of the text for definition of the regressors. Robust t � statistics in parenthesis. Standard errors are robust-White errors, clustered by host country. *** significant at 1%, ** significant at 5%, * significant at 10%.

36
Table 4 � Robustness Tests (1) (2) (3) (4) (5) (6) (7) OLS OLS TOBIT OLS 2SLS 2SLS 2SLS Dependent Variable
LN(FDI) LN(FDI+1) If FDI > 0
LN(FDI+1) LN(FDI+1) LN(FDI+1) LN(FDI+1) LN(FDI+1)
SUMGDP 1.376 (5.26)***
1.310 (5.19)***
2.457 (8.99)***
- 1.981 (6.83)***
1.689 (3.84)***
2.349 (8.11)***
SQDIFGDP -0.147 (5.25)***
-0.148 (5.98)***
-0.196 (5.69)***
- -0.157 (4.83)***
-0.122 (3.01)***
-0.158 (4.04)***
ADIFSKILL -0.027 (2.04)**
-0.029 (2.45)**
0.015 (0.85)
- -0.002 (0.09)
0.016 (0.74)
0.020 (0.94)
ADIFGDP* ADIFSKILL
0.009 (1.73)*
0.009 (1.96)*
-0.005 (1.02)
- 0.005 (0.84)
0.006 (0.83)
-0.004 (0.52)
TARIFF -0.026 (1.58)
-0.019 (1.32)
0.022 (0.94)
- 0.003 (0.11)
0.136 (1.71)*
-0.047 (1.28)
TARIFF* SQDIFSKILL
0.000 (2.00)*
0.000 (1.72)*
0.000 (0.17)
- 0.000 (0.88)
0.000 (0.71)
0.000 (1.19)
DISTANCE -0.838 (6.89)***
-0.782 (7.01)***
-1.109 (7.25)***
-0.721 (5.88)***
-1.034 (5.06)***
-0.776 (3.00)***
-0.524 (0.90)
HOST GDP (log)
- - - 1.107 (12.00)***
- - -
HOST GDP PER CAPITA (log)
- - - -1.015 (2.25)**
- - -
COMMON LANGUAGE
- - - 1.500 (3.55)***
- - -
COLONIAL LINKS
- - - 0.792 (1.92)*
- - -
ADJACENCY - - - 0.421 (0.89)
- - -
SAMEFTA - - - 0.169 (0.56)
- - -
Political Stability and freedom
-0.585 (2.15)**
-0.556 (2.13)**
-0.555 (1.10)
-0.058 (0.21)
-1.878 (1.51)
-1.775 (1.28)
-2.110 (1.54)
Government Efficiency
0.902 (3.12)***
0.854 (3.19)***
1.534 (3.60)***
1.325 (3.45)***
2.529 (1.98)*
4.420 (3.04)***
2.440 (1.82)*
Instruments - - - - ENGFRAC
Legal Code Dummies
ENGFRAC FRAG
FRAG SETTLERM
Observations 502 502 698 926 557 559 283 R-squared 0.74 0.75 - 0.72 - - - All regressions include source country dummies, not reported. See section 2 of the text for definition of the regressors. See sections 2 and 4 of the text for definition of the regressors and instruments. Robust t � statistics in parenthesis. Standard errors are robust-White errors, clustered by host country. *** significant at 1%, ** significant at 5%, * significant at 10%.
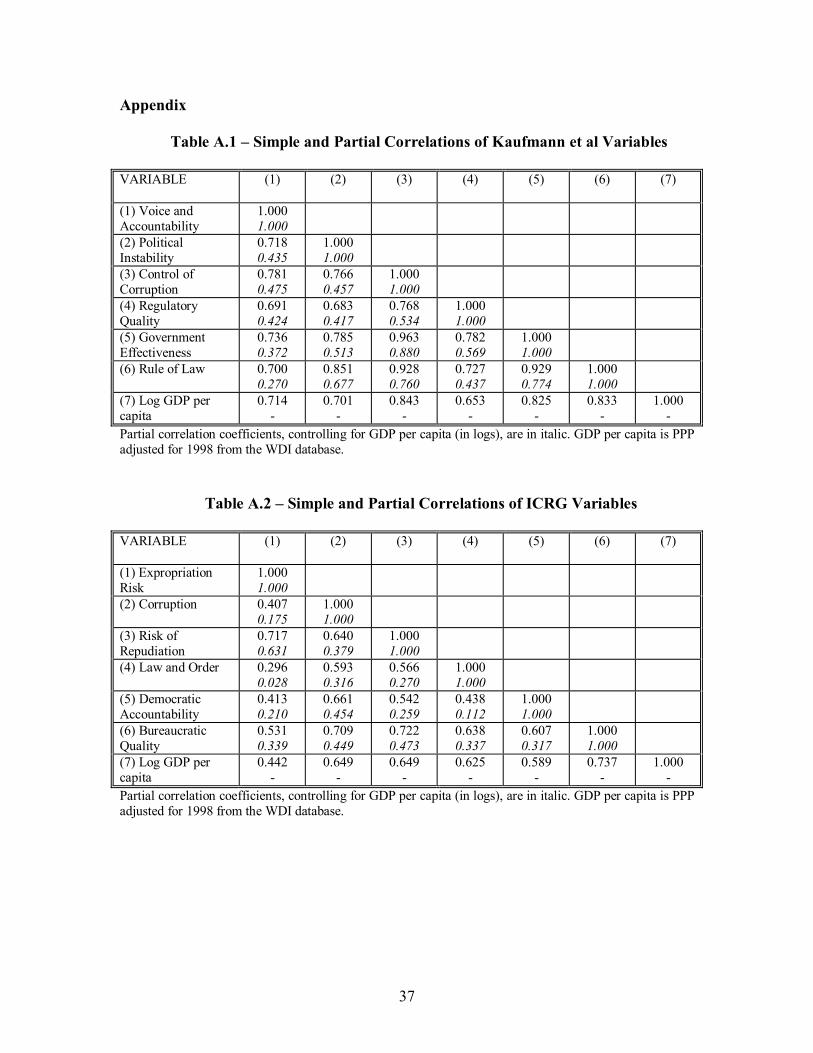
37
Appendix
Table A.1 � Simple and Partial Correlations of Kaufmann et al Variables
VARIABLE (1) (2) (3) (4) (5) (6) (7)
(1) Voice and Accountability
1.000 1.000
(2) Political Instability
0.718 0.435
1.000 1.000
(3) Control of Corruption
0.781 0.475
0.766 0.457
1.000 1.000
(4) Regulatory Quality
0.691 0.424
0.683 0.417
0.768 0.534
1.000 1.000
(5) Government Effectiveness
0.736 0.372
0.785 0.513
0.963 0.880
0.782 0.569
1.000 1.000
(6) Rule of Law
0.700 0.270
0.851 0.677
0.928 0.760
0.727 0.437
0.929 0.774
1.000 1.000
(7) Log GDP per capita
0.714 -
0.701 -
0.843 -
0.653 -
0.825 -
0.833 -
1.000 -
Partial correlation coefficients, controlling for GDP per capita (in logs), are in italic. GDP per capita is PPP adjusted for 1998 from the WDI database.
Table A.2 � Simple and Partial Correlations of ICRG Variables
VARIABLE (1) (2) (3) (4) (5) (6) (7)
(1) Expropriation Risk
1.000 1.000
(2) Corruption 0.407 0.175
1.000 1.000
(3) Risk of Repudiation
0.717 0.631
0.640 0.379
1.000 1.000
(4) Law and Order 0.296 0.028
0.593 0.316
0.566 0.270
1.000 1.000
(5) Democratic Accountability
0.413 0.210
0.661 0.454
0.542 0.259
0.438 0.112
1.000 1.000
(6) Bureaucratic Quality
0.531 0.339
0.709 0.449
0.722 0.473
0.638 0.337
0.607 0.317
1.000 1.000
(7) Log GDP per capita
0.442 -
0.649 -
0.649 -
0.625 -
0.589 -
0.737 -
1.000 -
Partial correlation coefficients, controlling for GDP per capita (in logs), are in italic. GDP per capita is PPP adjusted for 1998 from the WDI database.
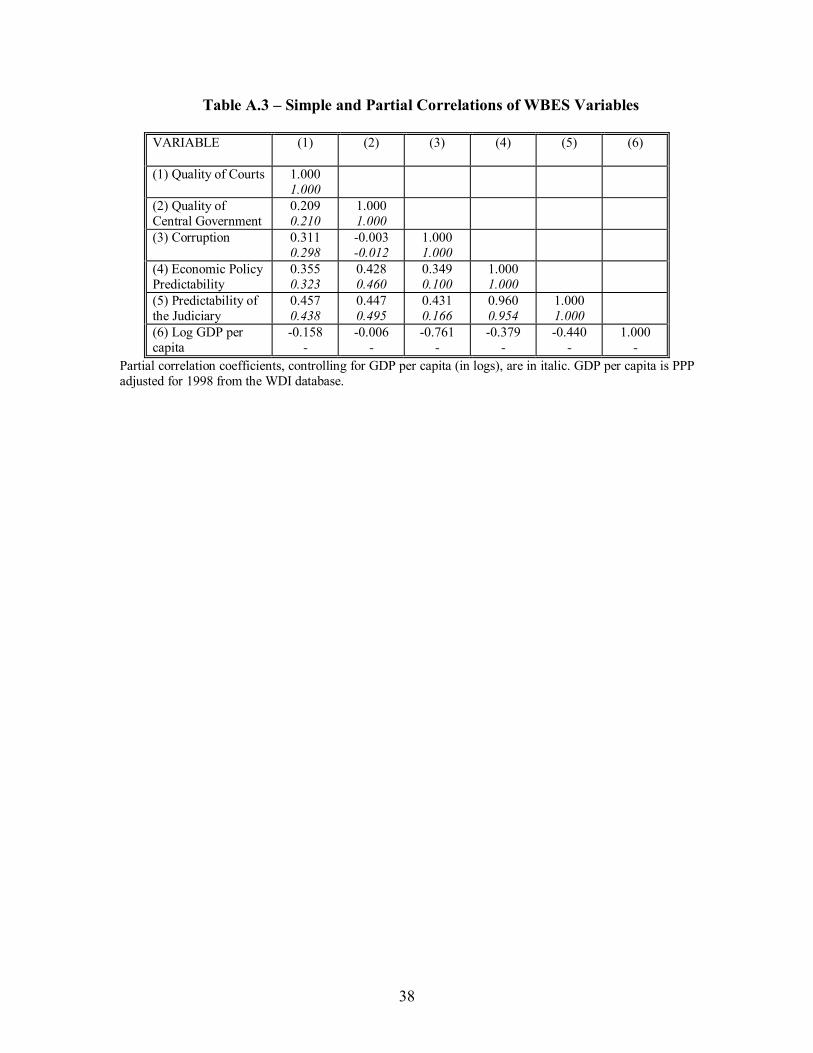
38
Table A.3 � Simple and Partial Correlations of WBES Variables
VARIABLE (1) (2) (3) (4) (5) (6)
(1) Quality of Courts 1.000 1.000
(2) Quality of Central Government
0.209 0.210
1.000 1.000
(3) Corruption 0.311 0.298
-0.003 -0.012
1.000 1.000
(4) Economic Policy Predictability
0.355 0.323
0.428 0.460
0.349 0.100
1.000 1.000
(5) Predictability of the Judiciary
0.457 0.438
0.447 0.495
0.431 0.166
0.960 0.954
1.000 1.000
(6) Log GDP per capita
-0.158 -
-0.006 -
-0.761 -
-0.379 -
-0.440 -
1.000 -
Partial correlation coefficients, controlling for GDP per capita (in logs), are in italic. GDP per capita is PPP adjusted for 1998 from the WDI database.