Embed Size (px)
Citation preview

The Psychology of Communication: Does the Ethical Perception of Downward Openness Affect Employee Morale? A Case Study of Monroe County, Georgia
School System’s Transportation Department
A Dissertation submitted to the Graduate School
Valdosta State University
in partial fulfillment of requirements for the degree of
DOCTOR OF PUBLIC ADMINISTRATION
in Public Administration
in the Department of Political Science of the College of Arts and Sciences
July 2016
Thomas D. Courson
M.B.A., Georgia College and State University, 2010 B.S., Macon State College, 2008 A.S., Macon State College, 2006

© Copyright 2016 Thomas D. Courson
All Rights Reserved


ABSTRACT
This study explores the emotional implications of superior to subordinate communication
on public sector employees by researching whether an employee’s ethical perception of
downward openness affects his or her morale. The topic of ideology as an instrument of change
provides a historical context of how behavior can be conformed to the philosophy of a strong
leader. This is truly important in public sector organizations, where the accomplishment of good
governance is often dependent upon the efficiencies gained through effective management of
employee behavior.
In attainment of this goal, successful public sector management necessitates a
fundamental understanding of what drives employee behavior. In this vein, Constructivism seeks
to understand why humans are irrational beings, with Behavioralism advancing this theory by
establishing a practical solution for evaluating the irrational tendencies of human behavior.
Furthermore, Motivation theory seeks to provide additional applicability by theoretically linking
intrinsic stimuli with human behavior. Where Motivation theory aids the understanding of the
force that guide and maintain goal-oriented behaviors, Ethical theory offers a basis for the moral
solutions individuals apply to the difficult situations they encounter in life.
Considering these schools of thought and prior research linking low morale within
organizational settings to low employee performance, this study examines whether or not public
sector organizations concerned with good governance should equally be concerned with
effectively managing employee morale. Data collected and analyses conducted for this study
explores this relationship. Subsequent findings and conclusions reached emphasize employee
perception as an operational mechanism of organizational success.

TABLE OF CONTENTS
Chapter I: INTRODUCTION .............................................................................................6
Chapter II: LITERATURE REVIEW .................................................................................6
Ideology as an Instrument of Change ........................................................................... 6
Motivation Theory ........................................................................................................ 6
Ethical Theory ............................................................................................................... 6
Defining and Measuring Morale ................................................................................... 6
Factors that Influence Morale ....................................................................................... 6
Communication ............................................................................................................. 6
Chapter III: METHODOLOGY ..........................................................................................6
Description of the Sample ............................................................................................. 6
Data Collection ............................................................................................................. 6
Statistical Methodology ................................................................................................ 6
Chapter IV: RESULTS .......................................................................................................6
Analyses Leading to Prediction .................................................................................... 6
Additional Analyses to Evaluate the Strength of Prediction ........................................ 6
Analyses of Internal Consistency of Response Data .................................................... 6
Analyses of Inquiries .................................................................................................... 6
Summary ....................................................................................................................... 6
Chapter V: DISCUSSION ..................................................................................................6
Overview ....................................................................................................................... 6
Limitations .................................................................................................................... 6
Framing the Data........................................................................................................... 6

The Relationship between the Ethical Perception of Downward Openness and Morale7
Communication Content and Style as Sub-variables of Downward Openness ............ 7
The Relationship between Communication Content and Style and the Sub-variables of
Morale ........................................................................................................................... 7
Quality of Relationship and the Inquiries into Content and Style ................................ 7
Quality of Communication and the Inquiries into Content and Style ........................... 7
Job Satisfaction and the Inquiries into Content and Style ............................................ 7
Willingness to Move and the Inquiries into Content and Style .................................... 7
Identification with the Group and the Inquiries into Content and Style ....................... 7
Broader Implications ..................................................................................................... 7
Conclusion .................................................................................................................... 7
BIBLIOGRAPHY ................................................................................................................7
APPENDIX A: Survey .......................................................................................................7
APPENDIX B: Institutional Review Board (IRB) Protocol Exemption Report ................7
LIST OF FIGURES
Figure 1. Perception of Downward Openness and Morale ..................................................8
Figure 2. Sub-variables of Perception of Downward Openness and Morale .......................8
Figure 3. Sub-variables of Perception of Downward Openness and Quality of Relationship as
Sub-variable of Morale ........................................................................................8
Figure 4. Sub-variables of Perception of Downward Openness with Quality of Communication
as Sub-variable of Morale ...................................................................................8
Figure 5. Sub-variables of Perception of Downward Openness with Job Satisfaction as Sub-
variable of Morale ...............................................................................................8
Figure 6. Sub-variables of Perception of Downward Openness with Willingness to Move as Sub-
variable of Morale ...............................................................................................8
Figure 7. Sub-variables of Perception of Downward Openness with Identification with Group as
Sub-variable of Morale ........................................................................................8

LIST OF TABLES
Table 1. Race Demographic Data, 2014 ..............................................................................9
Table 2. Educational Demographic Data, 25 Years and Older, 2014 ..................................9
Table 3. Baird and Bradley’s Intercorrelations Among the Investigated Variables ............9
Table 4. Responses Spreadsheet ..........................................................................................9
Table 5. Descriptive Statistics: Perception of Downward Openness and Morale ..............9
Table 6. Correlation Analysis: Perception of Downward Openness and Morale ...............9
Table 7. Hypothesis Based Test ...........................................................................................9
Table 8. Descriptive Statistics: Sub-variables of Perception of Downward Openness ......9
Table 9. Correlation Analysis: Sub-variables of Perception of Downward Openness and Morale
.............................................................................................................................9
Table 10. Std. Regression Analysis: Sub-variables of Perception of Downward Openness with
Morale as DV ......................................................................................................9
Table 11. VIF: Sub-variables of Perception of Downward Openness ................................9
Table 12. Descriptive Statistics: Sub-variables of Morale ..................................................9
Table 13. Std. Correlation Analysis: Sub-variables of Perception of Downward Openness and
Sub-variables of Morale ......................................................................................9
Table 14. Std. Regression Analysis: Sub-variables of Perception of Downward Openness with
Quality of Relationship as DV ............................................................................9
Table 15. Std. Regression Analysis: Sub-variables of Perception of Downward Openness with
Quality of Communication as DV .......................................................................9
Table 16. Std. Regression Analysis: Sub-variables of Perception of Downward Openness with
Job Satisfaction as DV ........................................................................................9
Table 17. Std. Regression Analysis: Sub-variables of Perception of Downward Openness with
Willingness to Move as DV ..............................................................................10
Table 18. Std. Regression Analysis: Sub-variables of Perception of Downward Openness with
Identification with Group as DV .......................................................................10
Table 19. VIF: Sub-variables of Morale ...........................................................................10
Table 20. Cronbach’s α Evaluation Criteria ......................................................................10
Table 21. Cronbach’s α Results .........................................................................................10
Table 22. Regression Analysis: Content Questions with Quality of Relationship as DV 10
Table 23. Regression Analysis: Style Questions with Quality of Relationship as DV.....10
Table 24. Regression Analysis: Content Questions with Quality of Communication as DV
...........................................................................................................................10
Table 25. Regression Analysis: Style Questions with Quality of Communication as DV10
Table 26. Regression Analysis: Content Questions with Job Satisfaction as DV ............10
Table 27. Regression Analysis: Style Questions with Job Satisfaction as DV .................10
Table 28. Regression Analysis: Content Inquiries with Willingness to Move as DV ......10
Table 29. Regression Analysis: Style Inquiries with Willingness to Move as DV ..........10
Table 30. Regression Analysis: Content Inquiries with Identification with the Group as DV
...........................................................................................................................10
Table 31. Regression Analysis: Style Inquiries with Identification with the Group as DV
...........................................................................................................................10

ACKNOWLEDGEMENTS
The following dissertation would not be possible without the leadership, knowledge, dedication, generosity, encouragement, friendship, and support from the following individuals:
My committee members: Dr. Christine A. James (Chair), Dr. Luke Fowler, and Dr.
Jeremy Bauer, who graciously guided me through this process, I truly appreciate your leadership, expertise, and dedication to the success of this project.
The DPA faculty and staff, who through their instruction meticulously prepared me for success in this program, I am forever thankful for your devotion to higher learning.
My fellow Cohorts, thank you for sharing your experiences, wisdom, and time. I am grateful to have had you alongside of me during this journey.
The Monroe County Transportation Department, thank you for welcoming me into your organization by supporting this dissertation as its case for study.
Dad, who so often offered words of wisdom and encouragement, you truly were inspirational.
Marcia Justice, who devoted so many hours kindly editing my drafts, I cannot put into words just how much your help has meant to me and to the success of this project.
James Tyson, who has been my sounding board throughout my entire academic journey, your support, encouragement, and friendship were invaluable.
My family and friends, who cheered me on throughout this process, thank you for all of
your support.

DEDICATION
I dedicate this dissertation to the following:
My wife, Cindy. You are my hero, my moral compass, the foundation of my strength, and truly my better half.
My children, Kaleigh, Josh, and Morgan, who gave up so much in support of their daddy, you are my motivation. I love you more than words can express.
To God, who again proved in Him anything is possible.
Chapter I
INTRODUCTION
Today, the American economy operates as a hybrid of free-market and social economic
systems. Certainly, there is value to this approach. In the same way that the American economic
system bedrocks on capitalist principles to drive private industry, it also relies on public
administration as a foundation of knowledge that addresses shared issues between both the
private and public sector, which the free-market economy often overlooks. The private sector
refers to all American organizations and/or goods and services that exist outside of direct
ownership of the United States government ownership. Private industries by definition are profit
driven with the primary determinant of success being the ability to maximize revenue while
minimizing organizational cost. Revenue in this context refers to the amount of income a firm
generates while cost denotes the expenditures an organization incurs during its operations. In
general, businesses that effectively manage this balance to keep revenue high and cost low are
successful, while those that cannot sustain this balance are destined to fail. Within this setting,
efficiencies leading to a competitive advantage (i.e., the attribute one company has over its
competitors) serve as a mechanism for success.
In contrast to the private sector, public sector organizations are not profit driven. They
exist for the common good of American society, providing Americans with safeguards such as
national defense, homeland security, law enforcement, and firefighting. Furthermore, these civil
establishments are necessary for collecting taxes and
managing social programs. Indeed, public sector organizations are essential for maintaining
America’s industry, infrastructure, and security. Yet unlike the private sector of American
industry, determining the drivers of success in public settings is not a simple task. It is a highly
complex endeavor primarily because there is not an easy way or clear-cut way to measure how
much of a public service benefit a single individual receives. For example, the individual whose
home is saved from destruction by a local fire department has benefitted from that public service.
However, it is difficult to determine if this benefit is greater than the one enjoyed by the neighbor
who works for the fire department, or the individual down the street who receives an insurance
break due to the close proximity of the fire station. Therein lies the problem. There is no truly
objective way to delineate how much of a public service any single individual receives in
relation to the other members of his or her community as a whole. Because of the reality of this
restriction, success in public sector organizations must focus on good governance as its primary
driver.
In order to deliver good governance in the public sector, both governing bodies
and individuals working for entities must act in the public interest at all times,
consistent with the requirements of legislation and government policies, avoiding
self-interest and, if necessary, act against a perceived organizational interest.
Acting in the public interest implies a wider benefit to society, which should
result in positive outcomes for service users and other stakeholders. (ifac.org
2013, 13)
From this perspective, good governance requires good management. In essence, by directing
human resources toward the attainment of public sector goals and objectives, public sector
managers play a direct role in shaping organizational success. Along these lines, effective
management places emphasis on the importance of creating and maintaining an environment that
facilitates a productive workforce.

Traditionally, organizational scholars accomplished this feat by focusing on efficiency.
The idea was to accomplish efficiency through group task specialization and establishment of a
hierarchy of authority with a limited span of control. However, in his Proverbs of
Administration, Herbert A. Simon (1946) suggests an alternate approach. Simon believes that
attaining efficiency is possible by optimizing coordination among interdependent activities.
According to Simon, organizations should establish functional areas that are independent enough
to ensure specialization. In so doing, Simon believes the institution could create a real
comparative advantage, thereby, collectively enabling synergistic operations. Simon also
proposes that effective organizations involve “diffused power” and an organizational culture
where the employee identifies with and is motivated toward achieving the organization’s goals.
Building upon Simon’s theory, James Buchanan and Gordon Tullock (1962) offer an
economic and mathematical perspective to public administration. Their Public Choice theory
seeks to provide a more efficient way to manage the organization. It views the individual as
rational and assumes that when people do not behave rationally it is because they lack sufficient
information. Thus, if the organization provides the worker with accurate information it can create
a measurable environment. In effect, Public Choice theory champions the notion that
organizational openness facilitates predictable and quantifiable patterns of conduct. These
behaviors are useful to forecast future behavior among the different functional areas. Definitely,
this theory offers an enormous advantage for the organization. Not only can it generate data to
measure operational efficiency, but it can also create processes that enable cost optimization by
facilitating effective, efficient, and/or achievable performance within a resource-constrained
environment.

Although thought provoking, the Public Choice theory’s emphasis on the individual as a
rational being limits its usefulness. It is a proven fact that human biases can and do affect
otherwise objective research. Individuals see the world through their own individual “lens of
truth.” This subjective view of reality, coupled with the fact that people are by nature emotional
beings, establishes that the individual is an irrational being. Based on this fact, any theory
established on the belief that a person’s behavior will universally follow a predictable pattern is
flawed. Yet, by discussing the importance of employee behavior and the significance of ensuring
openness, the Public Choice theory does offer some excellent insight into the factors that
influence organizational efficiency.
Within the framework of this understanding, this project strives to gain a better
understanding of ethical communication within the public sector. By examining the perception of
openness in communication and the varying factors that influence employee morale this research
will seek to expand on the idea of behavioral economics. Behavioral economics within this
setting is the “conviction that increasing the realism of the psychological underpinnings of
economic analysis will improve the field of economics on its own terms – generating theoretical
insights, making better predictions of field phenomena and suggesting better policy” (Camerer
and Loewenstein 2004, 3). In this way, behavioral economics seeks to join and “adapt the basic
principles of neoclassical economics with the realities imposed by ... complex human nature”
(Diacon 2013, 29). Certainly, neoclassical economics contrasts with the inherent value and
distribution theories of classical economics advanced by Adam Smith, David Ricardo, Thomas
Robert Malthus, John Stuart Mill, and Karl Marx; instead, its focus on human behavior as an
economic driver bridges the gap between classical and contemporary economic theories. Taking
this concept a step further, behavioral economics accentuates the criticality of managing the

human psychological, social, cognitive, and emotional factors, which lead to irrational behaviors
that can be costly to organizations. It is within this framework that behavioral economics, as an
evolution of the Public Choice theory, serves as a mechanism of good governance.
This study is important because of its emphasis on good governance though optimal
superior to subordinate communication. This is especially relevant today where a fragile
economy has forced many public organizations to direct some tough adjustments in the name of
good governance. The Monroe County, Georgia, School System Transportation Department,
hereafter referred to as Monroe County Transportation Department, is one of those organizations.
The Monroe County Transportation Department has reduced staff, endorsed competitive bidding
for its acquisitions, initiated lean operations, and levied hiring restrictions on redundant
positions. Surely, these actions represent a legitimate response to an uncertain fiscal climate.
Still, the Monroe County Transportation Department must be cognizant of how it discloses these
changes to its workforce.
Research has shown that openness in communication affects “an employee’s relationship
with management ... [specifically] the image of management and the company in the employee's
mind” (Baehr and Renck 1958, 169). More specifically, studies have shown that “overly
disclosive communication may be harmful to organizations ...” (Eisenberg and Witten 1987,
421). In similar fashion, poor superior to subordinate communication has been found to affect
negatively employee morale and thus workplace satisfaction. Certainly, this focus on research
emphasizes the importance of maintaining effective communication. Moreover, it highlights the
power human perception has on production. Since studies have shown that unhappiness leads to
low performance, it is clear that the any public organization interested in enhancing good
governance should be concerned with how it communicates with its employees.

The purpose of this study is to gain a better understanding of the psychology of
communication within the public sector and its effect on employee morale. Within this context, it
is important to recognize that psychology refers only to the manner an individual ethically
encodes a message. By linking ethical perception with the psychology of communication, this
study offers a very limited view of a broadly defined term. In so doing, this essay will highlight
the evolution of administration, up to the onset of the behavioral science movement in order to
provide a framework for analysis. Next, this study will examine relevant philosophical
approaches such as motivation theory, ethical theory, defining and measuring morale, and the
factors influencing employee morale. The emphasis on these models is to assess the innate
aspects of human motivation, how they drive irrational behavior, and in what way that behavior
shapes organizations. Next, this essay will shift to the topics of communication and superior to
subordinate openness to emphasize how messages from managers to employees can influence
employee perception. In short, the review of literature establishes cognition as an irrational
human trait that influences behavior. Furthermore, it seeks to characterize openness in
communication as a legitimate driver of ethical perception. Within this background, the
relationship between the ethical perception of downward openness and morale will be quantified.
Providing good governance is the primary business of government organizations. Thus
when choosing an organization for this study, emphases will be placed on several criteria aimed
at creating good governance. First, key demographics will be evaluated to determine if the target
fits the geographical makeup of the broader public sector. Second, the organization will be
assessed to ensure it meets the definition of a public sector business; meaning it must be owned,
operated, and funded by a government at the Federal, State, and/or the Local level. Third, the
organization will be required to be guided by specific rules and regulations aimed at

achieving/maintaining good governance. Next, the functional areas within the organization will
be evaluated to verify they fit a cross section of the public sector; therefore, when data is
collected it can be reasonably associated with the types of work that takes place in the public
sector. Lastly, all employees will be accountable to the requirements listed in the first three
criteria and must also as a part of their normal job duties be required to communicate regularly
with their direct report supervisor.
This project will be accomplished as a case study focusing on employees within the
Monroe County Transportation Department. This organization was selected for this study
because it was determined to meet all of the stated requirements of a public sector organization.
Research data will be collected via a 25-question survey (see Appendix A). The survey will
focus on downward openness in communication and employee morale. For this study, downward
openness is defined as the information provided to employees by their direct-report supervisor.
The survey will be administered at the Monroe County Transportation Department via printed
survey (on standard 8 1/2 x 11 white copy paper). The survey will be provided to each potential
respondent privately, in an office setting where he or she will be able to complete the survey
without interference or coercion. Completed surveys will be place in a locked container.
Respondents will be able to either participate or not participate without any consequences for
non-participation.
Survey questions will be quantified using a 5-point Likert scale, with most questions
being asked in a positive connotation. For these questions with a positive undertone, an answer
corresponding to 1 point will be extrapolated as a completely negative response, while a
response resulting in 5 points will be reasoned as a completely positive response. In this manner,
lower scores will equate to a lower perception of downward openness in communication and a

lower employee morale, while higher scores will equate to a higher perception of downward
openness in communication and a higher employee morale. Inevitably, some questions will have
a negative inference. Within this scenario, the Likert scale will be inversely adjusted to match the
survey’s positive undertone. In so doing, the survey will offer a useful mechanism for providing
legitimate data to evaluate whether the targeted civil servants’ ethical perception of downward
openness in communication affects their morale. Demographic information will not be collected
for this study; however, census data current at the time of this project will be discussed to
provide some demographical context for analyses. This project will use descriptive statistics, line
charts, and correlation analyses to frame the data leading to a test of the hypothesis. In addition
to these initial tests, regression analyses, variance inflation factor testing (VIF) for
multicollinearity, and Cronbach’s alpha (α) will be conducted to evaluate the strength of the
prediction and the internal consistency of the response data.
Descriptive statistics will be used to evaluate whether the dataset is representative of the
surveyed population. Line charts will be used to identify whether morale appears to increase or
decrease linearly with a higher or lower ethical view of downward openness. Correlation
analyses will be used to evaluate the strength of the relationship between the variables. A
hypothesis-based test will be performed to confirm or reject the inferred relationship between the
ethical perception of downward openness and morale. Regression analysis will be performed for
the purposes of modeling, exploring relationships, and predicting. Because of the varying inter-
associations among the variables that can weaken the conclusions, a VIF analysis will be
performed to test for multicollinearity. Cronbach’s α will also be conducted as an additional
measure of reliability.

Considering the studies that link low morale to decreased performance and higher
organizational costs, it is reasonable to conclude that public sector leaders concerned with good
governance through cost optimization would want to know the relationship between their
employees’ ethical perception of downward openness in communication and morale. The next
sections of this study include a review of relevant literature, a description of methodology, an
analysis of data, a discussion of the findings, and recommendations on how these findings can be
used in future research.
The literature review section (Chapter 2) concentrates on four areas: ideology as an
instrument of change, the evolution of behavioral theories, the relationship between perception
and communication, and an overview of why perception matters in superior to subordinate
openness. Ideology as an instrument of change highlights the evolution of administration. In so
doing, it shows how prominent figures throughout history shaped society, in what way the onset
of new thought changed organizations, and in what manner that transformation forced the
necessity to understand human behavior. Next, prominent theories in motivation, ethics, and
morale are examined. These principles provide a conduit of understanding, from which managers
can better match organizational strategies with cognitive elements to facilitate conforming
behaviors in the workplace. Finally, the focus is narrowed to the topics of communication and
superior to subordinate openness. Here, the complexities of communication are outlined and
related to perception. Within this setting, the importance of superior to subordinate openness is
established.
The methodology section (Chapter 3) offers a tool for both the analysis and the data. In
essence, it discusses the hypothesis, the method of data collection, how that data is framed and
controlled, and the quantitative models to be used. By framing the data in this way, the
methodology facilitates further analysis to determine whether a relationship exists between the
targeted public sector employees’ ethical perception of downward openness and their morale.
The results section (Chapter 4) examines how well the data confirms the hypothesis.
Specifically, the Results section will frame the data obtained from the 25-question survey and
delineate the findings. In so doing, it will quantify the linkage between the ethical perception of
downward openness and morale.
The discussion section (Chapter 5) interprets the results. It provides a context for future
strategies and analysis by comparing and contrasting the findings back to the key pieces of
literature outlined in Chapter 2. In this way, the last chapter of this study flows from its
predecessors for the purposes of understanding and expanding the psychology of
communication. Within this framework of understanding, some suggestions for future research
will be offered.
It is expected that inducements could serve as legitimate counterarguments to the topic of
ideology as an instrument of shaping behavior. Surely, public policies aimed at incentivizing
conduct as a means of conformity offer a prime example of this claim. According to author and
political scholar Mark E. Rushefsky, “inducements encourage the targets of a public policy to do
something or not do something without issuing rules requiring that behavior” (Rushefsky 2013,
145). Within this framework, inducement strategies can serve as a means for both positive and
negative reinforcement. Rushefsky uses the earned income tax credit as an example of
inducements used to encourage behavior and policies capping the number of dependents used for
welfare as a negative inducement. Indeed, from this vantage point, inducement appears to be a
legitimate alternative to ideology as a mechanism for shaping change.
Demotivation offers another interesting alternative to ideology. As with motivation, many
elements of demotivation can be credited with influencing human activity. Among these are fear,
loneliness, burn out, too much oversight, and unchallenging goals. Certainly, these demotivation
elements can be linked with decreased worker productivity and higher organizational costs. In
this manner, demotivation could similarly serve as appropriate substitute to ideology.
Chapter II
LITERATURE REVIEW
The review of the available literature regarding this study centers around four areas of
interest. First, ideology as an instrument of change provides a historical outline from which the
behavioral science movement evolved. Second, prominent behavioral theories further the
emphasis by focusing on managing human cognition in the workplace. Third, the validation that
perception influences worker behavior is tied to communication. Finally, the topic of superior to
subordinate openness is tapered to frame the question, “does the ethical perception of downward
openness affect employee morale?”
Ideology as an Instrument of Change
Throughout recorded history, human beings have shaped their organizational
environments. Sun Tzu’s Art of War not only played an influential role in the development of
Asian culture, but it also provided a transformational roadmap from which contemporary
leadership has evolvedi. Ancient Greek scholars like Socrates and Plato paved the way for
Aristotle to question the universe and man’s place within it. From Ancient Greece to the fall of
the Roman Empire, medieval scholars focused on the absolutist component of natural law (i.e.,
the assertion universal or natural law

determined a person’s morality). In this vein, God was deemed the ultimate authority on this
goodness. Thusly, for a person to attain virtue he or she must only live in accordance with God’s
willii. Consequently, individualism and philosophical thought were replaced by religious
conformity. With few exceptions, this organizational paradigm was prevalent until around the
17th century.
Around that timeframe, “rationalism developed and science seemed to contradict the
basic tenants of the church” (Baradat 2012, 5). Subsequently, revolution fueled by scholars like
Marquis de Condorcetiii who advanced the idea that there is no limit to the potential of humanity,
helped usher in the Age of Enlightenment. Immanuel Kant, an 18th century German philosopher
and author, described this awakening as,
Man’s release from his self-incurred tutelage. Tutelage is man's inability to make
use of his understanding without direction from another. Self-incurred is this
tutelage when its cause lies not in lack of reason but in lack of resolution and
courage to use it without direction from another. (Kant 1995, 1)
With the emergence of science and empirical thought as a means of understanding the universe
and man’s place within it, came the concept of western individualism and the need for self-
government. This shift enabled Age of Enlightenment scholars like Thomas Hobbesiv and John
Lockev to establish some of the first contemporary views of politics and government structure.
American founding fathers like Jeffersonvi and Madisonvii used many of Hobbes and Locke’s
social contract principles as the basis for their development of the Declaration of Independence
and the U.S. Constitution, respectively. Through these types of ideological contributions, this
movement led to a rapid transformation of the human condition, which helped fuel the industrial
revolution.

Industrial development expedited the arrival of mechanization, leading to workers
transitioning from rural farming communities to urban industrial societies. Around this time,
Adam Smith developed his capitalist doctrines.
These economic principlesviii provided a roadmap for creating significant wealth.
Following Smith’s path, business owners pushed to increase profits. Certainly, this led to varying
strategies, one of which focused on scholarly direction as a mechanism for management. This
route empowered Henri Fayolix to develop his principles of management. Later, Woodrow
Wilson followed with his essay The Science of Administration. His promotion of a government
organization that existed separate from the elected branches of government, with a later
contribution from Frank J. Goodnowx, did much to establish the contemporary field of public
administration. Although, there was (and still is) an ongoing debate over the evolution of the
field, its chief importance to this study rests with the rationale for its conception.
Wilson’s politics/administration dichotomy was initially delineated as a means to
improve the functionality of government. Nearly half a century later organizational scholars
began to advance Wilson’s concept by researching mechanisms for success. Frederick Taylor’s,
The Principles of Scientific Management (1911), for example, focused on increasing production.
Unquestionably, his emphasis on time and motion studies was successful in this arena. However,
due to the impassive nature of early
business methodologies, moral functions such as worker safety were not a primary area of
concern. This lack of emphasis led to inhumane working conditions and ultimately recurring
industrial injuries and fatalities. In spite of sacrificing people for processes in the name of profit,
many early businesses still failed. With only a handful of companies (people) controlling the
financial resources, the division between the lower and upper classes grew significantly. This
biased distribution of wealth further stifled any willingness to view people as more that
expendable assets. Eventually, this way of thinking would change. Yet, in America’s highly
competitive profit-driven capitalist society of the early 1900s, this change would not come
easily. In fact, real progress focusing on workers as pliable and important human resources
needed a great depression and the ideological footings of two world wars as catalysts for change.
The social stress created by rapid economic growth, “together with the economic and
political turmoil at the end of World War I, caused the collapse of capitalism and the rejection of
democracy” (Baradat 2012, 237). Although this Great Depression is credited as one of the worst
crises to occur in the western industrialized world, one need not look beyond the sociopolitical
origins of the Second World War to see the impact individual ideologies have had on
organizations. To provide some context for this analysis, the implications of ideology will first
be examined.
The view of ideology and the way it is defined depends upon the scholar and, depending
on whom you believe, the period from which it came. For example, French intellectual Antoine
Louis Claude Destutt de Tracy defined ideology as a study of experiential wisdom gained from
experience. This notion is important as it suggests thought creation is a physical formation rather
than a spiritual one. Moreover, Destutt de Tracy felt the word “ideology” had a positive
connotation, in that it could help improve social and political conditions. Karl Marx and
Friedrich Engels had a vastly different concept of the term. To them the concept was more
subjective. They felt ideology was a means in which a ruling group could advance their own
selfish ideas, essentially justifying their leadership through biased endorsing of their political
beliefs. Karl Mannheim agreed with Marx’s subjective view. Yet, he took the concept a step
further by suggesting that ideology was not valid by itself. Instead, he suggested current

ideologies must be correlated with their historical counterparts before they can be understood.
Some scholars such as Frederick Watkins and David Ingersoll view ideology as a broad, yet
occasionally sadistic, idea fueled by the hope of achieving an optimistic future. The common
theme among these descriptions is the notion that ideology is a powerful resource. One need not
look beyond Mussolini’s Fascist and Hitler’s Nazi ideologies to see the power powerful ideology
can have on shaping organizations.
Weakened both politically and militarily, Italy was in desperate need of a unifying voice,
one that Benito Mussolini was more than eager to provide. Although Mussolini was a socialist,
his philosophy offered a contrasting outlook on social equality. Indeed, he “rejected
egalitarianism as far as leadership was concerned … [believing instead] that great historical
events were set in motion by the initiative and leadership of a small number of people” (Baradat
2012, 241). Having suffered defeat in the elections of 1914 and 1919, Mussolini “focused his
appeal on the right-wing … wealthy classes, hoping that he could increase his strength through
ample funding rather than by appealing to the unresponsive lower classes” (Baradat 2012, 241).
This new approach enabled Mussolini to “persuade” his rival politicians. Yet in 1921, Mussolini
once again fell short. However, this time he openly protested the electoral. Furthermore, he
claimed, “Only force could put a true leader into power” (Baradat 2012, 242). Inspired by this
ideology, many fascist supporters followed Mussolini toward implementation of his radical
government.
Similar to Italy, Germany also faced economic and political hardships because of World
War I. The Treaty of Versailles created a win-lose relationship, with Germany on the latter end
of this arrangement. Not only was the war-torn country forced to surrender large amounts of its
territories to the Allied Forces, but it was also left to pay them unrealistic reparations. As a result,
Germany’s unemployment rates and consequently its inflation rates skyrocketed. These
conditions made it very difficult for the Weimar Republic (the existing government) to manage
the country’s social, economic, and political problems. As these conditions progressed, the
German people lost faith in their government, leaving them exposed to radical ideology.
Absolutely, this left the door open for Adolf Hitler’s tyranny.
Adolf Hitler, having had a tumultuous youth, unfairly focused his anger on the Jews who
he saw as arrogant and exclusive. After joining the German army in 1914, and being seriously
wounded, Hitler’s popularity among his peers grew. This led to him becoming the leader of the
seven-member National Socialist German Workers Party, more commonly known as the Nazi
Party. In 1923, with increased power and influence and having seen Mussolini’s success, Hitler
attempted to seize the Munich government. Although he was unsuccessful, Hitler turned this
defeat into his advantage. While in prison, “he wrote Mein Kampf (My Struggle), setting forth
the basic principles of the Nazi … ideology” (Baradat 2012, 244). After being released, less than
a year later, Hitler started a strategy to gain power. Instead of using force, which had proved
unsuccessful, he instead began to play on the German public’s discontent for its post war
conditions. Hitler blamed the Jewish and communist community for the country’s dire situation.
Backed by this belief, he created a gang of thugs, called the Storm Troopers, whose purpose was
to create a more “agreeable” climate for the Nazi ideology. As Hitler’s popularity grew, so too
did his party’s financial resources. Postured by wealthy industrialists, the Nazi party increased its
role in Parliament; however, it failed to gain a majority of the 608 seats. In 1933 with the Nazi
Party’s Parliamentary gains and the violence created by Hitler’s militia, the conservative
majority convinced President Paul von Hindenburg to appoint Hitler the head of the German
government. As chancellor, Hitler used his power to advance his hatred of the Jews and

communists. With the majority of the German public embracing his Nazi ideology, Hitler won a
significant majority of the Parliament. After which, he quickly consolidated power and outlawed
opposing political affiliations. When President Paul von Hindenburg died later that year, Hitler
became Fuhrer (Germany’s totalitarian leader of the Third Reich).
Undoubtedly, the examples of Mussolini and Hitler’s rise to prominence followed very
similar approaches. Each path was made possible by the deplorable state of affairs each country
was left to endure. The conditions were so harsh that citizens were quick to accept any ideology
that promised to lessen the burden, even those of these brutal oppressors. The point here is that
ideologies can be a powerful instrument for the way people rationalize their actions. Moreover,
the examples provided show that under the right conditions people can be motivated to behave in
a particular way. This type of realization is essential for the advancement of behavioral science.
By focusing on understanding how people learn and what motivates their behavior, behavioral
scientists have been able to establish workers as legitimate competitive resources.
In this vein, behavioral scientists have stated that constructivism as a model for learning,
“suggests that the individual mind is active exclusively in the meaning-making activity” (Lee
2012, 405). Therefore, constructivists see the world through their own individual “lens of truth.”
Similarly, for these people “truth, or meaning, comes into existence in and out of [their]
engagement with the realities in [their] world” (Lee 2012, 408). This subjective view of reality
coupled with the fact that people are by nature emotional beings, lends itself to the belief that an
individual’s behavior does not universally follow a predictable pattern. For this reason, it is
vitally important that organizational leaders create an environment that balances their workers’
emotions with the organization’s goals. It is within this arena, Behavioralism offers a practical
solution.

Behavioralism is a vaguely defined methodology; yet, the theory offers a practical
solution for evaluating irrational human behavior. Behavioralism is distinct with Behaviorism,
which offers an objective and quantifiable approach for predicting group behavior. Moreover, its
focus on the cognitive influences that affect a person’s actions make it a plausible theory for
measuring behavior. Although, the theory claims that the person is irrational, it explains away
their irrationality as an unconscious tool to achieve productivity. Essentially, the theory contends
that organizations can facilitate a more productive worker. However, its failure to consider
rational cognition as a variable limits its viability in this research. As behavioral scholars sought
to understand what factors enhanced performance, they inadvertently validated Behavioralism as
a legitimate theory. One of the more well known of these studies is the Hawthorne Works
experiment.
The Hawthorne study “derives from a series of experiments carried out in the Hawthorne
Works of the Western Electric Company, Chicago, between 1927 and 1933” (Chiesa and Hobbes
2008, 68). The purpose of the experiment was to evaluate how different levels of factory lighting
affected employee performance. The initial results were as expected, when the lighting
intensified so too did the employees output. However, the researchers noticed that employee
outputs were similarly increasing as the lighting was reduced. This finding led the research team
to determine that lighting was not the factor influencing employee performance. Instead, they
revealed that the increased output was directly related to the employees knowing they were being
watched. This discovery was revolutionary in that it furthered the concept of workers as real
organizational resources by certifying cognition played a role in performance. Shortly thereafter,
contemporary social ideologies began to develop in workplace. As the emphasis on finding the
drivers of human performance intensified, businesses began to view workers as more than
mechanical resources. This revelation spilled over into President Woodrow Wilson’s political
administration and fueled the expansion of the behavioral science movement in the public sector.
Along these lines, this development facilitated the necessity to understand organizational
behavior, both as “the actual behavior of individuals and groups in and around purposeful
organizations ... [and as] one of several frameworks or perspectives on what makes an
organization work” (Ott, Parkes, et al. 2008, 1-2). B. F. Skinner, Professor of Psychology at
Harvard University, likened the usefulness of understanding human behavior to the more
established physical technology. According to Skinner, “if governments, religions, and similar
institutions are likely to use behavioral techniques based on laboratory research, then what has
happened in physical technology may show us what is going to happen in behavior” (Murray et
al. 1961, 570). Indeed, Skinner believed behavioral science, as a mechanism for understanding
what shapes cognition, can be used to predict and perhaps even control behavior.
Ideology is a powerful instrument for change. It is historic fact that an ideology adapts
society to the will of its strongest leaders and impacts organizational and group behaviors.
Furthermore, as a mechanism of shaping culture, it is at the heart of any research seeking to
understand how people and behaviors influence public administration. Along these same lines, it
is also critical to gain an importance to gain an understanding of the motivators of cognition, and
how these motivators have led to the emergence of behavioral science, which has significantly
impacted the governance of public organizations. Motivation theory seeks to understand what
guides and maintains goal-oriented behaviors. Scholars like Maslow, Hertzberg, McGregor,
Locke, Carver and Scheier have been instrumental in the development of various aspects of
motivation theory, ultimately proving the link between intrinsic motivation and behavior.
Motivation Theory

Within the area of motivation theory Abraham Maslow broke new ground when he
proposed an alternate and more inclusive approach to B. F. Skinner’s theory. Maslow reasoned
that the debate over what drives human behavior comes down to differing views of science,
of its process and its method, in the light of which the Skinner conception [as
discussed above] is seen as true enough, but too narrow, not inclusive enough.
That is [according to Maslow], he speaks consistently of control as if it were only
an active and interfering force. (Murray et al. 1961, 572)
By observing behavior through a more cognitive lens, Maslow offers a very interesting, yet,
different behavioral science interpretation; one that he initially called, “Taoistic science,” or
“understanding science.” His theory replaces prediction and control with understanding as the
primary driver of behavioral science. Maslow’s proposed “Hierarchy of Needs” followed the
idea that there are stages of growth in humans. The first is physiological. These needs are the
basic animalistic necessities for human survival. Once these fundamental needs are satisfied,
Maslow reasons that safety needs take precedence. After that, the next step in Maslow’s
hierarchy is interpersonal needs. Here, the individual’s motivation will come from the need to be
loved, or belong. The fourth step toward the top of Maslow’s pyramid is esteem. During this
phase, human behavior will be motivated by the need to be accepted and valued. The final phase
is self-actualization. During this stage, individual needs are based on reaching one’s full
potential. Although Maslow’s distinction between the predictive science and “understanding
science” did much to stimulate thought, its failure to consider cultural factors limited its
empirical usefulness in determining organizational behavior.
In the 1960s, Douglas McGregor, using Maslow’s idea that motivation comes from a
hierarchy of higher needs, offered his own model. His “Theory X and Theory Y” sought to

explain how to manage individuals within this intrinsic constraint. McGregor’s Theory X
maintained that individuals are by nature lazy and thusly they do not enjoy their jobs. Therefore,
any useful management approach must be authoritarian by nature. Authoritarian managers
provide close oversight, usually within a controlled setting in order to ensure performance.
Theory Y, in contrast, suggests that the problem does not lie with the employee, but with the
manner in which they are utilized. Here McGregor debates that employees can be enthusiastic,
determined, and organized. Thus, when employees lack the motivation to perform, it is as much
the fault of the organization as it is the individual. In this way, McGregor’s “Theory X and
Theory Y” seeks to understand how motivation affects behavior and its relationship to
organizational performance. In essence, Theory Y compares to Maslow’s notion that human
behavior will be motivated by the need to be accepted and valued (Esteem). Similarly, it relates
to the idea that individual needs are based on reaching one’s full potential (Self-Actualization).
In this way, McGregor, like Maslow, is relevant to this study in that their motivation theories
link motivation with behavior.
Approaching motivation from a different angle, Frederick Hertzberg presented empirical
evidence to establish his “Motivation-Hygiene Theory.” As such, Hertzberg’s theory proved
especially beneficial as a mechanism for improved operations. His concept reasoned that
satisfaction and dissatisfaction are developed mostly from motivation or hygiene factors.
According to Hertzberg,
Motivation factors or satisfiers ... [include] work itself, responsibility, recognition
achievement, [and] growth. [While] hygiene factors ... intrinsic to work itself,
include policy and practices of the organization toward its employees, supervision
or supervisory practices, interpersonal relations with boss, work conditions, pay
and interpersonal relations with colleagues. [If withheld] these factors lead to
dissatisfaction. (Islam and Nazim 2013, 88, 91)
In essence, Hertzberg delineates intrinsic motivators from the extrinsic conditions that can lead
to dissatisfaction. Indeed, the motivation derived from work that is viewed as challenging, the
satisfaction stemming from being recognized for a job well done, and the innate fulfillment that
comes from having the opportunity to do something thought to be meaningful are all dependent
upon the subjective preferences of the individual.
Furthering the importance of Hertzberg’s research is the idea that an employee’s level of
satisfaction and/or dissatisfaction leads to “a kind of ‘circular region’ which tends to keep good
morale good and bad morale bad” (Worthy 1950, 65). Since “research shows that low morale
translates to low productivity” (Mtanga et al. 2010, 1), it is important that organizational leaders
develop a comprehensive understanding of what factors influence morale. Absolutely,
Hertzberg’s emphasis on motivation as an intrinsic characteristic is useful in assessing employee
job satisfaction; however, for the purposes of probing the factors of morale the following models
are more prominent.
Also among the researchers of motivation theory, Richard Hackman and Greg Oldham’s
“Job Characteristics Theory” proposes five dimensions of job design: skill variety, task identity,
task significance, autonomy, and feedback. According to these scholars, job characteristics have
a direct influence on an employee’s motivation, satisfaction, performance, absenteeism and
turnover rates. Hackman and Oldham’s focus on managing task conditions as a mechanism for
performance makes it a more practical alternative than Hertzberg’s model. In similar fashion,
Victor Vroom’s “Expectancy Theory” (1964) advanced motivation theory by proposing that a
person’s level of effort will increase with their belief that their labors will result in higher

performance and ultimately better rewards. Further, Edwin Locke’s “Goal Setting Theory” is
based on the idea that task goals, if properly established and well managed can serve as
motivation. In effect, Locke’s idea links conscious goals and intentions to task performance.
More contemporary views, such as Carver and Scheier’s “Cybernetic Theory,” contends that
feedback for initial outcomes has a direct influence on expectations for the second task; however,
Carver and Scheier maintain that the overall determination given to that task comes not only
from that feedback but also from an individual's self-awareness. Indeed, the distinctions outlined
in these theories highlight the evolution of behavioral science; however, their true value to this
project rests in the linkage of motivation to perception.
Although brief, the backgrounds touched on here provide a synopsis of how motivational
theories evolved during the behavioral science movement. By placing intrinsic motivators, as
determinants of human behavior at the forefront of discussion, this important research
emphasized the importance of managing people as more than moving parts. In so doing, these
behavioral scientists essentially examined ideology from a personal perspective, relating it to
productivity in the workplace. The following sections will seek to further this analysis by
examining ethics and morale.
Ethical Theory
While motivation theory contributes to the understanding of the force that guides and
maintains goal-oriented behaviors, ethical theory offers a basis for the ethical solutions
individuals apply to the difficult situations they encounter in life. In this manner, ethics refers the
values and norms that form the basis of a person’s standards of right and wrong. In this way,
ethics influence a person’s perception of what is “virtuous.” To be sure, ethics vary between
individuals. As a result, the way ethics is viewed in terms of civil liberties and responsibilities,

benefits to society, and fairness/justice will inevitably differ. For that reason, no single ethical
theory can offer a perfect methodology. Fortunately, individuals do have enough common values
and norms to form like philosophies. Within this framework of understanding, ethical theory is a
useful tool for assessing workforce behavior, for which the following five ethical schools of
thought have proven useful.
The philosophy of “Virtue Ethics” comes from the ethical theories of Aristotle and
Confucius and centers on character. According to these historic philosophers, a virtuous
existence is based on one’s ability to adhere to behaviors that are courageous, compassionate,
wise, and controlled. Keeping with this theme, virtue ethics demands the avoidance of behaviors
rooted in greed, jealousy, and/or selfishness. The second ethical school of thought,
“Utilitarianism” maintains that a person’s happiness and suffering are all that matters. Backed by
Jeremy Bentham and John S. Mill, this view of ethics maintains that good behavior requires
actions that maximize happiness and minimize pain and suffering. The third school of ethical
thought, as championed by philosophers Immanuel Kant, and W.D. Ross, is “Kantianism.” This
theory emphasizes the principles that determine a person’s actions. Consequently, ethical
goodness under Kantianism is determined by how well an individual adheres to universal
principles that holds everyone in high esteem. In fact, the success of Kantian ethics is judged by
how well an individual overcomes their animalistic tendencies. Next, Immanuel Kant and John
Rawls’ stress a “Deontological” or “Contractual Theory” view ethics by how well a person
follows established agreements. According to these models, worthy actions are established by
following rules and abiding by established agreements. Lastly, the fifth school of ethical thought,
“Care Ethics” was advanced by researchers Carol Gilligan, Virginia Held, and Michael Slote and
focuses on building, strengthening, and maintaining relationships.

Each of these theories emphasizes different paths to a “virtuous” existence. These
theories further illustrate the varied nature of human reasoning and although none of these ethical
theories alone offers a perfect methodology for evaluating behavior, they can be useful in
research settings. Organizations that successfully understand the ethical foundations that
motivate employee behavior are better equipped to nurture a productive worker. Yet any
legitimate attempt to cultivate emotion for the purposes of creating a productive culture must
also understand the determinants of morale.
Defining and Measuring Morale
For the purposes of this study, morale is defined as the mental state of interest and
trustworthiness that public sector employees have about their organization, job, and supervisor.
Good morale is evidenced by employee enthusiasm, voluntarily conformance with
regulations and orders, and a willingness to cooperate with others in the
accomplishment of the organizations objectives. Conversely, poor morale is
evidenced by surliness, cases of insubordination, discouragement and dislike of
job, company and associates. (Sison 1991, 389)
By linking good morale with enthusiasm, conformance, and a willingness to cooperate in
attainment of goals and bad morale with insubordination, discouragement and dislike of job, it is
easy infer the impact employee morale has on performance. “Workers and groups with high
morale are more productive than workers and groups with low morale” (Jose et al. 2013, 1). This
suggestion of higher productivity within identical cost constraints makes morale important from
a cost-efficiency perspective. Therefore, it is not too much of a jump to suggest that low morale
within organizational settings that equate to low performance can ultimately lead to higher

organizational costs. As a result, any organization concerned with cost savings should be equally
concerned with effectively managing the factors that govern employee morale.
Factors that Influence Morale
Research has shown that a variety of factors influence employee morale and thus
organizational success. According to Shawn Achor, the founder and Chief Executive Officer of
Good Think, Inc., employee happiness is one key element of organizational success. Achor
maintains that happiness extends beyond employees to the company, allowing it to create a
sustainable competitive advantage. Another important determinant of morale is tardiness. Indeed,
high tardiness should be a warning sign as it “costs U.S. businesses more than $3 billion each
year in lost productivity” (DeLonzor 2005, 1). Attendance, like happiness and tardiness is a
contributing factor to organizational success. A company's time loss through absenteeism can be
attributed to the absences of about 60% of its employees (MacRury 1949, 239). The point here is
clear, “in the absence of morale the profitable movement is impossible” (Jose et al. 2013, 1).
With this in mind, managers have begun to embrace programs that are much more conducive to
high employee morale.
One effective system utilized is quality of work life programs. The goal of quality of
work life programs is to enhance an employee’s well-being and satisfaction, essentially allowing
an organization to meet the full range of employee needs. In general, quality of work life
programs promotes adequate and fair compensation and a safe and healthy workplace
environment. They entail developing human capacities, providing opportunities for personal
growth and security, providing a social environment that fosters personal identity, freedom from
prejudice, a sense of community and upward mobility, one that embraces the rights and privacy

of employees in the office as well as endorses socially responsible actions. Although often quite
extensive, these types of programs have shown improvement in workforce morale.
Connecting increased morale with the creation of an organizational culture conducive to
performance and thus conducive to cost savings, stresses the importance of effectively managing
cognition. However, the broad range of topics that could have an emotional impact on a person’s
morale makes any research into understanding morale difficult at best. As mitigation, this essay
will focus on the following five proven determinants of morale: quality of relationship, quality of
communication, job satisfaction, willingness to move, and identification with group. These five
elements are pulled from the project entitled, Communication Correlates of Employee Morale
published in 1978 by John E. Baird and Patricia H. Bradley. In their research, Baird and Bradley
authenticated each of these factors of morale. As a result, their research has been cited in 22
peer-reviewed papers.
Quality of relationship is influenced by managerial communication behaviors. In essence,
employee morale here is based on “the quality of the subordinate's relationship with his [or her]
supervisor” (Baird and Bradley 1978, 50). Quality of communication describes the relationship
and communication quality that exists in superior to subordinate communication. As such, it
consists of “concern, comfort, attentiveness, activity, listening, and friendliness” (Baird and
Bradley 1978, 51). Job satisfaction is determined by how much a supervisor allows employees to
work unsupervised. However, when oversight is necessary,
It should take the form of encouraging participation, providing information,
stressing happy interpersonal relationships, emphasizing organizational goals,
stressing conflict avoidance, encouraging teamwork, motivating the employees to

give their best effort, and providing them with reinforcement when they perform
well. (Baird and Bradley 1978, 53)
Willingness to move, as the name suggests, is the employees’ inclination to move to another
organization. This factor of morale stems as an antithesis of group cohesiveness. Thus, perceived
low group cohesiveness will equate to a higher willingness to move. Identification with group
similarly, “serves ... to measure work group cohesiveness by assessing the extent to which each
employee identifies with his or her work group” (Baird and Bradley 1978, 54). By narrowing this
study to these elements of morale, this inquiry will provide relevant and legitimate context for a
subsequent examination into the psychology of communication.
Communication
Communication is the art of conveying meaning. As such, it is at the heart of human
interaction and it is a difficult skill to master. According to American scientists, Claude Shannon
and Warren Weaver, communication involves a cyclical process of encoding and decoding
messages by individuals of different perception. Because of this, there is constant distortion and
error in message transmission. In 1948, following Shannon's electrical engineering background,
Shannon and Weaver developed a theory that mimicked a digital circuit design. Using this
pattern, they depicted a communication process where information flows from a sender who
encodes the message to a receiver who decodes it. Along the path of transmission, the “Shannon-
Weaver Model of Communication” highlights some specific vulnerable areas. These areas are
responsible for “noise.” The term noise represents any distortion in the message that limits the
receiver’s ability to decode the sender’s message as intended. Certainly, noise in this context can
be problematic for managers who are responsible for communicating an organization’s vision
and goals to the workforce. Further complicating the issue, noise is caused by a variety of

elements, such as language barriers, inflection, body language, and emotions. Understanding
how to overcome these obstacles is critical for establishing and maintaining operative
communication. Shannon and Weaver identified seven barriers to communication: physical,
cultural, language, gender, interpersonal, perceptual and emotional. Each of these dynamics will
be touched on to provide some more understanding on the topic.
The physical barriers of communication consist of any physical boundary that creates an
obstacle between individuals, thus, limiting effective communication. Cultural barriers are
generated by differences in beliefs among varying nationalities, races, and social factors.
Although cultural diversity can offer a significant competitive advantage, cultural
communication issues, if not managed effectively, can be disastrous for organizations.
Communication barriers related to gender usually involve misconstrued meanings. Gender
communication issues are a hotbed of scholarly discourse, with varying pieces of legislation
dedicated to establishing norms for effective communication between the sexes. Interpersonal
communication barriers relate to interaction between individuals that is limited due to varying
personalities and prejudices. Perceptual barriers are internal and are often based on preconceived
notions, most of the time leading to a self-fulfilling prophecy. These types of communication
issues often begin with an individual thinking that the message will be misunderstood, leading to
the use of detrimental language, which ultimately facilitates the misunderstanding. The last
barrier to communication is emotion and is especially relevant to this study. “Emotional barriers
can be tough to overcome” (Smith 2013, 1). However, organizations with emotionally healthy
employees are much more capable of overcoming the issues associated with communication.
Certainly, these interpersonal dynamics make the successful transmission of information a very
challenging undertaking.

Craig E. Johnson, author of Ethics in the Workplace: Tools and Tactics for
Organizational Transformation, adds another element to the argument. He proposes, “the
exercise of influence is not an option in the workplace. [Managers] must influence others if
[they] are to fulfill [their] roles” (Johnson 2007, 115). If true, then “leaders deserve a good deal
of the credit for transforming ethics and a good deal of the blame when groups fall short”
(Johnson 2007, 171). Truly, the inference suggesting the interworking of supervisor to
subordinate communication are innately influential in establishing organizational culture is
significant. With this interpretation, not only does Johnson highlight communication from
supervisors as a legitimate driver of ethical perception, but he also characterizes cognition as an
irrational human trait influenced by downward communication. Ultimately, this effect solidifies
communication as an indispensable conduit for goal attainment. Within this context, downward
openness in communication becomes paramount.
Downward openness in communication is defined as the free flow of information from a
direct report supervisor their subordinate. In their article, The Impact of Relative Leader-Member
Exchange on Employees' Work Behaviors as Mediated by Psychological Contract Fulfillment,
Hu Li, Zhiyu Feng, Chunlin Liu, and Dejun Cheng describe downward openness as a descendant
of the “Leader-Member Exchange Theory.” In so doing, these scholars link the importance of
downward openness to the pioneering research of Graen, Dansereau, and Minami (1972) (Hu et
al. 2014, 79). Additionally, recent theory focusing on psychological contracts suggests it is
reasonable for workers to expect untethered communication from management. “Psychological
contracts consist of the obligations that employees believe their organization has [to them], and
the obligations that the employees believe they have to their organization in return (Turnley,
Bolino, Lester, and Bloodgood, 2003) as cited in Hu et al. 2014, 81). Many social theorists view

this “contract” as an obligation of loyalty and effort in return for organizational inducements
(Rhoades and Eisenburger, 2002; Hu et al. 2014, 81). In essence, when an employee perceives
that the organization is fulfilling or exceeding its part of the psychological contract he or she will
feel obligated to behave in a reciprocal manner.
Ultimately, by relating the psychological contract fulfillment theory to downward
openness in the communication, the argument is made for a mechanism of downward
communication that is credible enough to warrant ethical acceptance during the decoding phase
of communication. Yet, as our exploration of behavioral philosophy has revealed throughout this
essay, maintaining a free flow of information when dealing with irrational humans is insufficient
for adherence to any psychological contract. Certainly, this insight shifts focus beyond
communicating effectively to maintaining the perception of good openness in communication. It
is within this framework of understanding that this study will quantify the psychology of
communication. Specifically, the following case study will test whether the ethical perception of
downward openness in communication affects the morale of the public sector employees within
the Monroe County Transportation Department.

Chapter III
METHODOLOGY
Research in the field of public administration has been historically qualitative in nature.
Qualitative research is effective for gathering non-numeric information, and is useful in the arena
of the social sciences. Yet, the field has seen a recent shift from qualitative examinations to more
systematic and empirical approaches. With this in mind, the methods used for this study will
center on a positive manner of social research. Positive research is based on the positivist
tradition that suggests theory building comes from both creating testable laws and observing
relationships among variables. Positive research places its emphasis on explanation and
prediction, assessing results through deductive modeling. This is the research method that this
dissertation will use in seeking to quantify the traditionally qualitative question of whether the
ethical perception of downward openness affects employee morale.
Description of the Sample
When selecting a sample for this study, importance was placed on choosing a
geographical area demographically symbolic of the United States (U.S.) and the State of
Georgia. Additionally, emphasis was placed on selecting an industry representative of the
broader public sector within that area and the organization within that industry had to be
reasonably generalized to the public sector. This study will use demographic data to frame this
sample and industry. Criteria for the selection of the organization to be analyzed included that it
be owned, operated, and funded at the federal, state, or local
level. The organization had to be guided by specific rules and regulations aimed at achieving
and/or maintaining good governance. Additionally, the functional areas within the organization
had to fit a reasonable cross section of the public sector. This solidly defined base will thus allow
collected data to be realistically associated with the types of functions that exist in the public
sector. Lastly, the organization’s employees, as a part of their normal job duties, had to be
accustomed to communicating daily with their direct report supervisor. The following discussion
substantiates how the Monroe County Transportation Department proved a good fit for these
requirements.
As the following table of 2014 Race Demographic Data, obtained from census.gov in
reference to Monroe County, Georgia’s community profile shows, Monroe County, Georgia, had
an estimated 71.20% population of All Whites, including White Hispanics. This number
compares to 77.40% for the greater U.S. The State of Georgia had a lower percentage of All
Whites at 62.10%. However, this discrepancy may be attributed to Georgia’s higher percentage
of Black American population. In 2014, approximately 22.40% of Monroe County’s population
consisted of Black Americans. This calculation is nearly 10% higher than the percentage of
Black Americans for the United States; yet, it is more closely in line with the State of Georgia’s
31.50% Black American population. The percentage of American Indians in Monroe County was
approximately 0.30%, only slightly lower than the U.S. (1.20%) and the State of Georgia
(0.50%). Asian Americans made up 1.20% of Monroe County citizens, while the U.S. and State
of Georgia Asian populations equated to 5.40% and 3.80%, respectively. Pacific Islanders were
similar among all three geographical categories at less than 0.25%. Citizens reporting more than
one race represented 1.20% of Monroe County, 2.50% of the U.S. and 2.00% of the State of
Georgia populations. Although some variability exists, the data shows some commonality across
race demographics.

Table 1. Race Demographic Data, 2014
Race Approximate Population
(Monroe County)
Approximate Population
(United States)
Approximate Population (State of Georgia)
All Whites 73.80% 77.40% 62.10%
Black 22.40% 13.20% 31.50%
American Indian 0.30% 1.20% 0.50%
Asian 1.20% 5.40% 3.80%
Pacific Islanders 0.00% 0.20% 0.10%
Mixed 1.20% 2.50% 2.00%
Other 1.10% 0.00% 0.00%
Total 100.00% 100.00% 100.00%
Further, the educational level of Monroe County citizens, 25 years or older, as shown in
Table 2, when compared against statistics of the U.S. and the State Georgia, show Monroe
County citizens had a higher dropout rate than did the broader regions. Monroe County also fell
short in similar comparison of percentage of citizens with Associates, Bachelors and Graduate or
Higher degrees; however, Monroe County did show a nearly 10% advantage across the board in
citizens with a high school degree versus the National and State averages. These educational
findings are not entirely surprising, considering Monroe County is mostly a farming community
with little industry and even less educational institutions (three elementary schools, one high
school, and zero colleges or universities). Thus, with a limited number of jobs requiring higher
education, having a population statistically lower in the attainment of higher education is to be
expected.

Table 2. Educational Demographic Data, 25 Years and Older, 2014
Highest Education Level Attained
Approximate Education Level (Monroe County)
Approximate Education Level (United States)
Approximate Education Level
(State of Georgia)
Less than High School 20.00% 11.69% 13.00%
High School Diploma 57.50% 46.42% 49.00%
Associate Degree 3.50% 9.93% 8.00%
Bachelor Degree 11.70% 20.19% 19.00%
Graduate Degree or Higher 7.30% 11.77% 11.00%
According to census.gov statistics for “Categories of Employees at the Federal, State, and
Local Levels: March 2013,” education employment functions account for 49.9% of all
government employees with 74.8% of those employees working at local levels. The Monroe
County Transportation Department as part of the Monroe County School System is an education
employment function, which operates at the local level. The Monroe County Transportation
Department is funded with local property taxes and through State and Federal funding. As such,
the department is required by law to meet certain regulatory requirements for the purposes of
providing good governance. Likewise, under the conditions of their employment, transportation
employees are mandated to meet and maintain job specific regulatory qualifications. The
department is made up of general administration employees, quality assurance coordinators,
trainers, maintenance workers, and operators (i.e., drivers). This coverage includes employees
from both operational and tactical levels. This functional representation is important as it links
the Monroe County Transportation Department to the vast majority of public sector
organizations that operate within a vertical hierarchy consisting of a few senior managers at the
top (i.e., strategic level) and the majority of employees coming from operational and tactical
levels. Finally, these employees’ hierarchical proximity within the organization requires them to
have frequent interaction with their supervisor. Certainly, the demographic and industrial
similarities of the Monroe County Transportation Department discussed for this study endorse
the selection, yet, it is the organization’s strength in meeting the stated organizational
requirements that made it an ideal case for this project.
Data Collection
In addition to selecting an organization representative of the public sector, data collection
criteria for this study had to ensure that the number of personnel responding to the survey was
sufficient to ensure reliability. With this in mind, the entire population of the Monroe County
Transportation Department’s employees was targeted. As further mitigation, the Monroe County
Transportation Department Director agreed to administer the survey and endorse participation.
Employee responses were gathered via a survey, printed on standard 8 1/2 x 11, white
copy paper. A copy of the survey was made available to each potential respondent in a private
office setting where the individual was able to decline or complete the survey without
interference or coercion. Completed surveys were placed in a locked container. The survey did
not collect any demographic or other identifiable information. As such, no one including the
researcher could associate any of the answers with a respondent’s identity. Participation was
voluntary and the respondents could choose not to take the survey. In addition, the respondents
were able to quit the survey at any time or skip any of the survey questions that they did not wish
to answer. That said, only data from fully completed surveys were used in this study. Also,
respondents were required to be at least 18 years of age to participate in the study. The survey
was made available for 14 days. After that time, all surveys were collected.
Survey data consisted of 25 questions centered on perceived openness in superior to
subordinate communication and employee morale. Survey questions were pulled from the
research titled Communication Correlates of Employee Morale by J. E. Baird and P. H. Bradley.

The first 20 survey questions related to perceived openness in communication and the remaining
five questions explored employee morale. More specifically, questions 1 through 10 directly
related to communication content. Within this context, perceived openness in communication
represented the range of functions associated with managerial communication. The next 10
questions (11-20) focused on communication style, with emphasis placed on how superior to
subordinate messages are conveyed. The final five questions (21-25) assessed morale in terms of
quality of relationship, quality of communication, job satisfaction, willingness to move, and
identification with the group. The relatedness of these factors to perceived openness in
communication is validated by Baird and Bradley “Intercorrelations Among the Investigated
Variables” (Table 3). Their analyses shows that,
Of the 100 correlations calculated, 67 were statistically significant (p < .05).
Ratings of quality of relationship with supervisor were positively correlated with
all 10 content variables and 6 style variables, and negatively correlated with 2
stylistic variables. Similarly, ratings of quality of communication with supervisor
were positively correlated with 9 content and 6 stylistic variables. Employee
satisfaction was positively correlated with 9 content and 5 stylistic variables, and
negatively related to 2 stylistic factors. The respondents' willingness to move,
essentially a measure of low group cohesiveness, was negatively correlated with 8
content and 3 stylistic measures; that is, the greater the frequency with which a
supervisor displayed these behaviors, the less willing to move to another
department the employees became. Finally, identification with work group, a
positive measure of cohesiveness, was correlated with 6 content variables and 1
stylistic factor. (Baird and Bradley 1978, 50-51)

Baird and Bradley show “the content and style of a manager's communication with his
employees are closely related to the ways in which those employees respond to him specifically,
to their jobs generally, and to their work group” (Baird and Bradley 1978, 50). In effect, their
survey develops “a more specific, comprehensive picture of the sorts of managerial
communication, which increase worker morale by determining the relationships among
dimensions of managerial communication and employee satisfaction” (Baird and Bradley 1978,
48). Due to their surveys relatedness and proven validity, its questions will be tailored for this
study.
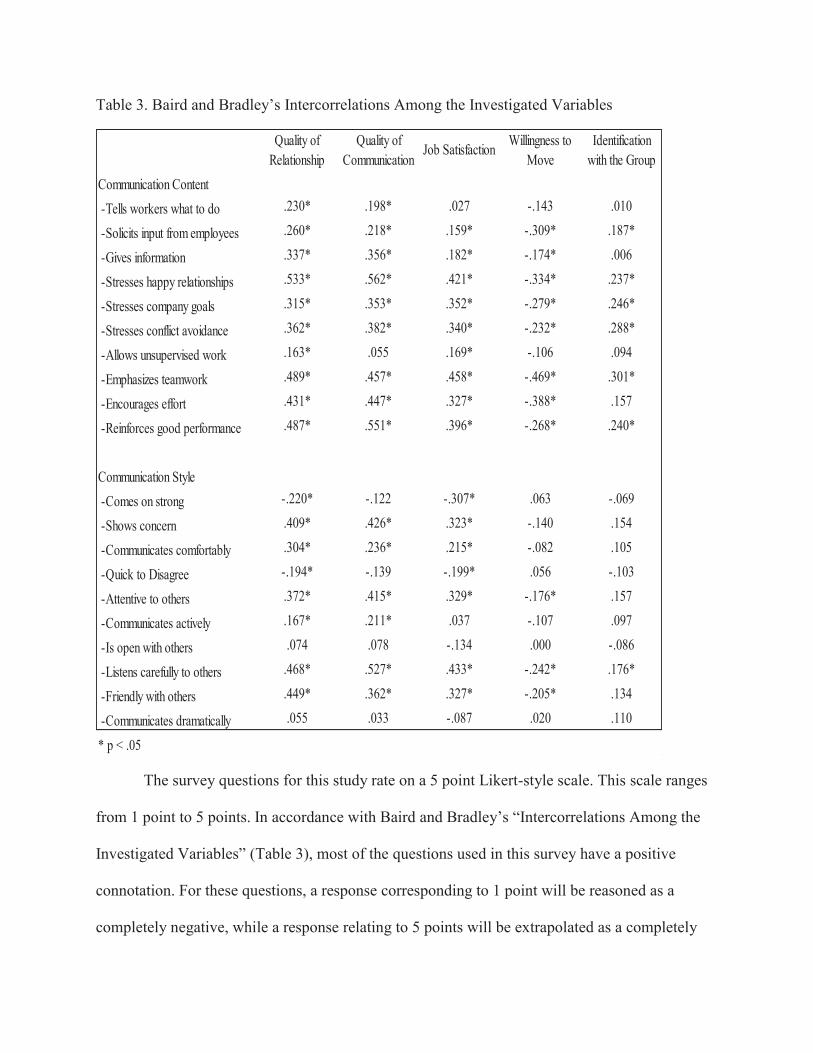
Table 3. Baird and Bradley’s Intercorrelations Among the Investigated Variables
The survey questions for this study rate on a 5 point Likert-style scale. This scale ranges
from 1 point to 5 points. In accordance with Baird and Bradley’s “Intercorrelations Among the
Investigated Variables” (Table 3), most of the questions used in this survey have a positive
connotation. For these questions, a response corresponding to 1 point will be reasoned as a
completely negative, while a response relating to 5 points will be extrapolated as a completely
Quality of Relationship
Quality of Communication
Job Satisfaction Willingness to Move
Identification with the Group
Communication Content -Tells workers what to do .230* .198* .027 -.143 .010
-Solicits input from employees .260* .218* .159* -.309* .187*
-Gives information .337* .356* .182* -.174* .006
-Stresses happy relationships .533* .562* .421* -.334* .237*
-Stresses company goals .315* .353* .352* -.279* .246*
-Stresses conflict avoidance .362* .382* .340* -.232* .288*
-Allows unsupervised work .163* .055 .169* -.106 .094
-Emphasizes teamwork .489* .457* .458* -.469* .301*
-Encourages effort .431* .447* .327* -.388* .157
-Reinforces good performance .487* .551* .396* -.268* .240*
Communication Style -Comes on strong -.220* -.122 -.307* .063 -.069
-Shows concern .409* .426* .323* -.140 .154
-Communicates comfortably .304* .236* .215* -.082 .105
-Quick to Disagree -.194* -.139 -.199* .056 -.103
-Attentive to others .372* .415* .329* -.176* .157
-Communicates actively .167* .211* .037 -.107 .097
-Is open with others .074 .078 -.134 .000 -.086
-Listens carefully to others .468* .527* .433* -.242* .176*
-Friendly with others .449* .362* .327* -.205* .134
-Communicates dramatically .055 .033 -.087 .020 .110
* p < .05

positive response. In this manner, lower scores will be equated to a lower ethical perception of
downward openness and morale and higher scores will be associated with a higher ethical
perception of downward openness and morale. Conversely, questions shown to have a negative
inference will be inversely adjusted to match this survey’s positive undertone.
Statistical Methodology
The approach outlined above will provide a reasonable mechanism for extrapolating the
data necessary to evaluate the ethical perception of downward openness and morale. In so doing,
a responses spreadsheet (Table 4) will be completed for each completed survey. The purpose of
the spreadsheet is to calculate the appropriate means from the answers provided on each paper
survey. As such, the spreadsheet is arranged to correspond the question number to its represented
category. Next it displays the Likert Scale with an “x” representing the respondent’s choice for
each question. Based on the respondent’s choice, the subsequent columns quantify a score for
each question. The final sections show the calculated mean for the delineated and aggregate
variables. These means will be used to conduct the analyses leading to a reliable assessment of
the hypothesis, labeled Ho1.

Table 4. Responses Spreadsheet
Hypothesis
Ho1 (null): There is not a relationship between the ethical perception of
downward openness and morale.
Ha1: There is a relationship between the ethical perception of downward openness and
morale.
At this point in the study, it may be useful to provide a more complete understanding of some of
the terms referenced in this methodology. The following expressions are defined below: score,
section mean, overall mean, communication content, communication style, ethical perception of
downward openness, and morale, along with descriptions of independent (X) and dependent (Y)
variables.
Survey Question Number Rating Category 1 2 3 4 5 Score Category1 Communication Content x 32 Communication Content x 23 Communication Content x 14 Communication Content x 25 Communication Content x 26 Communication Content x 17 Communication Content x 38 Communication Content x 29 Communication Content x 210 Communication Content x 211 Communication Style x 112 Communication Style x 113 Communication Style x 314 Communication Style x 315 Communication Style x 416 Communication Style x 317 Communication Style x 318 Communication Style x 319 Communication Style x 320 Communication Style x 321 Quality of Relationship x 322 Quality of Communication x x 223 Job Satisfaction x 324 Willingness to Move x 225 Identification with Group x 2
Com
mun
icat
ion
Sty
le
MO
RA
LE
Likert ScaleSection Mean Overall Mean
2.00 (Average of
“Score” for
Questions 1-10)
Com
mun
icat
ion
Con
tent
2.35 (Average of “Score”
for Questions 11-20)
DO
WN
WA
RD
OP
EN
NE
SS
2.70 (Average of
“Score” for
Questions 11-20)

“Score” as depicted in the “Sample Respondent Spreadsheet” shows the number of points
that correspond to the respondent’s answer for a given question.
“Section Mean” as tabulated in the “Sample Respondent Spreadsheet” delineates, as
separate constructs, the “Content” and “Style” elements of communication and the factors
of morale.
“Overall Mean” as calculated in the “Sample Respondent Spreadsheet” represents the
aggregate mean for the ethical perception of downward openness and morale.
Communication content represents to the range of functions associated with managerial
communication.
Communication style places emphasis on how superior to subordinate messages are
conveyed.
Ethical perception of downward openness is a form of communication associated
with the level of an employee’s acceptance of information that is free-flowing
from his or her direct report supervisor.
Morale is characterized by the subordinate’s perceived quality of relationship with
his or her supervisor, quality of communication coming from their supervisor, job
satisfaction, willingness to move to a new work group, and how well the
subordinate believes he or she identifies with their work group.
For the purpose of this study, the independent variable (X) is the ethical
perception of downward openness, which is further delineated into content and
style.

The dependent variable (Y) is morale, which is further delineated into quality of
relationship, quality of communication, job satisfaction, willingness to move, and
identification with the group.
The methodologies used in this study focus on three levels of inquiry. The first involves
an aggregate assessment of the variables, with subsequent analyses examining sub-variable
elements to assess the strength of that prediction. Final testing will evaluate the internal
consistency of the response data. Because this study will use aggregated data that is generally
available to the public and does not identify any personally identifiable information, it was
granted an Institutional Review Board waiver (see Appendix B).
The following Chapter 4 (Results) section will present the findings of this study’s
quantitative analysis. Where necessary and relevant, tables and charts will be added to
supplement individual hypotheses and statistical testing. In this manner, Chapter 4 will answer
the hypothesis, determine the validity of those findings, and confirm the internal consistency of
the data. In so doing, the Results section will provide a comprehensive evaluation of the
relationship between the ethical perception of downward openness and morale.

Chapter IV
RESULTS
Analyses Leading to Prediction
In order to frame the data to evaluate the hypothesis, initial statistical techniques will
focus on assessing descriptive statistics, line charts, correlation analysis, and hypothesis-based
testing. Descriptive statistics will be used to gauge whether the dataset is representative of the
surveyed population. In effect, this verification will be used to estimate how generalized the
variables are to the public sector.
Table 5, Descriptive Statistics: Perception of Downward Openness and Morale, outlines
the key descriptive statistics for each of the aggregate variables. Of these statistics, the calculated
standard error proves important to this study as it shows how representative the variables are to
the surveyed population. In general, smaller standard errors equate to a more representative
sample of the overall population. Therefore, considering the standard error of the ethical
perception of downward openness was 0.068481359 and the standard error of morale was
0.069563658, the aggregate data for both variables was determined generalizable to the public
sector.
Table 5. Descriptive Statistics: Perception of Downward Openness and Morale
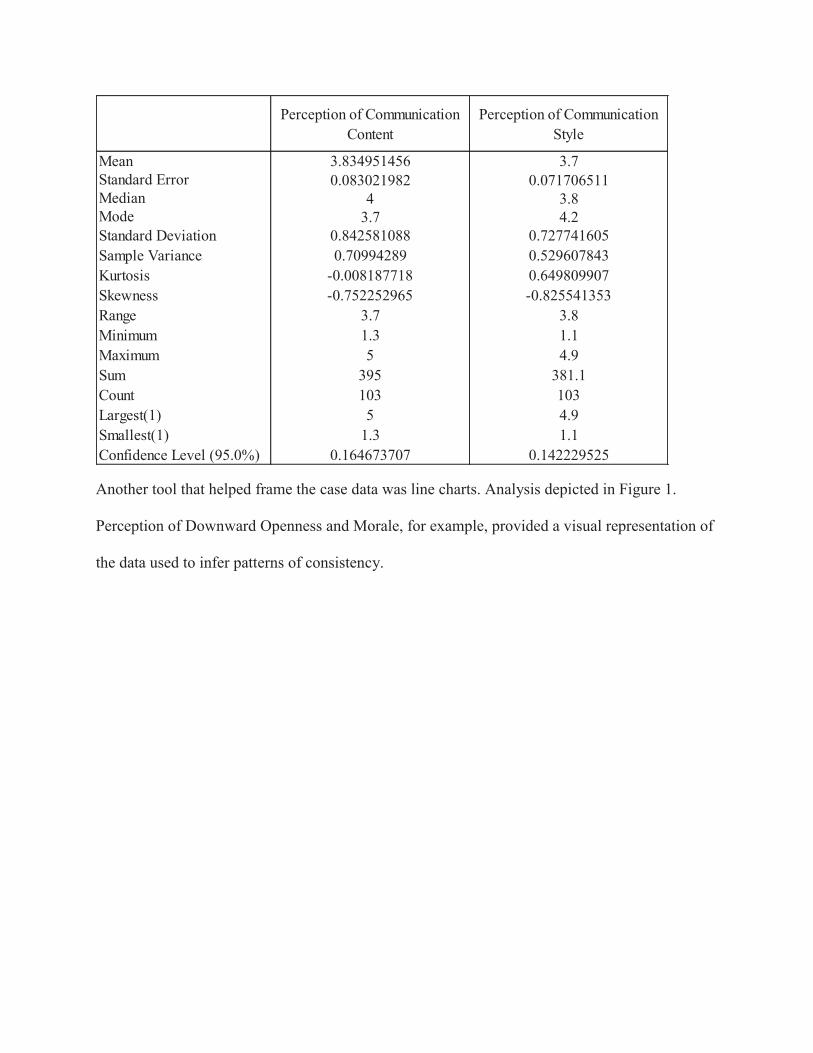
Another tool that helped frame the case data was line charts. Analysis depicted in Figure 1.
Perception of Downward Openness and Morale, for example, provided a visual representation of
the data used to infer patterns of consistency.
Perception of Communication Content
Perception of Communication Style
Mean 3.834951456 3.7Standard Error 0.083021982 0.071706511Median 4 3.8Mode 3.7 4.2Standard Deviation 0.842581088 0.727741605Sample Variance 0.70994289 0.529607843Kurtosis -0.008187718 0.649809907Skewness -0.752252965 -0.825541353Range 3.7 3.8Minimum 1.3 1.1Maximum 5 4.9Sum 395 381.1Count 103 103Largest(1) 5 4.9Smallest(1) 1.3 1.1Confidence Level (95.0%) 0.164673707 0.142229525

Figure 1. Perception of Downward Openness and Morale The trend shown in this chart inferred the existence of a relationship between the ethical
perception of downward openness and morale. Yet, it is important to note that the information
derived from Figure 1 was not used to make any statistically significant prediction.
Correlation analysis advanced the inference through a more reliable calculation. The
analysis in the Table 6 correlation analysis showed a high correlation of 0.769178137 between
the ethical perception of downward openness and morale. Interpreted, this statistic supports a
good linear relationship, where approximately 76.92% of morale explains the perception of
downward openness.

Table 6. Correlation Analysis: Perception of Downward Openness and Morale
To confirm the inferred relationship between the ethical perception of downward
openness and morale, a hypothesis-based test showed a rejection of the null hypothesis at the
0.05 α level (Table 7). Rejecting the null hypothesis meant that there was enough evidence to
conclude that β1 ≠ 0. As a result, the alternate hypothesis (Ha1) was accepted. Results of the
hypothesis-based test confirmed a significant relationship between the aggregate variables.
Perception of Downward Openness Morale
Perception of Downward Openness 1Morale 0.769178137 1p < 0.05, n = 103
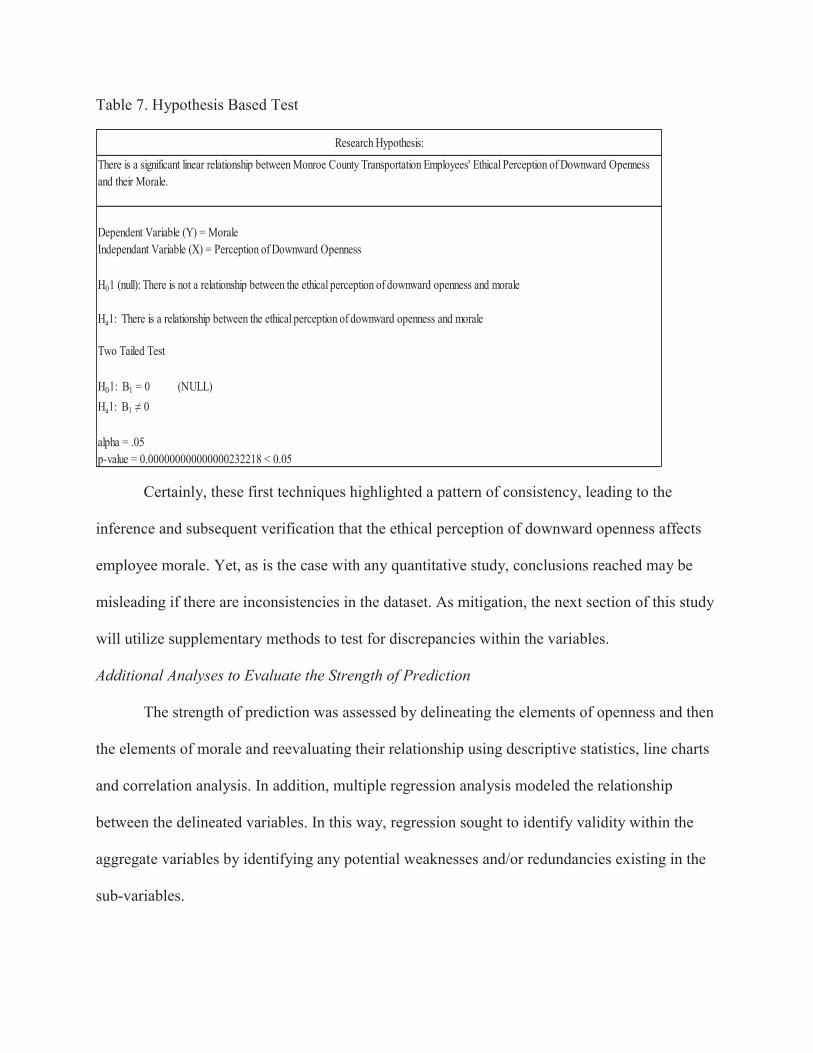
Table 7. Hypothesis Based Test
Certainly, these first techniques highlighted a pattern of consistency, leading to the
inference and subsequent verification that the ethical perception of downward openness affects
employee morale. Yet, as is the case with any quantitative study, conclusions reached may be
misleading if there are inconsistencies in the dataset. As mitigation, the next section of this study
will utilize supplementary methods to test for discrepancies within the variables.
Additional Analyses to Evaluate the Strength of Prediction
The strength of prediction was assessed by delineating the elements of openness and then
the elements of morale and reevaluating their relationship using descriptive statistics, line charts
and correlation analysis. In addition, multiple regression analysis modeled the relationship
between the delineated variables. In this way, regression sought to identify validity within the
aggregate variables by identifying any potential weaknesses and/or redundancies existing in the
sub-variables.
Dependent Variable (Y) = MoraleIndependant Variable (X) = Perception of Downward Openness
Two Tailed Test
H01: Β1 = 0 (NULL)Ha1: Β1 ≠ 0
alpha = .05 p-value = 0.000000000000000232218 < 0.05
Research Hypothesis:
There is a significant linear relationship between Monroe County Transportation Employees' Ethical Perception of Downward Openness and their Morale.
H01 (null): There is not a relationship between the ethical perception of downward openness and morale
Ha1: There is a relationship between the ethical perception of downward openness and morale

This first delineation focused on communication content and communication style as the
elements that made up the perception of downward openness. Descriptive statistics were run on
each of these factors to determine if they were similarly consistent with the perception of
downward openness. The sub-variable data presented in the Table 8 Descriptive Statistics: Sub-
variables of Downward Openness shows that the standard errors for communication content
(0.083021982) and communication style (0.071706511) were generalizable to the public sector.
Table 8. Descriptive Statistics: Sub-variables of Perception of Downward Openness
The following analysis compared each of the delineated sub-variables to morale. From
the depiction shown in the Figure 2. Sub-variables of Perception of Downward Openness and
Morale, communication content and communication style appeared to follow the same linear
trend as morale. Again, this pattern of consistency was useful only in its ability to infer a
relationship and not for making any statistically significant predictions.
Perception of Communication Content
Perception of Communication Style
Mean 3.834951456 3.7Standard Error 0.083021982 0.071706511Median 4 3.8Mode 3.7 4.2Standard Deviation 0.842581088 0.727741605Sample Variance 0.70994289 0.529607843Kurtosis -0.008187718 0.649809907Skewness -0.752252965 -0.825541353Range 3.7 3.8Minimum 1.3 1.1Maximum 5 4.9Sum 395 381.1Count 103 103Largest(1) 5 4.9Smallest(1) 1.3 1.1Confidence Level (95.0%) 0.164673707 0.142229525

Figure 2. Sub-variables of Perception of Downward Openness and Morale
The correlation analysis shown in Table 9 compared communication content,
communication style and morale. The analysis showed communication content correlated with
morale at 0.650889592, while communication style correlated with morale slightly higher at
0.721677429. While this difference was not overly significant, the moderate correlation between
communication content and communication style at 0.573511715 did suggest the potential for
multicollinearity.
Table 9. Correlation Analysis: Sub-variables of Perception of Downward Openness and Morale
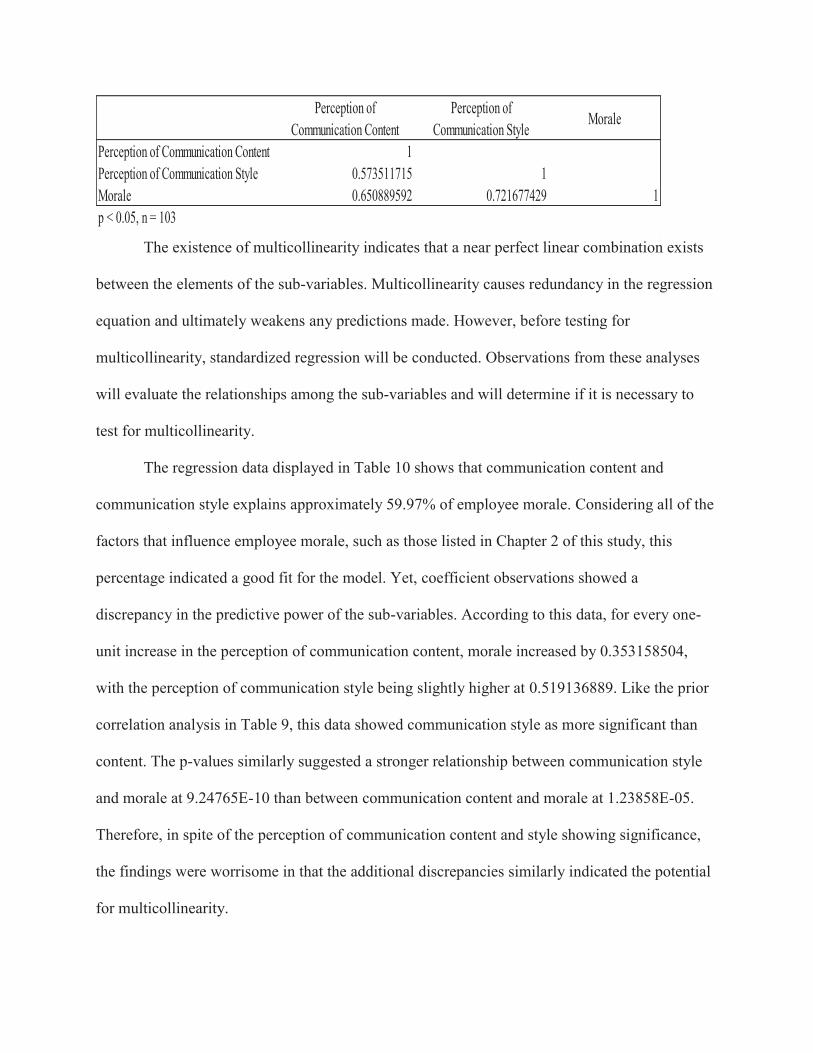
The existence of multicollinearity indicates that a near perfect linear combination exists
between the elements of the sub-variables. Multicollinearity causes redundancy in the regression
equation and ultimately weakens any predictions made. However, before testing for
multicollinearity, standardized regression will be conducted. Observations from these analyses
will evaluate the relationships among the sub-variables and will determine if it is necessary to
test for multicollinearity.
The regression data displayed in Table 10 shows that communication content and
communication style explains approximately 59.97% of employee morale. Considering all of the
factors that influence employee morale, such as those listed in Chapter 2 of this study, this
percentage indicated a good fit for the model. Yet, coefficient observations showed a
discrepancy in the predictive power of the sub-variables. According to this data, for every one-
unit increase in the perception of communication content, morale increased by 0.353158504,
with the perception of communication style being slightly higher at 0.519136889. Like the prior
correlation analysis in Table 9, this data showed communication style as more significant than
content. The p-values similarly suggested a stronger relationship between communication style
and morale at 9.24765E-10 than between communication content and morale at 1.23858E-05.
Therefore, in spite of the perception of communication content and style showing significance,
the findings were worrisome in that the additional discrepancies similarly indicated the potential
for multicollinearity.
Perception of Communication Content
Perception of Communication Style Morale
Perception of Communication Content 1Perception of Communication Style 0.573511715 1Morale 0.650889592 0.721677429 1p < 0.05, n = 103

Table 10. Std. Regression Analysis: Sub-variables of Perception of Downward Openness with Morale as DV
To test for multicollinearity a VIF was calculated for the sub-variables of the perception
of downward openness using the following formula: 1 / (1-R2)), where R2 represents the
coefficient of determination of the variables. Generally, VIF values exceeding 10 are a good
indication of multicollinearity. However, in weaker models, VIF values above 2.5 may also
suggest multicollinearity. The calculated VIF for these variables was 1.490125729 (Table 11).
This calculation eased apprehension about multicollinearity by confirming these sub-variables as
useful predictors of morale.
SUMMARY OUTPUT - Morale as DV
Standardized Regression StatisticsMultiple R 0.777506636R Square 0.60451657Adjusted R Square 0.596606901Standard Error 0.635132348Observations 103
ANOVAdf SS MS F Significance F
Regression 2 61.66069011 30.83034505 76.42754707 7.1848E-21Residual 100 40.33930989 0.403393099Total 102 102
Coefficients Standard Error t Stat P-value Lower 95% Upper 95% LowIntercept -2.28016E-15 0.06258145 -3.6435E-14 1 -0.124159814 0.124159814 -0Perception of Communication Content 0.353158504 0.076767183 4.6003838 1.23858E-05 0.2008546 0.505462408Perception of Communication Style 0.519136889 0.076767183 6.762484574 9.24765E-10 0.366832985 0.671440793 0

Table 11. VIF: Sub-variables of Perception of Downward Openness
With the perception of communication content and style proven as legitimate elements of
the perception of downward openness, the next section of this study will seek to assess the sub-
variables of morale. As discussed in Chapter 2, the factors of morale used in this study are
quality of relationship, quality of communication, job satisfaction, willingness to move, and
identification with the Group. Once again, initial analyses will focus on descriptive statistics, line
charts, correlation, and regression. Additionally, if the data suggests multicollinearity, a VIF will
be calculated
Descriptive statistics shown in Table 12 provided some interesting observations.
Specifically, the standard errors for quality of relationship (0.076470851), quality of
communication (0.085453765), and job satisfaction (0.08129736) all suggested a precise
estimate of the population mean. However, the willingness to move (0.137167611) and
identification with the group (0.104167856) indicated less predictability.
Perception of Communication Content
Perception of Communication Style
Perception of Communication Content 1Perception of Communication Style 1.490125729 1p < 0.05, n = 103
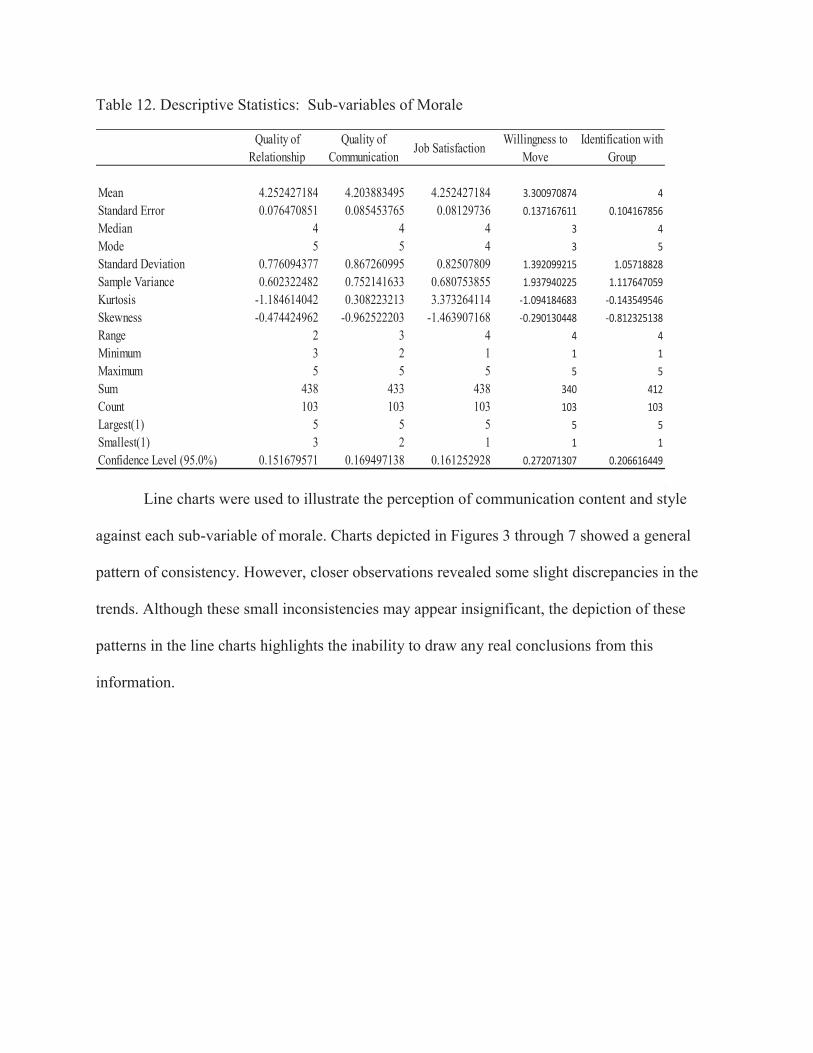
Table 12. Descriptive Statistics: Sub-variables of Morale
Line charts were used to illustrate the perception of communication content and style
against each sub-variable of morale. Charts depicted in Figures 3 through 7 showed a general
pattern of consistency. However, closer observations revealed some slight discrepancies in the
trends. Although these small inconsistencies may appear insignificant, the depiction of these
patterns in the line charts highlights the inability to draw any real conclusions from this
information.
Quality of Relationship
Quality of Communication Job Satisfaction Willingness to
MoveIdentification with
Group
Mean 4.252427184 4.203883495 4.252427184 3.300970874 4Standard Error 0.076470851 0.085453765 0.08129736 0.137167611 0.104167856Median 4 4 4 3 4Mode 5 5 4 3 5Standard Deviation 0.776094377 0.867260995 0.82507809 1.392099215 1.05718828Sample Variance 0.602322482 0.752141633 0.680753855 1.937940225 1.117647059Kurtosis -1.184614042 0.308223213 3.373264114 -1.094184683 -0.143549546Skewness -0.474424962 -0.962522203 -1.463907168 -0.290130448 -0.812325138Range 2 3 4 4 4Minimum 3 2 1 1 1Maximum 5 5 5 5 5Sum 438 433 438 340 412Count 103 103 103 103 103Largest(1) 5 5 5 5 5Smallest(1) 3 2 1 1 1Confidence Level (95.0%) 0.151679571 0.169497138 0.161252928 0.272071307 0.206616449

Figure 3. Sub-variables of Perception of Downward Openness and Quality of Relationship as Sub-variable of Morale

Figure 4. Sub-variables of Perception of Downward Openness with Quality of Communication as Sub-variable of Morale

Figure 5. Sub-variables of Perception of Downward Openness with Job Satisfaction as Sub-variable of Morale

Figure 6. Sub-variables of Perception of Downward Openness with Willingness to Move as Sub-variable of Morale

Figure 7. Sub-variables of Perception of Downward Openness with Identification with Group as Sub-variable of Morale
Subsequent correlation analysis (Table 13) showed a good correlation between perception
of communication content and the quality of relationship at 0.620557821. Likewise, it showed
linear correlation with the quality of communication at 0.624751664. Job satisfaction and
Identification with the Group correlated slightly lower at 0.449743374 and 0.534899326,
respectively. Finally, the perception of communication content correlated with identification with
the group at 0.534899326. Communication style followed a similar pattern, correlating with the
quality of relationship at 0.626635925, the quality of communication at 0.660179052, job
satisfaction at 0.546981171, willingness to move at 0.313543243 and identification with the
group correlating at 0.56833597.

Table 13. Std. Correlation Analysis: Sub-variables of Perception of Downward Openness and Sub-variables of Morale
The use of standardized multiple regression is important to this section of the study for
comparing each dependent sub-variable of morale against the independent sub-variables of the
perception of downward openness. In so doing, the effectivity of the perception of
communication content and style can be weighed against each sub-variable of morale. The
findings from this analysis should identify any weakness that may exist between any of the sub-
variables.
The standardized regression analysis illustrated in Table 14 assessed the sub-variables of
the perception of downward openness with quality of relationship as the dependent variable. The
adjusted R square of 0.48203781 indicated a moderate relationship between the perception of
communication content and style and the quality of relationship. Moreover, the regression
equation showed that the perception of communication content had a fair degree of influence on
quality of relationship with a coefficient of 0.389183255. The perception of communication style
showed a slightly higher influence on quality of relationship with a coefficient of 0.403434768.
Although the p-value for both sub-variables of openness confirmed a significant relationship
Perception of
Communication Content
Perception of
Communication Style
Quality of
Relationship
Quality of
Communication
Job Satisfaction
Willingness to
Move
Identification with
GroupPerception of Communication Content 1
Perception of Communication Style 0.573511715 1
Quality of Relationship 0.620557821 0.626635925 1
Quality of Communication 0.624751664 0.660179052 0.884132228 1
Job Satisfaction 0.449743374 0.546981171 0.557868162 0.612425195 1
Willingness to Move 0.242528640 0.313543243 0.065106195 0.086723198 0.231953141 1
Identification with Group 0.534899326 0.568335970 0.633299027 0.630884250 0.517023479 0.206509005 1

with quality of relationship, the perception of communication content was less significant with a
p-value of 1.96189E-05, than was style with a p-value of 1.02707E-05.
Table 14. Std. Regression Analysis: Sub-variables of Perception of Downward Openness with Quality of Relationship as DV
Table 15 assessed the sub-variables of the perception of downward openness with quality
of communication as the dependent variable. The adjusted R square of 0.516631257 indicates a
good relationship between the perception of communication content and style and the quality of
communication. Moreover, the regression equation shows that the perception of communication
content had a fair degree of influence on quality of communication with a coefficient of
0.366766499. The perception of communication style shows a higher influence with a coefficient
of 0.449834168. Although the p-value for both sub-variables of openness confirmed a
SUMMARY OUTPUT - Quality of Relationship as DV
Standardized Regression StatisticsMultiple R 0.703077117R Square 0.494317432Adjusted R Square 0.484203781Standard Error 0.718189543Observations 103
ANOVAdf SS MS F Significance F
Regression 2 50.42037807 25.21018903 48.87625789 1.56278E-15Residual 100 51.57962193 0.515796219Total 102 102
Coefficients Standard Error t Stat P-value Lower 95% Upper 95% LowIntercept -8.11927E-16 0.070765318 -1.14735E-14 1 -0.140396376 0.140396376 -0Perception of Communication Content 0.389183255 0.086806141 4.483360883 1.96189E-05 0.216962345 0.561404166 0Perception of Communication Style 0.403434768 0.086806141 4.647537206 1.02707E-05 0.231213858 0.575655679 0
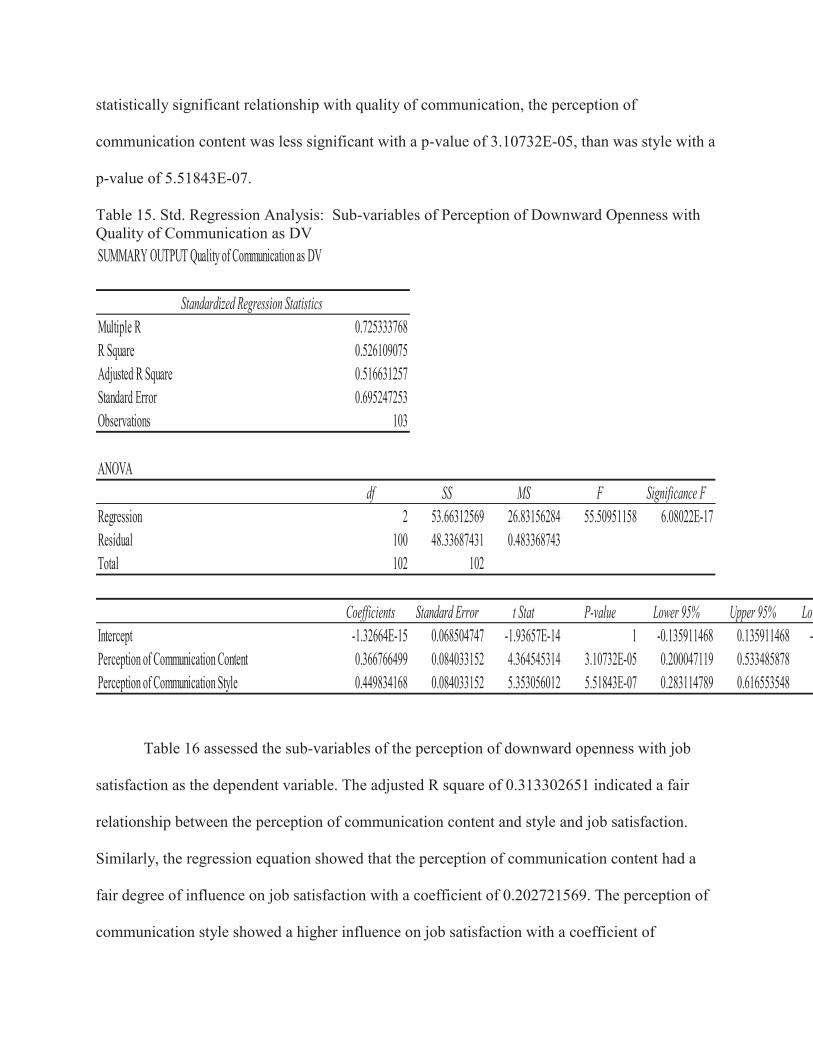
statistically significant relationship with quality of communication, the perception of
communication content was less significant with a p-value of 3.10732E-05, than was style with a
p-value of 5.51843E-07.
Table 15. Std. Regression Analysis: Sub-variables of Perception of Downward Openness with Quality of Communication as DV
Table 16 assessed the sub-variables of the perception of downward openness with job
satisfaction as the dependent variable. The adjusted R square of 0.313302651 indicated a fair
relationship between the perception of communication content and style and job satisfaction.
Similarly, the regression equation showed that the perception of communication content had a
fair degree of influence on job satisfaction with a coefficient of 0.202721569. The perception of
communication style showed a higher influence on job satisfaction with a coefficient of
SUMMARY OUTPUT Quality of Communication as DV
Standardized Regression StatisticsMultiple R 0.725333768R Square 0.526109075Adjusted R Square 0.516631257Standard Error 0.695247253Observations 103
ANOVAdf SS MS F Significance F
Regression 2 53.66312569 26.83156284 55.50951158 6.08022E-17Residual 100 48.33687431 0.483368743Total 102 102
Coefficients Standard Error t Stat P-value Lower 95% Upper 95% LowIntercept -1.32664E-15 0.068504747 -1.93657E-14 1 -0.135911468 0.135911468 -0Perception of Communication Content 0.366766499 0.084033152 4.364545314 3.10732E-05 0.200047119 0.533485878 0Perception of Communication Style 0.449834168 0.084033152 5.353056012 5.51843E-07 0.283114789 0.616553548 0

0.430717976. Although the p-value for both sub-variables of openness confirmed a statistically
significant relationship with job satisfaction, the perception of communication content was less
significant with a p-value of 0.0456395, than was style with a p-value of 3.97225E-05.
Table 16. Std. Regression Analysis: Sub-variables of Perception of Downward Openness with Job Satisfaction as DV
Table 17 assessed the sub-variables of the perception of downward openness with
willingness to move as the dependent variable. The adjusted R square indicated a poor degree of
relationship between the sub-variables of the perception of downward openness and willingness
to move at 0.08625234. The coefficients of the regression equation showed that for every one-
unit increase in the perception of communication content and style, willingness to move
increased at 0.09344268 and 0.259952771, respectively. The p-value for the perception of
SUMMARY OUTPUT Job Satisfaction as DV
Standardized Regression StatisticsMultiple R 0.57163564R Square 0.326767305Adjusted R Square 0.313302651Standard Error 0.828672039Observations 103
ANOVAdf SS MS F Significance F
Regression 2 33.33026515 16.66513257 24.26852617 2.56012E-09Residual 100 68.66973485 0.686697349Total 102 102
Coefficients Standard Error t Stat P-value Lower 95% Upper 95% LowIntercept -4.62404E-16 0.081651482 -5.66315E-15 1 -0.161994215 0.161994215 -0Perception of Communication Content 0.202721569 0.10015994 2.023978536 0.045639519 0.0040071 0.401436037Perception of Communication Style 0.430717976 0.10015994 4.300301855 3.97225E-05 0.232003508 0.629432445 0
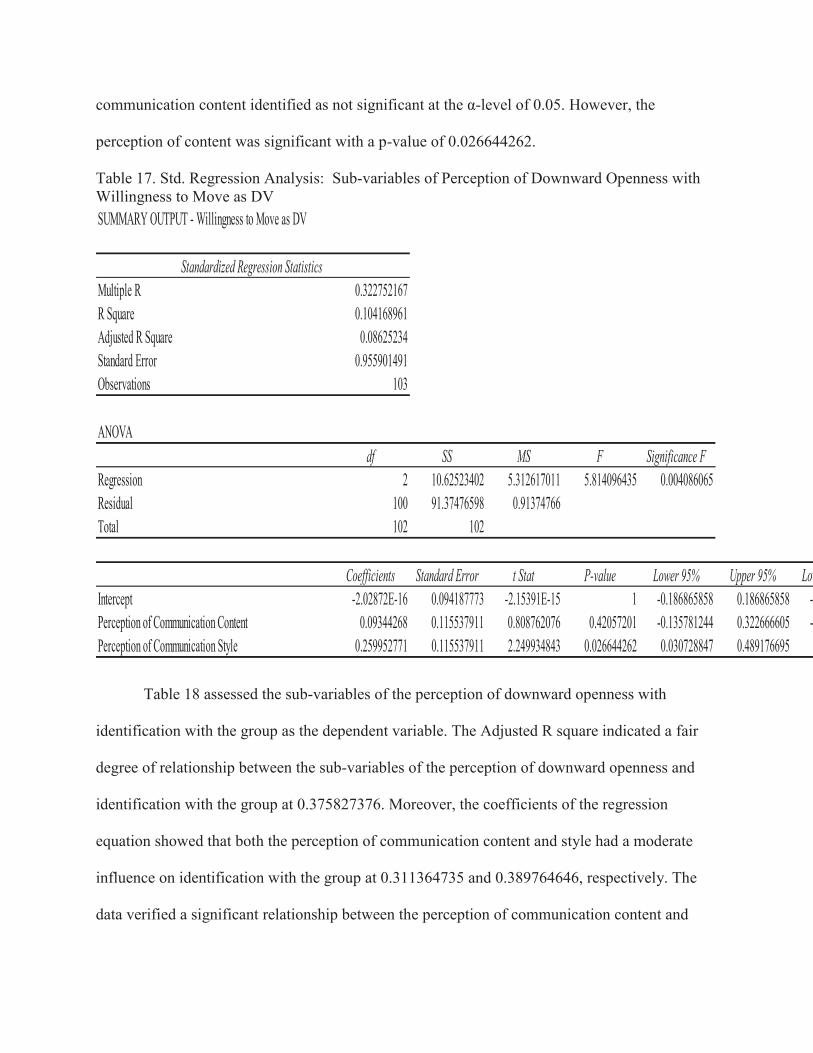
communication content identified as not significant at the α-level of 0.05. However, the
perception of content was significant with a p-value of 0.026644262.
Table 17. Std. Regression Analysis: Sub-variables of Perception of Downward Openness with Willingness to Move as DV
Table 18 assessed the sub-variables of the perception of downward openness with
identification with the group as the dependent variable. The Adjusted R square indicated a fair
degree of relationship between the sub-variables of the perception of downward openness and
identification with the group at 0.375827376. Moreover, the coefficients of the regression
equation showed that both the perception of communication content and style had a moderate
influence on identification with the group at 0.311364735 and 0.389764646, respectively. The
data verified a significant relationship between the perception of communication content and
SUMMARY OUTPUT - Willingness to Move as DV
Standardized Regression StatisticsMultiple R 0.322752167R Square 0.104168961Adjusted R Square 0.08625234Standard Error 0.955901491Observations 103
ANOVAdf SS MS F Significance F
Regression 2 10.62523402 5.312617011 5.814096435 0.004086065Residual 100 91.37476598 0.91374766Total 102 102
Coefficients Standard Error t Stat P-value Lower 95% Upper 95% LowIntercept -2.02872E-16 0.094187773 -2.15391E-15 1 -0.186865858 0.186865858 -0Perception of Communication Content 0.09344268 0.115537911 0.808762076 0.42057201 -0.135781244 0.322666605 -0Perception of Communication Style 0.259952771 0.115537911 2.249934843 0.026644262 0.030728847 0.489176695 0

willingness to move with a p-value of 0.00152025. Likewise, the perception of communication
style was shown to have a significant relationship with willingness to move with a p-value of
9.01011E-05.
Table 18. Std. Regression Analysis: Sub-variables of Perception of Downward Openness with Identification with Group as DV
Because of the varying levels of consistency among the sub-variables, a multicollinearity
analysis was performed on the sub-variables of morale. The results of the VIF test (Table 19)
showed the existence of multicollinearity between quality of relationship and quality of
communication. However, the remaining sub-variables were shown to be independently valid.
Table 19. VIF: Sub-variables of Morale
SUMMARY OUTPUT - Identification with the Group as DV
Standardized Regression StatisticsMultiple R 0.62294948R Square 0.388066055Adjusted R Square 0.375827376Standard Error 0.790045963Observations 103
ANOVAdf SS MS F Significance F
Regression 2 39.58273762 19.79136881 31.70816543 2.16385E-11Residual 100 62.41726238 0.624172624Total 102 102
Coefficients Standard Error t Stat P-value Lower 95% Upper 95% LowIntercept -8.09456E-16 0.077845542 -1.03982E-14 1 -0.154443338 0.154443338 -0Perception of Communication Content 0.311364735 0.095491283 3.26066134 0.00152028 0.121912749 0.500816721 0Perception of Communication Style 0.389764646 0.095491283 4.081677755 9.01011E-05 0.20031266 0.579216632

Analyses of Internal Consistency of Response Data
The analyses so far has focused on the relationship between variables, first for the
purposes of prediction and then to evaluate the strength of the prediction by assessing the
relationship among sub-variables. Now, this study will examine the internal consistency of the
response data. Internal consistency denotes a general agreement between multiple response
variables, especially those quantified through a Likert scale survey such as the one used in this
study. Consequently, Cronbach’s α will be used to test for irregularities in the response data.
Cronbach’s α is typically measured on a 0 to 1 scale in accordance with Table 20.
Quality of Relationship
Quality of Communication
Job Satisfaction
Willingness to Move
Identification with the Group
Quality of Relationship - - - - -Quality of Communication 4.580637927 - - - -Job Satisfaction 1.451835824 1.600165444 - - -Willingness to Move 1.004256861 1.007577906 1.056861539 - -Identification with the Group 1.669637670 1.661170787 1.364839800 1.044545662 -p < 0.05, n = 103
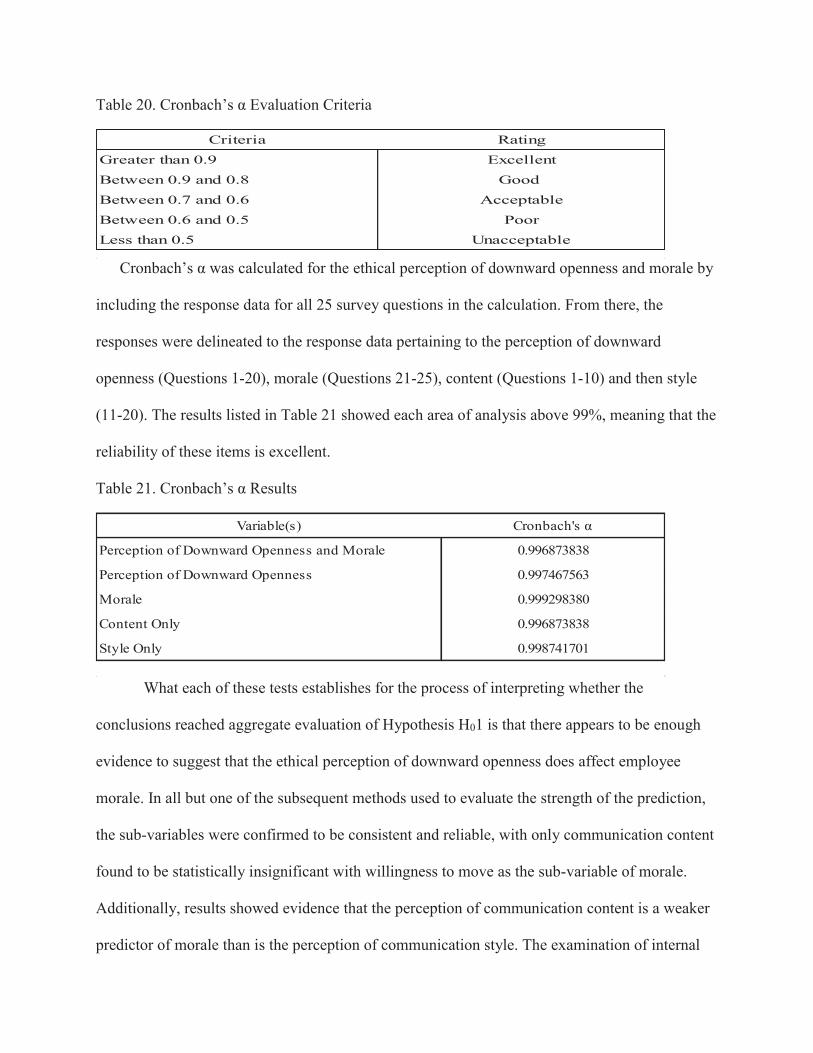
Table 20. Cronbach’s α Evaluation Criteria
Cronbach’s α was calculated for the ethical perception of downward openness and morale by
including the response data for all 25 survey questions in the calculation. From there, the
responses were delineated to the response data pertaining to the perception of downward
openness (Questions 1-20), morale (Questions 21-25), content (Questions 1-10) and then style
(11-20). The results listed in Table 21 showed each area of analysis above 99%, meaning that the
reliability of these items is excellent.
Table 21. Cronbach’s α Results
What each of these tests establishes for the process of interpreting whether the
conclusions reached aggregate evaluation of Hypothesis H01 is that there appears to be enough
evidence to suggest that the ethical perception of downward openness does affect employee
morale. In all but one of the subsequent methods used to evaluate the strength of the prediction,
the sub-variables were confirmed to be consistent and reliable, with only communication content
found to be statistically insignificant with willingness to move as the sub-variable of morale.
Additionally, results showed evidence that the perception of communication content is a weaker
predictor of morale than is the perception of communication style. The examination of internal
Criteria Rating
Greater than 0.9 Excellent
Between 0.9 and 0.8 Good
Between 0.7 and 0.6 Acceptable
Between 0.6 and 0.5 Poor
Less than 0.5 Unacceptable
Variable(s) Cronbach's α
Perception of Downward Openness and Morale 0.996873838
Perception of Downward Openness 0.997467563
Morale 0.999298380
Content Only 0.996873838
Style Only 0.998741701

consistency showed excellent reliability in the response data. From these findings, the tests
generally appear to confirm the existence of a significant relationship. However, the
identification of communication content as a weaker sub-variable of the perception of downward
openness is a noteworthy development. With this in mind, and considering these results still only
scratch the broader surface of the relationship between perceived downward openness and
employee morale, additional testing will arrange the data by question and reassess
communication content and communication style against each factor of employee morale.
Analyses of Inquiries
Regression analysis (Table 22) compared each of the inquiries of communication content
against quality of relationship as a sub-variable of morale. This initial reassessment identified
only reinforcement of good performance and stressing of happy interpersonal relationships as
significant at 0.000108912 and 0.0124854078, respectively. Furthermore, testing showed that for
every one-unit increase in the stressing of good performance and happy interpersonal
relationships, the quality of relationship increased by approximately 0.367769411 and
0.189710713, respectively.
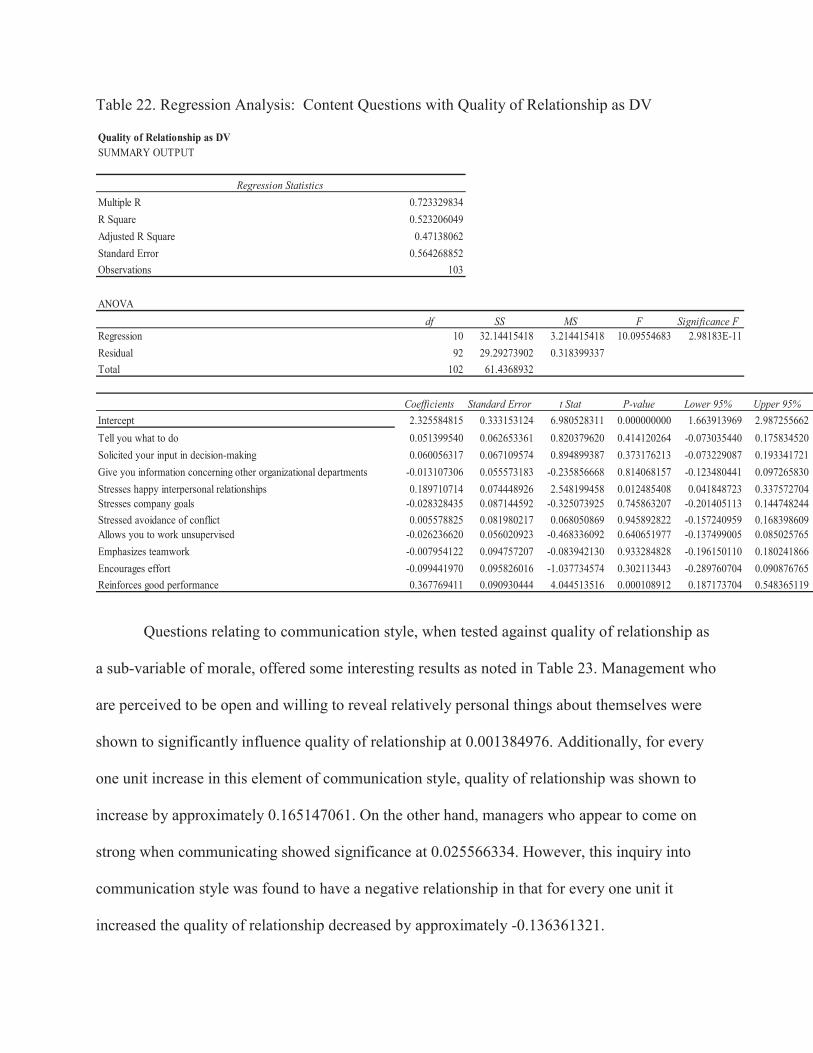
Table 22. Regression Analysis: Content Questions with Quality of Relationship as DV
Questions relating to communication style, when tested against quality of relationship as
a sub-variable of morale, offered some interesting results as noted in Table 23. Management who
are perceived to be open and willing to reveal relatively personal things about themselves were
shown to significantly influence quality of relationship at 0.001384976. Additionally, for every
one unit increase in this element of communication style, quality of relationship was shown to
increase by approximately 0.165147061. On the other hand, managers who appear to come on
strong when communicating showed significance at 0.025566334. However, this inquiry into
communication style was found to have a negative relationship in that for every one unit it
increased the quality of relationship decreased by approximately -0.136361321.
Quality of Relationship as DVSUMMARY OUTPUT
Regression StatisticsMultiple R 0.723329834R Square 0.523206049Adjusted R Square 0.47138062Standard Error 0.564268852Observations 103
ANOVAdf SS MS F Significance F
Regression 10 32.14415418 3.214415418 10.09554683 2.98183E-11Residual 92 29.29273902 0.318399337Total 102 61.4368932
Coefficients Standard Error t Stat P-value Lower 95% Upper 95%Intercept 2.325584815 0.333153124 6.980528311 0.000000000 1.663913969 2.987255662Tell you what to do 0.051399540 0.062653361 0.820379620 0.414120264 -0.073035440 0.175834520Solicited your input in decision-making 0.060056317 0.067109574 0.894899387 0.373176213 -0.073229087 0.193341721Give you information concerning other organizational departments -0.013107306 0.055573183 -0.235856668 0.814068157 -0.123480441 0.097265830Stresses happy interpersonal relationships 0.189710714 0.074448926 2.548199458 0.012485408 0.041848723 0.337572704Stresses company goals -0.028328435 0.087144592 -0.325073925 0.745863207 -0.201405113 0.144748244Stressed avoidance of conflict 0.005578825 0.081980217 0.068050869 0.945892822 -0.157240959 0.168398609Allows you to work unsupervised -0.026236620 0.056020923 -0.468336092 0.640651977 -0.137499005 0.085025765Emphasizes teamwork -0.007954122 0.094757207 -0.083942130 0.933284828 -0.196150110 0.180241866Encourages effort -0.099441970 0.095826016 -1.037734574 0.302113443 -0.289760704 0.090876765Reinforces good performance 0.367769411 0.090930444 4.044513516 0.000108912 0.187173704 0.548365119

Table 23. Regression Analysis: Style Questions with Quality of Relationship as DV
When assessing communication content against quality of communication (Table 24),
only managers who were perceived to reinforce good performance showed significance. In
addition to its high significance of 0.000000948, this inquiry also had a large influence on
quality of communication as a sub-variable of employee morale. Essentially, for every one unit
increase in a manager’s perceived reinforcement of good performance the quality of
communication increased by approximately 0.504832480.
Quality of Relationship as DVSUMMARY OUTPUT
Regression StatisticsMultiple R 0.739851557R Square 0.547380326Adjusted R Square 0.498182535Standard Error 0.549778083Observations 103
ANOVAdf SS MS F Significance F
Regression 10 33.62934664 3.362934664 11.12611601 3.23778E-12Residual 92 27.80754657 0.302255941Total 102 61.4368932
Coefficients Standard Error t Stat P-value Lower 95% Upper 95%Intercept 2.350503747 0.321789745 7.304470639 0.000000000 1.711401552 2.989605943Comes on strong when communicating with you -0.136361321 0.060080989 -2.269625080 0.025566334 -0.255687349 -0.017035292Shows concern for you 0.068965428 0.066746766 1.033239987 0.304200081 -0.063599408 0.201530265Is comfortable with you 0.039053653 0.097534316 0.400409358 0.689783320 -0.154657913 0.232765218Is quick to express disagreement 0.077079092 0.135190532 0.570151555 0.569964690 -0.191420968 0.345579152Are attentive 0.235896141 0.148614553 1.587301760 0.115875457 -0.059265182 0.531057464Communicates actively 0.146759443 0.116449231 1.260286915 0.210753133 -0.084518777 0.378037662Is open and willing to reveal relatively personal things about themselves 0.165147062 0.050073668 3.298081979 0.001384976 0.065696437 0.264597686Listens carefully -0.061978698 0.122675133 -0.505226251 0.614608141 -0.305622095 0.181664700Is friendly 0.026055097 0.120563932 0.216110215 0.829380282 -0.213395274 0.265505468Communicates dramatically -0.091634436 0.053378827 -1.716681335 0.089402519 -0.197649392 0.014380520

Table 24. Regression Analysis: Content Questions with Quality of Communication as DV
In Table 25, quality of communication was found to have a noteworthy relationship to
managers who are perceived to communicate actively, are open and willing to reveal relatively
personal things about themselves, and who come on strong when communicating with
employees. In that order, these questions into communication style have p-values of
0.005886761, 0.004523148, and 0.019377464, respectively. Superiors who were viewed as
communicating actively and who were thought to be open and willing to reveal relatively
personal things about themselves also had a positive influence on quality of communication at
0.349494472 and 0.155134725, respectively. In contrast, managers who were viewed as coming
on strong when communicating with employees had a negative impact on quality of
communication at -0.152199320.
Quality of Communication as DVSUMMARY OUTPUT
Regression StatisticsMultiple R 0.757653817R Square 0.574039307Adjusted R Square 0.527739231Standard Error 0.595992438Observations 103
ANOVAdf SS MS F Significance F
Regression 10 44.03940391 4.403940391 12.39823699 2.38169E-13Residual 92 32.67904269 0.355206986Total 102 76.7184466
Coefficients Standard Error t Stat P-value Lower 95% Upper 95%Intercept 1.984877807 0.351883224 5.640728724 0.000000185 1.286007367 2.683748247Tell you what to do 0.065151805 0.066175776 0.984526495 0.327438847 -0.066278996 0.196582606Solicited your input in decision-making 0.007584312 0.070882521 0.106998342 0.915023278 -0.133194490 0.148363114Give you information concerning other organizational departments 0.081026695 0.058697546 1.380410273 0.170805203 -0.035551695 0.197605084Stresses happy interpersonal relationships 0.070187963 0.078634497 0.892584890 0.374408286 -0.085986931 0.226362858Stresses company goals 0.051722650 0.092043922 0.561934450 0.575527175 -0.131084519 0.234529820Stressed avoidance of conflict -0.029720209 0.086589202 -0.343232279 0.732206811 -0.201693834 0.142253416Allows you to work unsupervised -0.048860235 0.059170458 -0.825753884 0.411079935 -0.166377869 0.068657398Emphasizes teamwork -0.069950435 0.100084523 -0.698913610 0.486369163 -0.268726932 0.128826062Encourages effort -0.060147385 0.101213421 -0.594262940 0.553794821 -0.261165971 0.140871201Reinforces good performance 0.504832480 0.096042617 5.256338238 0.000000948 0.314083557 0.695581403

Table 25. Regression Analysis: Style Questions with Quality of Communication as DV
In Table 26, job satisfaction showed significance with reinforces good performance and
stresses avoidance of conflict as indicators of communication content. Reinforces good
performance had a p-value of 0.015097595, while stresses avoidance of conflict had a p-value of
0.048466090. Furthermore, for every one-unit increase in the perception that management
reinforces good performance, employee job satisfaction increased by 0.285400894. Similarly,
perceived stressing avoidance of conflict increased job satisfaction by 0.207788738. However,
regression analyses as shown in Table 27 found every inquiry into communication style
insignificant when tested against job satisfaction as a sub-variable of morale.
Table 26. Regression Analysis: Content Questions with Job Satisfaction as DV
Quality of Communication as DVSUMMARY OUTPUT
Regression StatisticsMultiple R 0.767693687R Square 0.589353597Adjusted R Square 0.544718118Standard Error 0.585180706Observations 103
ANOVAdf SS MS F Significance F
Regression 10 45.21429243 4.521429243 13.20370286 4.89141E-14Residual 92 31.50415417 0.342436458Total 102 76.7184466
Coefficients Standard Error t Stat P-value Lower 95% Upper 95%Intercept 1.952198587 0.342511199 5.699663529 0.000000144 1.271941798 2.632455377Comes on strong when communicating with you -0.152199320 0.063949868 -2.379978648 0.019377464 -0.279209275 -0.025189365Shows concern for you 0.128899348 0.071044883 1.814336821 0.072885245 -0.012201920 0.270000616Is comfortable with you 0.078105586 0.103814978 0.752353727 0.453759032 -0.128079917 0.284291088Is quick to express disagreement 0.042078954 0.143896043 0.292426066 0.770619352 -0.243711002 0.327868910Are attentive 0.146452330 0.158184496 0.925832391 0.356955367 -0.167715725 0.460620385Communicates actively 0.349494472 0.123947908 2.819688341 0.005886761 0.103323233 0.595665711Is open and willing to reveal relatively personal things about themselves 0.155134725 0.053298131 2.910697277 0.004523148 0.049280039 0.260989411Listens carefully -0.008782584 0.130574723 -0.067260985 0.946519896 -0.268115249 0.250550080Is friendly -0.054992609 0.128327573 -0.428533074 0.669264729 -0.309862240 0.199877022Communicates dramatically -0.111733066 0.056816124 -1.966573189 0.052246133 -0.224574790 0.001108658

Job Satisfaction as DVSUMMARY OUTPUT
Regression StatisticsMultiple R 0.567762635R Square 0.32235441Adjusted R Square 0.24869728Standard Error 0.715158879Observations 103
ANOVAdf SS MS F Significance F
Regression 10 22.38328872 2.238328872 4.37641831 5.04152E-05Residual 92 47.05360448 0.511452223Total 102 69.4368932
Coefficients Standard Error t Stat P-value Lower 95% Upper 95%Intercept 2.793707144 0.422240948 6.616381374 0.000000002 1.955100194 3.632314094Tell you what to do -0.106525331 0.079407373 -1.341504273 0.183058867 -0.264235225 0.051184563Solicited your input in decision-making -0.010230608 0.085055214 -0.120281960 0.904522086 -0.179157601 0.158696385Give you information concerning other organizational departments -0.015868204 0.070433899 -0.225292145 0.822251697 -0.155756003 0.124019595Stresses happy interpersonal relationships -0.048794058 0.094357168 -0.517120847 0.606312842 -0.236195534 0.138607417Stresses company goals -0.001267930 0.110447757 -0.011479910 0.990865416 -0.220626704 0.218090843Stressed avoidance of conflict 0.207788738 0.103902386 1.999845674 0.048466090 0.001429635 0.414147841Allows you to work unsupervised -0.067555248 0.071001368 -0.951464042 0.343861856 -0.208570090 0.073459593Emphasizes teamwork 0.053436261 0.120096046 0.444946049 0.657403834 -0.185084847 0.291957370Encourages effort 0.048764131 0.121450663 0.401513911 0.688972942 -0.192447363 0.289975625Reinforces good performance 0.285400894 0.115245976 2.476449966 0.015097595 0.056512443 0.514289345
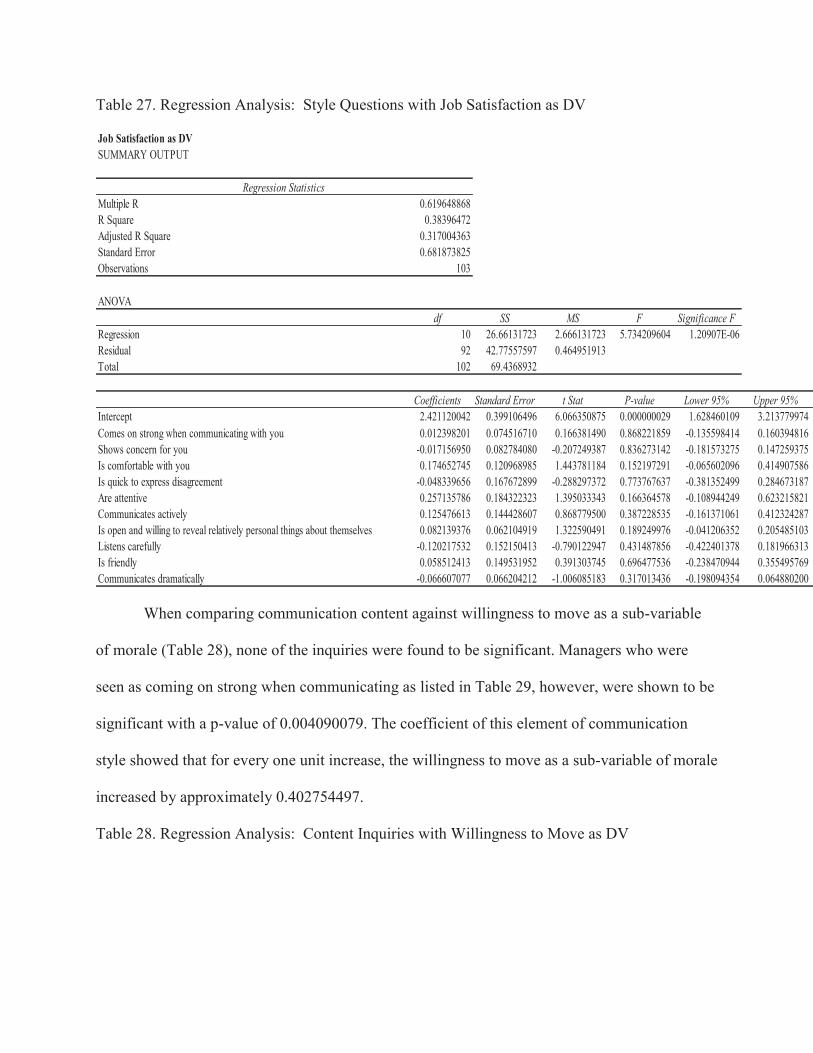
Table 27. Regression Analysis: Style Questions with Job Satisfaction as DV
When comparing communication content against willingness to move as a sub-variable
of morale (Table 28), none of the inquiries were found to be significant. Managers who were
seen as coming on strong when communicating as listed in Table 29, however, were shown to be
significant with a p-value of 0.004090079. The coefficient of this element of communication
style showed that for every one unit increase, the willingness to move as a sub-variable of morale
increased by approximately 0.402754497.
Table 28. Regression Analysis: Content Inquiries with Willingness to Move as DV
Job Satisfaction as DVSUMMARY OUTPUT
Regression StatisticsMultiple R 0.619648868R Square 0.38396472Adjusted R Square 0.317004363Standard Error 0.681873825Observations 103
ANOVAdf SS MS F Significance F
Regression 10 26.66131723 2.666131723 5.734209604 1.20907E-06Residual 92 42.77557597 0.464951913Total 102 69.4368932
Coefficients Standard Error t Stat P-value Lower 95% Upper 95%Intercept 2.421120042 0.399106496 6.066350875 0.000000029 1.628460109 3.213779974Comes on strong when communicating with you 0.012398201 0.074516710 0.166381490 0.868221859 -0.135598414 0.160394816Shows concern for you -0.017156950 0.082784080 -0.207249387 0.836273142 -0.181573275 0.147259375Is comfortable with you 0.174652745 0.120968985 1.443781184 0.152197291 -0.065602096 0.414907586Is quick to express disagreement -0.048339656 0.167672899 -0.288297372 0.773767637 -0.381352499 0.284673187Are attentive 0.257135786 0.184322323 1.395033343 0.166364578 -0.108944249 0.623215821Communicates actively 0.125476613 0.144428607 0.868779500 0.387228535 -0.161371061 0.412324287Is open and willing to reveal relatively personal things about themselves 0.082139376 0.062104919 1.322590491 0.189249976 -0.041206352 0.205485103Listens carefully -0.120217532 0.152150413 -0.790122947 0.431487856 -0.422401378 0.181966313Is friendly 0.058512413 0.149531952 0.391303745 0.696477536 -0.238470944 0.355495769Communicates dramatically -0.066607077 0.066204212 -1.006085183 0.317013436 -0.198094354 0.064880200

Willingness to Move as DVSUMMARY OUTPUT
Regression StatisticsMultiple R 0.369072385R Square 0.136214425Adjusted R Square 0.042324689Standard Error 1.362320633Observations 103
ANOVAdf SS MS F Significance F
Regression 10 26.92549219 2.692549219 1.450791432 0.170989591Residual 92 170.7444107 1.855917508Total 102 197.6699029
Coefficients Standard Error t Stat P-value Lower 95% Upper 95%Intercept 2.638033153 0.804335333 3.279767832 0.001467904 1.040553789 4.235512517Tell you what to do -0.206487035 0.151264714 -1.365070744 0.175559776 -0.506911807 0.093937736Solicited your input in decision-making 0.239821115 0.162023400 1.480163455 0.142246063 -0.081971335 0.561613565Give you information concerning other organizational departments -0.070580895 0.134170960 -0.526051950 0.600117938 -0.337055996 0.195894206Stresses happy interpersonal relationships 0.259844180 0.179742880 1.445643803 0.151675077 -0.097140686 0.616829047Stresses company goals 0.052196992 0.210394169 0.248091438 0.804616569 -0.365663978 0.470057962Stressed avoidance of conflict -0.006143760 0.197925760 -0.031040728 0.975304300 -0.399241395 0.386953875Allows you to work unsupervised -0.076962021 0.135251943 -0.569027102 0.570724336 -0.345584049 0.191660006Emphasizes teamwork 0.021980092 0.228773391 0.096078009 0.923667594 -0.432383598 0.476343782Encourages effort 0.229587757 0.231353827 0.992366366 0.323621734 -0.229900903 0.689076417Reinforces good performance -0.244047145 0.219534394 -1.111657906 0.269181895 -0.680061392 0.191967102
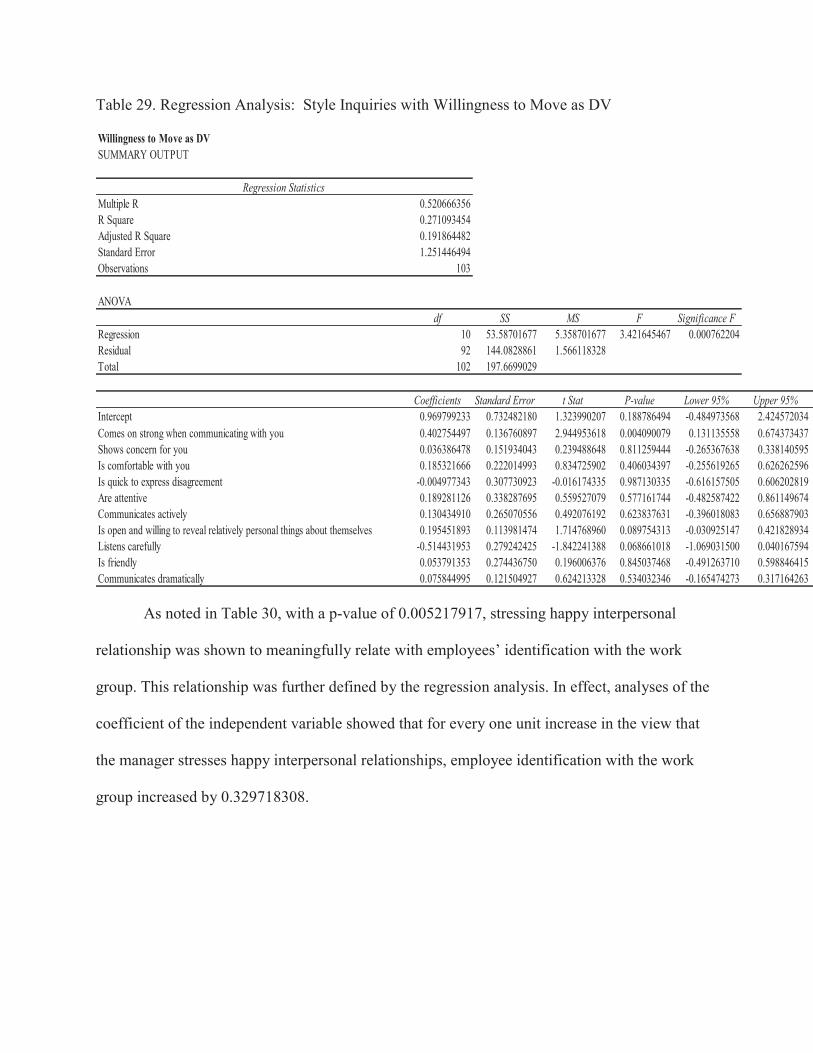
Table 29. Regression Analysis: Style Inquiries with Willingness to Move as DV
As noted in Table 30, with a p-value of 0.005217917, stressing happy interpersonal
relationship was shown to meaningfully relate with employees’ identification with the work
group. This relationship was further defined by the regression analysis. In effect, analyses of the
coefficient of the independent variable showed that for every one unit increase in the view that
the manager stresses happy interpersonal relationships, employee identification with the work
group increased by 0.329718308.
Willingness to Move as DVSUMMARY OUTPUT
Regression StatisticsMultiple R 0.520666356R Square 0.271093454Adjusted R Square 0.191864482Standard Error 1.251446494Observations 103
ANOVAdf SS MS F Significance F
Regression 10 53.58701677 5.358701677 3.421645467 0.000762204Residual 92 144.0828861 1.566118328Total 102 197.6699029
Coefficients Standard Error t Stat P-value Lower 95% Upper 95%Intercept 0.969799233 0.732482180 1.323990207 0.188786494 -0.484973568 2.424572034Comes on strong when communicating with you 0.402754497 0.136760897 2.944953618 0.004090079 0.131135558 0.674373437Shows concern for you 0.036386478 0.151934043 0.239488648 0.811259444 -0.265367638 0.338140595Is comfortable with you 0.185321666 0.222014993 0.834725902 0.406034397 -0.255619265 0.626262596Is quick to express disagreement -0.004977343 0.307730923 -0.016174335 0.987130335 -0.616157505 0.606202819Are attentive 0.189281126 0.338287695 0.559527079 0.577161744 -0.482587422 0.861149674Communicates actively 0.130434910 0.265070556 0.492076192 0.623837631 -0.396018083 0.656887903Is open and willing to reveal relatively personal things about themselves 0.195451893 0.113981474 1.714768960 0.089754313 -0.030925147 0.421828934Listens carefully -0.514431953 0.279242425 -1.842241388 0.068661018 -1.069031500 0.040167594Is friendly 0.053791353 0.274436750 0.196006376 0.845037468 -0.491263710 0.598846415Communicates dramatically 0.075844995 0.121504927 0.624213328 0.534032346 -0.165474273 0.317164263

Table 30. Regression Analysis: Content Inquiries with Identification with the Group as DV
Communication style identified three areas of significance when compared to
identification with the work group (Table 31). The perception that the manager is comfortable
with employees was found to be significant at 0.016271730. Similarly, management’s openness
and willingness to reveal relatively personal things about themselves and their showing concern
for the employee was validated as significant at 0.001567956 and 0.020050689, correspondingly.
The query related to how the manager is comfortable with employees had a coefficient of
0.356627676. Similarly, the perception of management openness and willingness to reveal
relatively personal things about themselves had a positive coefficient of 0.243764062 and
0.235958781, respectively.
Identification with the Group as DVSUMMARY OUTPUT
Regression StatisticsMultiple R 0.620101039R Square 0.384525298Adjusted R Square 0.317625874Standard Error 0.873300312Observations 103
ANOVAdf SS MS F Significance F
Regression 10 43.83588402 4.383588402 5.747811788 1.16587E-06Residual 92 70.16411598 0.762653435Total 102 114
Coefficients Standard Error t Stat P-value Lower 95% Upper 95%Intercept 1.921880178 0.515610114 3.727390376 0.000333890 0.897834009 2.945926348Tell you what to do -0.124609320 0.096966543 -1.285075415 0.201991791 -0.317193239 0.067974599Solicited your input in decision-making 0.077942425 0.103863277 0.750432947 0.454908995 -0.128339004 0.284223854Give you information concerning other organizational departments 0.028152280 0.086008784 0.327318663 0.744170497 -0.142668585 0.198973145Stresses happy interpersonal relationships 0.329718308 0.115222151 2.861587868 0.005217917 0.100877177 0.558559439Stresses company goals -0.209681536 0.134870814 -1.554684287 0.123454750 -0.477546609 0.058183537Stressed avoidance of conflict 0.100509453 0.126878081 0.792173491 0.430297433 -0.151481363 0.352500268Allows you to work unsupervised 0.101354115 0.086701736 1.168997529 0.245424636 -0.070843013 0.273551243Emphasizes teamwork 0.052980170 0.146652608 0.361263064 0.718731102 -0.238284560 0.344244901Encourages effort -0.003672454 0.148306768 -0.024762555 0.980297990 -0.298222490 0.290877581Reinforces good performance 0.208020641 0.140730053 1.478153649 0.142782197 -0.071481385 0.487522668

Table 31. Regression Analysis: Style Inquiries with Identification with the Group as DV
Summary
The analyses performed in this chapter (Results) identified the results of the statistical
examinations performed. The final chapter of this study will frame the data and discuss the
relationship between the variables tested above. Finally, some broader implications will be
discussed in an attempt to highlight potential areas of future research. In this way, Chapter 5:
Discussion seeks to use the results detailed in this chapter to provide a comprehensive dialogue
into the relationship between the ethical perception of downward openness and employee
morale.
Identification with the Group as DVSUMMARY OUTPUT
Regression StatisticsMultiple R 0.675062483R Square 0.455709356Adjusted R Square 0.396547329Standard Error 0.821247285Observations 103
ANOVAdf SS MS F Significance F
Regression 10 51.95086659 5.195086659 7.702734048 7.77031E-09Residual 92 62.04913341 0.674447102Total 102 114
Coefficients Standard Error t Stat P-value Lower 95% Upper 95%Intercept 1.414676643 0.480682957 2.943055549 0.004113036 0.459998822 2.369354464Comes on strong when communicating with you -0.058742502 0.089747756 -0.654528922 0.514404103 -0.236989289 0.119504285Shows concern for you 0.235958781 0.099704958 2.366570186 0.020050689 0.037936133 0.433981429Is comfortable with you 0.356627676 0.145694771 2.447772651 0.016271730 0.067265291 0.645990060Is quick to express disagreement 0.210069544 0.201944858 1.040232199 0.300958099 -0.191010367 0.611149455Are attentive 0.182796577 0.221997387 0.823417697 0.412399905 -0.258109385 0.623702539Communicates actively 0.073527039 0.173949486 0.422691902 0.673506387 -0.271951647 0.419005725Is open and willing to reveal relatively personal things about themselves 0.243764062 0.074799024 3.258920374 0.001567956 0.095206748 0.392321376Listens carefully -0.342465923 0.183249611 -1.868849388 0.064825482 -0.706415460 0.021483613Is friendly -0.052127917 0.180095943 -0.289445260 0.772891947 -0.409813996 0.305558162Communicates dramatically -0.138105401 0.079736203 -1.732028818 0.086619946 -0.296468379 0.020257577

Chapter V
DISCUSSION
Overview
The purpose of this study was to explore a seemingly unconsidered element of operations
in order to aid public sector organizations in their ongoing attempts to attain cost optimization
leading to good governance. This element was identified specifically as the ethical perception of
downward openness in employer to employee communications and its relationship to employee
morale. Ethical perception was equated broadly to the manner in which an employee ethically
encodes a message, while downward openness was defined as information communicated to
employees by their direct-report supervisors. In addition, morale was used to symbolize an innate
characteristic of human cognition that influences motivation and ultimately drives organizational
behavior.
Within this framework of understanding, factors that influence morale and motivation as
well as different aspects of the communication process had to be identified and statistically
defined in order to produce conclusive results that would be beneficial to public sector
administrators. Methodologies to gather and analyze data had to be carefully selected to produce
quantifiable results. Chapter 3, the methodology portion of this case study, provided the
exploration and detail of how these procedures were chosen and utilized, while Chapter 4:
Results explored the findings, with highlights detailing the intricacies involved in the testing and
analyses. Specific emphasis was placed on the aggregate analyses, which showed representative
and conclusive findings that a
significant relationship exists between the perception of downward openness and employee
morale. Special notation was also included regarding subsequent statistical observations, which
highlighted some divergences in the sub-variable data.
In discussion of these findings, the following sections explain the mechanism of data
collection and provide analysis of the statistical results that clearly show the relationship between
the ethical perception of downward openness and morale as posed in the initial hypothesis of this
study (Ha1). Furthermore, assessments of the reliability and internal consistency of the sub-
variable data used, the answering of the hypothesis, and the validation of the integrity of the
survey data collected in this study are explored. Both the significant findings and the noted
divergences play an important part in the results of this study as these pieces combine to produce
conclusive insights into the relationship between the perception of downward openness and
morale. Subsequently, this project identified a potential area of importance in terms of how
public sector managers optimize communication with their employees to maximize efficiency.
This examination of the broader implications of this research provide useful and actionable
information, which could well benefit both current public sector managers as well as future
scholars exploring similar fields of research.
Limitations
It should be noted that this research offers only a circumscribed extension of previous
work, not the final word on this topic. Moreover, the data collected for this study comes from a
sample size of 103 respondents. These margins are compounded further by the fact that only one
public sector organization was surveyed. Due to these limitations, several criteria were establish
to ensure the organization fit the public nature of the study. For example, the location of the
organization chosen for this study was required to fit a geographical area demographically

symbolic of the United States and the State of Georgia. Additionally, the organization had to be
representative of the broader public sector and structured similarly to most public sector
organizations. Even so, the criteria established for this purpose was restricted to its ability to
provide useful inference linking the case used for this study to the public sector.
Framing the Data
As discussed in earlier chapters of this study, the data collected for this dissertation came
from a survey that was originally developed and statistically verified by John E. Baird and
Patricia H. Bradley in the research article Communication Correlates of Employee Morale.
Although the survey remained mostly unchanged, the intent and method of analysis used in this
study was distinct. Where Baird and Bradley sought to assess the relationships among the
individual dimensions of managerial communication and employee satisfaction, this study
pursued a broader question into the relationship between the variables. In effect, the survey used
in Communication Correlates of Employee Morale statistically evaluated the positive or negative
correlation between each communication question against each inquiry into morale, while this
study expanded those validated relationships to a broader investigation into the human
psychological elements of public sector operations. Despite the variance in research focus, its
applicability into the relationship between perceived downward openness and morale made the
survey similarly ideal for this project.
More specifically, survey questions 1 through 10 explored perceived openness in
communication as the range of functions associated with managerial communication. In so
doing, these questions identified the level to which employees believed their supervisor does the
following: tells them what to do; includes them in the decision-making process; gives them
information concerning other organizational departments; stresses happy interpersonal

relationships; stresses company goals and avoidance of conflict; allows them to work
unsupervised; emphasizes teamwork; and encourages effort and reinforces good performance.
The next ten questions gave emphasis to communication style, with importance placed on how
superior to subordinate messages are conveyed. These questions identify how employees
perceive messages coming from their manager by assessing how strong the message is
communicated; how much concern the manager shows for the employee; the comfortability of
the supervisor with the subordinate; how quickly the manager is to express disagreement; the
boss’ attentiveness; how actively the message is communicated; how open and willing the
supervisor is to reveal relatively personal things about him or herself; how carefully the leader
listens; the supervisor’s friendliness and the level to which he or she communicates dramatically
with the employee. By comparing these range of functions with quality of relationship, quality of
communication, job satisfaction, willingness to move, and identification with the group as the
five sub-variables of employee morale, this survey proved ideal for assessing this project’s
inquiry into the relationship between the perception of downward openness and morale.
The Relationship between the Ethical Perception of Downward Openness and Morale
The initial techniques used in the primary analysis of this study focused on the ethical
perception of downward openness and employee morale as aggregate variables. The evaluation
framed the data to the study by examining key demographic statistics, which confirmed the
representativeness of the data to the surveyed population and ultimately to the public sector.
Further analyses led to a solid statistical confirmation of a significant linear relationship between
the ethical perception of downward openness and employee morale. In accordance with earlier
examinations within this study that linked behavior to the attainment of cost optimization leading
to good governance, this finding further emphasized cognition as an operational mechanism of

organizational success. However, the stated limitations raised some concerns about the
dependability of the analyses. As a result, the perception of downward openness and morale were
broken into sub-variables, as delineated in the survey, and retested. The following sections
provide a detailed and substantive valuation of the conclusions reached in the sub-variable
assessment.
Communication Content and Style as Sub-variables of Downward Openness
The survey used for this study identified communication content and communication
style as the two sub-variables of the ethical perception of downward openness. Therefore, to
assess the reliability of the aggregate findings, both of these sub-variables were tested for
generalizability to the public sector. The assessment determined similarity and consistency with
the aggregate findings. Additional analysis showed that each sub-variable maintained a
statistically significant linear relationship with employee morale. However, when compared
against one another, communication content was consistently shown to have less influence on
morale than communication style. In effect, this finding suggests that the manner in which a
message is conveyed is more important than the message itself. Yet before making any
additional assumptions, a more detailed analysis comparing the sub-variables of perceived
downward openness against the sub-variables of morale is necessary.
The Relationship between Communication Content and Style and the Sub-variables of Morale
Statistics showed that each of the five sub-variables of morale were generalizable to its
surveyed population. Ensuing analysis evaluated communication content and communication
style against quality of relationship, quality of communication, job satisfaction, willingness to
move, and identification with the group as the five sub-variables of morale. Similar to its
comparison with morale as an aggregate variable, communication content was found to be

statistically less significant than communication style when compared against every sub-variable
of morale. These results seem to endorse further the preference of manner over message in
downward communication. Another pattern of potential importance was identified with
willingness to move. Analyses identified this sub-variable of morale as having the weakest
correlation, influence, and significance when compared against communication content and
style. Given the stated weakness of willingness to move, it is not surprising that is was found to
be insignificant when compared against communication content.
Quality of Relationship and the Inquiries into Content and Style
As defined earlier in this project, the quality of a subordinate's relationship with his or her
supervisor is influenced by managerial communication behaviors. Therefore is not surprising that
the content and style sub-variables of downward communication, when related to the quality of
relationship, were found to be more personal in nature. Of the inquiries into downward openness,
only managers who reinforce good performance, stress happy interpersonal relationships, and are
open and willing to reveal relatively personal things about themselves showed a significantly
higher quality relationship with subordinates. In contrast, managers who come on strong when
communicating seem to harm significantly the quality of that relationship. These results appear
to place emphasis on the emotional aspects of superior to subordinate communication. In so
doing, these findings highlight the important aspects of relationship building in organizational
settings, with additional emphasis placed on how the subordinate emotionally identifies with the
manager.
Quality of Communication and the Inquiries into Content and Style
Quality of communication in superior to subordinate communication describes the value
that exists in a message. Managers who reinforce good performance were shown to have a

positive effect on quality of communication. In addition, managers who demonstrate an active
communication style and who are open and willing to reveal relatively personal things about
themselves were shown to have value in their message. On the other hand, managers who come
on strong had a negative influence on communication quality. On the surface, these results show
some similarly with the findings outlined in the previous section. Certainly, this is to be expected
when assessing the quality aspects of a thing. However, quality of communication within the
context of this comparison appears to shift slightly away from the personal sentiment associated
with the communicator to the quality of the rhetoric associated with the message itself.
Job Satisfaction and the Inquiries into Content and Style
An employee’s job satisfaction is often determined by an employee’s perceived level of
oversight coming from his or her manager. Yet, analysis for this study did not find a significant
relationship between job satisfaction and management allowing employees to work
unsupervised. Moreover, this sub-variable of morale was found to be insignificant when
compared against every question related to communication style. Instead, job satisfaction related
positively to stresses avoidance of conflict and reinforces good performance. Certainly, these
queries make sense as they allow managers to side step the traditional more directive type of
oversight techniques yet, still somewhat control employee emotions and behaviors they see as
conducive to success. However, given the traditional view that job satisfaction is determined by
level of oversight, as discussed in the first sentence of this paragraph and in earlier sections of
this project, the failure to link job satisfaction with employees who believe they are allowed to
work unsupervised is nonetheless surprising. Although the reason for this potential inconsistency
is not made clear in this study, one plausible explanation could equate it to the limitations of this
study discussed above.

Willingness to Move and the Inquiries into Content and Style
Willingness to move is described as the level of cohesiveness that exists in a workgroup.
Within this context, a high willingness to move is linked to low cohesiveness and a low
willingness to move is related to high group cohesiveness. Management coming on strong when
communicating, as an inquiry into communication style, was shown to be the only indicator of
willingness to move. In this way, this finding discards any potential significance in the questions
that make up communication content and instead links group cohesiveness solely with the level
of perceived pleasantness in the style of manager’s communication.
Identification with the Group and the Inquiries into Content and Style
Identification with the work group measures the extent to which each employee identifies
with his or her work group. In this manner, this sub-variable of employee morale is similarly
associated with group cohesiveness. Yet with identification with the work group, managers who
stress happy interpersonal relationships appear to facilitate an environment where workers
identify with their coworkers. Moreover, managers who appear comfortable with their
subordinates, who are open and willing to reveal relatively personal things about themselves, and
who show concern seem to have an influence on group identity. Again, the nature of these
findings seem to focus on the emotional aspects of how downward openness is perceived.
Broader Implications
Results identified and validated a significant relationship between the perception of
downward openness and employee morale. In addition, this research implicated several broader
areas of focus that current and future researchers may want to explore. Managerial
communication, for example, which involves traditional methods of encoding a message might
be improved upon by shifting emphasis away from a one-size fits all approach to one that

considers how each individual employee decodes the message. Although this broader implication
is inferring change, it is not suggesting a complete transformation from traditional
communication methodologies. Instead, it is suggesting the potential need for a tailored approach
to communication in organizational areas where morale is a driver of efficiency. This theory can
seemingly be compared to the paradigm shift that took place during the early twentieth century
when organizational scholarship helped evolve time and motion type processes to those that
considered cognition as an operational mechanism of efficiency. Consequently, successful
organizations that required more superior to subordinate communication aligned its strategy with
the behavioral science methodology, while organizations involving processes that required very
little downward communication remained relatively unchanged. In similar fashion, this paradigm
shift is no more universally applicable today than it was then.
Conclusion
At the heart of this study was the inquiry into the relationship between the perception of
downward openness and employee morale. Within this context, perception was reasoned to be
both a malleable and powerful indicator of human and organizational behavior. Just as strong
leaders have historically demonstrated the ability to conform society to their ideologies, ethical
and motivation theorists have placed emphasis on the importance of managing human cognition
in the workplace. From this reasoning, the concept of morale emerged as a potentially powerful
indicator of organizational behavior. Within this context of understanding, communication was
explored as a potential determinant of employee morale. Data collected and used in this study
was predicated on exploring this relationship with findings emphasizing the importance of
employee perception as an operational mechanism of organizational success. In that way, this
dissertation provides some interesting observations for public sector leaders seeking to obtain
good governance through effective management of employee morale.
BIBLIOGRAPHY
2010. “10 Warning Signs of Low Morale ... and 7 Ways to Boost It.” HR Specialist, 8, no. 6: 6.
2011. “Bad Morale Rears its Head.” Managing People at Work, no. 354: 3.
2012. “Taking Further Action to Better Determine Causes of Morale Problems Would Assist in
Targeting Action Plans.” GAO Reports, 1-75.
2013. “Employee Morale.” Supervision, 74. no. 6: 26.
Achor, Shawn. 2010. The Happiness Advantage: The Seven Principles of Positive Psychology
That Fuel Success and Performance at Work. N.Y.: Crown Business.
Allen, P. T. 1982. “Size of Workforce, Morale and Absenteeism: A Re-Examination.” British
Journal of Industrial Relations, 20. no. 1: 83-100.
Baehr, Melany E., and Richard Renck. 1958. “The Definition and Measurement of Employee
Morale.” Administrative Science Quarterly, 3 no. 2: 157-184.
Baird, John E., and Patricia H. Bradley. 1978. “Communication Correlates of Employee
Morale.” Journal of Business Communication, 15 no. 3: 47-56.
Banerjee, Arindam. 2011. “Stress and Morale of Management Students during the Recession
Period.” IUP Journal of Management Research, 10, no. 4: 58-67.
Baradat, Leon P. 2012. Political Ideologies: Their Origins and Impact, 11th ed. Boston:
Longman.
Bowles, David and Cooper, Cary. 2010. Morale, Engagement and the Future of Capitalism.
Palgrave Macmillan: Macmillan Publishers Limited.
http://davidbowles.wordpress.com/tag/happiness-and-morale (March 1, 2015).
Buchanan, James. M., and Tullock, Gordon. 1962. The Calculus of Consent. Ann Arbor:
University of Michigan Press.
Cameuer, Colin F. and George Loewenstein. 2004. Behavioral Economies: Past, Present,
Future. Princeton: Princeton University Press.
Chiesa, M, and S Hobbs. 2008. “Making Sense of Social Research: How Useful is the
Hawthorne Effect?” European Journal of Social Psychology, 38, no. 1: 67-74.
Chow Hou, Wee. 1994. “Managing Change: Perspectives from Sun Tzu's Art of War.” Journal
of Strategic Change, 3, no. 4: 189-199.
Davies, John B., and Frederick Rotgers. 2009. “Disclosure in the Best Interests of Science? Or
Moral Crusade?” Addiction, 104, no. 11: 1787-1788.
DeLonzor, Diana. 2005. “Running Late.” HR Magazine, 50, no. 11: 109-112.
Diacon, Paula-Elena, Gabriel-Andrei DONICI, and Liviu-George MAHA. “Perspectives of
Economics – Behavioural Economics.” Theoretical & Applied Economics, 20, no. 7 (July
2013): 27-32.
Eisenberg, Eric M., and Marsha G. Witten. 1987. “Reconsidering Openness in Organizational
Communication.” Academy Of Management Review, 12, no. 3: 418-426.
Fehr, Ernst, and Klaus M. Schmidt. 1999. “A Theory of Fairness, Competition, and
Cooperation.” Quarterly Journal of Economics, 817-868.
Harriman, Edward A. 1916. The Development of Administrative Law in the United States. Yale
Law Journal, 25(8): 658–65.
Hayyat Malik, Sikandar. 2012. “A Study of Relationship between Leader Behaviors and
Subordinate Job Expectancies: A Path-Goal Approach.” Pakistan Journal of Commerce
& Social Sciences, 6, no. 2: 357-371.

Hausman, Daniel M. 2008. “Fairness and Social Norms.” Philosophy of Science, 75, no. 5: 850-
860.
Hu, Li, Feng Zhiyu, Liu Chunlin, and Cheng Dejun. 2014. “The Impact of Relative Leader-
Member Exchange on Employees' Work Behaviors as Mediated by Psychological
Contract Fulfillment.” Social Behavior & Personality: An International Journal, 42, no.
1: 79-88.
International Reference Group. 2013. “Good Governance in the Public Sector: Consultation
Draft for an International Framework.”
http://www.ifac.org/sites/default/files/publications/files/Good-Governance-in-the-Public-
Sector.pdf (February 29, 2015).
Islam, Saif ul, and Nazim Ali. 2013. “Motivation-Hygiene Theory: Applicability on Teachers.”
Journal of Managerial Sciences, 7, no. 1: 87-104.
Johnson, Craig E. 2007. Ethics in the Workplace: Tools and Tactics for Organizational
Transformation. Thousand Oaks, CA: Sage Publications. 335 pages.
Jose, Joby, N. Panchanatham, and R. Manigandan. 2013. “Influencers' of Employee Morale.”
Golden Research Thoughts, 3, no. 1: 1-3.
Kae H., Chung. 1969. “Toward a General Theory of Motivation and Performance.” California
Management Review, 11, no. 3: 81-88.
Kant, Immanuel. 1995. “What Is Enlightenment?” In the Portable Enlightenment Reader, ed.
Isaac Kramnick. New York: Penguin.
Keller, Heather R. “Communication.” Leadership Excellence, 26, no. 3 (March 2009). 13.
Lee, Cheu-Jey George. 2012. “Reconsidering Constructivism in Qualitative Research.”
Educational Philosophy and Theory, 44, no. 4: 403-412.

Locke, E. A. 1968. “Toward a Theory of Task Motivation and Incentives:” Organizational
Behavior and Human Performance, 3(2), 157-189.
MacRury, King. 1949. “Discussions and Communications - Employee Morale: Analyses of
Absence Records and Opinion Polls.” Industrial & Labor Relations Review, 2, no. 2:
237-247.
Miles, Caroline. 2005. “Faulkner and the Great Depression: Aesthetics, Ideology, and Cultural
Politics.” Mississippi Quarterly, 59, no. 1/2: 376-379.
Mtanga, Noor, Fullerton Nancy, Nophaket Chalumporn, and Irene MacCallum. 2010. “How
Does Low Employee Morale Affect an Organization, and what can a Communicator do
to Overcome It?” Communication World, 27, no. 2: 13.
Murray, Henry A. et al. 1961. “Cultural Evolution as Viewed by Psychologists.” Daedalus,
90(3), 570-586.
Musser, George. 2012. “A New Enlightenment.” Scientific American, 307, no. 5: 76-81.
Nielsen, Arne P. 2009. “Ethics in the Workplace: Tools and Tactics for Organizational
Transformation.” Journal of Applied Christian Leadership, 3, no. 2: 78-83.
Nolan, Joseph. 1995. “Adam Smith's Free Market Capitalism.” Vital Speeches of the Day, 61, no.
6: 183-187.
Ott, J. Steven, Sandra J. Parkes, & Richard B. Simpson. Eds. 2008. Classic Readings in
Organizational Behavior, 4th ed. Belmont, CA: Thompson/Wadsworth.
PR, Newswire. 2011. “Staff Retention, Employee Morale, Workloads, and Health Care Costs are
Top Workforce Issues for State and Local Governments.” PR Newswire US, May 17.

Rothbard, Nancy P., and Steffanie L. Wilk. 2011. “Waking Up on the Right or Wrong Side of
the Bed: Start-of-Workday Mood, Work Events, Employee Affect, and Performance.”
Academy of Management Journal, 54, no. 5: 959-980.
Rushefsky, Mark E. 2013. Public Policy in the United States. 5th edition. ME Sharpe, Inc.
Shrivastava, Sanjay. 2012. “Comprehensive Modeling of Communication Barriers: A
Conceptual Framework.” IUP Journal of Soft Skills, 6, no. 3: 7-19.
Sison, Perfecto S. 1991. Personnel and Human Resources Management. Personnel Personnel
Management Association of the Philippines. 5th Edition. Rex Printing Company, Inc.
Smith, Chris. 2013. The Seven Barriers of Communication. OPIN: Enterprise Drupal. 2013.
http://opin.ca/article/seven-barriers-communication (March 1, 2015).
Stead, Betty Anne. 1972. “Berlo's Communication Process Model as Applied to the Behavioral
Theories of Maslow, Herzberg, and McGregor.” Academy of Management Journal, 15,
no. 3: 389-394.
Sullivan, Jeremiah J. 1988. “Three Roles of Language in Motivation Theory.” Academy of
Management Review, 13, no. 1: 104-115.
Thomas, Kenneth Wayne. 2009. Intrinsic Motivation at Work: What Really Drives Employee
Engagement. San Francisco, CA: Berrett-Koehler Publishers, 2009.
Vroom, Victor H. 1964. Work and Motivation, [by] Victor H. Vroom. n.p.: New York. Wiley
[1964].
Wilson, Woodrow. 1887. “The Study of Administration.” Political Science Quarterly, 2, no. 2:
197-222.
Worthy, James C. 1950. “Factors Influencing Employee Morale.” Harvard Business Review, 28,
no. 1: 61-73.
Zuckert, M. (2010). “The Locke Essay: Achievement and Promise.” Perspectives on Political
Science, 39(2), 92-96.

APPENDIX A
Survey
APPENDIX A: SURVEY

The following ten questions are related to “Communication Content, or the sorts of functions played by managerial communication.” Please Rate the Extent to which Your Immediate Supervisor does the following:
Never Rarely Sometimes
Often Always
1. Tells you what to do
2. Solicits your input in decision-making
3. Gives you information concerning other organizational departments
4. Stresses happy interpersonal relationships
5. Stresses company goals
6. Stresses avoidance of conflict
7. Allows you to work unsupervised
8. Emphasizes teamwork
9. Encourages effort
10. Reinforces good performance
The following ten questions are related to “Communication Style, or the manner in which the content was conveyed.” Please Rate the Extent to which Your Immediate Supervisor does the following:
Always Often Sometimes
Rarely Never
11. Comes on strong when communicating with you
12. Is quick to express disagreement

Never Rarely Sometimes
Often Always
13. Shows concern for you
14. Is comfortable with you
15. Is attentive
16. Communicates actively
17. Is open and willing to reveal relatively personal things about themselves
18. Listens carefully
19. Is friendly
20. Communicates dramatically The following five questions are related to Employee Morale. Based on your perception, rate the following:
Very Poor
Poor Fair Good Very Good
21. The Quality of your relationship with your immediate supervisor
22. The quality of your communication with your immediate supervisor
23. Your overall job satisfaction
Very Willing
Somewhat Willing
Neutral Somewhat Unwilling
Very Unwilling
24. Your willingness to transfer to a similar position in another transportation department
Never Rarely Sometime
s Often Always
25. The extent to which you feel like a part of your present
work group

APPENDIX B
Institutional Review Board (IRB) Protocol Exemption Report
Institutional Review Board (IRB)
for the Protection of Human Research Participants
PROTOCOL EXEMPTION REPORT
PROTOCOL NUMBER:
IRB-03242-2015
INVESTIGATOR:
Thomas Courson
PROJECT TITLE: The Psychology of Communication: Does the Ethical Perception of Downward Openness Affect
INSTITUTIONAL REVIEW BOARD DETERMINATION:
This research protocol is exempt from Institutional Review Board oversight under Exemption Category(ies) 2. You may begin your study immediately. If the nature of the research project changes such that exemption criteria may no longer apply, please consult with the IRB Administrator ([email protected]) before continuing your research.
ADDITIONAL COMMENTS/SUGGESTIONS:
Although not a requirement for exemption, the following suggestions are offered by the IRB Administrator to enhance the protection of participants and/or strengthen the research proposal:
NONE

If this box is checked, please submit any documents you revise to the IRB Administrator at [email protected] to ensure an updated record of your exemption.
Elizabeth W. Olphie 8/21/15 Elizabeth W. Olphie, IRB Administrator Date
Thank you for submitting an IRB application. Please direct questions to [email protected] or 229-259-5045.
Revised: 12.13.12
i “Sun Tzu's Art of War transcends its military context and offers valuable insights, such as managing change, adaptability in operations, flexibility, innovativeness, and the importance of initiative. Certainly, these are fundamental qualities of effective leadership in modern businesses. ii The Church, as the sole authority on matters related to God, and its divinely appointed authority were beyond reproach. iii “Emboldened by the success of Newtonian physics, a few simple rules that explained the fall of apples and the orbits of planets, [Condorcet] sought to create a science of society to match. Reason, he thought, could make the world a better place” (Musser 2012, 1). iv Hobbes rejected the claim that government was a divinely appointed institution. Furthermore, by correlating his view of natural law with the premise “that Government was ... a deliberately and rationally conceived human invention” (Baradat 2008, 72), Hobbes showed that religion and politics were mutually exclusive. v John Locke believed that an individual’s “rights were unalienable and that preserving them was necessary for a free existence” (Baradat 2008, 80). Moreover, he argued that “government ought to be strictly limited ... to serve the people” (Baradat 2008, 80). In this way, Locke “transforms what in Hobbes is a right (a liberty) into a duty (an obligation)” (Zuckert 2010, 93). vi Thomas Jefferson is widely regarded as the father of the Declaration of Independence. Yet, he recognizes John Locke as helping lay the philosophical foundations from which it was written. In a letter to John Trumbull, a Revolutionary American artist, Jefferson praised Locke by referring to him, Isaac Newton, and Francis Bacon as the greatest men who had ever lived. vii Madison knew that the weak central government provided in the Articles of Confederation was creating significant issues for the country. Not only did it make collecting the taxes necessary to keep the new country out of bankruptcy impossible, but also it did very little to unite the war torn Colonies. Therefore, Madison, in true Hobbesian fashion, pressed for a strong central government. viii Smith’s The Wealth of Nations was published in 1776, the same year as the Declaration of Independence, and economists insist that it was fully as important to their field as its companion was to government and political science. ... Smith believed that the efficient working of the market was the key to a comfortable standard of living. He showed that the price system was a self-adjusting mechanism

which led to resources being used in a way that maximized the value of their contribution to production” (Nolan 1995, 184). ix Henri Fayol argued that “Administration” or “Management” is a body of knowledge that comes from observation and experience. In this way, Fayol opens the topic of management up to scholarly instruction, supported by practical experience. x Goodnow further defined administration as “that part of the public law which fixes the organization and determines the competence of the administrative authorities, and indicates to the individual remedies for the violation of his rights” (Harriman 1916, 658).