Embed Size (px)
Citation preview
The Prospect of Zero GHG Emission CarsProf. David R. Hodas
Widener University School of LawWilmington DE
Journal of Environmental Law and LitigationSymposium: LIVING ON A FINITE EARTH: Energy Law and Policy for a New Era
October 10, 2008
School of Law University of Oregon

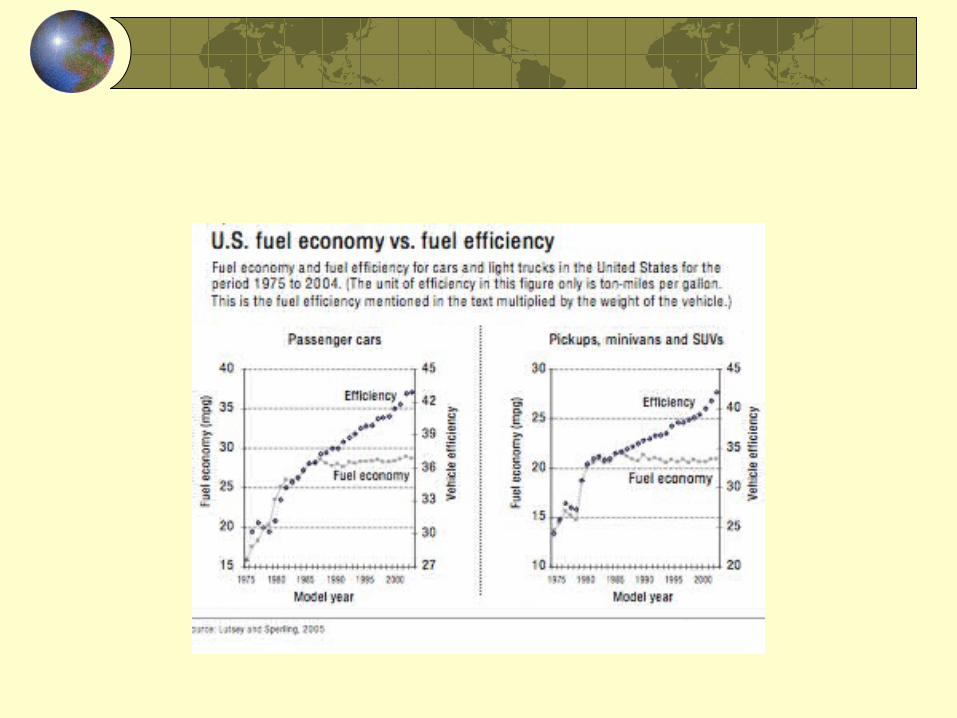
Vehicle weight vs.. acceleration
As engines become more efficient they have been used to increase acceleration and weight not increase fuel efficiency

Transportation uses 70% of U.S. oil consumptionLast week (Oct 3) the U.S. imported (net of exports)12.9 million barrels of petroleum per day (gross imports were14 million)(this translates into > 4.7 billion bbls per year)@$100/bll U.S the cost of these imports is about $1.29 billion per day or $470 billion per year. U.S. consumes about 43% of the world’s gasoline (2003 data)

In 2006 transportation in the U.S. cars account for 1.99 billion metric tons of CO2 emissions
Petroleum: 1.952 billion (gasoline’s share is 1.19 billion mt)
Electricity for transportation: 5.2
Natural gas: 32.5
U.S. electricity production from fossil fuels accounts for 2.344 billion tons of CO2 per year.
Together (3.534 billion mt), U.S. gasoline use and electricity generation comprise about 60% of U.S. CO2 emissions or just under 14% of global CO2 emissions
Can we reduce CO2 from both electricity and transportation?Only if we can shift to renewable sources of electricityRenewable Electricity challenge: how to store it for use when needed?Can Vehicle-to-Grid (V2G) cars help meet the challenge?

Plug-in Vehicles
V2G Slides provided by Prof. Willett Kempton, University of Delaware
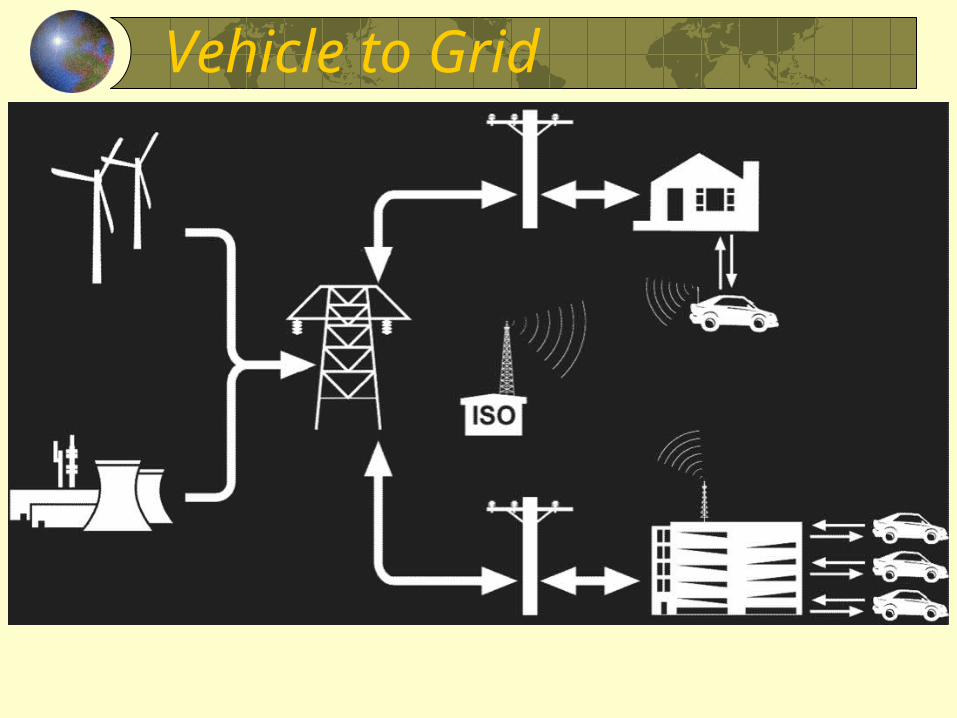
Vehicle to Grid
Arrows indicate direction of power flow
V2G Basic Math
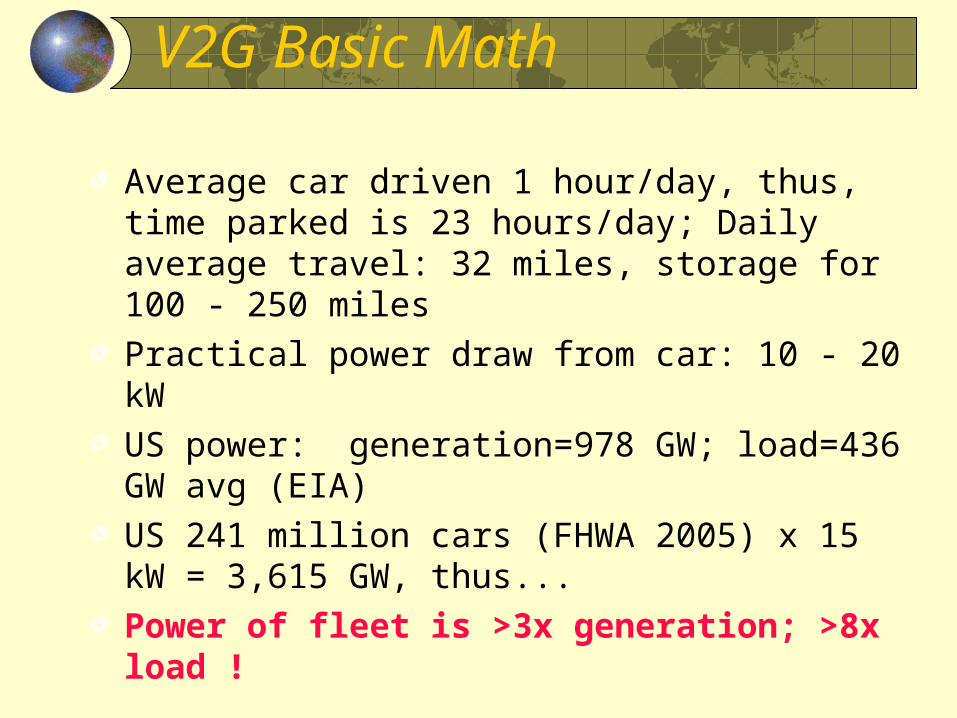
Average car driven 1 hour/day, thus, time parked is 23 hours/day; Daily average travel: 32 miles, storage for 100 - 250 miles
Practical power draw from car: 10 - 20 kW
US power: generation=978 GW; load=436 GW avg (EIA)
US 241 million cars (FHWA 2005) x 15 kW = 3,615 GW, thus...
Power of fleet is >3x generation; >8x load !

Electric Markets
Initial markets (high value, low impact on battery, no system changes):
Regulation (“Frequency regulation”)
Spinning reserves
Intrahour adjustment
Larger but more challenging marketsPeak power
UPS for the distribution system
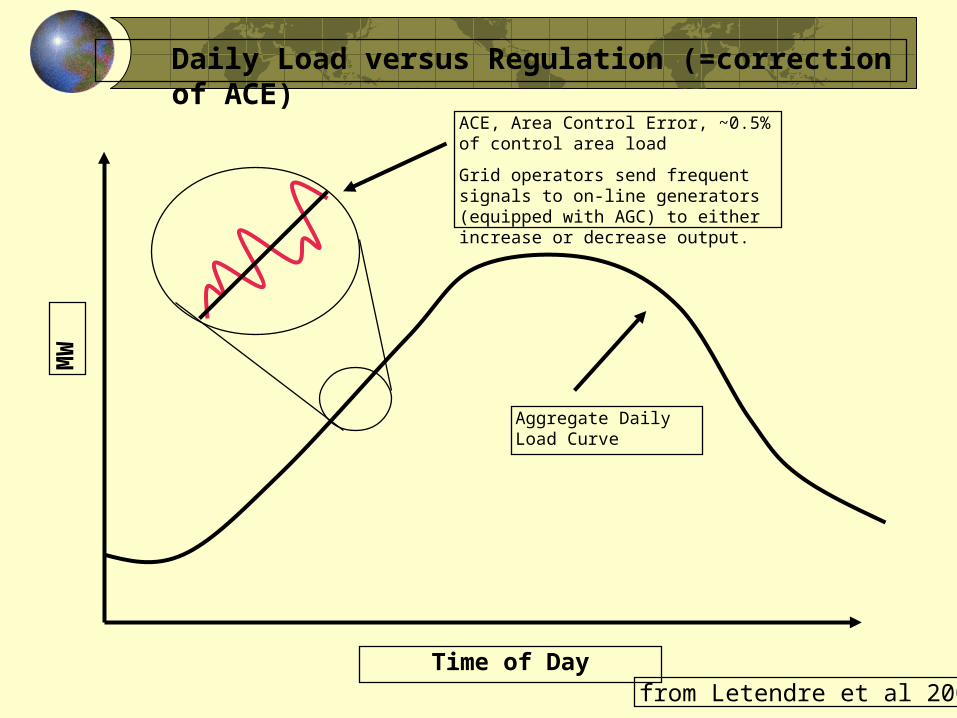
Time of Day
MW
ACE, Area Control Error, ~0.5% of control area load
Grid operators send frequent signals to on-line generators (equipped with AGC) to either increase or decrease output.
Aggregate Daily Load Curve
from Letendre et al 2006
Daily Load versus Regulation (=correction of ACE)
January 30, 2008
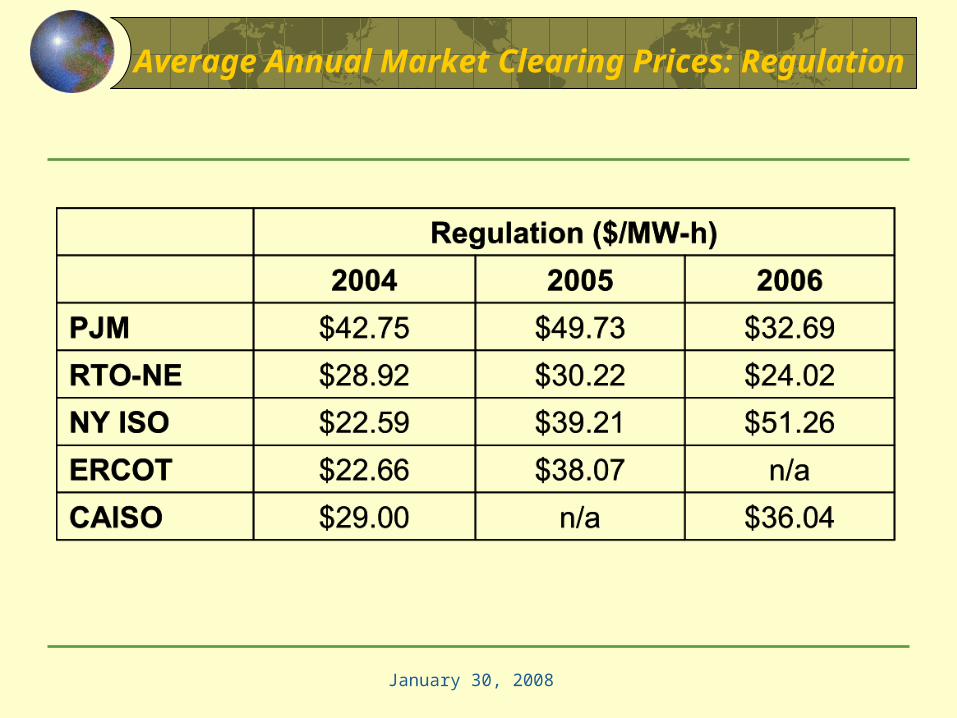
Average Annual Market Clearing Prices: Regulation

Average Annual Market Clearing Prices: Spinning Reserves
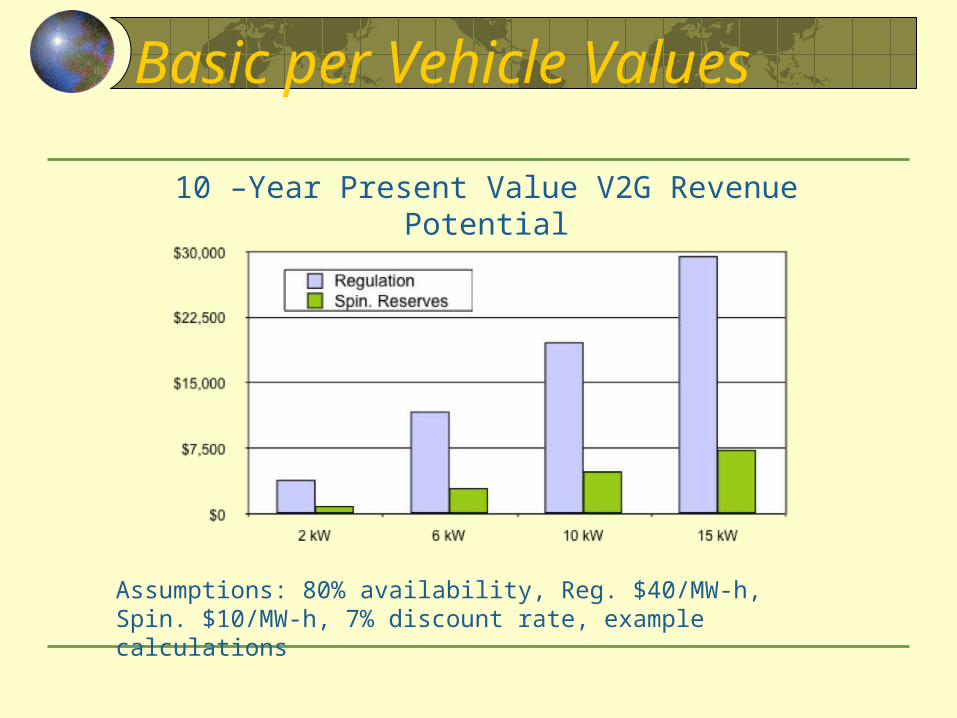
Basic per Vehicle Values
10 –Year Present Value V2G Revenue Potential
Assumptions: 80% availability, Reg. $40/MW-h, Spin. $10/MW-h, 7% discount rate, example calculations
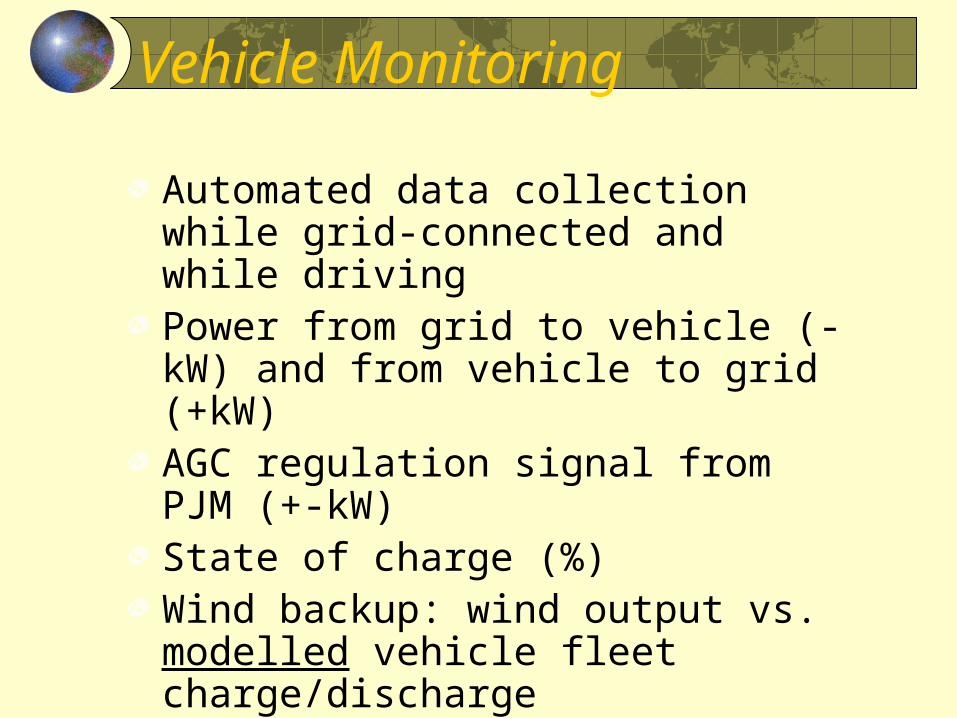
Vehicle Monitoring
Automated data collection while grid-connected and while drivingPower from grid to vehicle (-kW) and from vehicle to grid (+kW)AGC regulation signal from PJM (+-kW)State of charge (%)Wind backup: wind output vs. modelled vehicle fleet charge/discharge

EV/PHEV Design Tradeoffs
Batteries expensive; motor expensiveHigh line-current gives fast charge, roadside recharge; adds only moderate cost if done rightRegulation income directly proportional to line power! Line power limits:
Size of plug, circuit, serviceEnergy/time = kWh/dispatch

How many cars for an A/S contract?
PJM minimum A/S contract: 1 MWCalISO minimum A/S contract: 1 MWAssume 2/3 availability (1/3 unavailable because driving, battery at wrong SOC, etcCalculation: 2/3 availability means ... ___ kW/car * ___ cars * 2/3 = ___ MW
for 1 MW at 15 kW, need 100 carsfor 1 MW at 1.5 kW, need 1000 cars
Vision
One-half vehicle fleet is electric drive (BEV + PHEV). National security & environment benefits.
Lots of storage on the electric system, near loads.
Electric system storage is dispatchable by ISO/TSO and/or load serving entity.
Electric grid is more stable and reliable, A/S is abundant and less expensive
Intermittent renewables can be a much higher fraction of the generation mix.
Legal and Policy Questions
How shift investment strategy in a deregulated electric system to renewable electricity linked to V2GInfrastructure: parking lots, transmission capacity, distribution networksFederal or state regulation? Link to climate change incentives, capsSmart meter laws, aggregation designContract and business plan design, taxation, ownership, utility integration Other potential issues?

Mid-Atlantic Grid-Interactive Car Consortium
PartnersUniversity of DelawarePHI: Delmarva Power, Atlantic Electric, PEPCO, etcACUAPJMAC PropulsionComverge
ObserversTesla MotorsGoogle.orgState of Delaware (DEDO, PSC, Energy Office)anon
http://www.magicconsortium.org