Embed Size (px)
Citation preview

This article was downloaded by: [Universite De Paris 1]On: 19 August 2013, At: 08:34Publisher: RoutledgeInforma Ltd Registered in England and Wales Registered Number: 1072954 Registered office: Mortimer House, 37-41 MortimerStreet, London W1T 3JH, UK
Journal of the American Planning AssociationPublication details, including instructions for authors and subscription information:http://www.tandfonline.com/loi/rjpa20
The Proof of the Planning Is in the Platting: An Evaluation ofFlorida's Hurricane Exposure Mitigation Planning MandateRobert E. Deyle a , Timothy S. Chapin a & Earl J. Baker aa Florida State UniversityPublished online: 23 Jul 2008.
To cite this article: Robert E. Deyle , Timothy S. Chapin & Earl J. Baker (2008) The Proof of the Planning Is in the Platting: An Evaluationof Florida's Hurricane Exposure Mitigation Planning Mandate, Journal of the American Planning Association, 74:3, 349-370, DOI:10.1080/01944360802229612
To link to this article: http://dx.doi.org/10.1080/01944360802229612
PLEASE SCROLL DOWN FOR ARTICLE
Taylor & Francis makes every effort to ensure the accuracy of all the information (the “Content”) contained in the publicationson our platform. However, Taylor & Francis, our agents, and our licensors make no representations or warranties whatsoeveras to the accuracy, completeness, or suitability for any purpose of the Content. Any opinions and views expressed in thispublication are the opinions and views of the authors, and are not the views of or endorsed by Taylor & Francis. The accuracyof the Content should not be relied upon and should be independently verified with primary sources of information. Taylorand Francis shall not be liable for any losses, actions, claims, proceedings, demands, costs, expenses, damages, and otherliabilities whatsoever or howsoever caused arising directly or indirectly in connection with, in relation to or arising out of theuse of the Content.
This article may be used for research, teaching, and private study purposes. Any substantial or systematic reproduction,redistribution, reselling, loan, sub-licensing, systematic supply, or distribution in any form to anyone is expressly forbidden.Terms & Conditions of access and use can be found at http://www.tandfonline.com/page/terms-and-conditions

349
Problem: Florida’s 1985 Growth Man-agement Act required the state’s coastalcommunities to include policies for twotypes of hurricane hazard zones in theircomprehensive plans: to direct populationsaway from coastal high hazard areas(CHHAs) and to maintain evacuation timeswithin larger hurricane vulnerability zones(HVZs). State law requires local governmentsto initiate measures to implement thesepolicies within one year of state approval ofthe local plan. Have communities compliedwith these state mandates?
Purpose: This research aims to determinethe extent to which post-plan residentialdevelopment intensities within hurricanehazard zones conform to the state’s policymandate and the degree to which success inthis regard can be explained by the qualityof local plan maps and policies.
Methods: We conducted graphical analysisof development trends, and undertook quasi-experimental analysis of pre- and post-planresidential development inside and outsideCHHAs, as well as analyzing correlationsbetween plan quality and post-plan resi-dential development intensity. We alsoconducted interviews for case studies.
Results and conclusions: We foundresidential exposure to hurricane floodhazards to have increased substantially inthe majority of 74 municipalities and 15coastal counties in Florida after the stateapproved local comprehensive plans.Residential development inside CHHAsdid not slow after plans were adopted bymost of these coastal communities. Wefound better maps and stronger policies tobe correlated with lower post-plan develop-
The Proof of the PlanningIs in the Platting
An Evaluation of Florida’s Hurricane ExposureMitigation Planning Mandate
Robert E. Deyle, Timothy S. Chapin, and Earl J. Baker
Over the last several decades, some states have taken back land usemanagement authority they traditionally delegated to local govern-ments. Such state activism aims to protect public welfare by minimiz-
ing spillovers from local land use practices on other communities, protectingnatural resources and public health, and minimizing the public costs of impru-dent local decisions. Many states have intervened directly, adopting andenforcing state regulations to control the management of solid waste, waste-water, and storm water, and to minimize development impacts on natural andhistoric resources. More than a dozen states have employed what Burby et al.(1997) call the “comprehensive planning approach” to achieve such goals.These states have defined overall policy goals and employed a variety of statu-
ment intensity, but the policy quality effect,though not the map quality effect, dis-appeared after controlling for pre-plandevelopment intensities. These results maybe due in part to vesting of developmentapproved prior to adopting the plans, pre-existing zoning entitlements, and Florida’s1995 property rights law.
Takeaway for practice: State planningmandates aimed at managing developmentin critical areas are likely to have onlymarginal effects because of prior entitlementsand the legal and political inertia of existinglocal plan policies and land developmentregulations.
Keywords: comprehensive plan imple-mentation, plan quality, state planningmandates, hazard mitigation policies, Florida
Research support: Research support wasreceived from the National Oceanic andAtmospheric Administration’s Office of SeaGrant, the Florida Department of Commu-nity Affairs, and Florida State University’sDeVoe Moore Center.
About the authors:Robert E. Deyle ([email protected]) is aprofessor of urban and regional planningat Florida State University. His principalresearch concerns plan implementation inthe context of coastal hazards and adaptiveresponse planning to sea level rise. TimothyS. Chapin ([email protected]) is an associateprofessor of urban and regional planning atFlorida State University. His teaching andresearch interests are in the areas of growthmanagement, comprehensive planning, anddowntown development. Earl J. Baker([email protected]) is an associate professor ofgeography at Florida State University. Hiscurrent research focuses on the effects ofhurricane experience on future evacuationresponse.
Journal of the American Planning Association,
Vol. 74, No. 3, Summer 2008
DOI 10.1080/01944360802229612
© American Planning Association, Chicago, IL.
74-3 06 323128 Deyle P 7/11/08 9:04 AM Page 349D
ownl
oade
d by
[U
nive
rsite
De
Pari
s 1]
at 0
8:34
19
Aug
ust 2
013

tory mandates and incentives to foster and enhance thepreparation of local comprehensive plans and their imple-mentation through development controls and other growthmanagement measures. Both the direct intervention andthe comprehensive planning approaches have focused oncritical areas that provide public benefits or present hazardsto public welfare, including wetlands, productive coastalwaters, wildlife habitat, scenic areas, historic and archeo-logical resources, aquifer recharge areas, prime agriculturalsoils, floodplains, and other areas exposed to natural hazards(see, e.g., Washington State Department of Community,Trade and Economic Development, 2003).
Where states follow the comprehensive planningapproach, achieving state goals depends on two tiers ofimplementation: (1) state agencies implementing legislatedstate goals and objectives and (2) local governments im-plementing state agency directives. As Burby et al. (1997)observe, the outcome of state agency implementationdepends both on the level of effort expended by the agencyand on the style they employ in interacting with localgovernments. However, even among the most prescriptiveof the states that mandate local comprehensive planning(i.e. Florida, Maine, Oregon, Rhode Island, and Vermont),the reach of state oversight does not extend beyond thecontent of the plans adopted by local governments. Thus,effective local implementation of state goals is determinedby the quality of the plan policies adopted by local gov-ernments, how local officials translate those policies intodevelopment controls and other growth managementmeasures, and how they enforce those measures.
We count ourselves among the “logical-positivists”(Gilg & Kelly, 1997) who believe that implementingcomprehensive plan policies can have a significant impacton the state of the world and, therefore, that it is usefulto evaluate the extent to which planning goals have beenachieved (Alexander & Faludi, 1989; Burby et al., 1997;Preece, 1990; Talen, 1996a, 1996b). Toward that end,this article addresses both plan conformity (whether planimplementation behaviors or outcomes conform to stategoals), and plan quality (whether better quality plans areassociated with better outcomes).
We pursue these two topics by examining the effec-tiveness of Florida’s growth management mandates formitigating exposure to hurricane hazards by limitingdevelopment in hazardous areas. Vulnerability to naturalhazards is widely recognized as a significant constraint onthe long-term sustainability of human settlements and thusan important concern of comprehensive planning (Burby,1998; Burby, Deyle, Godschalk, & Olshansky, 2000;Burby et al., 1997; Godschalk, Brower, & Beatley, 1989;May et al., 1996; Mileti, 1999). Continued exponential
growth along the United States’ coasts has increased thenumbers of people and amount of property vulnerable tothe high winds, waves, and storm surge flooding of cata-strophic coastal storms (Burby, 1998; Godschalk, Beatley,Berke, Brower, & Kaiser, 1999; Pielke & Pielke, 1997;The H. John Heinz III Center, 2000).
Growth management strategies such as land develop-ment regulations, capital facilities policies, land acquisition,and taxation and fiscal policies are frequently advocated asnonstructural means communities can use to reduce theirvulnerability to natural hazards (Burby, 1998; Burby et al.,2000; Godschalk et al., 1989; May et al., 1996; Mileti,1999). However, there have been few rigorous analyses ofthese strategies. While a number of studies have analyzedthe quality of the hazard mitigation policies in localcomprehensive plans in Florida and other states (Berke& French, 1994; Berke, Roenigk, Kaiser, & Burby, 1996;Brody, 2003; Burby et al. 1997; Deyle & Smith, 1998),no one has analyzed the extent to which better plans areassociated with better development management outcomes.
We employ a quasi-experimental research design toassess whether residential development patterns in desig-nated hurricane hazard zones conformed to state directivesrequiring Florida coastal communities to reduce the vul-nerability of people and property in such areas. In addition,we use multivariate modeling to measure the extent towhich the content of local comprehensive plans explainedresidential density after localities adopted plans to meet thestate mandate. We supplement our empirical analyses withcase studies from a subsample of coastal communities aswell as interviews with state officials who oversaw reviewand approval of local comprehensive plan amendmentsduring the study period. These qualitative inquiries helpto illuminate the stories behind our observations.
Our findings suggest that existing local policies and landuse entitlements fundamentally constrain any alterationsnew state policies can make to development patterns. Whilesome coastal communities have successfully limited devel-opment in hazardous areas, implementation of the state’smandate has been blunted by state and local officials whoperceive political and legal constraints to altering entitle-ments. Our results do demonstrate that development ismore likely to conform to state goals when maps of futureland use in local comprehensive plans explicitly showcritical areas.
We believe our results apply to a broad range ofcomprehensive planning objectives because the followingfactors constrain local government conformity with all stateinitiatives to influence development management of criticalareas (Burby et al., 1997; May et al., 1996; Olshansky &Kartez, 1998): (a) weak or absent local political constituen-
350 Journal of the American Planning Association, Summer 2008, Vol. 74, No. 3
74-3 06 323128 Deyle P 7/11/08 9:04 AM Page 350D
ownl
oade
d by
[U
nive
rsite
De
Pari
s 1]
at 0
8:34
19
Aug
ust 2
013
cies for the state goals; (b) competing local issues of greaterperceived priority; (c) short-term political and fiscal costs ofimplementing the state mandate combined with uncertainfuture benefits; (d) limited local capacity to implementstate directives; and (e) pre-existing local developmentmanagement measures that are perceived as entitlementsto specific land uses and densities.
In the following sections, we briefly summarize bothplan conformity and plan quality research approaches, andwhat studies taking these approaches have learned aboutimplementing hazard mitigation policies. We then presentan overview of the Florida growth management and coastalplanning context, after which we take up each of our planimplementation questions. In the final section, we explorethe underlying phenomena that may explain our findingsand their implications for future efforts to change localplanning and development management through statemandates.
Plan Conformity Research
One important segment of plan conformity researchhas examined whether the prescription and persuasionstates employ when they mandate planning shapes thecontent of local comprehensive plans (Burby et al., 1997).In a comparative study of five states, Burby and his col-leagues showed that the natural hazards elements of localplans were higher quality in states that coupled strongmandates with formal state review of local plans and thethreat of state sanctions where local governments failed tocomply (see especially Berke & French, 1994; Burby &Dalton, 1994; and Berke et al., 1996). Related studies havealso shown that state oversight and sanction authority resultin better plan quality (May & Burby, 1996; May et al.,1996).
Florida appears from these studies to have the mosteffective mandate, measured by the comparative quality ofthe natural hazards elements of local comprehensive plans.A study by Deyle and Smith (1998), however, revealedthat there was considerable inconsistency in the quality oflocal plans, and that many fell short of complying with thesubstance of the state mandate. They attributed this in-complete and variable conformity to the Florida Depart-ment of Community Affairs (DCA) according a relativelylow priority to the natural hazard goals of the state growthmanagement statute, and to differing levels of scrutiny ofdraft plans under different agency administrations.
Researchers examining whether plan outcomes conformto plan policies have focused primarily on behavioralmeasures, including subsequent zoning or plan amendments
(Johnston, Schwartz, & Klinkner, 1978; Johnston, Schwartz,& Tracy, 1984), subdivision approvals (Alterman & Hill,1978; Johnston et al., 1978), and development permitissuance (Anderson, 1981; Blacksell & Gilg, 1977, 1981;British Tourism and Recreation Research Unit, 1981;Brody & Highfield, 2005; Brotherton, 1992; Curry, 1992;Gregory, 1971; Keyes, 1986; Moore & Nelson, 1993;Nelson & Moore, 1996). Two studies are noteworthybecause the authors analyzed actual land use patterns.Talen (1996a) examined changes in community recreationfacilities following adoption of the recreation element ofthe Pueblo, Colorado, comprehensive plan. More recently,Esnard, Brower, and Bortz (2001) assessed differentialdevelopment patterns inside and outside of flood hazardzones in Nags Head, North Carolina.
One of the principal challenges in conducting planand policy implementation research is obtaining sufficientdata to employ a research design that can both demonstratethat the plan or policy intervention is associated with achange in behavior or the state of the world, and controlfor unmeasured variables that may affect behavior or thestate of the world independent of the plan or policy beingevaluated. The ideal research design is a pretest/post-testdesign with control groups (Cook & Campbell, 1979;Preece, 1990). However, few studies attain this ideal.
Several studies of the impacts of comprehensive planshave used simple posttest only research designs that exam-ine land use changes or permit issuance behavior after planadoption within a single community or regulatory frame-work (e.g., Alterman & Hill, 1978; Brody & Highfield,2005; Johnston et al., 1984; Esnard et al., 2001). Manyresearchers have employed cross-sectional designs thatinclude control groups to compare development activityinside and outside of regulated areas (e.g., Anderson, 1981;Blacksell & Gilg, 1977, 1981; British Tourism and Recre-ation Research Unit, 1981; Burby & French, 1981; Burbyet al., 1988; Nelson & Moore, 1996). However, in thesestudies it is possible that different development patternsobserved inside and outside the regulated areas simplycontinue practices already occurring, independent of theadoption of the new policies. Other researchers have usedpretest/posttest designs within single jurisdictions to assessthe impact of plan policies (e.g., Johnston et al., 1978;Talen, 1996a). These studies, however, cannot rule out theeffects of other factors that may have led to the observedchanges over time.
The exceptions are limited. Three studies of permitissuance in Great Britain employed pretest/post-test controlgroup research designs (Brotherton, 1992; Curry, 1992;Keyes, 1986). More recently, Burby, Salvesen, and Creed(2006) employed such a design to examine how adopting
Deyle et al.: The Proof of the Planning Is in the Platting 351
74-3 06 323128 Deyle P 7/11/08 9:04 AM Page 351D
ownl
oade
d by
[U
nive
rsite
De
Pari
s 1]
at 0
8:34
19
Aug
ust 2
013

a rehabilitation building subcode affected the issuance ofrehabilitation permits in jurisdictions inside and outsideof New Jersey.
To date, studies of whether plan implementationbehavior and outcomes conform with hazard mitigationpolicies have relied principally on subjective data to assessthe effectiveness and impacts of local hazard mitigationpolicies and programs (i.e., interviews or surveys of localplanning officials). Findings have been mixed. In a studyof development permits issued in 1978 by a sample ofcommunities participating in the National Flood InsuranceProgram (NFIP), Burby and French (1981) found com-munities that had already substantially developed theirfloodplains were more likely to participate in the NFIP,but were also more likely to issue higher proportions oftheir development permits for construction within 100-yearfloodplains. Yet, in a comparative study of 10 communities,Burby et al. (1988) found evidence that floodplain manage-ment effectively reduced development in the flood-hazardarea, as 7% of each community’s land area lay within the100-year floodplain on average, while an average of only2.2% of the building permits issued over a 10-year periodwere granted for new structures within the floodplain. Incontrast, Esnard et al. (2001) found that in 1997, 42% ofthe developed property parcels in the coastal town of NagsHead, North Carolina, lay within the 100-year flood zonesdesignated under the NFIP.
Plan Quality Research
The second line of plan implementation inquiry hasattempted to ascertain whether or not differences in planor land use regulation content are correlated with planimplementation outcomes. These studies have typicallyemployed multivariate models that control for otherpossible causal variables. Most, however, have used cross-sectional research designs that do not control for conditionsthat preceded the intervention.
Burby and Dalton (1994) examined an intermediatestep in plan implementation, the adoption of land devel-opment regulations based on plan policies. They foundthat communities with higher quality plan policies limitingdevelopment in hazardous areas were more likely to actuallyadopt growth management measures for imposing suchlimitations.
Findings from studies that attempt to explain imple-mentation behavior have not provided consistent andcompelling evidence of the efficacy of plan policies. Burbyand French (1981) tested bivariate correlations between thepercentage of building permits issued within floodplains
and the numbers and stringency of floodplain managementregulatory measures employed by flood-prone cities. Theyfound only weak evidence that more comprehensive andstronger regulations were associated with less floodplaindevelopment. Brody and Highfield (2005) comparedwetland development permits issued by the state of Floridaand the U.S. Army Corps of Engineers (USACE) withinindividual watersheds with future land uses designated inlocal comprehensive plans. Contrary to their expectations,they found that permit issuance was less likely to conformto future land use designations in watersheds where localcomprehensive plan environmental policies were stronger.Yet conformity was higher where plan implementationpolicies were high quality. In a follow-up multivariateanalysis of these data, Brody, Highfield, and Thornton(2006) amended these results to support only the linkbetween implementation policy quality and conformity,reporting that the quality of environmental policies in localcomprehensive plans had no significant relationship withwhether wetland permits conformed to local land usedesignations.
Berke et al. (2006) found that the design and structureof a plan may mediate the influence of plan policies ondevelopment outcomes. In a study of storm water manage-ment permits issued by district councils in New Zealand,they found that permit conditions were more likely toreflect plan policies where the quality of plan design andstructure was higher.
Nelson and French (2002), on the other hand, exam-ined the relationship between plan quality and a measureof physical outcomes. They applied a plan quality scoringmethod to assess the effects of comprehensive plan seismicsafety elements on subsequent earthquake damage inCalifornia. Using multivariate models that controlled for theexposure and vulnerability of housing stock to earthquakeground shaking and earthquake intensity, they found thatlevels of residential damage after the 1994 Northridgeearthquake were lower in those communities whose seismicsafety elements had higher quality scores.
Taken as a whole, this literature has yielded the ratherhumble conclusion that “Plans can matter!” (Burby &Dalton, 1994; exclamation point in the original). Thisresearch suggests that the substantive quality of plan policieshas at best a modest influence on the development out-comes they are designed to shape. The recent analysis byBerke et al. (2006), however, suggests that plan design andstructure may also affect plan implementation success. Wenext describe the Florida state planning mandate contextwithin which our study is set.
352 Journal of the American Planning Association, Summer 2008, Vol. 74, No. 3
74-3 06 323128 Deyle P 7/11/08 9:04 AM Page 352D
ownl
oade
d by
[U
nive
rsite
De
Pari
s 1]
at 0
8:34
19
Aug
ust 2
013

The Florida Growth Managementand Coastal Planning Context
Florida’s growth management planning mandate(Florida Growth Management Act, 1985a) offers fertileground for exploring plan conformity and plan qualityimplementation questions because it is a highly prescriptive,top-down system in which state laws and regulations setout very explicit requirements governing the scope of localcomprehensive plan goals, objectives, and policies (Ben-Zadok, 2005; Chapin, Connerly, & Higgins, 2007; Pelham,2001). Local governments are required both to adopt localplans that conform to state rules and to implement thepolicies in those plans through local land developmentregulations. Research on plan implementation in Floridais facilitated by the state’s review and reporting procedures,which have resulted in a central record-keeping system thatallows tracking changes in local plan policies over time.
The first comprehensive plans developed underFlorida’s 1985 planning mandate were adopted by localgovernments and approved by the Florida DCA between1988 and 1991.1 However, most local governments in thestate had comprehensive plans in place prior to the 1985act, because an earlier statute (Local Government Compre-hensive Planning Act, 1975), required local governmentsto adopt plans in conformance with it by 1979 (Pelham,2007). Many of these local governments already also hadzoning ordinances in place when they crafted their revisedcomprehensive plans in the late 1980s and early 1990s.
The 1985 act required local governments to enact landdevelopment regulations (LDRs) and to take other initia-tives to implement their plan policies (Florida GrowthManagement Act, 1985b). Where existing LDRs, includingzoning ordinances, were at odds with policies in the newplans, local governments were required to amend theLDRs accordingly (Florida Growth Management Act,1985c). Thus, implementation of new comprehensive planpolicies occurred over several years as LDRs were broughtinto conformance with the plans following approval byDCA. In addition, most local governments have subse-quently made periodic, piecemeal amendments to theircomprehensive plans, as well as completing mandatedsynoptic plan updates on a seven-year cycle (Florida GrowthManagement Act, 1985d). These amendments are reviewedby DCA for conformity with the state statute and regulations(Florida Growth Management Act, 1985e).
Regulations adopted by DCA (Requirements forCoastal Management Goals, Objectives, and Policies Rule,2007), require coastal counties and municipalities toinclude objectives and policies in their comprehensiveplans that limit development in and direct populations
away from “coastal high-hazard areas” (CHHAs) andmaintain or reduce evacuation times within “hurricanevulnerability zones” (HVZs). The state statute initiallyallowed local governments flexibility in defining CHHAs(Florida Growth Management Act, 1985a, §7). A subse-quent amendment to the statute (Law of May 11, 1993)changed the minimum CHHA definition to the evacuationarea for a Category 1 hurricane.2 An HVZ is defined bystate rule as the area that would be evacuated for a Category 3hurricane (Definitions Rule, 2007).
In the next section, we examine whether or not residen-tial development that has occurred in coastal communitiessince local plans following the 1985 state law were approvedis consistent with these mandates.
Plan Conformity: Has the WorldChanged as It Should?
We used county property appraiser data to analyzeresidential land use change at the parcel level inside andoutside of hurricane hazard zones in 89 coastal jurisdictionsto assess how well post-plan residential development hasconformed to this planning mandate. We addressed threeplan outcome questions:
1. How did residential land use change within thehurricane hazard zones of coastal communities inFlorida following approval of local comprehensiveplans by DCA?
2. How did those land use changes affect the exposureof people and property to hurricane flooding?
3. To what extent did land use changes differ insideand outside the communities’ CHHAs before andafter approval of local comprehensive plans?
Three hypotheses inform this research. The first isbased on Deyle and Smith’s (1998) finding of significantvariation in local governments’ compliance with the state’smandate to include hazard mitigation policies in localcomprehensive plans. That study leads us to expect tofind that the exposure of people and property to hurricaneflooding increased substantially in some coastal communitiesafter they adopted comprehensive plans, despite the statemandate. Secondly, if the state’s mandate was effective inthe aggregate, we would expect to find that residentialdevelopment intensity decreased in CHHAs after localcomprehensive plans were approved. Finally, we wouldalso expect residential growth rates inside CHHAs, whereplan policies should limit residential development, to belower than outside of these zones.
Deyle et al.: The Proof of the Planning Is in the Platting 353
74-3 06 323128 Deyle P 7/11/08 9:04 AM Page 353D
ownl
oade
d by
[U
nive
rsite
De
Pari
s 1]
at 0
8:34
19
Aug
ust 2
013

In the following sections we summarize how wemeasured our key concepts. For a more detailed accountof our methods, see Chapin, Deyle, and Baker (2008).
Measuring Residential Land Use Beforeand After Plan Adoption
We used county property appraiser tax roll data anddigital property parcel polygons to compare the 2002residential land use within a community’s hurricane hazardzones with that in the same area in the year the local com-prehensive plan was approved by DCA.3 At the time thisstudy was conducted, 2002 was the most recent year forwhich the necessary data were available.
Communities are required to adopt land developmentregulations to implement their plan policies within oneyear of approval of their comprehensive plans by DCA.We therefore defined properties as developed pre-plan iftheir improvements were built in the year of plan approvalor earlier. Parcels with improvements built after the yearof plan approval we designated post-plan. This approachaccounts for the expected lag in plan implementation afterthe adoption and approval of the local plan.
Measuring the Exposure of People andProperty to Hurricane Flooding
We defined three measures of exposure to hurricaneflooding for each jurisdiction: number of residential units,2002 market value of residential property improvements,and total population.
We counted all parcels for which land use was codedas single family residential, mobile home, condominium,or cooperative as having one residential unit.4 We obtaineddata on the number of units in multi-family residentialstructures (e.g., duplexes and apartment complexes), motels,and hotels from the Florida Department of Business andProfessional Regulation, which licenses multi-family resi-dential properties in the state. We also counted propertiesin nonresidential uses if they had homestead exemptions,which Florida grants only to properties occupied by per-manent residents. Thus, our total number of residentialunits for each municipality was the sum of these threecomponents.
To estimate the approximate market value of propertyimprovements, we used the values assessed by countyproperty appraisers for each parcel, subtracting land valuefrom total just value, with the latter typically being 85% ofthe assessor’s determination of the true market value of aproperty. We refer to this remaining value as the just valueof improved property.
We defined total population as the sum of tourist andnontourist residents, summing both for each jurisdiction.
We used occupancy rate estimates from regional hurricaneevacuation studies to calculate the number of peopleassociated with tourist units (hotels and motels) duringthe peak season. We applied tract-specific 2000 censusoccupancy rates to the total of 2002 nontourist residentialunits in each census tract, and then multiplied by theaverage household size for the tract to estimate the numberof nontourist residents by census tract.
Measuring Land Use Changes Inside andOutside CHHAs
To differentiate residential land use patterns both overtime (pre- and post-plan approval) and in space (inside andoutside CHHAs), we defined the base year of the pre-plantime period for each jurisdiction so that the post-plan andpre-plan time intervals were of equal length. Thus, for ex-ample, if a community’s comprehensive plan was approvedin 1989, the length of the post-plan period would be 13years (1989–2002). The base year for the correspondingpre-plan period would be 1976. We compared developmentpatterns inside and outside each community’s CHHAbecause the state plan mandate explicitly calls for limitingdevelopment within CHHAs. Once we had determinedthe above parameters for each jurisdiction, we calculatedgrowth rates inside and outside the CHHA for each exposuremeasure: number of residential units, just value of improvedproperty, and people.
Sample SelectionA total of 35 counties and 158 municipalities in
Florida are required to include specific policies to mitigatehurricane hazards in their comprehensive plans. Our sampleincludes 15 counties (see Figure 1) and 74 municipalitieswithin those counties. We excluded jurisdictions for which2002 tax roll or property parcel polygon data were unavail-able. We also excluded jurisdictions with unreliable landuse coding, comprehensive plans approved after 1991,extensive coastal redevelopment, or other circumstancesthat made them atypical, and those that had no vacant landwithin their CHHAs in 1995. The resulting sample providesgood coverage of the geographic and socioeconomic varia-tion among the state’s coastal jurisdictions. The countieswe include constitute 36% of the total 2000 populationof the 35 coastal counties in Florida and 41% of the area.The 1990–2000 average population growth rate for oursample was 26%, which is nearly identical to the averageof 27% for all 35 coastal counties (U.S. Census Bureau,2001).
354 Journal of the American Planning Association, Summer 2008, Vol. 74, No. 3
74-3 06 323128 Deyle P 7/11/08 9:04 AM Page 354D
ownl
oade
d by
[U
nive
rsite
De
Pari
s 1]
at 0
8:34
19
Aug
ust 2
013

Plan Conformity Results
To discover whether comprehensive plan policiesinfluenced residential development inside hurricane hazardzones, we first look at our sample in the aggregate, andthen examine land use change trends and patterns for theindividual communities in our sample.
Aggregate Changes in Exposure toHurricane Flood Risks
As shown in Table 1, despite the state’s hazard miti-gation mandates, there was substantial residential growthwithin the CHHAs and HVZs of the 89 coastal localgovernments in our study between when local planswere approved and 2002. We calculated an approximateincrease of 153,000 new residential units in both typesof hurricane hazard zones combined. If we assume other
Deyle et al.: The Proof of the Planning Is in the Platting 355
Figure 1. Sampled and excluded Florida counties.
Included in sample
Excluded from sample
Noncoastal areas
74-3 06 323128 Deyle P 7/11/08 9:04 AM Page 355D
ownl
oade
d by
[U
nive
rsite
De
Pari
s 1]
at 0
8:34
19
Aug
ust 2
013

coastal counties in the state grew at the same rate, approx-imately 425,000 new residential units would have beenbuilt in hurricane hazard zones statewide between theyear of plan approval and 2002.5 Based on our methodof assigning people to residential units, the associatedpopulation increase in both types of hazard zones in thecommunities in our sample would be more than 345,000people. The corresponding increase in just value of resi-dential improved property would be nearly $30 billion.Extrapolation to all 35 coastal counties yields estimates ofapproximately 958,000 new residents and $80 billion injust value of new residential structures in hurricane hazardzones over this time period.
These figures do not suggest significant success inattaining the state’s broad legislative goal of “protect[ing]human life in areas that are subject to destruction bynatural disaster” through the implementation of localcomprehensive plan policies (Florida Growth ManagementAct, 1985f). Nonetheless, it is possible that the vulnerabilityof people and property to hurricane flooding is less than itmight otherwise have been in the absence of the state’shurricane hazard mitigation planning mandate.
Changes in Hurricane Flood ExposurePatterns in Individual Coastal Communities
To further explore this apparent failure in local im-plementation of the state planning mandate, we narrowour focus to examine changes in the temporal and spatialresidential development patterns within 58 individualcoastal communities in our sample that have land bothinside and outside their local CHHAs.6 We do so becauseof the explicit state mandates to limit development insideCHHAs and direct populations away from those areas.We present here two additional analyses: a comparison oftrends in annual development levels, measured as numbersof new residential units inside and outside of CHHAs
between 1960 and 2002, and a two-dimensional comparisonof median residential growth rates inside and outside ofCHHAs before and after plan approval.
We observed three different patterns in our comparisonof annual development trends. First, we found in somecases what appeared to be a rising trend inside the CHHAafter plan approval, while the number of new residentialunits built outside the CHHA began to decline and droppedbelow the level inside the CHHA (see, e.g., Figure 2).Second, in some cases after plan approval the patternsinside and outside of the CHHA were roughly parallel(see, e.g., Figure 3). Third, we found cases where thetrends diverged after plan approval: the numbers of newresidential units inside the CHHA declined while thenumbers outside increased (see, e.g., Figure 4).
These findings provide additional evidence that themajority of communities did not effectively implementpolicies to direct residential development away fromCHHAs. We classified 23% of the communities as ex-hibiting an increase in new residential units after planapproval that was distinct from the observed pattern outsidethe CHHA. In these cases it appears that communitieshave not only failed to direct development away from theCHHA, but they have allowed it to increase relative to areasoutside the CHHA. In 57% of our sample, communitiesexhibit parallel patterns inside and outside the CHHA. Inthese cases, there is no evidence of differential growthmanagement controls inside and outside the CHHA. Wesaw evidence in 20% of our sample, however, that com-munities may have implemented policies that resulted ina decline in new residential units inside their CHHAsrelative to areas outside the CHHAs.
We turn now to a formal test of whether or not post-plan residential growth rates within CHHAs were signifi-cantly different from those that occurred prior to planapproval in the early 1990s, and whether the pre-plan/post-plan pattern inside CHHAs differed significantly fromthat observed within areas outside the CHHA. We employa Mann-Whitney-Wilcoxon test of differences in mediansbecause none of the variables is normally distributed.7
Table 2 presents the four-way comparison.All else being equal, we would expect slower residential
growth rates within CHHAs after plan approval than beforeif coastal communities were effectively implementingpolicies to limit growth within CHHAs. Table 2 showsthis to be the case (a drop from 67% to 14%). The Mann-Whitney-Wilcoxon test reveals the difference to be statis-tically significant at better than the 99% confidence level.Further examination of Table 2 shows, however, a similar,statistically significant decline in the median growth ratefor numbers of residential units built outside of CHHAs.
356 Journal of the American Planning Association, Summer 2008, Vol. 74, No. 3
Table 1. Aggregate changes in residential hurricane exposure insideCHHAs and HVZs between plan approval year and 2002.
ExtrapolationOur sample to entire state
Exposure parameter (n = 89) (n = 193)
Residential units 152,697 425,000Total population 345,766 958,0002002 just value of residential
improved property $29 billion $80 billion
74-3 06 323128 Deyle P 7/11/08 9:04 AM Page 356D
ownl
oade
d by
[U
nive
rsite
De
Pari
s 1]
at 0
8:34
19
Aug
ust 2
013

Deyle et al.: The Proof of the Planning Is in the Platting 357
Figure 2. Numbers of residential units built in unincorporated Gulf County by year and location.
0
50
100
150
200
250
300
1960 1965 1970 1975 1980 1985 1990 1995 2000Year
Nu
mb
er o
f U
nit
s
Inside CHHA
Outside CHHA
Year
Figure 3. Numbers of residential units built in the city of Niceville by year and location.
0
25
50
75
100
125
150
175
200
225
1960 1966 1972 1978 1984 1990 1996 2002
Year
Num
ber
of U
nits
Inside CHHA
Outside CHHA
Year
Comp planadopted
Comp planadopted
74-3 06 323128 Deyle P 7/11/08 9:04 AM Page 357D
ownl
oade
d by
[U
nive
rsite
De
Pari
s 1]
at 0
8:34
19
Aug
ust 2
013

This parallel trend both inside and outside of CHHAsmay be evidence that the post-plan approval decline withinCHHAs was due to broader phenomena such as the overallimpacts of comprehensive plan implementation independentof policies directed specifically at CHHAs, or limitedsupplies of vacant land, reduced rates of population growth,or slower economic growth. It is very likely that the supplyof vacant residential land declined over this time period. Inaddition, the population growth rate in these 15 countieswas substantially greater between 1980 and 1990 (45%increase) than between 1990 and 2000 (25%; U.S. CensusBureau, 2001). Thus, the observed declines in numbers ofnew residential units after plan approval may not reflectthe direct impacts of plan implementation.
Table 2 also shows that the median growth rates insideand outside of CHHAs were not significantly differentprior to the approval of local comprehensive plans (67%versus 77%). However, the median post-plan growth rateinside CHHAs after plan approval was significantly lowerthan that outside CHHAs (14% versus 28%). Thus, itappears that some factors above and beyond those affectingthe whole jurisdictions may have been at work during thepost-plan-approval period. It is possible, for example, thatthere were greater constraints on the vacant land supplyinside the CHHAs than outside, or that other factors mayhave contributed to these observed differences.
We therefore designed a variable to control for thesupply of vacant land at the start of each analysis period:growth density. We defined growth density as the numberof new residential units built within an analysis perioddivided by the acres of vacant land suitable for residentialdevelopment at the start of the analysis period. We codedparcels as available for residential development if they weredesignated by the county property appraiser as vacantresidential land or unimproved agricultural land with noprimary residence. We also assumed that parcels coded asresidential in the final year of the pre-plan period or in2002 were vacant residential land prior to the year in whichthe current residential structure was built.
Table 3 presents the results of a pre-plan/post-plancomparison of growth densities inside and outside ofCHHAs. Here we see a significantly different pattern thanin Table 2. Median growth densities inside CHHAs weresignificantly higher than those outside CHHAs before planapproval. This no doubt reflects the greater developmentpressure inside CHHAs. However, Table 3 also reveals thatthis pattern did not change significantly in the post-planenvironment when communities should have been reducingdevelopment densities inside CHHAs. In fact, the compar-isons show the median growth density inside CHHAs afterplan approval to be higher than pre-plan, although thedifference just barely fails the significance test at the 90%
358 Journal of the American Planning Association, Summer 2008, Vol. 74, No. 3
Figure 4. Numbers of residential units built in unincorporated Sarasota County by year and location.
0
500
1000
1500
2000
2500
3000
3500
1960 1965 1970 1975 1980 1985 1990 1995 2000
Year
Nu
mb
er o
f U
nit
s
Inside CHHA
Outside CHHA
Year
Comp planadopted
74-3 06 323128 Deyle P 7/11/08 9:04 AM Page 358D
ownl
oade
d by
[U
nive
rsite
De
Pari
s 1]
at 0
8:34
19
Aug
ust 2
013

level. The median post-plan growth density is slightly lowerthan pre-plan outside CHHAs, but the difference is notstatistically significant.
Thus, with a control for the vacant land supply, thestory told by simple growth rates is contradicted. It appearsthat in the aggregate, residential development patternsinside CHHAs after plan approvals were not consistent withthe state’s mandate to adopt and implement comprehensiveplan policies limiting development in such areas.
Plan Quality: Does Plan ContentMake a Difference?
In this section we contribute to the second line ofplan implementation research by employing bivariate andmultivariate statistical analyses to assess whether or notbetter local comprehensive plans are associated with morelimited residential development of the available vacant landinside CHHAs. The specific hypothesis we test is thatcommunities whose comprehensive plans have the followingattributes will exhibit lower post-plan residential growthdensities inside their CHHAs than those communitieswhose plans do not:
1. more restrictive CHHA definitions,2. maps of the CHHA, and3. stronger policies limiting vulnerability of populations
inside CHHAs.
Research DesignWe undertook two levels of statistical analysis to test
the influence of our measures of plan quality on post-plangrowth density: (1) correlation analyses using Kendall’stau-b, and (2) regression analyses based upon the resultsof the bivariate correlation analyses. In addition to ourexperimental plan quality variables, we specified a set ofcontrol variables for the multivariate analyses.
We employed the bivariate correlation analyses to testthe basic relationships between our plan quality variablesand post-plan growth density. Given the relatively smallnumber of cases to which the regressions were applied (76),it was important that we be parsimonious with respect tothe number of independent variables included in themodels. Thus, we also used the correlations to identify themost promising, least-correlated control variables. Weutilized the non-parametric Kendall’s tau-b statistic as ourcorrelation measure because our plan quality variables areordinal and because several of our control variables and ourdependent variable exhibit non-normal distributions.8 Theordinal nature of our plan quality variables and concernsabout normality also led us to transform the dependentvariable from raw growth density values to ranked values.9
Plan Quality Variables. For each of the 76 localjurisdictions in our sample that included land both insideand outside a CHHA, we conducted a content analysis ofthe coastal element of the comprehensive plan that wasapproved by DCA in the late 1980s to early 1990s, aswell as that which was in effect in 2002.10 Each plan wasindependently scored by two evaluators who comparedscores for each variable and resolved any differencesthrough negotiation.
The content analysis focused on the following threecomponents of the local comprehensive plans: the CHHAdefinition; mapped representation of the CHHA; and thestate’s mandated growth management policies to limit publicexpenditures within the CHHA, direct populations awayfrom the CHHA, and maintain evacuation times within theHVZ. We scored the CHHA definition and each of thegrowth management policies on a scale of 0 to 3 as follows:
0 = no definition/policy in evidence;1 = definition/policy that mirrored the state mandate;2 = definition/policy that was somewhat more restrictive
than the state mandate; and
Deyle et al.: The Proof of the Planning Is in the Platting 359
Table 2. Median rates of growth in residential units before and aftercomprehensive plan approval inside and outside of CHHAs (n = 58).
Mann-Before After Whitney-plan plan Wilcoxon
Location approval approval p
Inside CHHA 67% 14% <0.0002Outside CHHA 77% 28% <0.0002Mann-Whitney-Wilcoxon p 0.1867 0.0003
Table 3. Median residential growth densities before and aftercomprehensive plan approval inside and outside of CHHAs (n = 58).
Mann-Before After Whitney-plan plan Wilcoxon
Location approval approval p
Inside CHHA 2.06 2.20 0.1075Outside CHHA 1.35 1.23 0.2514Mann-Whitney-Wilcoxon p <0.0002 <0.0002
74-3 06 323128 Deyle P 7/11/08 9:04 AM Page 359D
ownl
oade
d by
[U
nive
rsite
De
Pari
s 1]
at 0
8:34
19
Aug
ust 2
013

3 = definition/policy that was far more restrictive thanthe state mandate.
For the CHHA map variable, we assigned a score of 0if the CHHA was not represented on any map in the planand a score of 1 if it did appear there on a map. We defineda separate dichotomous variable indicating whether theCHHA was depicted on the future land use map (FLUM).In contrast to most states, under Florida’s growth manage-ment law, the FLUM, and accompanying policies in thefuture land use element of a community’s comprehensiveplan legally bound the development rights of propertyowners.11
Unlike some studies that have investigated the role ofplan quality on outcomes resulting from plan implemen-tation over a multi-year study period (Brody & Highfield,2005; Brody et al., 2006; Nelson & French, 2002), ourstudy investigated the effects of initial, as well as current,plan quality, knowing that plan content can change signifi-cantly over time. We also tested the influence of individualplan components rather than an overall index of planquality, as other plan implementation studies have done.This allowed us to determine whether specific policies,definitions, and mapping approaches were effective atlimiting development within the CHHA. Table 4 presentsan overview of these plan quality variables.
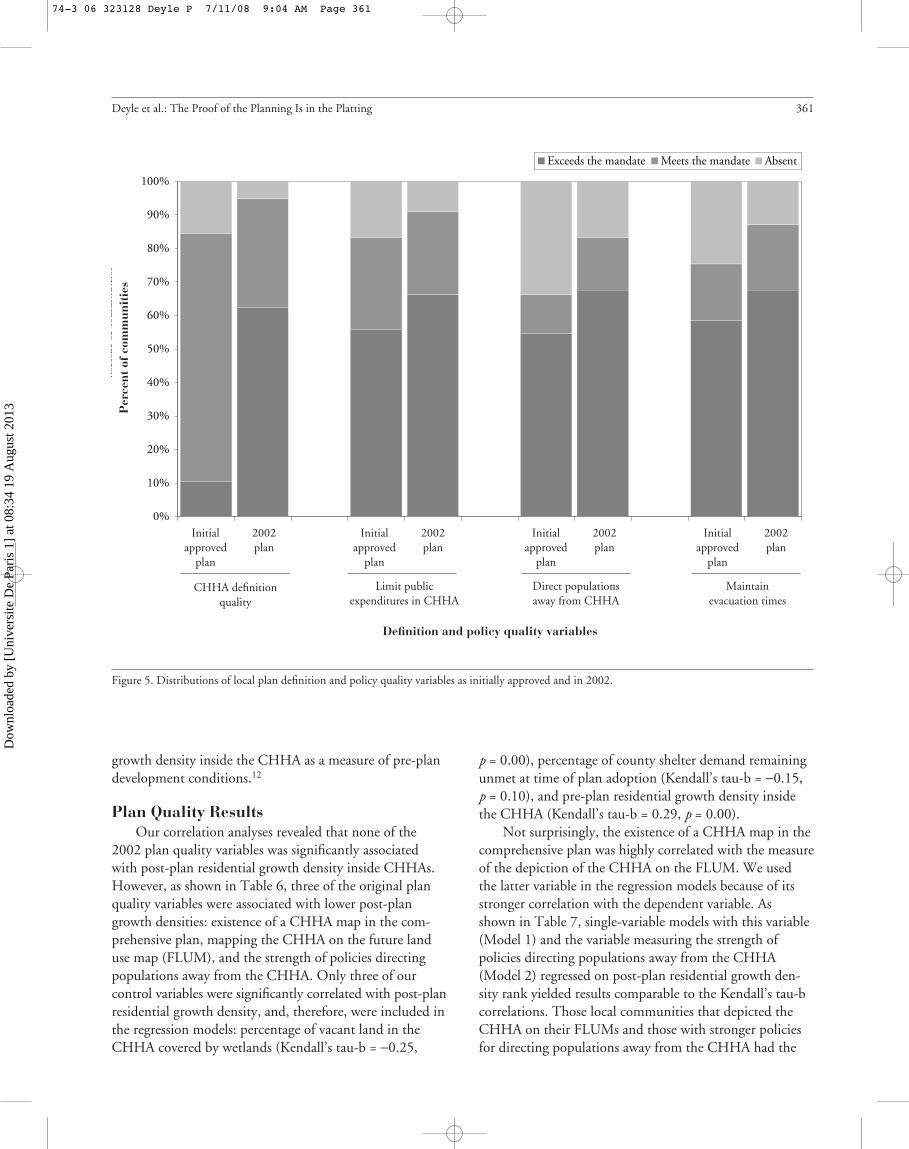
Figures 5 and 6 compare the distributions of local planquality scores for the initial plans approved by DCA andthe plans in 2002. Consistent with the findings of Deyleand Smith (1998), these figures demonstrate that initialplan quality was decidedly mixed. However, by 2002,quality had improved for each of the plan content variables,and the number of local governments not meeting the statehazard mitigation requirements had fallen substantially. In2002, some 10–12 years after initial plan approval, morethan 80% surpassed or met the state minimums for thedefinition requirement and each of the policy mandates.
Control Variables. While the plan quality variables areof primary interest, we also developed a number of variablesto control for alternative explanations of observed differencesin post-plan growth density (see Table 5). We included twovariables to control for the amount of vacant residentialland within the CHHA where development might beconstrained by state and federal regulatory policies: thepercentage of vacant land inside the CHHA in wetlandsand the percentage of vacant land inside the CHHA infederal Coastal Barrier Resource System (CBRS) units.We also included two additional variables to control forlocal planning and fiscal conditions: average annual percapita planning expenditures, which could reflect the abilityof local planning efforts to meet state mandates; and the
average percentage of annual local government own-sourcerevenues derived from ad valorem taxes, which couldinfluence the incentive to permit development at higherdensities and in areas less suitable for development.
A third set of variables controls for hurricane experienceand hurricane response issues. We controlled for recenthurricane histories, both before and after plan adoption,on the assumption that communities with more recentexperience with more damaging hurricanes would be morelikely to limit residential development within their CHHAs.We also included measures of unmet shelter demand andworst-case evacuation clearance times at the time of com-prehensive plan adoption, theorizing that jurisdictions withgreater unmet shelter demand or longer clearance timeswould be more likely to limit development within hurricanehazard zones.
Our final set of control variables attempts to controlfor market conditions at the time the original comprehen-sive plan was approved by the state. We used two measuresof population growth between 1980 and 1990 as proxiesfor real estate demand on the assumption that higher demandwould stimulate more development pressure inside CHHAs:net county population change and county populationgrowth rate. We also included the pre-plan residential
360 Journal of the American Planning Association, Summer 2008, Vol. 74, No. 3
Table 4. Plan quality variables determined both for the initial planapproved by DCA and for the plan in use in 2002.
Name Description
CHHA definition quality CHHA definition present in the comprehensive plan
CHHA map in comp plan Map depicting the CHHA present in thecomprehensive plan
CHHA mapped on FLUM CHHA depicted on the future land use map in the comprehensive plan
Limit public expenditures Quality of policies in the comprehensivein CHHA plan that limit public expenditures
subsidizing development inside the CHHA
Direct populations away Quality of policies in the comprehensive from CHHA plan that direct population
concentrations away from the CHHA and/or limit development inside the CHHA
Maintain evacuation times Quality of policies in the comprehensiveplan that maintain or reduce hurricane evacuation times inside the HVZ
74-3 06 323128 Deyle P 7/11/08 9:04 AM Page 360D
ownl
oade
d by
[U
nive
rsite
De
Pari
s 1]
at 0
8:34
19
Aug
ust 2
013
growth density inside the CHHA as a measure of pre-plandevelopment conditions.12
Plan Quality ResultsOur correlation analyses revealed that none of the
2002 plan quality variables was significantly associatedwith post-plan residential growth density inside CHHAs.However, as shown in Table 6, three of the original planquality variables were associated with lower post-plangrowth densities: existence of a CHHA map in the com-prehensive plan, mapping the CHHA on the future landuse map (FLUM), and the strength of policies directingpopulations away from the CHHA. Only three of ourcontrol variables were significantly correlated with post-planresidential growth density, and, therefore, were included inthe regression models: percentage of vacant land in theCHHA covered by wetlands (Kendall’s tau-b = −0.25,
p = 0.00), percentage of county shelter demand remainingunmet at time of plan adoption (Kendall’s tau-b = −0.15,p = 0.10), and pre-plan residential growth density insidethe CHHA (Kendall’s tau-b = 0.29, p = 0.00).
Not surprisingly, the existence of a CHHA map in thecomprehensive plan was highly correlated with the measureof the depiction of the CHHA on the FLUM. We usedthe latter variable in the regression models because of itsstronger correlation with the dependent variable. Asshown in Table 7, single-variable models with this variable(Model 1) and the variable measuring the strength ofpolicies directing populations away from the CHHA(Model 2) regressed on post-plan residential growth den-sity rank yielded results comparable to the Kendall’s tau-bcorrelations. Those local communities that depicted theCHHA on their FLUMs and those with stronger policiesfor directing populations away from the CHHA had the
Deyle et al.: The Proof of the Planning Is in the Platting 361
Figure 5. Distributions of local plan definition and policy quality variables as initially approved and in 2002.
0%
10%
20%
30%
40%
50%
60%
70%
80%
90%
100%
Perc
ent o
f com
mun
itie
s
Initialapproved
plan
CHHA definitionquality
Definition and policy quality variables
Per
cen
t of
com
mu
nit
ies
Limit publicexpenditures in CHHA
Direct populationsaway from CHHA
Maintainevacuation times
2002plan
Initialapproved
plan
2002plan
Initialapproved
plan
2002plan
Initialapproved
plan
2002plan
0%
10%
20%
30%
40%
50%
60%
70%
80%
90%
100%
Exceeds the mandate Meets the mandate Absent
74-3 06 323128 Deyle P 7/11/08 9:04 AM Page 361D
ownl
oade
d by
[U
nive
rsite
De
Pari
s 1]
at 0
8:34
19
Aug
ust 2
013

desired planning outcome: lower post-plan growth densitiesinside their CHHAs.13
When pre-plan growth density inside the CHHA iscontrolled for, the explanatory power of the models in-creases substantially. The adjusted R 2 values increase from0.05 and 0.03 to 0.22 and 0.15 (see Models 3 and 4). TheCHHA map variable remains significant (Model 3) withthe addition of the pre-plan growth density control, butthe policy quality variable is no longer significant (Model4). The other two control variables are also significantwhen added to Models 1 and 2 (not shown), but theireffects are subsumed by the pre-plan growth density rankvariable in the fully specified model (Model 5).
Discussion
Our findings present a somewhat mixed picture of theimpact Florida’s hazard mitigation planning mandate has
had on residential development in areas prone to hurricaneflood damage. Our post-plan residential developmentindicators (Table 1) reveal that residential units, associatedpopulation, and the market value of new residential struc-tures increased very substantially within these hazard zones.When we look more closely, we find trends in post-planresidential development in a majority of communities thatsuggest a lack of constraint on growth inside CHHAs.
We find that the post-plan median growth rate insideCHHAs was significantly less than both the pre-planmedian growth rate inside CHHAs and the post-planmedian growth rate outside CHHAs (Table 2). However,when we control for the supply of vacant land suitable forresidential development at the outset of each analysisperiod (Table 3), we find additional evidence that coastalcommunities have failed, in the aggregate, to limit resi-dential development inside their CHHAs after the stateapproved their comprehensive plans in the late 1980s andearly 1990s.
362 Journal of the American Planning Association, Summer 2008, Vol. 74, No. 3
Figure 6. Distributions of local plan CHHA map quality variables as initially approved and in 2002.
0%
10%
20%
30%
40%
50%
60%
70%
80%
90%
100%
Perc
ent o
f com
mun
itie
s
Map quality variables
Per
cen
t of
com
mu
nit
ies
CHHA mapped on FLUM
Initialapproved plan
2002 plan
CHHA map in comprehensive plan
Initialapproved plan
2002 plan
0%
10%
20%
30%
40%
50%
60%
70%
80%
90%
100%
Present Absent
74-3 06 323128 Deyle P 7/11/08 9:05 AM Page 362D
ownl
oade
d by
[U
nive
rsite
De
Pari
s 1]
at 0
8:34
19
Aug
ust 2
013

Our statistical analyses of the influence of plan qualityon residential development (Tables 6 and 7) provideevidence that showing CHHA boundaries on the FLUMin a community’s comprehensive plan is associated withlower post-plan residential growth densities inside CHHAs,independent of previous growth patterns, plan policyquality, or state or federal regulatory constraints on the
supply of vacant residential land. However, the plan qualitycoefficient is no longer significant when the pre-plangrowth density control variable is added to the model.One possible interpretation is that communities that werealready limiting development within areas susceptible tohurricane flooding prior to the enactment of the state’s1985 growth management legislation were more likely toadopt stronger policies for limiting development insideCHHAs in their post-1985 comprehensive plans.
These findings invite questions about why the state’smandate and its implementation by local governmentsshould have had such marginal effects. Here we suggestsome possible explanations based on the circumstancesfaced by many coastal communities, supplemented byinsights gleaned from structured telephone interviews withstate officials and with local planning officials in a sampleof 12 case study communities chosen for variety in com-posite plan quality scores14 and post-plan growth densities.These interviews focused on determining the underlyingreasons for the level of post-plan residential developmentin each community.
Deyle et al.: The Proof of the Planning Is in the Platting 363
Table 5. Overview of control variables.
Name Description Source
Percentage of CHHA vacant land in wetlands Percentage of vacant land inside the CHHA covered by wetlands Calculated by authors
Percentage of CHHA vacant land in CBRS units Percentage of vacant land inside the CHHA covered by Coastal Calculated by authorsBarrier Resource System units
Per capita planning expenditures Average annual per capita planning expenditures Florida Department of Financial Services
Percentage of revenue from property taxes Average annual percentage of community’s own-source revenues Florida Department of derived from ad valorem taxes Financial Services
Pre-plan hurricane history Average intensity of all hurricanes to pass within 65 nautical Calculated by authorsmiles during the pre-plan period weighted by relative damage and number of years prior to plan adoption of most recent hurricane
Post-plan hurricane history Average intensity of all hurricanes to pass within 65 nautical miles Calculated by authorssubsequent to plan adoption weighted by relative damage and average of number of years between plan approval and all hurricanes
Percentage of shelter demand unmet at plan Percentage of county shelter demand remaining unmet at time of Regional Hurricaneadoption plan adoption Evacuation Studies
Evacuation time at plan adoption Estimate of worst-case evacuation clearance time at time of comp Regional Hurricaneplan adoption Evacuation Studies
1980–1990 county population increase Net county population increase between 1980 and 1990 U.S. Census Bureau
1980–1990 county population growth rate Rate of increase in county population between 1980 and 1990 U.S. Census Bureau
CHHA pre-plan growth density Pre-plan residential growth density inside the CHHA Calculated by authors
Table 6. Kendall’s tau-b correlations of post-plan growth densities withoriginal plan quality variables (n = 76).
Plan quality variables Coefficient Significance
CHHA definition quality −0.04 0.64CHHA map in comp plan −0.17 0.08c
CHHA mapped on FLUM −0.20 0.03*Limit public expenditures in CHHA −0.06 0.47Direct populations away from CHHA −0.16 0.07c
Maintain evacuation times −0.10 0.23c
cp < 0.10 *p < 0.05
74-3 06 323128 Deyle P 7/11/08 9:05 AM Page 363D
ownl
oade
d by
[U
nive
rsite
De
Pari
s 1]
at 0
8:34
19
Aug
ust 2
013

Possible Constraints on LimitingDevelopment Inside CHHAs
A literal interpretation of the state’s mandate to includepolicies to “limit development in” and “direct populationsaway from” CHHAs could imply stopping developmentaltogether in such areas or, at the very least, reducing thedensities allowed in such areas in the future land use elementof the plan and the corresponding zoning districts. Almostone quarter (16) of the 77 communities in our sample thathave land inside a CHHA have no land outside a CHHA.For these communities to comply with the state’s require-ment to limit development inside CHHAs and directpopulations away from these areas would require themto impose moratoria on their own growth.
Marlene Conaway (personal communication, October2006), former chief of comprehensive planning in theDivision of Community Planning of DCA, told us that theagency position was to prevent increases in allowabledensities inside CHHAs when reviewing proposed planamendments. The state was aware that absolute prohibitionson residential development could raise questions of takingsin state and federal courts or trigger the state’s property
rights statute, and recognized that it was clearly infeasiblefor local governments to buy out all undeveloped propertiesinside CHHAs. This pragmatic approach to reviewingamendments is consistent with the relatively low priorityDCA accorded requiring initial plan policies to conformto hurricane hazard mitigation mandates (Deyle & Smith,1998). However, former and current directors of the Di-vision of Community Planning, Valerie Hubbard (personalcommunication, February 2006) and Charles Gauthier(personal communication, December 27, 2007), maintainthat this approach has prevented substantial increases inresidential densities inside CHHAs.
Hubbard noted that many coastal communities whosemaximum allowable zoning densities were higher than theas-built densities when their comprehensive plans wereapproved under the 1985 act experienced pressure topermit higher density residential development inside theirCHHAs. In coastal communities with substantial quantitiesof vacant land at the time their new comprehensive planswere approved, property owners lobbied for increasing theallowable densities. In spite of the state mandate to directdevelopment away from CHHAs, many local governmentswere hesitant to down-zone property because of the Bert
364 Journal of the American Planning Association, Summer 2008, Vol. 74, No. 3
Table 7. Regression results for post-plan residential growth density rank (n = 76).
Variables Model 1 Model 2 Model 3 Model 4 Model 5
Percentage of CHHA vacant land in wetlands −0.00Std. error 0.00Sig. (2-tail) 0.12
Percentage of shelter demand unmet at plan adoption −11.42Std. error 8.28Sig. (2-tail) 0.17
CHHA mapped on FLUM −24.01* −25.32* −25.89*Std. error 11.74 9.97 10.19Sig. (2-tail) 0.03 0.13 0.01
Direct populations away from CHHA −3.87c −1.64 −0.22Std. error 2.15 2.14 2.10Sig. (2-tail) 0.07 0.45 0.92
CHHA pre-plan growth density rank 0.43 ** 0.40 ** 0.35**Std. error 0.11 0.12 0.12Sig. (2-tail) 0.00 0.00 0.00
Adj. R2 0.05 0.03 0.22 0.15 0.23F 0.03 0.08 0.00 0.00 0.00
cp < 0.10 *p < 0.05 **p < 0.01
74-3 06 323128 Deyle P 7/11/08 9:05 AM Page 364D
ownl
oade
d by
[U
nive
rsite
De
Pari
s 1]
at 0
8:34
19
Aug
ust 2
013

Harris Act (1995), the state’s property rights law (Weaver,2000). The Bert Harris Act requires local governments tonegotiate with and, if necessary, compensate landownerswhere regulations noticed for adoption or adopted afterMay 11, 1995, “inordinately burden” private property.
As of 2004, two years past the end of our study period,numerous claims under the act had been settled out ofcourt under a required pre-suit procedure, but few caseshad been litigated in the state’s circuit courts of appeal(University of Florida College of Law Conservation Clinic,2004). Thus, there remained considerable uncertainty aboutthe true legal constraints and potential costs the act imposedon local governments (Weaver, 2000). Three local planningofficials we interviewed mentioned this as influencing theircommunities’ decisions about residential developmentdensities inside the CHHA.
Even where communities attempted to follow both theletter and the spirit of the mandate to mitigate hurricanehazards by reducing allowable densities inside CHHAs ontheir FLUMs, the state’s vesting policy may have limitedtheir abilities. Under the vesting provisions of the stategrowth management statute (Florida Growth ManagementAct, 1985g) once a development “agreement” is issued bya local government, that development is governed by thelocal laws and policies in force at the time the agreementis issued. Subsequently adopted laws and policies can onlybe applied to a vested development where “[t]hey are notin conflict with the laws and policies governing the de-velopment agreement and do not prevent developmentof the land uses, intensities, or densities in the develop-ment agreement,” unless the local government makes anaffirmative finding after a public hearing that one of severalcircumstances applies.
The ramifications of this vesting provision are influ-enced by the structure of the development industry in thestate. In many parts of Florida, residential development isundertaken by large real estate firms that build large-scaleprojects in bursts of activity that respond to market con-ditions. As a result, where a developer holds vested landentitlements on a property, a community can add hundredsor thousands of new residential units within a very shortperiod of time, generating spikes in local developmentactivity that are linked to land use approvals made manyyears previously.
The state does not maintain a central database ofvested developments, nor do most communities havereadily available records of such information. Our interviewsrevealed, however, that vesting was a significant factor indictating post-plan densities inside the CHHAs of 7 of the12 case study communities. In an effort to assess the rep-resentativeness of the survey findings, we examined the
residential development trend graphs to look for evidencethat vesting may have played a role in determining theresidential development patterns that occurred after planapproval. Spikes in the numbers of new residential unitsthat deviate substantially from the general developmenttrend after plan adoption may indicate construction insuch vested developments. Figure 7 illustrates such apattern. Following this approach, we found evidence ofpossible vesting impacts within the CHHAs of 16 (26%)of the 61 communities in our sample that have land bothinside and outside of a CHHA.15 This proportion, whichis only half what our interviews suggested, is likely a lowerbound for vesting, because in some cases vested develop-ments are built out more slowly, producing a less obviousspike in the development trend graph.
What the Planners Tell UsThe case study interviews, as well as correspondence
and interviews with DCA Community Planning Divisionstaff (W. Banning, personal communication, October 2,2006; M. Conaway, personal communication, October2006; V. Hubbard, personal communication, February2006), revealed that most communities had zoning ordi-nances in effect before local adoption and state approval ofcomprehensive plans pursuant to the 1985 mandate. Withfew exceptions, the planners we interviewed reported thatthe densities allowed in those land development regulationswere incorporated in the future land use and coastal elementsof their post-1985 comprehensive plans. In three cases, PalmBeach Shores, Brevard County, and Hernando County,allowable densities were low to begin with. In several othercommunities, including Cape Canaveral, Panama CityBeach, Venice, and Vero Beach, allowable densities werefairly high at the outset and have remained so.
However, several of the case study communitiesemployed growth management strategies that contributedto lower post-plan growth densities inside their CHHAs.For example, Hernando County engaged in significantefforts to acquire land for conservation purposes, much ofwhich was inside the CHHA, while Pasco County boughtland inside the CHHA with the explicit intention oflimiting development there. Brevard County down-zonedproperty within a significant portion of its CHHA becauseof evacuation clearance time concerns unrelated to specificstate planning mandates. DCA staff report that several othercommunities not included in our sample intentionallyreduced allowable densities inside their CHHAs at the timethey fashioned their original post-1985 plans (C. Gauthier,personal communication, December 27, 2007).
In contrast, other local governments started withrelatively weak coastal elements. The St. Johns County
Deyle et al.: The Proof of the Planning Is in the Platting 365
74-3 06 323128 Deyle P 7/11/08 9:05 AM Page 365D
ownl
oade
d by
[U
nive
rsite
De
Pari
s 1]
at 0
8:34
19
Aug
ust 2
013

1990 plan lacked a policy explicitly directing populationconcentrations away from the CHHA, and pre-plan allow-able densities inside the CHHA were as high as 15 unitsper acre. A plan amendment adopted in 2000 reducedthose densities to as little as 8 units per acre; however, thecounty has only recently begun to revise its zoning ordinanceto reflect the lower densities in their amended future landuse element. The City of Melbourne has very high planquality scores and, while the 1988 comprehensive planreportedly reduced the maximum allowable densities tosome degree, they remain high at 10 units per acre.
The story is somewhat more complicated in otherplaces. Growth densities inside Okaloosa County’s CHHAincreased substantially between the pre-plan period (1.72units per acre) and the post-plan period (4.22 units peracre). Much of the county’s CHHA lies along the easternend of Santa Rosa Island, an area referred to locally asOkaloosa Island, where the land was deeded to the countyby the federal government in the 1940s with the stipulationthat it be used for public purposes. As a result, until re-cently, all private development in the Okaloosa Island areahas been done under long-term leases governed by a set ofcovenants. These covenants pre-date the county’s 1990comprehensive plan and were reflected in the maximum
allowable densities contained in the plan. The remainingportion of the county’s CHHA lies east of the City ofDestin. In this area, maximum allowable densities rangefrom 4 to 25 units per acre. These are largely consistentwith zoning that was in place at the time the plan wasadopted, although the county did down-zone some areasin 2000.
Rural, conservative Gulf County’s plan quality islargely the result of a stipulation agreement imposed byDCA in 1992 that mandated stronger plan policies. How-ever, the county’s very low growth densities appear to be afunction of relatively little development pressure prior to2002 and the fact that roughly 90% of the county’s vacantresidential land inside the CHHA lies within wetlands.
Conclusions
Taken as a whole, our findings suggest that localimplementation of Florida’s planning mandate to limitdevelopment within hurricane hazard areas has had limitedimpact on coastal residential development densities. Wefind that in the aggregate, residential development insideCHHAs has continued at roughly the same intensity as
366 Journal of the American Planning Association, Summer 2008, Vol. 74, No. 3
Figure 7. Numbers of residential units built in City of Destin by year and location.
0
100
200
300
400
500
600
700
800
1979 1981 1983 1985 1987 1989 1991 1993 1995 1997 1999 2001Year
Nu
mb
er o
f U
nit
s
Inside CHHA
Outside CHHA
Year
Comp planadopted
74-3 06 323128 Deyle P 7/11/08 9:05 AM Page 366D
ownl
oade
d by
[U
nive
rsite
De
Pari
s 1]
at 0
8:34
19
Aug
ust 2
013

before the approval of plans adopted under the state’s 1985growth management legislation. Our findings also indicatethat plan quality has had only marginal impacts on devel-opment, with little evidence that higher quality compre-hensive plan policies generated more desirable planningoutcomes. The one exception, however, is our finding thatshowing the critical area boundary, the CHHA, on thefuture land use map, is associated with lower residentialdevelopment densities inside the CHHA after plan approval.
Our statistical models and our case studies suggest thatin general, higher quality comprehensive plan policiesreflected existing practice at the time plans were adoptedpursuant to the 1985 state mandate rather than signalingchange. Local comprehensive plans generally served toreinforce development patterns that existed at the time ofplan preparation rather than altering them. Interviewswith state officials suggest that the state continued to giverelatively low priority to enforcing the state mandate, asdocumented by Deyle and Smith (1998), only holdingthe line at the status quo when reviewing subsequentcomprehensive plan amendments. DCA officials maintain,however, that the agency has staved off substantial increasesin CHHA density that have been sought through planamendments. Our analysis of plan quality shows that thecontent of coastal elements improved over time, but thatthe higher quality plans in effect in 2002 do not explainthe post-plan residential development patterns observedup to that year.
The bald evidence of substantial increases in the num-bers of people and the amount of property at risk withinFlorida’s hurricane hazard zones suggests a general failure oflocal and state implementation. However, a more nuancedview seems appropriate when these findings are placed in thecontext of state vesting policies, the fact that allowable densi-ties had been established in many communities prior to theadoption of the post-1985 comprehensive plans, and thepolitical and legal hurdles to altering these entitlements.
For practitioners, our findings suggest that statemandates designed to alter development practices in criticalareas through adopting and implementing local compre-hensive plan policies that depart from existing practice mayhave marginal effects because of the legal and politicalinertia of previously adopted plans, policies, and regulations.While the planning process established by the 1985 FloridaGrowth Management Act called for the development oflocal comprehensive plans that would shape land develop-ment regulations, in practice the reverse often occurred.In almost all of our case study communities, the allowabledensities in the future land use element of the compre-hensive plan simply reflected the densities of the zoningordinance at the time the plan was created. Most coastal
communities made very few changes to their allowabledevelopment densities, even given the state mandate toadopt policies limiting development inside CHHAs.
The news is not all bad for proponents of compre-hensive planning, however. Our case studies and interviewswith state officials revealed that some communities sur-mounted these obstacles to reduce development intensityinside their CHHAs through down-zoning and landacquisition. The state’s plan amendment review processalso may have contributed to the progressive improvementof plan quality. While many of the initial comprehensiveplans had key shortcomings in their hurricane hazarddefinitions and mitigation policies, we found substantialimprovements in these provisions by 2002. Given time fortheir implementation, these changes are likely to be mani-fest in better conformity with the state’s goals of reducingvulnerability to hurricane flooding. We also found thatcommunities whose comprehensive plans depict the CHHAon the future land use map were more likely to have limitedresidential development within that critical area. Thisfinding underscores the importance of maps as instrumentsfor displaying and implementing plan policies, particularlythose showing critical areas. Clearly, more research isrequired to investigate and document the utility of mapsas a tool for implementing plan policies, but these findingssuggest that visual representations of policies were moreeffective at yielding desirable development outcomes thanrelying solely on descriptive policies.
For planning scholars, our findings draw attention tothe importance of controlling for pre-existing conditionswhen testing the impacts of planning interventions on planoutcomes. We show that for some plan quality variables,apparent correlations between plan content and post-planland use trends did not persist after controlling for pre-planland use trends. We also show that convenient assumptionsabout plan content stability may be flawed. We foundsubstantial changes in plan quality between initial planapprovals in the late 1980s and early 1990s and the year2002. We also found that policies in the initial plans pro-vided better explanations of post-plan approval developmentpatterns than did policies in place at the end of the post-plan approval study period. Unraveling changes in plancontent is tedious, but in Florida it can be done relativelyeasily because of the requirement for state review of majorcomprehensive plan amendments. An interesting questionthat invites further research is the extent to which theFlorida DCA has effectively prevented increases in thevulnerability of coastal populations and property to hurri-cane flooding by challenging proposed comprehensive planamendments that would be inconsistent with the requiredpolicies to direct development away from CHHAs.
Deyle et al.: The Proof of the Planning Is in the Platting 367
74-3 06 323128 Deyle P 7/11/08 9:05 AM Page 367D
ownl
oade
d by
[U
nive
rsite
De
Pari
s 1]
at 0
8:34
19
Aug
ust 2
013

Whereas Burby and Dalton (1994) concluded that“Plans can matter!” our work, along with that of Berke etal. (2006), suggests some modification to this conclusion,namely that well-designed plans can matter. However, thisstudy also highlights the challenges of inducing changes inlongstanding local development management practices,especially where pre-existing policies and regulations areperceived as having conferred development entitlementson property owners.
AcknowledgmentsThis research was conducted under the auspices of the Florida SeaGrant College Program with support from the National Oceanic andAtmospheric Administration, Office of Sea Grant, U.S. Department ofCommerce, Grant No. R/C-P-26. Additional funding was provided bythe Florida Department of Community Affairs and the DeVoe MooreCenter at Florida State University. We are deeply indebted to fourcohorts of graduate research assistants whose enthusiasm and diligencemade this work possible: Michelle Freeman, Daniel Harris, Alex Joyce-Peickert, Ramona Madhosingh, Nicholas Martinez, Brandie Miklus,John Richardson, Audrey Smith, Preeti Solanki, Lara Mae Webster, andChris Whittaker. We also wish to acknowledge the helpful suggestionsof six anonymous reviewers.
Notes1. The Department of Community Affairs is the state agency that wastasked with reviewing and certifying that all local comprehensive plansmeet the state’s minimum standards. This process began in 1988,although most local comprehensive plans were certified in 1990 and1991.2. Hurricane intensity is typically measured using the five-level Saffir-Simpson scale based on wind speed and storm surge height. Category 1hurricanes are characterized by wind speeds between 74 and 95 milesper hour and storm surge heights of 4 to 5 feet above mean sea level.A category 5 hurricane has wind speeds in excess of 155 mph and stormsurge heights in excess of 18 feet.3. Land use codes reported by county property appraisers in Florida forvacant parcels reflect the appraiser’s judgment of highest and best use.Thus, they are influenced by the zoning of the parcel as well as uses ofadjacent parcels.4. In most Florida counties property appraiser parcel maps includeseparate “parcel” polygons for each condominium or cooperative unitto provide a geographic reference for their unique ownership.5. This estimate is based on the proportion of total 2000 population inthe 35 coastal counties that is accounted for by the 15 counties in oursample (36%). This extrapolation implicitly assumes that our sample isalso proportionately representative of the spatial extent of CHHAs andHVZs throughout the state.6. A total of 61 jurisdictions from our sample of 89 coastal communitieshave land both inside and outside a CHHA. We could not constructcomplete pre-plan data for 3 of those communities, thus the sampleanalyzed here is 58. An additional 16 communities are completelycontained within their CHHAs, that is, they have no land outside theirCHHAs. The remaining 12 communities have no land inside a CHHA,but have some land inside an HVZ that would be flooded by a category3 hurricane.
7. The Mann-Whitney-Wilcoxon test (or simply the Mann-Whitneytest or Wilcoxon test) is used with ordinal data, or data that are notnormally distributed, to determine whether or not two independentsamples can be assumed to come from the same population (Conover,1980; Garson, 2008). Ranks are assigned to each observation from thecombined samples. The statistic tests whether the ranks of the individualobservations are randomly distributed between the two samples.Shapiro-Wilk tests for each of the variables are significant at the 99.9%level, indicating that their values are not normally distributed.8. Shapiro-Wilk test results were significant at the 99.9% level.9. This transformation captures rank-order statistical relationshipscomparable to those employed by the Kendall’s tau-b test. Althoughthe rank transformation sacrifices information about the variable, lossof statistical power in regression is not usually a consequence, and thetransformation generally ensures a normal distribution of error terms(Hettmansperger, 1978; Iman & Conover, 1979).10. Copies of original comprehensive plans were obtained from thearchives of the Florida Department of Community Affairs. We ascer-tained what the plan content had been in 2002 by comparing currentcomprehensive plan content with the original plans and, where thecurrent plans contained different language, using the DCA library ofcomprehensive plan amendments to determine when relevant plancontent was amended.11. A Florida community’s FLUM details the jurisdiction’s desired landuse mix and land use intensities over the planning horizon of the com-prehensive plan. All local land development regulations, including zoning,as well as individual development orders, must be consistent with theland uses, densities, and intensities set forth in the comprehensive plan(Florida Growth Management Act, 1985c). While the comprehensiveplan does not establish entitlements in the manner of the zoningordinance (Board of County Commissioners of Brevard County v. Snyder,1993), the future land use element and FLUM define the parametersthat must govern the zoning ordinance and other land developmentregulations.12. We recognize that these models are not fully specified, as evidencedby the low adjusted R2 values reported in Table 7. Although we haveincluded constraints upon developable land (acreage in wetlands andCBRS units) and accounted for the amount of developable land in ourdependent variable, ideally we would also control for variations indevelopment costs (e.g., land costs and construction costs). However,these data were not readily available for the counties included in theanalysis. We also acknowledge that our development demand proxieswould not capture shifts in the location of development demand thatmay have occurred in the early 1990s.13. All else equal, a community with the CHHA shown on their FLUMwould exhibit a growth density rank 24 positions lower than one withoutit, while a difference of one point on the quality of the local policydirecting populations away from the CHHA would lower a community’srank by roughly four positions.14. Composite plan quality score was computed by averaging the planscores for the original comprehensive plan and the 2000 comprehensiveplan for each jurisdiction. These scores were derived from an aggregateof the assigned values for four plan items: CHHA definition, CHHAmap, a policy for limiting public expenditures in the CHHA, and apolicy for directing populations away from the CHHA.15. We were able to assess development patterns after plan approval forevidence of vesting in the full set of 61 sampled jurisdictions with landinside and outside of a CHHA.
368 Journal of the American Planning Association, Summer 2008, Vol. 74, No. 3
74-3 06 323128 Deyle P 7/11/08 9:05 AM Page 368D
ownl
oade
d by
[U
nive
rsite
De
Pari
s 1]
at 0
8:34
19
Aug
ust 2
013

ReferencesAlexander, E., & Faludi, A. (1989). Planning and plan implementation:Notes on evaluation criteria. Environment and Planning B: Planning andDesign, 16 (2), 127–140.Alterman, R., & Hill, M. (1978). Implementation of urban land useplans. Journal of the American Institute of Planners, 44 (3), 274–285.Anderson, M. A. (1981). Planning policies and development control inthe Sussex Downs AOB. Town Planning Review, 52 (1), 5–25.Ben-Zadok, E. (2005). Consistency, concurrency, and compact devel-opment: Three faces of growth management implementation in Florida.Urban Studies, 42 (12), 2167–2190.Berke, P. R., Backhurst, M., Day, M., Ericksen, N., Laurian, L., Craw-ford, J., et al. (2006). What makes plan implementation successful? Anevaluation of local plans and implementation practices in New Zealand.Environment and Planning B: Planning and Design, 33 (4), 581–600.Berke, P. R., & French, S. P. (1994). The influence of state planningmandates on local plan quality. Journal of Planning Education andResearch, 13 (4), 237–250.Berke, P. R., Roenigk, D. J., Kaiser, E. J., & Burby, R. J. (1996).Enhancing plan quality: Evaluating the role of state planning mandatesfor natural hazard mitigation. Journal of Environmental Planning andManagement, 37 (2), 155–169.Bert Harris Act. (1995). Fla. Stat. § 70.001 (2007). Blacksell, M., & Gilg, A. (1977). Planning control in an Area ofOutstanding Natural Beauty. Social and Economic Administration,11 (3), 206–215.Blacksell, M., & Gilg, A. (1981). The countryside: Planning and chal-lenge. London: George Allen and Unwin.Board of County Commissioners of Brevard County v. Snyder, 627So. 2d 469 (Fla. 1993).British Tourism and Recreation Research Unit. (1981). The economy ofrural communities in the national parks of England and Wales. Edinburgh,UK: Author.Brody, S. D. (2003). Are we learning to make better plans? A longitudi-nal analysis of plan quality associated with natural hazards. Journal ofPlanning Education and Research, 23 (2), 191–201.Brody, S. D., & Highfield, W. E. (2005). Does planning work? Testingthe implementation of local environmental planning in Florida. Journalof the American Planning Association, 71 (2), 159–175.Brody S. D., Highfield, W. E., & Thornton S. (2006). Planning at theurban fringe: An examination of the factors influencing nonconformingdevelopment patterns in southern Florida. Environment and Planning B:Planning and Design, 33 (1), 75–96.Brotherton, I. (1992). On the quantity and quality of permit applications.Environment and Planning B: Planning and Design, 19 (4), 465–478.Burby, R. J. (Ed.). (1998). Cooperating with nature: Confronting naturalhazards with land-use planning for sustainable communities. Washington,DC: Joseph Henry Press.Burby, R. J., Bollens, S. A., Holway, J. M., Kaiser, E. J., Mullan, D., &Schaeffer, J. R. (1988). Cities under water: A comparative evaluation often cities’ efforts to manage floodplain use. Boulder: Institute of BehavioralScience, University of Colorado.Burby, R. J., & Dalton, L. C. (1994). Plans can matter! The role ofland use plans and state planning mandates in limiting the developmentof hazardous areas. Public Administration Review, 54 (3), 229–238.Burby, R. J., Deyle, R. E., Godschalk, D. R., & Olshansky, R. B. (2000).Creating hazard resilient communities through land-use planning.Natural Hazards Review, 1 (2), 99–106.Burby, R. J., & French, S. P. (1981). Coping with floods. Journal of theAmerican Planning Association, 47 (3), 289–300.
Burby, R. J., May. P. J., Berke, P. R., Dalton, L. C., French, S. P., &Kaiser, E. J. (1997). Making governments plan. Baltimore, MD: JohnsHopkins University Press. Burby, R. J., Salvesen, D., & Creed, M. (2006). Encouraging residentialrehabilitation with building codes: New Jersey’s experience. Journal ofthe American Planning Association, 72 (2), 183–196.Chapin, T. S., Connerly, C. E., & Higgins, H. T. (Eds.). (2007). Growthmanagement in Florida: Planning for paradise. London: Ashgate Press.Chapin, T. S., Deyle, R. E., & Baker, E. J. (2008). A parcel-based GISmethod for evaluating conformance of local land-use planning with astate mandate to reduce exposure to hurricane flooding. Environmentand Planning B: Planning and Design, 35 (2), 261–279.Conover, W. J. (1980.) Practical nonparametric statistics (2nd ed.). NewYork: Wiley.Cook, T. D., & Campbell, D. T. (1979). Quasi-experimental design andanalysis issues for field settings. Boston: Houghton Mifflin.Curry, N. (1992). Controlling development in the national parks ofEngland and Wales. Town Planning Review, 63 (2), 107–121.Definitions Rule, Fla. Admin. Code 9J-5.003(57) (2007).Deyle, R. E., & Smith, R. A. (1998). Local government compliancewith state planning mandates: The effects of state implementation inFlorida. Journal of the American Planning Association 64 (4), 457–469.Esnard, A. M., Brower, D., & Bortz, B. (2001). Coastal hazards and thebuilt environment on barrier islands: A retrospective view of Nags Headin the late 1990s. Coastal Management, 29 (1), 53–72.Florida Growth Management Act. (1985a). 1985 Fla. Laws ch. 55.Florida Growth Management Act. (1985b). Fla. Stat. § 163.3167(2007).Florida Growth Management Act. (1985c). Fla. Stat. § 163.3194(1)(b)and (3)(a) (2007).Florida Growth Management Act. (1985d). Fla. Stat. § 163.3191(2007).Florida Growth Management Act. (1985e). Fla. Stat. § 163.3184(2007).Florida Growth Management Act. (1985f). Fla. Stat. § 163.3178.1(2007).Florida Growth Management Act. (1985g). Fla. Stat. § 163.3233(2007).Garson, G. D. (2008). Tests for two independent samples. In Statnotes:Topics in multivariate analysis. Retrieved April 5, 2008, from http://www2.chass.ncsu.edu/garson/pa765/statnote.htmGilg, A., & Kelly, M. (1997). The delivery of planning policy in GreatBritain: Explaining the implementation gap new evidence from a casestudy of rural England. Environment and Planning C: Government andPolicy, 15 (1), 19–36.Godschalk, D. R., Beatley, T., Berke, P., Brower, D. J., & Kaiser, E. J.(1999). Natural hazard mitigation: Recasting disaster policy and planning.Washington, DC: Island Press.Godschalk, D. R., Brower, D. J., & Beatley, T. (1989). Catastrophiccoastal storms. Durham, NC: Duke University Press.Gregory, D. (1971). Green belts and development control: A case study ofthe West Midlands. Birmingham, UK: Centre for Urban and RegionalStudies, University of Birmingham.Hettmansperger, T. P. (1978). Statistical inference based on ranks.Psychometrika, 43 (1), 69–79.Iman, R., & Conover, W. J. (1979). The use of the rank transformationin regression. Technometrics, 21 (4), 499–509.Johnston, R., Schwartz, S., & Klinkner, T. (1978). Successful planimplementation: The growth phasing program of Sacramento County.Journal of the American Institute of Planners, 44 (4), 412–423.
Deyle et al.: The Proof of the Planning Is in the Platting 369
74-3 06 323128 Deyle P 7/11/08 9:05 AM Page 369D
ownl
oade
d by
[U
nive
rsite
De
Pari
s 1]
at 0
8:34
19
Aug
ust 2
013

Johnston, R., Schwartz, S., & Tracy, S. (1984). Growth phasing andresistance to infill development in Sacramento County. Journal of theAmerican Planning Association, 50 (4), 434–446.Keyes, J. (1986). Controlling residential development in the green belt:A case study. The Planner, 72 (11), 18–20.Law of May 11, 1993. (1993). Fla. Laws ch. 206 § 7.Local Government Comprehensive Planning Act. 1975 Fla. Laws ch.257 §§ 1–19.May, P. J., & Burby, R. J. (1996). Coercive versus cooperative policies:Comparing intergovernmental mandate performance. Journal of PolicyAnalysis and Management, 15 (2), 171–201.May, P. J., Burby, R. J., Ericksen, N. J., Handmer, J. W., Dixon, J. E.,Michaels, S., & Smith, D. I. (1996). Environmental management andgovernance: Intergovernmental approaches to hazards and sustainability.New York: Routledge.Mileti, D. S. (1999). Disasters by design: A reassessment of natural hazardsin the United States. Washington, DC: Joseph Henry Press.Moore, T., & Nelson, A. (1993). Case study of the effectiveness ofcoastal growth management in a growth management state. CoastalManagement, 21 (2), 197–208.Nelson, A., & French, S. (2002). Plan quality and mitigating damagefrom natural disasters: A case study of the Northridge earthquake withplanning policy considerations. Journal of the American PlanningAssociation, 68 (2), 194–207.Nelson, A., & Moore, T. (1996). Assessing growth management policyimplementation. Land Use Policy, 13 (4), 241–259.Olshansky, R. B., & Kartez, J. D. (1998). Managing land use to buildresistance. In R. J. Burby (Ed.), Cooperating with nature: Confrontingnatural hazards with land-use planning for sustainable communities (pp.167–201). Washington, DC: Joseph Henry Press.Pelham, T. G. (2001). Restructuring Florida’s growth managementsystem: Alternative approaches to plan implementation and concurrency.Florida Journal of Law and Public Policy, 12 (2), 299–310.
Pelham, T. G. (2007). A historical perspective for evaluating Florida’sevolving growth management process. In T. S. Chapin, C. E. Connerly,& H. T. Higgins (Eds.), Growth management in Florida: Planning forparadise, (pp. 7–19). London: Ashgate Press.Pielke, R. A. Jr., & Pielke, R. A. Sr. (1997). Hurricanes: Their natureand impacts on society. New York: Wiley.Preece, R. (1990). Development control studies: Scientific method andpolicy analysis. Town Planning Review, 61 (1), 59–73.Requirements for Coastal Management Goals, Objectives, andPolicies Rule, Fla. Admin. Code 9J-5.012(3)(b)(5) and (6) (2007).Talen, E. (1996a). After the plans: Methods to evaluate the imple-mentation success of plans. Journal of Planning Education and Research,16 (2), 79–91.Talen, E. (1996b). Do plans get implemented? A review of evaluationin planning. Journal of Planning Literature, 10 (3), 248–259.The H. John Heinz III Center. (2000). The hidden costs of coastalhazards: Implications for risk management and mitigation. Washington,DC: Island Press.United States Census Bureau. (2001). Census 2000 redistricting data(P.L. 94-171): Summary file and 1990 Census. Washington, DC:Author. Retrieved November 17, 2007, from http://quickfacts.census.gov/qfd/states/12000.htmlUniversity of Florida College of Law Conservation Clinic. (2004).Implementation of the model land development code for Florida springsprotection. Gainesville, FL: Author.Washington State Department of Community, Trade and EconomicDevelopment. (2003). Critical areas assistance handbook: Protectingcritical areas within the framework of the Washington Growth ManagementAct. Olympia, WA: Author.Weaver, R. L. (2000). Bert Harris Act. Reder’s Digest. RetrievedNovember 17, 2007, from http://www.redersdigest.com/index.cfm?nav=articles&articleid=6
370 Journal of the American Planning Association, Summer 2008, Vol. 74, No. 3
74-3 06 323128 Deyle P 7/11/08 9:05 AM Page 370D
ownl
oade
d by
[U
nive
rsite
De
Pari
s 1]
at 0
8:34
19
Aug
ust 2
013
![Leavitt Engineering July.pdf · .Subdivisions: platting, preliminary platting, topographic survey, and construction staking. HOW CAN WE HELP YOU? Call J. Reese Leavitt, P.E] S.E.,](https://img.dokumen.tips/doc/110x75/605a12f4bb835039f019bf5a/leavitt-julypdf-subdivisions-platting-preliminary-platting-topographic-survey.jpg)