Embed Size (px)
Citation preview

The promise of smart meters
and advanced analytics in
electricity distribution
Internet of Energy 2017
Kaspar Kaarlep
Head of Digital Network Technology
Elektrilevi
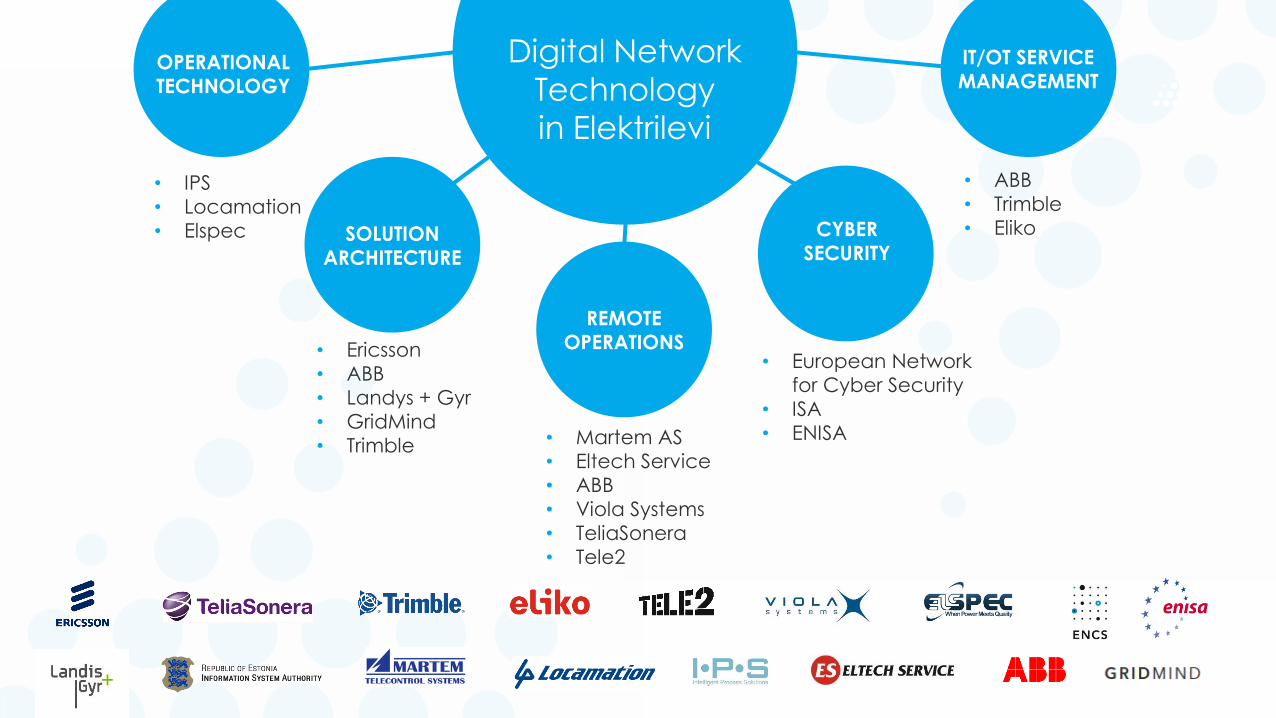
Digital Network
Technology
in Elektrilevi
OPERATIONAL
TECHNOLOGY
• IPS
• Locamation
• Elspec SOLUTION
ARCHITECTURE
• Ericsson
• ABB
• Landys + Gyr
• GridMind
• Trimble
REMOTE
OPERATIONS
• Martem AS
• Eltech Service
• ABB
• Viola Systems
• TeliaSonera
• Tele2
CYBER
SECURITY
• European Network
for Cyber Security
• ISA
• ENISA
IT/OT SERVICE
MANAGEMENT
• ABB
• Trimble
• Eliko
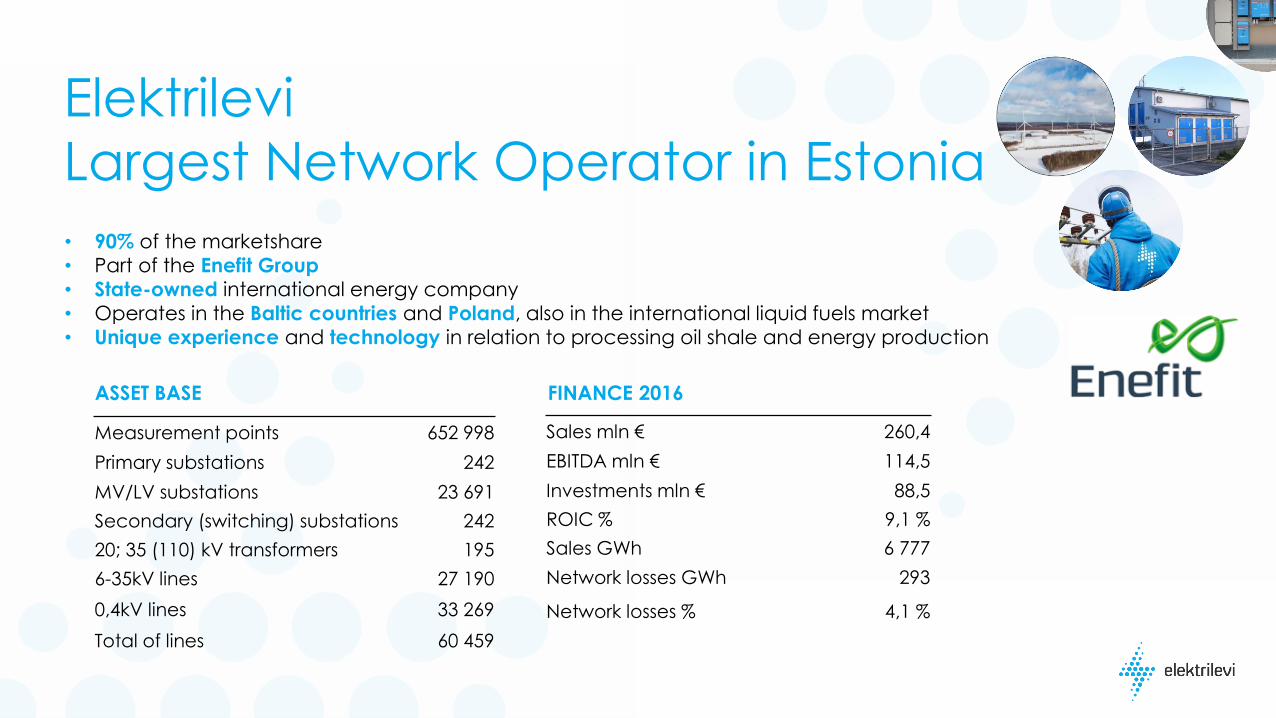
Elektrilevi
Largest Network Operator in Estonia
Measurement points 652 998
Primary substations 242
MV/LV substations 23 691
Secondary (switching) substations 242
20; 35 (110) kV transformers 195
6-35kV lines 27 190
0,4kV lines 33 269
Total of lines 60 459
ASSET BASE
• 90% of the marketshare
• Part of the Enefit Group
• State-owned international energy company
• Operates in the Baltic countries and Poland, also in the international liquid fuels market
• Unique experience and technology in relation to processing oil shale and energy production
FINANCE 2016
Sales mln € 260,4
EBITDA mln € 114,5
Investments mln € 88,5
ROIC % 9,1 %
Sales GWh 6 777
Network losses GWh 293
Network losses % 4,1 %

Two tracks in
extracting value
from data
• Improving existing business model by
redesigning business processes around
data-centric methods
• Unlocking new business models and
revenue streams in the emerging
home and industrial IoT space
GROWING THE
COMPANY’S
VALUE
MAINTAINING
EXISTING ASSET
EFFICIENCY
DATA ORIENTED
ASSET MANAGEMENT
Improving existing
business efficiency by
implementing new
data capabilities
Electricity
distribution
services
INCREASING
CUSTOMER
SATISFACTION
CULTIVATING
NEW REVENUE
STREAMS
NEW BUSINESS
DOMAINS
• Electric mobility
• Demand side
management
• Production
management
New
business
growth
Building the
Smart Grid comes down to…
WHEN to build WHAT?
Different answers and philosophies when approaching this
question will lead to very different systems in practice.

Fault location system
• Locating multi-phase short-circuit faults in the distribution network. Most useful for faults on remote lines.
• Measurements sent by an IED are collected by a SCADA system and transferred to a DMS system which then
automatically displays the location of the short-circuit fault on the screen of the operator.
RNA (Reliability based Network Analysis)
• Module of Trimble NIS
• Network reliabilty modelling and analysis on the basis of its elements, condition, environment and topology.
• Location of critical parts of the network
• Evaluation and comparison of planned network models in accordance to reliability parameters
Current systems have high maintenance costs
Element data:• Type
• Condition
• Defects
• Environment
ELEMENT
RELIABILITY
MODELLING
NETWORK
RELIABILITY
MODELLING
Network data:• Type
• Topology
• Environment
ECONOMICAL
CALCULATIONS
Client data:• Type of consumer
• Energy consumption
• Supply-interruption cast
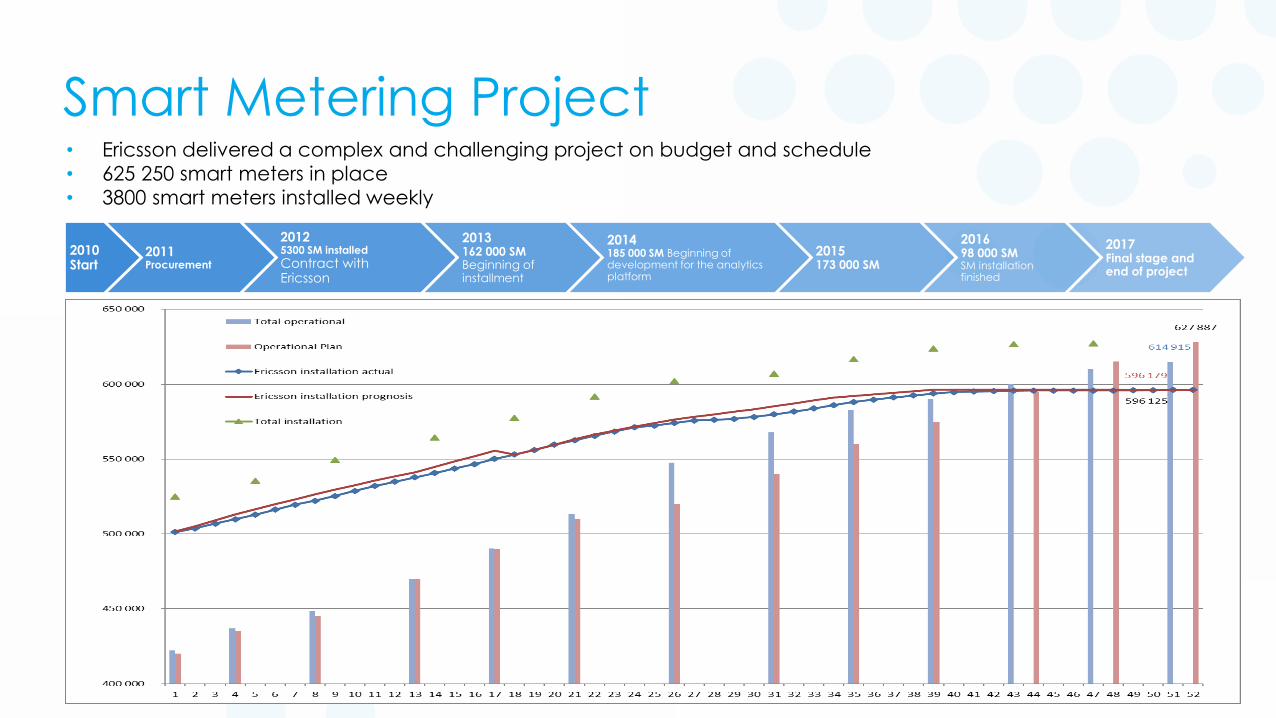
2010Start
2011Procurement
20125300 SM installed
Contract with Ericsson
2013162 000 SM Beginning of installment
2014185 000 SM Beginning of development for the analytics platform
2015173 000 SM
201698 000 SMSM installation finished
2017Final stage and end of project
Smart Metering Project • Ericsson delivered a complex and challenging project on budget and schedule
• 625 250 smart meters in place
• 3800 smart meters installed weekly
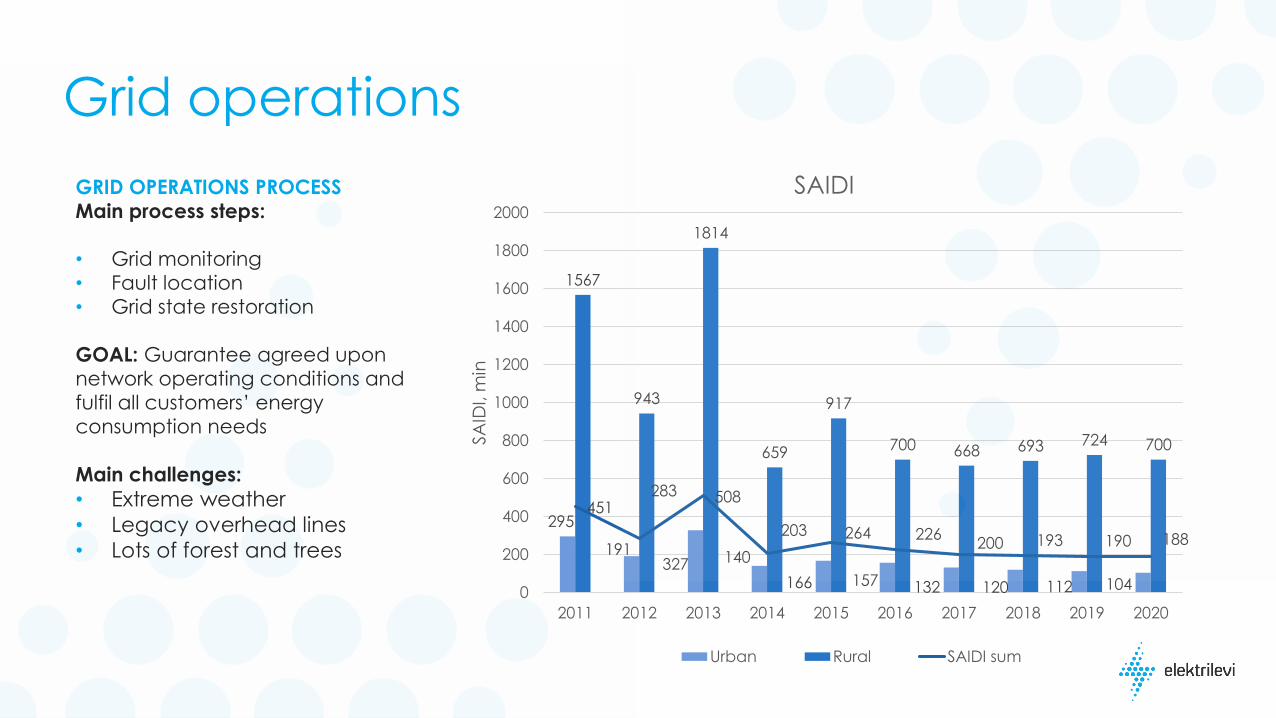
Grid operations
295
191327 140
166 157 132 120 112 104
1567
943
1814
659
917
700 668 693 724 700
451283 508
203 264 226200 193 190 188
0
200
400
600
800
1000
1200
1400
1600
1800
2000
2011 2012 2013 2014 2015 2016 2017 2018 2019 2020
SA
IDI, m
in
SAIDI
Urban Rural SAIDI sum
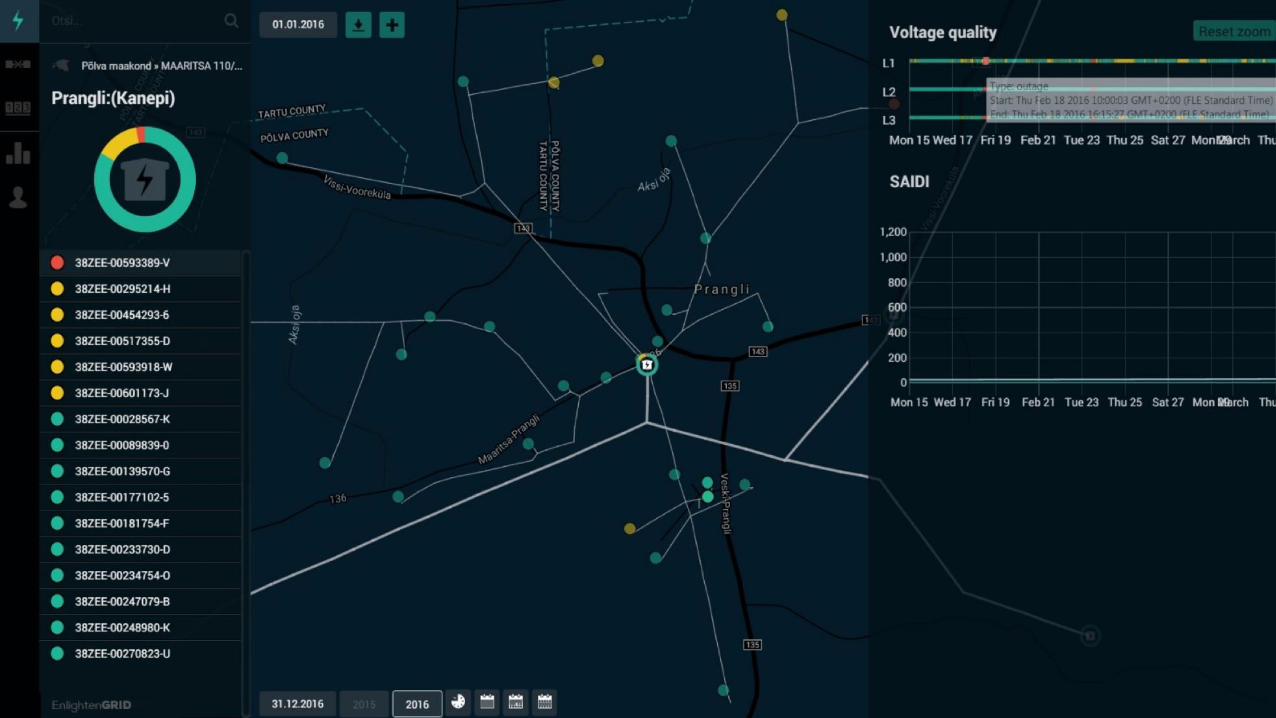
GRID OPERATIONS PROCESS
Main process steps:
• Grid monitoring
• Fault location
• Grid state restoration
GOAL: Guarantee agreed upon
network operating conditions and
fulfil all customers’ energy
consumption needs
Main challenges:
• Extreme weather
• Legacy overhead lines
• Lots of forest and trees

Client SAIDI in 2016
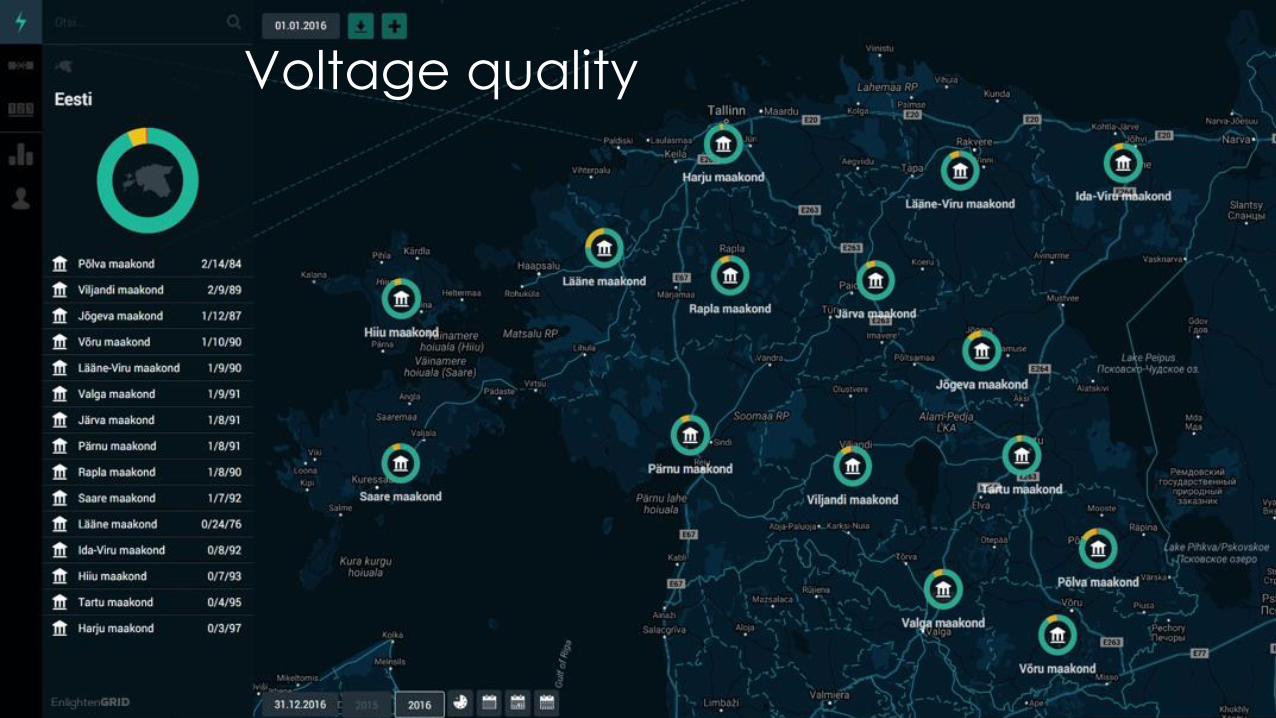
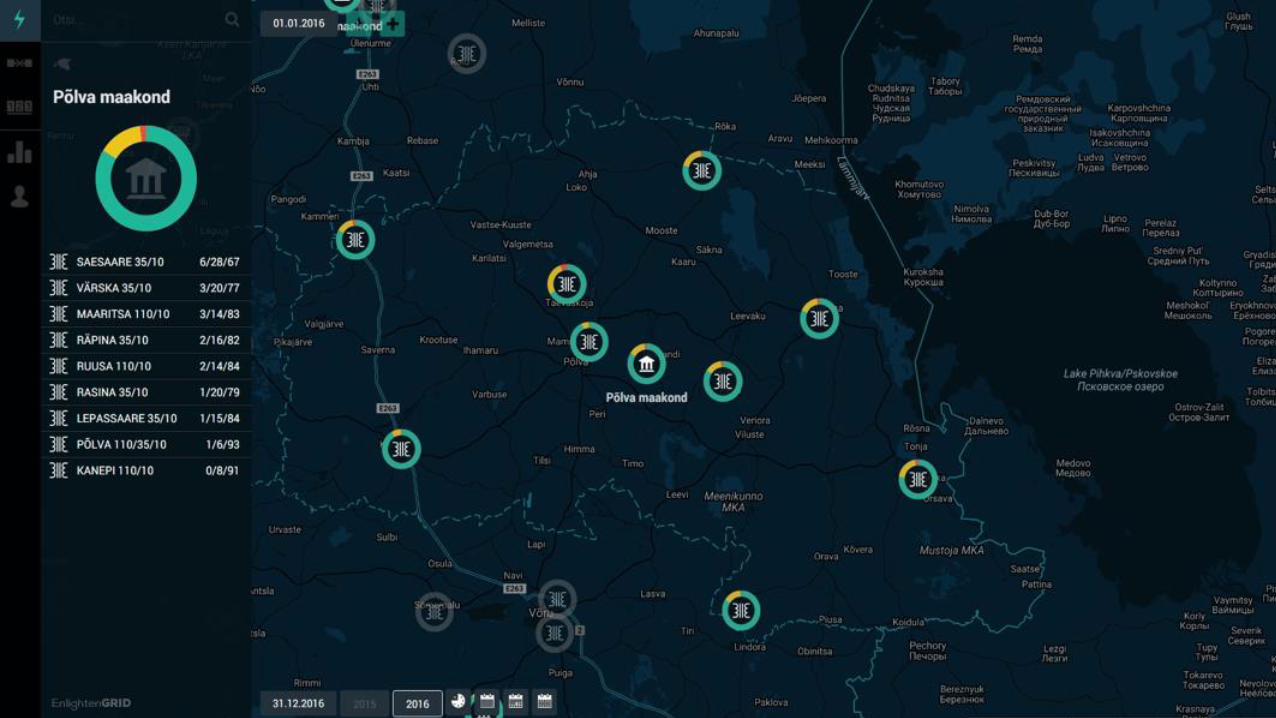
Voltage quality
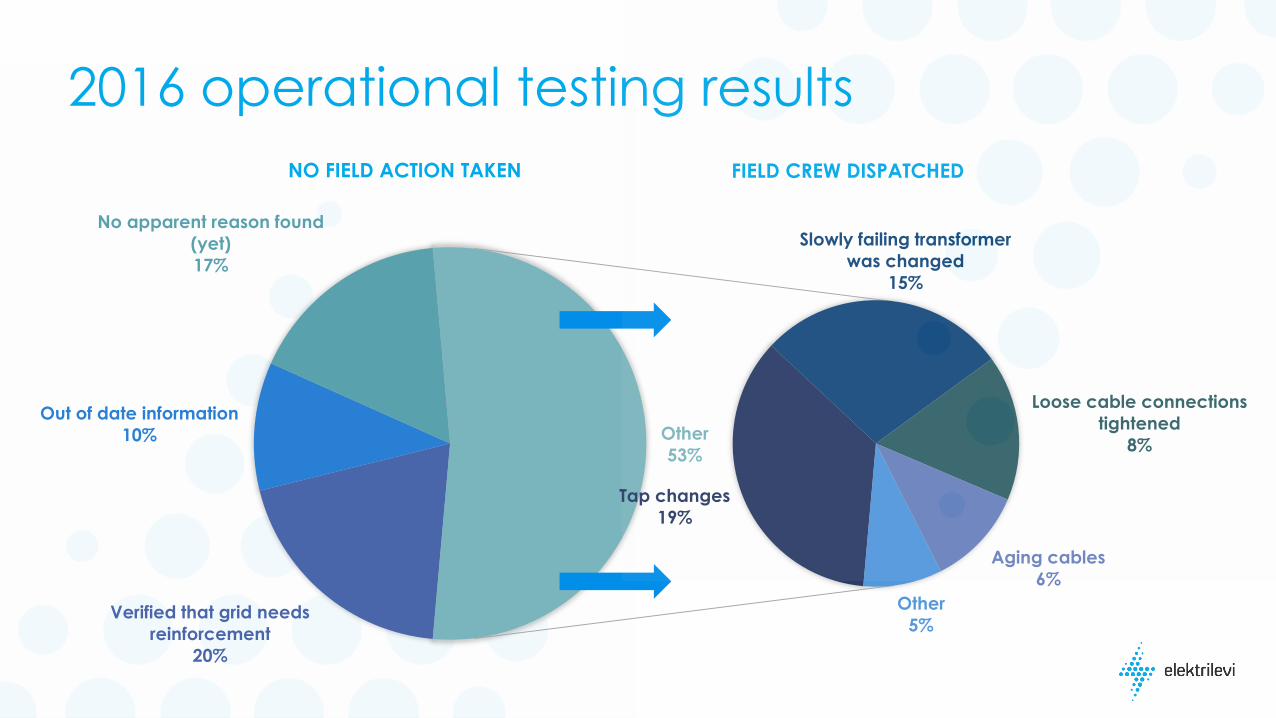
2016 operational testing results
Verified that grid needs
reinforcement
20%
Out of date information
10%
No apparent reason found
(yet)
17%
Tap changes
19%
Slowly failing transformer
was changed
15%
Loose cable connections
tightened
8%
Aging cables
6%
Other
5%
Other
53%
NO FIELD ACTION TAKEN FIELD CREW DISPATCHED
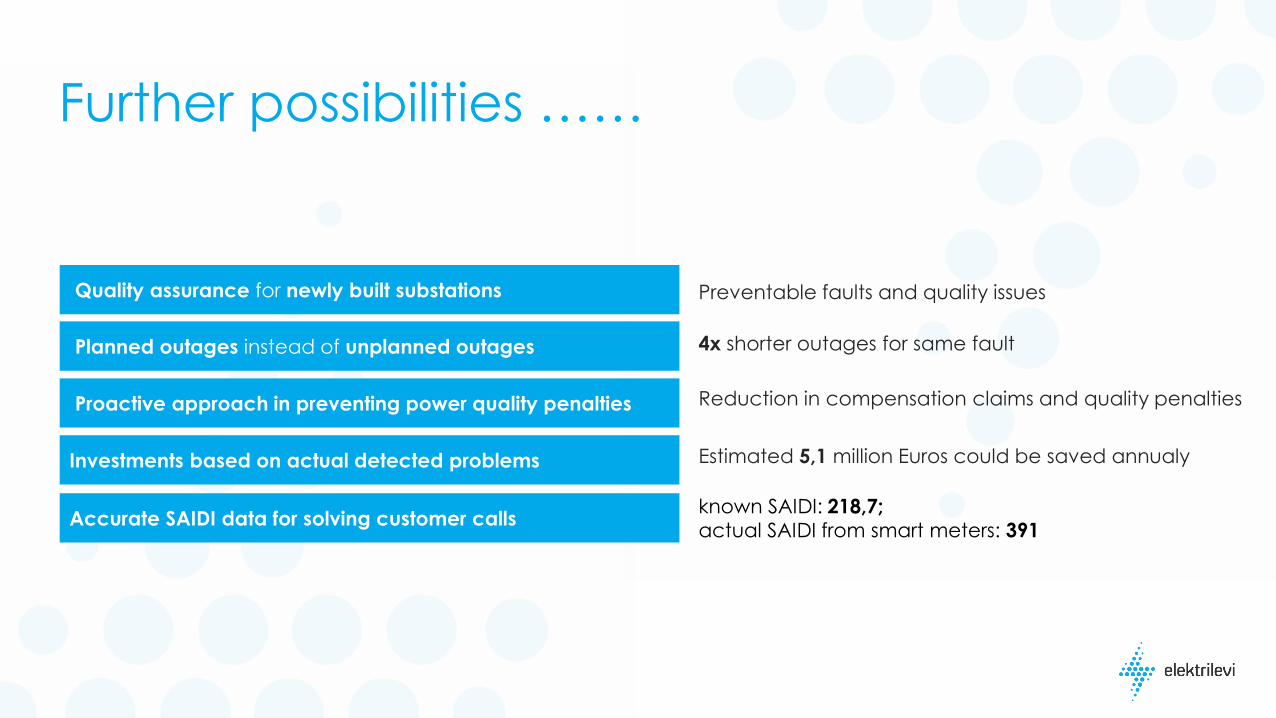
Quality assurance for newly built substations
Further possibilities ……
Preventable faults and quality issues
4x shorter outages for same fault
Reduction in compensation claims and quality penalties
Estimated 5,1 million Euros could be saved annualy
known SAIDI: 218,7;
actual SAIDI from smart meters: 391
Planned outages instead of unplanned outages
Proactive approach in preventing power quality penalties
Investments based on actual detected problems
Accurate SAIDI data for solving customer calls
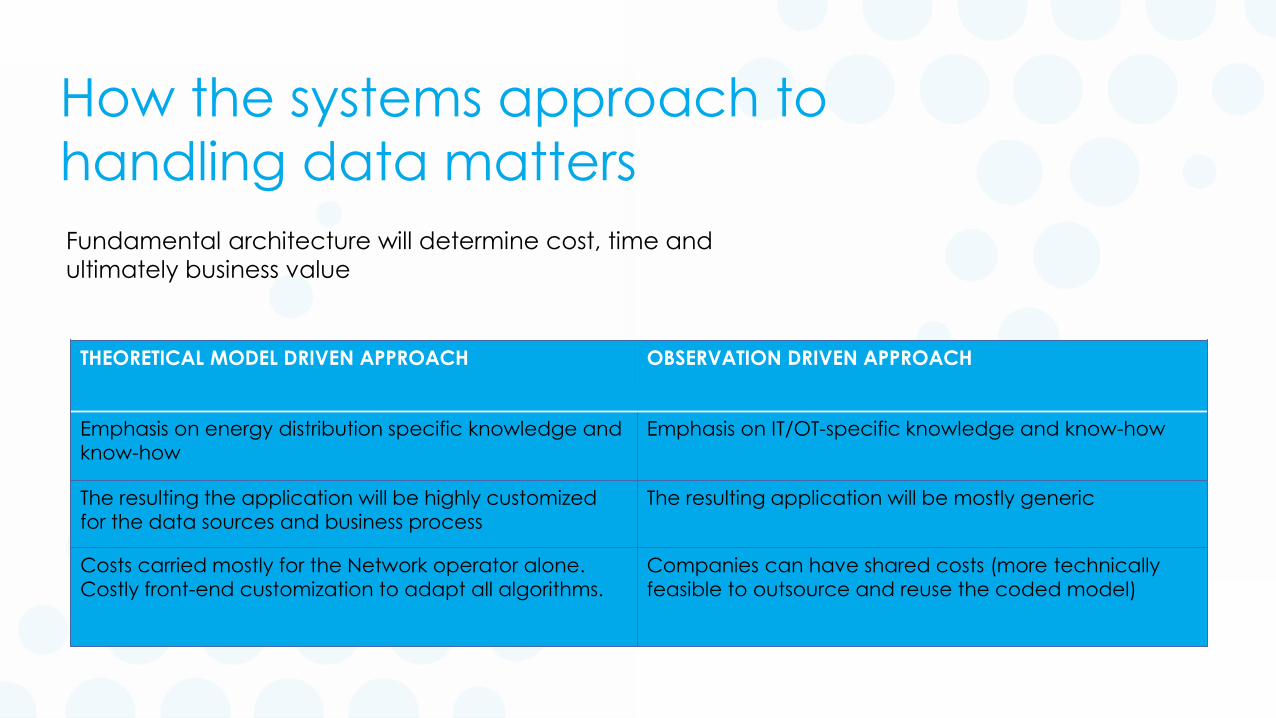
How the systems approach to
handling data matters
THEORETICAL MODEL DRIVEN APPROACH OBSERVATION DRIVEN APPROACH
Emphasis on energy distribution specific knowledge and
know-how
Emphasis on IT/OT-specific knowledge and know-how
The resulting the application will be highly customized
for the data sources and business process
The resulting application will be mostly generic
Costs carried mostly for the Network operator alone.
Costly front-end customization to adapt all algorithms.
Companies can have shared costs (more technically
feasible to outsource and reuse the coded model)
Fundamental architecture will determine cost, time and
ultimately business value
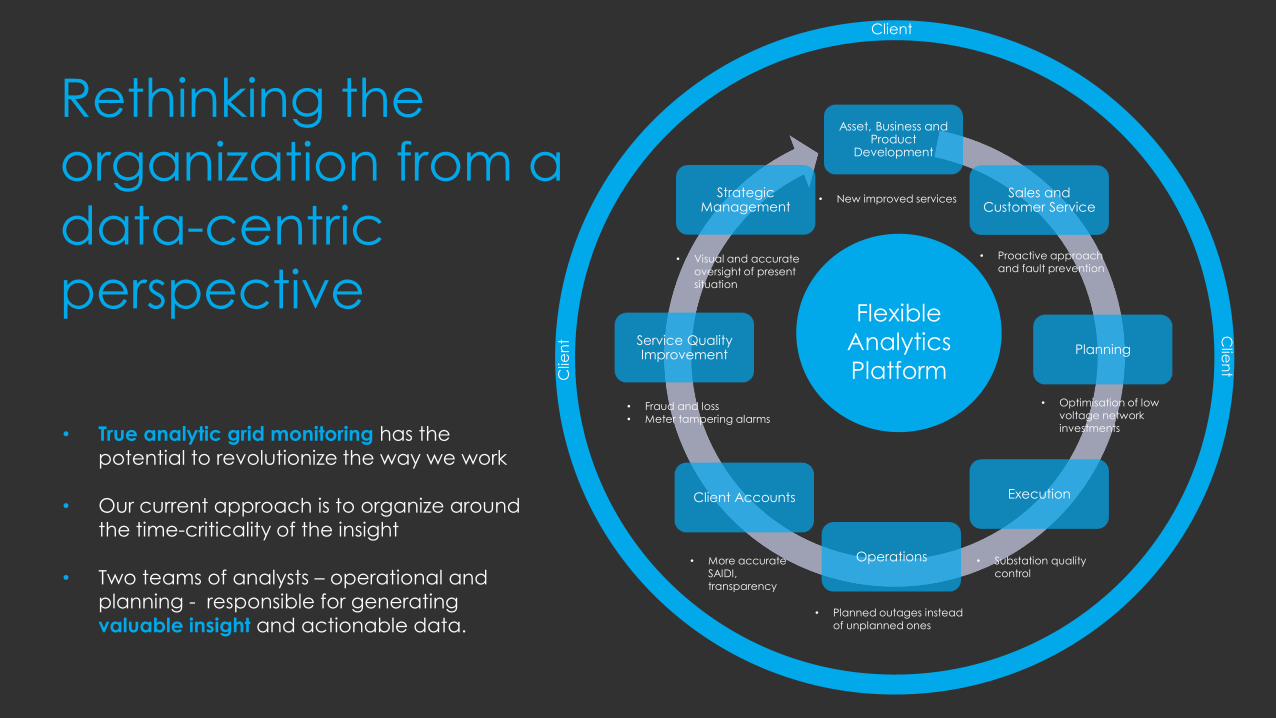
Client
Clie
nt
Clie
nt
Asset, Business and Product
Development
Sales and Customer Service
Planning
Execution
Operations
Client Accounts
Service QualityImprovement
StrategicManagement
Flexible
Analytics
Platform
Rethinking the
organization from a
data-centric
perspective
• New improved services
• Proactive approachand fault prevention
• Optimisation of lowvoltage networkinvestments
• Substation qualitycontrol
• Planned outages instead of unplanned ones
• More accurateSAIDI, transparency
• Fraud and loss• Meter tampering alarms
• Visual and accurateoversight of present situation
• True analytic grid monitoring has the
potential to revolutionize the way we work
• Our current approach is to organize around
the time-criticality of the insight
• Two teams of analysts – operational and
planning - responsible for generating
valuable insight and actionable data.
Conclusions
• Its possible to unlock value in “the data” without knowing too much about
what that value is on the frontend
• Using technology components that “just work”, in an flexible project framework
will deliver results much faster and in a cost effective manner than current
traditional approaches
• Maintaining momentum and ultimately getting the most out of data will
require parallel work in thinking of the organizational structure and processes –
this will have a positive impact beyond just a single project

Kaspar Kaarlep
Head of Digital Network Technology
Elektrilevi