Embed Size (px)
Citation preview


THE PROGRESSIVE CORPORATION
2020 ANNUAL REPORT TO SHAREHOLDERS
AnnualR
eport
App.-A-1
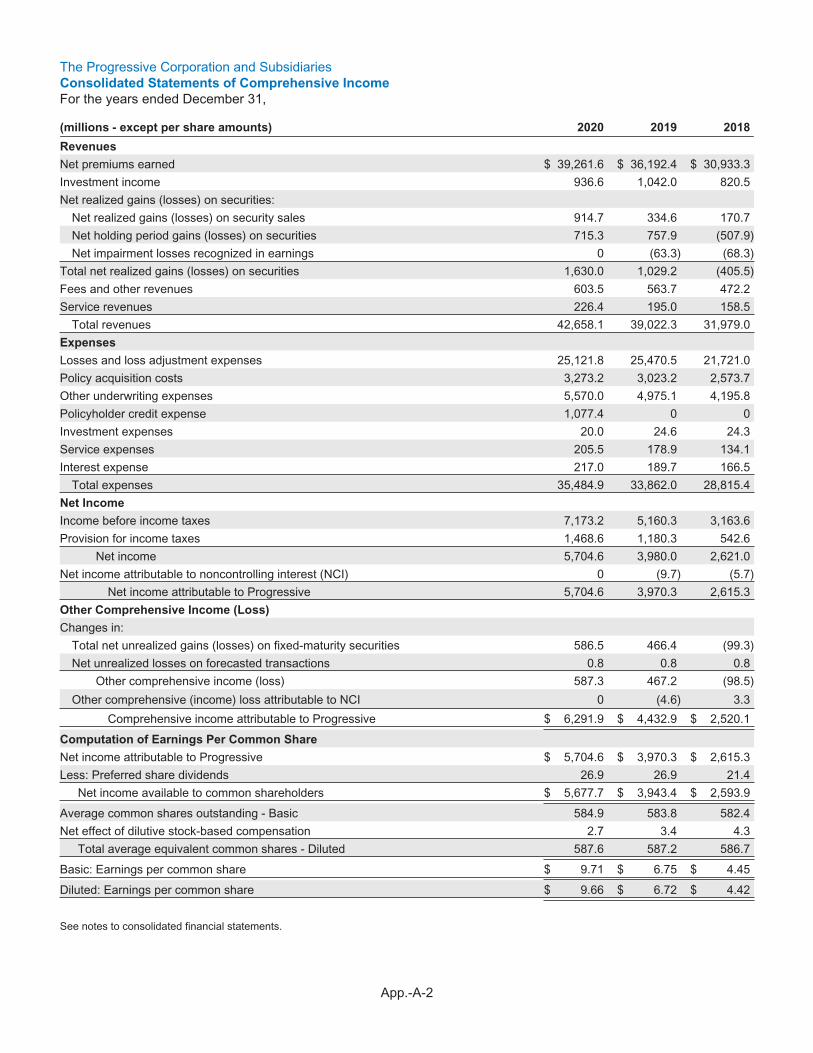
The Progressive Corporation and SubsidiariesConsolidated Statements of Comprehensive Income
For the years ended December 31,
(millions - except per share amounts) 2020 2019 2018
Revenues
Net premiums earned $ 39,261.6 $ 36,192.4 $ 30,933.3
Investment income 936.6 1,042.0 820.5
Net realized gains (losses) on securities:
Net realized gains (losses) on security sales 914.7 334.6 170.7
Net holding period gains (losses) on securities 715.3 757.9 (507.9)
Net impairment losses recognized in earnings 0 (63.3) (68.3)
Total net realized gains (losses) on securities 1,630.0 1,029.2 (405.5)
Fees and other revenues 603.5 563.7 472.2
Service revenues 226.4 195.0 158.5
Total revenues 42,658.1 39,022.3 31,979.0
Expenses
Losses and loss adjustment expenses 25,121.8 25,470.5 21,721.0
Policy acquisition costs 3,273.2 3,023.2 2,573.7
Other underwriting expenses 5,570.0 4,975.1 4,195.8
Policyholder credit expense 1,077.4 0 0
Investment expenses 20.0 24.6 24.3
Service expenses 205.5 178.9 134.1
Interest expense 217.0 189.7 166.5
Total expenses 35,484.9 33,862.0 28,815.4
Net Income
Income before income taxes 7,173.2 5,160.3 3,163.6
Provision for income taxes 1,468.6 1,180.3 542.6
Net income 5,704.6 3,980.0 2,621.0
Net income attributable to noncontrolling interest (NCI) 0 (9.7) (5.7)
Net income attributable to Progressive 5,704.6 3,970.3 2,615.3
Other Comprehensive Income (Loss)
Changes in:
Total net unrealized gains (losses) on fixed-maturity securities 586.5 466.4 (99.3)
Net unrealized losses on forecasted transactions 0.8 0.8 0.8
Other comprehensive income (loss) 587.3 467.2 (98.5)
Other comprehensive (income) loss attributable to NCI 0 (4.6) 3.3
Comprehensive income attributable to Progressive $ 6,291.9 $ 4,432.9 $ 2,520.1
Computation of Earnings Per Common Share
Net income attributable to Progressive $ 5,704.6 $ 3,970.3 $ 2,615.3
Less: Preferred share dividends 26.9 26.9 21.4
Net income available to common shareholders $ 5,677.7 $ 3,943.4 $ 2,593.9
Average common shares outstanding - Basic 584.9 583.8 582.4
Net effect of dilutive stock-based compensation 2.7 3.4 4.3
Total average equivalent common shares - Diluted 587.6 587.2 586.7
Basic: Earnings per common share $ 9.71 $ 6.75 $ 4.45
Diluted: Earnings per common share $ 9.66 $ 6.72 $ 4.42
See notes to consolidated financial statements.
App.-A-2

The Progressive Corporation and SubsidiariesConsolidated Balance Sheets
December 31,
(millions - except per share amount) 2020 2019
Assets
Available-for-sale securities, at fair value:Fixed maturities (amortized cost: $35,589.1 and $32,643.1) $ 36,810.9 $ 33,110.3Short-term investments (amortized cost: $5,218.5 and $1,798.8) 5,218.5 1,798.8
Total available-for-sale securities 42,029.4 34,909.1Equity securities, at fair value:
Nonredeemable preferred stocks (cost: $1,358.7 and $971.3) 1,447.9 1,038.9Common equities (cost: $1,187.3 and $1,125.5) 4,053.0 3,306.3
Total equity securities 5,500.9 4,345.2Total investments 47,530.3 39,254.3
Cash and cash equivalents 76.5 226.2
Restricted cash 0 1.2Total cash, cash equivalents, and restricted cash 76.5 227.4
Accrued investment income 176.4 181.3Premiums receivable, net of allowance for credit losses of $356.2 and $283.2 8,160.1 7,507.3Reinsurance recoverables 4,019.4 3,378.9Prepaid reinsurance premiums 368.1 626.5Deferred acquisition costs 1,237.2 1,056.5Property and equipment, net of accumulated depreciation of $1,291.4 and $1,138.1 1,106.0 1,213.7Goodwill 452.7 452.7Intangible assets, net of accumulated amortization of $326.1 and $314.0 171.4 228.3Other assets 800.2 783.6
Total assets $ 64,098.3 $ 54,910.5
Liabilities
Unearned premiums $ 13,437.5 $ 12,388.8Loss and loss adjustment expense reserves 20,265.8 18,105.4Net federal deferred income taxes 310.0 118.0Dividends payable on common shares 2,694.5 1,375.4Accounts payable, accrued expenses, and other liabilities1 4,955.8 4,617.0Debt2 5,396.1 4,407.1
Total liabilities 47,059.7 41,011.7Redeemable noncontrolling interest (NCI)3 0 225.6Shareholders’ Equity
Serial Preferred Shares (authorized 20.0)Serial Preferred Shares, Series B, no par value (cumulative, liquidation preference of $1,000 pershare) (authorized, issued, and outstanding 0.5) 493.9 493.9
Common shares, $1.00 par value (authorized 900.0; issued 797.5, including treasury shares of 212.3and 212.9) 585.2 584.6
Paid-in capital 1,672.9 1,573.4Retained earnings 13,354.9 10,679.6Accumulated other comprehensive income (loss):
Net unrealized gains (losses) on fixed-maturity securities 947.3 360.8Net unrealized losses on forecasted transactions (15.6) (16.4)Accumulated other comprehensive income attributable to NCI 0 (2.7)
Total accumulated other comprehensive income (loss) attributable to Progressive 931.7 341.7Total shareholders’ equity 17,038.6 13,673.2
Total liabilities, redeemable NCI, and shareholders’ equity $ 64,098.3 $ 54,910.51See Note 1 – Reporting and Accounting Policies for Commitments and Contingencies and Note 12 – Litigation for further discussion.2Consists of both short-term and long-term debt. See Note 4 – Debt for further discussion.3See Note 15 – Redeemable Noncontrolling Interest for further discussion.See notes to consolidated financial statements.
App.-A-3

The Progressive Corporation and SubsidiariesConsolidated Statements of Changes in Shareholders’ Equity
For the years ended December 31,
(millions - except per share amounts) 2020 2019 2018
Serial Preferred Shares, No Par Value
Balance, beginning of year $ 493.9 $ 493.9 $ 0
Issuance of Serial Preferred Shares, Series B 0 0 493.9
Balance, end of year 493.9 493.9 493.9
Common Shares, $1.00 Par Value
Balance, beginning of year 584.6 583.2 581.7
Treasury shares purchased (1.3) (1.3) (1.4)
Net restricted equity awards issued/vested 1.9 2.7 2.9
Balance, end of year 585.2 584.6 583.2
Paid-In Capital
Balance, beginning of year 1,573.4 1,479.0 1,389.2
Amortization of equity-based compensation 89.4 90.1 76.2
Treasury shares purchased (3.6) (3.2) (3.3)
Net restricted equity awards issued/vested (1.9) (2.7) (2.9)
Reinvested dividends on restricted stock units 18.2 10.6 12.2
Adjustment to carrying amount of redeemable noncontrolling interest (2.6) (0.4) 7.6
Balance, end of year 1,672.9 1,573.4 1,479.0
Retained Earnings
Balance, beginning of year 10,679.6 8,386.6 6,031.7
Net income attributable to Progressive 5,704.6 3,970.3 2,615.3
Treasury shares purchased (106.7) (86.8) (74.3)
Cash dividends declared on common shares ($4.90, $2.65, and $2.5140 per share)1 (2,865.9) (1,548.4) (1,466.0)
Cash dividends declared on Serial Preferred Shares, Series B ($80.625, $53.75, and$27.024 per share)1 (40.2) (26.8) (13.5)
Reinvested dividends on restricted stock units (18.2) (10.6) (12.2)
Cumulative effect of change in accounting principle 0 0 1,300.2
Reclassification of disproportionate tax effects 0 0 4.3
Other, net 1.7 (4.7) 1.1
Balance, end of year 13,354.9 10,679.6 8,386.6
Accumulated Other Comprehensive Income (Loss) Attributable to Progressive
Balance, beginning of year 341.7 (120.9) 1,282.2
Attributable to noncontrolling interest 2.7 (4.6) (0.1)
Other comprehensive income (loss) 587.3 467.2 (98.5)
Cumulative effect of change in accounting principle 0 0 (1,300.2)
Reclassification of disproportionate tax effects 0 0 (4.3)
Balance, end of year 931.7 341.7 (120.9)
Total shareholders’ equity $17,038.6 $13,673.2 $10,821.8
1See Note 14 – Dividends for further discussion.
There are 5.0 million Voting Preference Shares authorized; no such shares have been issued.
See notes to consolidated financial statements.
App.-A-4

The Progressive Corporation and SubsidiariesConsolidated Statements of Cash FlowsFor the years ended December 31,
(millions) 2020 2019 2018
Cash Flows From Operating Activities
Net income $ 5,704.6 $ 3,980.0 $ 2,621.0
Adjustments to reconcile net income to net cash provided by operating activities:
Depreciation 274.9 239.8 190.4
Amortization of intangible assets 56.9 66.3 72.0
Net amortization of fixed-income securities 100.9 33.3 34.3
Amortization of equity-based compensation 89.4 90.2 77.2
Net realized (gains) losses on securities (1,630.0) (1,029.2) 405.5
Net (gains) losses on disposition of property and equipment 12.5 11.0 32.1
Changes in:
Premiums receivable (652.8) (1,010.2) (1,074.6)
Reinsurance recoverables (640.5) (682.8) (422.7)
Prepaid reinsurance premiums 258.4 (316.8) (106.4)
Deferred acquisition costs (180.7) (104.9) (171.1)
Income taxes (23.1) 227.2 (158.7)
Unearned premiums 1,048.7 1,702.3 1,783.0
Loss and loss adjustment expense reserves 2,160.4 2,704.6 2,313.9
Accounts payable, accrued expenses, and other liabilities 328.9 611.6 746.6
Other, net (2.9) (260.8) (57.7)
Net cash provided by operating activities 6,905.6 6,261.6 6,284.8
Cash Flows From Investing Activities
Purchases:
Fixed maturities (32,037.5) (28,765.2) (21,153.0)
Equity securities (951.2) (379.9) (538.8)
Sales:
Fixed maturities 22,727.2 18,412.7 7,835.6
Equity securities 431.8 471.4 823.5
Maturities, paydowns, calls, and other:
Fixed maturities 7,109.4 6,145.5 5,099.8
Equity securities 113.8 49.9 26.6
Net (purchases) sales of short-term investments (3,393.2) 31.5 1,116.3
Net unsettled security transactions 83.6 6.0 11.7
Purchases of property and equipment (223.5) (363.5) (266.0)
Sales of property and equipment 21.9 53.3 9.4
Net cash used in investing activities (6,117.7) (4,338.3) (7,034.9)
Cash Flows From Financing Activities
Dividends paid to common shareholders (1,551.0) (1,643.2) (654.9)
Dividends paid to preferred shareholders (26.8) (26.8) (13.5)
Acquisition of treasury shares for restricted stock tax liabilities (68.7) (84.4) (78.6)
Acquisition of treasury shares acquired in open market (42.9) (6.9) (0.4)
Acquisition of additional shares of ARX Holding Corp. (243.0) (11.2) (296.9)
Net proceeds from debt issuance 986.3 0 1,134.0
Proceeds from exercise of equity options 7.3 1.6 3.3
Net proceeds from issuance of Serial Preferred Shares, Series B 0 0 493.9
Payments of debt 0 0 (37.1)
Net cash provided by (used in) financing activities (938.8) (1,770.9) 549.8
Increase (decrease) in cash, cash equivalents, and restricted cash (150.9) 152.4 (200.3)
Cash, cash equivalents, and restricted cash - beginning of year 227.4 75.0 275.3
Cash, cash equivalents, and restricted cash - end of year $ 76.5 $ 227.4 $ 75.0
See notes to consolidated financial statements.
App.-A-5

The Progressive Corporation and SubsidiariesNotes to Consolidated Financial Statements
December 31, 2020, 2019, and 2018
1. REPORTING AND ACCOUNTING POLICIES
Nature of Operations The Progressive insuranceorganization began business in 1937. The financialresults of The Progressive Corporation include itssubsidiaries and affiliates (references to “subsidiaries” inthese notes include affiliates as well). Our insurancesubsidiaries provide personal and commercial autoinsurance, personal residential and commercial propertyinsurance, general liability insurance, and otherspecialty property-casualty insurance and relatedservices. Our Personal Lines segment writes insurancefor personal autos and recreational vehicles, which werefer to as our special lines products. Our CommercialLines segment writes auto-related primary liability andphysical damage insurance, and general liability andproperty insurance, predominately for small businesses.Our Property segment writes residential propertyinsurance for homeowners, other property owners, andrenters. We operate our businesses throughout theUnited States through both the independent agency anddirect channels.
Basis of Consolidation and Reporting Theaccompanying consolidated financial statements includethe accounts of The Progressive Corporation, our whollyowned insurance and non-insurance subsidiaries, andaffiliates, in which we have a controlling financialinterest. All intercompany accounts and transactions areeliminated in consolidation. All revenues are generatedfrom external customers and we do not have a relianceon any major customer.
Estimates We are required to make estimates andassumptions when preparing our financial statementsand accompanying notes in conformity with accountingprinciples generally accepted in the United States ofAmerica (GAAP). As estimates develop into fact, resultsmay, and will likely, differ from those estimates.
Investments Our fixed-maturity securities and short-term investments are accounted for on anavailable-for-sale basis. Fixed-maturity securities includedebt securities and redeemable preferred stocks, whichmay have fixed or variable principal payment schedules,may be held for indefinite periods of time, and may beused as a part of our asset/liability strategy or sold inresponse to changes in interest rates, anticipatedprepayments, risk/reward characteristics, liquidity needs,or other economic factors. These securities are carried atfair value with the corresponding unrealized gains
(losses), net of deferred income taxes, reported inaccumulated other comprehensive income.
Short-term investments may include Eurodollardeposits, commercial paper, repurchase transactions,and other securities expected to mature within one year.From time to time, we may also invest in municipalbonds that have maturity dates that are longer than oneyear but have either liquidity facilities or mandatory putfeatures within one year.
Equity securities include common stocks,nonredeemable preferred stocks, and other riskinvestments. These securities are carried at fair value,with the changes in fair value reported as a componentof net holding period gains (losses) on securitiesreported in net income.
Derivative instruments may include futures, options,forward positions, interest rate swap agreements, andcredit default swaps and may be used in the portfolio forgeneral investment purposes or to hedge the exposureto variable cash flows of a forecasted transaction (cashflow hedge).
We did not have any derivatives outstanding atDecember 31, 2020 or 2019. To the extent we havederivatives held for general investment purposes, thesederivative instruments would be recognized as eitherassets or liabilities and measured at fair value, withchanges in fair value recognized in net income as acomponent of net holding period gains (losses) onsecurities.
Derivatives designated as hedges are required to beevaluated on established criteria to determine theeffectiveness of their correlation to, and ability to reducethe designated risk of, specific securities ortransactions. Effectiveness is required to be reassessedregularly. For cash flow hedges that are deemed to beeffective, the changes in fair value of the hedge wouldbe reported as a component of accumulated othercomprehensive income and subsequently amortizedinto earnings over the life of the hedged transaction. If ahedge is deemed to become ineffective or discontinued,changes in fair value of the derivative instrument wouldbe reported in income for the current period.
App.-A-6

For derivatives settled through a clearinghouse,collateral is required to post initial margin and is subjectto increases in margin beyond changes in fair value.Exposure to credit risk is limited to the carrying value;collateral may be required to limit credit risk. Forbi-lateral derivative positions, net cash requirements arelimited to changes in fair values, which may vary as aresult of changes in interest rates, currency exchangerates, and other factors. We have elected not to offsetfair value amounts that arise from derivative positionswith the same counterparty under a master nettingarrangement.
Investment securities are exposed to various risks suchas interest rate, market, credit, and liquidity risk. Fairvalues of securities fluctuate based on the nature andmagnitude of changing market conditions; significantchanges in market conditions could materially affect theportfolio’s value in the near term. We routinely monitorour fixed-maturity portfolio for pricing changes thatmight indicate potential credit losses exist and performdetailed reviews of securities with unrealized losses. Foran unrealized loss that we determined to be related tocurrent market conditions, we will not record anallowance for credit losses or a write-off of the fair valuefor securities we do not intend to sell. We will continueto monitor these securities to determine if the unrealizedloss is due to credit deterioration. If we believe that apotential credit loss exists, we will record an allowancefor the credit loss and recognize the realized loss as acomponent of realized gains and losses in the incomestatement. Once a credit loss allowance has beenestablished, we will continue to evaluate the security, atleast quarterly, to determine if changes in conditionshave created the need to either increase, or decrease,the allowance recorded. If we determine that a securitywith a credit loss allowance, previously recorded, islikely to be sold prior to the potential recovery of thecredit loss or if we determine that the loss isuncollectible, we will reverse the allowance and write-offthe security to its fair value.
Investment income consists of interest, dividends, andaccretion (net of amortization). Interest is recognized onan accrual basis using the effective yield method,except for asset-backed securities, discussed below.Depending on the nature of the equity instruments,dividends are recorded at either the ex-dividend date oron an accrual basis.
Asset-backed securities, which are included in our fixed-maturity portfolio, are generally accounted for under theretrospective method. The retrospective methodrecalculates yield assumptions (based on changes ininterest rates or cash flow expectations) historically tothe inception of the investment holding period, and
applies the required adjustment, if any, to the costbasis, with the offset recorded to investment income.The prospective method is used primarily for interest-only securities, asset-backed securities below highinvestment-grade status (i.e., below AA-), and certainasset-backed securities with sub-prime loan exposureor where there is a greater risk of non-performance andwhere it is possible the initial investment may not besubstantially recovered. The prospective methodrequires a calculation of expected future repaymentsand resets the yield to allow for future periodadjustments; no current period impact to investmentincome or the security’s cost is made based on the cashflow update. Prepayment assumptions are updatedquarterly.
Realized gains (losses) on securities are computedbased on the first-in first-out method. Realized gains(losses) also includes holding period valuation changeson equity securities, hybrid instruments (e.g., securitieswith embedded options, where the option is a feature ofthe overall change in the value of the instrument), andderivatives, as well as initial credit allowance losses,subsequent changes in credit loss allowances, andwrite-offs for losses deemed uncollectible or securitiesin a loss position that are expected to be sold prior tothe recovery of the credit loss.
Insurance Premiums and Receivables Insurancepremiums written are earned into income on a pro ratabasis over the period of risk, based on a daily earningsconvention. Accordingly, unearned premiums representthe portion of premiums written that are applicable tothe unexpired risk. We provide insurance and relatedservices to individuals and commercial accounts andoffer a variety of payment plans. Generally, premiumsare collected prior to providing risk coverage, minimizingour exposure to credit risk.
For our Personal Lines and Commercial Linesbusinesses, we perform a policy level evaluation todetermine the extent to which the premiums receivablebalance exceeds the unearned premiums balance. Wethen age this exposure to establish an allowance forcredit losses based on prior experience.
For our Property business, the risk of uncollectibility isrelatively low. If premiums are unpaid by the policy duedate, we provide advance notice of cancellation inaccordance with each state’s requirements and, if thepremiums remain unpaid after receipt of notice, cancelthe policy and write off any remaining balance.
To determine an allowance for credit losses, weevaluate the collectibility of premiums receivables basedon historical and current collections experience using
App.-A-7

actuarial analysis. Our estimate of the futurerecoverability of our projected ultimate at-risk exposuresalso takes into consideration any unusualcircumstances that we may encounter, such asmoratoriums or other programs that may suspendcollections. The following table summarizes changes inour allowance for credit loss exposure on our premiumreceivables:
(millions) 2020 2019
Balance at January 1 $ 283.2 $ 252.1
Increase in allowance1 472.0 433.5
Write-offs2 (399.0) (402.4)
Balance at December 31 $ 356.2 $ 283.21Represents the incremental increase in other underwriting expenses.2Represents the portion of allowance that is reversed when premiumreceivables are written off.
Premiums receivable balances are written off once wehave exhausted our collection efforts. The increase in theallowance during 2020 in part reflects the greaterpotential for credit losses due to financial hardships ofpolicyholders as a result of the economic impacts relatedto the spread of the novel coronavirus, COVID-19.
Deferred Acquisition Costs Deferred acquisitioncosts include commissions, premium taxes, and othervariable underwriting and direct sales costs incurred inconnection with the successful acquisition or renewal ofinsurance contracts. These acquisition costs, net ofceding allowances, are deferred and amortized over thepolicy period in which the related premiums are earned.We consider anticipated investment income indetermining the recoverability of these costs.Management believes these costs will be fullyrecoverable in the near term.
We do not defer any advertising costs. Total advertisingcosts, which are expensed as incurred, for the yearsended December 31, were:
(millions) Advertising Costs
2020 $ 2,175.7
2019 1,837.3
2018 1,422.4
Loss and Loss Adjustment Expense Reserves Lossreserves represent the estimated liability on claimsreported to us, plus reserves for losses incurred but notrecorded (IBNR). These estimates are reported net ofamounts estimated to be recoverable from salvage andsubrogation. Loss adjustment expense reservesrepresent the estimated expenses required to settlethese claims. The methods of making estimates and
establishing these reserves are reviewed regularly, andresulting adjustments are reflected in income in thecurrent period. Such loss and loss adjustment expensereserves are susceptible to change in the near term.
Reinsurance Our reinsurance activity includestransactions which are categorized as Regulated andNon-Regulated. Regulated refers to plans in which weparticipate that are governed by insurance regulationsand include state-provided reinsurance facilities (e.g.,Michigan Catastrophic Claims Association, NorthCarolina Reinsurance Facility, Florida HurricaneCatastrophe Fund), as well as state-mandatedinvoluntary plans for commercial vehicles (CommercialAutomobile Insurance Procedures/Plans – CAIP) andfederally regulated plans for flood (National FloodInsurance Program – NFIP); we act as a servicing agentfor CAIP and as a participant in the “Write Your Own”program for the NFIP. Non-Regulated includes voluntarycontractual arrangements primarily related to ourProperty business and to the transportation networkcompany business written by our Commercial Linessegment. Prepaid reinsurance premiums are earned on apro rata basis over the period of risk, based on a dailyearnings convention, which is consistent with premiumsearned. See Note 7 – Reinsurance for further discussion.
We routinely monitor changes in the credit quality andconcentration risks of the reinsurers who are counterparties to our reinsurance recoverables to determine ifan allowance for credit losses should be established.
Income Taxes The income tax provision is calculatedunder the balance sheet approach. Deferred tax assetsand liabilities are recorded based on the differencebetween the financial statement and tax bases of assetsand liabilities at the enacted tax rates. The principalitems giving rise to such differences are investmentsecurities (e.g., net unrealized gains (losses), netholding period gains (losses) on securities, write-downson securities determined to be other-than-temporarilyimpaired), loss and loss adjustment expense reserves,unearned premiums reserves, deferred acquisitioncosts, property and equipment, intangible assets, andnon-deductible accruals. We review our deferred taxassets regularly for recoverability. See Note 5 – IncomeTaxes for further discussion.
Property and Equipment Property and equipment arerecorded at cost, less accumulated depreciation.Depreciation is recognized over the estimated usefullives of the assets using accelerated methods forcomputer equipment and the straight-line method for allother fixed assets. We evaluate impairment wheneverevents or circumstances warrant such a review andwrite-off the impaired assets if appropriate.
App.-A-8

The cost and useful lives for property and equipment at December 31, were:
($ in millions) 2020 2019 Useful Lives
Land $ 151.6 $ 161.6 NA
Buildings, improvements, and integrated components 872.7 927.1 7-40 years
Capitalized software 392.6 367.1 3-10 years
Software licenses (internal use) 335.5 286.8 1-5 years
Computer equipment 253.8 223.3 3 years
All other property and equipment 391.2 385.9 3-10 years
Total cost 2,397.4 2,351.8
Accumulated depreciation (1,291.4) (1,138.1)
Balance at end of year $ 1,106.0 $ 1,213.7
NA = Not applicable; land is not a depreciable asset.
Included in other assets in the consolidated balance sheets are “held for sale” property, which represents the fairvalue of these properties less the estimated costs to sell, of $56.6 million and $32.9 million, at December 31, 2020and 2019, respectively, and capitalized cloud computing arrangement implementation costs, net of amortization, of$25.3 million at December 31, 2020. We adopted the new accounting standard for cloud computing arrangements inJanuary 2020; see New Accounting Standards below in this Note 1 for further discussion.
Goodwill and Intangible Assets Goodwill is theexcess of the purchase price over the estimated fairvalue of the assets and liabilities acquired andrepresents the future economic benefits arising fromother assets acquired that could not be individuallyidentified and separately recognized.
Intangible assets are non-financial assets lackingphysical substance, such as customer and agencyrelationships and software rights, and represent thefuture economic benefit of those acquired assets. SeeNote 16 – Goodwill and Intangible Assets for furtherdiscussion.
We evaluate our goodwill for impairment at leastannually using a qualitative approach. If events orchanges in circumstances indicate that the carryingvalue of goodwill or intangible assets may not berecoverable, we will evaluate such items for impairmentusing a quantitative approach.
Guaranty Fund Assessments We are subject to stateguaranty fund assessments, which provide for thepayment of covered claims or other insuranceobligations of insurance companies deemed insolvent.These assessments are accrued after a formaldetermination of insolvency has occurred, and we havewritten the premiums on which the assessments will bebased. Assessments that are available for recoupmentfrom policyholders are capitalized when incurred; allother assessments are expensed.
Fees and Other Revenues Fees and other revenuesprimarily represent fees collected from policyholdersrelating to installment charges in accordance with ourbill plans, as well as late payment and insufficient fundsfees and revenue from ceding commissions. Fees andother revenues are generally earned when invoiced,except for excess ceding commissions, which areearned over the policy period.
Service Revenues and Expenses Our servicebusinesses provide insurance-related services. Servicerevenues and expenses from our commission-basedbusinesses are recorded in the period in which they areearned or incurred. Service revenues generated fromprocessing business for involuntary CAIP plans areearned on a pro rata basis over the term of the relatedpolicies. Service expenses related to these CAIP plansare expensed as incurred.
Equity-Based Compensation We issue time-basedand performance-based restricted stock unit awards tokey members of management as our form of equitycompensation, and time-based restricted stock awards tonon-employee directors. Collectively, we refer to theseawards as “restricted equity awards.” Compensationexpense for time-based restricted equity awards withinstallment vesting is recognized over each respectivevesting period. For performance-based restricted equityawards, compensation expense is recognized over theestimated vesting periods. Dividend equivalent units arecredited to outstanding restricted stock unit awards, bothtime-based and performance-based, at the time a
App.-A-9

dividend is paid to shareholders and paid upon vesting ofthe underlying award. We record an estimate forexpected forfeitures of restricted equity awards based onour historical forfeiture rates.
The total compensation expense recognized for equity-based compensation for the years ended December 31,was:
(millions) 2020 2019 2018
Pretax expense $ 89.4 $ 90.2 $ 77.2Tax benefit 18.8 18.9 16.2
Earnings Per Common Share Net income attributableto Progressive is reduced by preferred share dividendsto determine net income available to commonshareholders, and is used in our calculation of the percommon share amounts. Basic earnings per commonshare is computed using the weighted average numberof common shares outstanding during the reportingperiod, excluding unvested time-based restricted stockawards. Diluted earnings per common share includescommon stock equivalents assumed outstanding duringthe period. Our common stock equivalents include theincremental shares assumed to be issued for:
• earned but unvested time-based restricted equityawards, and
• performance-based restricted equity awards thatsatisfied certain contingency conditions for unvestedcommon stock equivalents during the period and arehighly likely to continue to satisfy the conditions untilthe date of vesting.
Supplemental Cash Flow Information Cash and cashequivalents include bank demand deposits and dailyovernight reverse repurchase commitments of fundsheld in bank demand deposit accounts by certainsubsidiaries, and are not considered part of theinvestment portfolio. The amount of reverse repurchasecommitments held by these subsidiaries atDecember 31, 2020, 2019, and 2018, were$93.5 million, $46.3 million, and $117.3 million,respectively. Restricted cash on our consolidatedbalance sheets represents cash that is restricted to payflood claims under the NFIP’s “Write Your Own”program, for which certain subsidiaries areadministrators.
For the year ended December 31, 2020, non-cashactivity includes declared but unpaid common sharedividends of $2,694.5 million and preferred sharedividends of $13.4 million, and operating lease liabilitiesarising from obtaining right-of-use assets of
$60.3 million (see Note 13 – Leases and Note 14 –Dividends for further discussion).
For the years ended December 31, we paid thefollowing:
(millions) 2020 2019 2018
Income taxes $1,446.3 $ 954.3 $ 702.6Interest 206.0 184.9 154.0Operating lease
liabilities 86.5 84.0 NA
NA = Not applicable prior to the adoption of the newaccounting standard in 2019.
Commitments and Contingencies We have certainnoncancelable purchase obligations for goods andservices with minimum commitments of $830.4 millionat December 31, 2020, primarily consisting of softwarelicenses, maintenance on information technologyequipment, and media placements. In addition, we haveseveral multiple-layer property catastrophe reinsurancecontracts with various reinsurers with terms rangingfrom one to three years; the minimum commitmentunder these agreements at December 31, 2020, was$191.1 million.
New Accounting Standards On January 1, 2020, weadopted the following new Accounting StandardsUpdates (ASU).
Cloud Computing ArrangementsThis ASU, which provides guidance on the requirementsfor capitalizing and amortizing implementation costsincurred in a cloud computing arrangement that doesnot include a software license, was adopted on aprospective basis. See the Property and Equipmentdiscussion above for the cloud computing arrangementimplementation cost capitalized at December 31, 2020.
Fair Value MeasurementsWe early adopted a portion of this ASU in 2018 and theremaining provisions in 2020. This ASU amended thedisclosure requirements for fair value measurements torequire companies to disclose the changes in unrealizedgains and losses for the period included in othercomprehensive income for recurring Level 3 fair valuemeasurements held at the end of the reporting periodand the range and weighted average of significantunobservable inputs used to develop Level 3 fair valuemeasurements and removed current disclosurerequirements for the amount of and reasons fortransfers between Level 1 and Level 2 of the fair valuehierarchy, the policy for timing of transfers between
App.-A-10

levels, and the valuation processes for Level 3 fair valuemeasurements. The adoption of this ASU had no impacton our financial condition, cash flows, or results ofoperations.
Goodwill Impairment Test SimplificationThe ASU eliminated the requirement to determine theimplied fair value of goodwill in measuring animpairment loss and now requires the measurement ofa goodwill impairment to represent the excess of thereporting unit’s carrying value over fair value, limited tothe carrying value of goodwill. The adoption of this ASUhad no impact on our financial condition, cash flows, orresults of operations.
Measurement of Credit Losses on Financial InstrumentsThis ASU modified the existing accounting guidancerelated to the impairment evaluation for our
available-for-sale debt securities, reinsurancerecoverables, and premiums receivable. The ASU isintended to improve the timing, and enhance theaccounting and disclosure, of credit losses on financialassets. To the extent a credit loss is determined toexist, an allowance for credit losses would be requiredto be recorded as a contra asset, with changes to thecredit loss allowance recorded prospectively. Based onour analysis for available-for-sale debt securities andreinsurance recoverables as described in Note 2–Investments and Note 7– Reinsurance, respectively, noadjustment to the beginning balance of retainedearnings was required upon adoption. See theInsurance Premiums and Receivables discussion abovefor changes in the allowance for credit losses related tothe premiums receivable balance.
2. INVESTMENTS
The following tables present the composition of ourinvestment portfolio by major security type, consistent withour classification of how we manage, monitor, andmeasure the portfolio. Our securities are reported in ourconsolidated balance sheets at fair value. The changes infair value for our fixed-maturity securities (other thanhybrid securities) are reported as a component ofaccumulated other comprehensive income, net of deferred
income taxes, in our consolidated balance sheets. The netholding period gains (losses) reported below represent theinception-to-date changes in fair value of the securities.The changes in the net holding period gains (losses)between periods for the hybrid securities and equitysecurities are recorded as a component of net realizedgains (losses) on securities in our consolidated statementsof comprehensive income.
($ in millions) Cost
GrossUnrealized
Gains
GrossUnrealized
Losses
NetHolding
PeriodGains
(Losses)Fair
Value
% ofTotalFair
Value
December 31, 2020Available-for-sale securities:
Fixed maturities:U.S. government obligations $ 12,437.9 $ 305.8 $ (3.7) $ 0 $ 12,740.0 26.8%State and local government obligations 3,099.4 123.1 (0.7) 0 3,221.8 6.8Corporate debt securities 9,579.7 601.7 (0.1) 3.9 10,185.2 21.4Residential mortgage-backed securities 503.3 7.1 (0.9) 0 509.5 1.1Commercial mortgage-backed securities 6,042.6 142.5 (10.0) 0 6,175.1 13.0Other asset-backed securities 3,745.0 40.1 (0.5) 0 3,784.6 7.9Redeemable preferred stocks 181.2 3.6 (1.4) 11.3 194.7 0.4
Total fixed maturities 35,589.1 1,223.9 (17.3) 15.2 36,810.9 77.4Short-term investments 5,218.5 0 0 0 5,218.5 11.0
Total available-for-sale securities 40,807.6 1,223.9 (17.3) 15.2 42,029.4 88.4Equity securities:
Nonredeemable preferred stocks 1,358.7 0 0 89.2 1,447.9 3.1Common equities 1,187.3 0 0 2,865.7 4,053.0 8.5
Total equity securities 2,546.0 0 0 2,954.9 5,500.9 11.6Total portfolio1 $ 43,353.6 $ 1,223.9 $ (17.3) $ 2,970.1 $ 47,530.3 100.0%
App.-A-11

($ in millions) Cost
GrossUnrealized
Gains
GrossUnrealized
Losses
NetHolding
PeriodGains
(Losses)Fair
Value
% ofTotalFair
Value
December 31, 2019
Available-for-sale securities:Fixed maturities:
U.S. government obligations $ 13,100.7 $ 194.1 $ (43.7) $ 0 $ 13,251.1 33.7%
State and local government obligations 1,686.0 30.0 (2.7) 0 1,713.3 4.4
Corporate debt securities 6,860.3 206.6 (0.5) 1.3 7,067.7 18.0
Residential mortgage-backed securities 625.0 4.5 (2.0) 0 627.5 1.6
Commercial mortgage-backed securities 5,020.7 61.5 (6.0) 0 5,076.2 12.9
Other asset-backed securities 5,164.7 16.2 (1.4) 0 5,179.5 13.2
Redeemable preferred stocks 185.7 4.1 (1.3) 6.5 195.0 0.5
Total fixed maturities 32,643.1 517.0 (57.6) 7.8 33,110.3 84.3
Short-term investments 1,798.8 0 0 0 1,798.8 4.6
Total available-for-sale securities 34,441.9 517.0 (57.6) 7.8 34,909.1 88.9
Equity securities:
Nonredeemable preferred stocks 971.3 0 0 67.6 1,038.9 2.7
Common equities 1,125.5 0 0 2,180.8 3,306.3 8.4
Total equity securities 2,096.8 0 0 2,248.4 4,345.2 11.1
Total portfolio1 $ 36,538.7 $ 517.0 $ (57.6) $ 2,256.2 $ 39,254.3 100.0%1Our portfolio reflects the effect of net unsettled security transactions; at December 31, 2020, $95.5 million was included in “other liabilities,”compared to $11.9 million at December 31, 2019.The total fair value of the portfolio at December 31, 2020 and 2019 included $6.2 billion and $3.2 billion, respectively, of securities held in aconsolidated, non-insurance subsidiary of the holding company, net of any unsettled security transactions. A portion of these investments weresold and proceeds used to pay our common share dividends; see Note 14 – Dividends for additional information.
At December 31, 2020, bonds and certificates ofdeposit in the principal amount of $298.2 million wereon deposit to meet state insurance regulatoryrequirements. We did not hold any securities of any oneissuer, excluding U.S. government obligations, with anaggregate cost or fair value exceeding 10% of totalshareholders’ equity at December 31, 2020 or 2019. AtDecember 31, 2020, we did not hold any debt securitiesthat were non-income producing during the preceding12 months.
Short-Term Investments Our short-term investmentsmay include commercial paper and other investmentsthat are expected to mature or are redeemable withinone year.
We invested in repurchase and reverse repurchasetransactions during 2020 and 2019, but did not haveany open positions at December 31, 2020 or 2019. Tothe extent we enter into repurchase or reverserepurchase transactions, consistent with past practice,we would elect not to offset these transactions and
would report them on a gross basis on our consolidatedbalance sheets, despite the option to elect to offsetthese transactions as long as they were with the samecounterparty and subject to an enforceable masternetting arrangement.
Hybrid Securities Certain securities in our fixedmaturities portfolio are accounted for as hybridsecurities because they contain embedded derivativesthat are not deemed to be clearly and closely related tothe host investments. These securities are reported atfair value at December 31:
(millions) 2020 2019
Fixed Maturities:
State and local governmentobligations $ 0 $ 3.5
Corporate debt securities 188.4 91.2
Other asset-backed securities 34.8 2.6
Redeemable preferred stocks 131.4 92.1
Total hybrid securities $ 354.6 $ 189.4
App.-A-12

Since the embedded derivatives (e.g., change-in-control put option, debt-to-equity conversion, or any other featureunrelated to the credit quality or risk of default of the issuer that could impact the amount or timing of our expectedfuture cash flows) do not have observable intrinsic values, we have elected to record the changes in fair value ofthese securities through income as a component of net realized gains or losses.
Fixed Maturities The composition of fixed maturities by maturity at December 31, 2020, was:
(millions) Cost Fair Value
Less than one year $ 5,734.9 $ 5,765.4
One to five years 20,769.2 21,377.3
Five to ten years 8,939.8 9,512.2
Ten years or greater 145.2 156.0
Total $ 35,589.1 $ 36,810.9
Asset-backed securities are classified in the maturity distribution table based upon their projected cash flows. All othersecurities that do not have a single maturity date are reported based upon expected average maturity. Contractualmaturities may differ from expected maturities because the issuers of the securities may have the right to call orprepay obligations.
Gross Unrealized Losses The following tables show the composition of gross unrealized losses by major securitytype and by the length of time that individual securities have been in a continuous unrealized loss position:
Total
No. of
Sec.
Total
Fair
Value
Gross
Unrealized
Losses
Less than 12 Months 12 Months or Greater
($ in millions)
No. of
Sec.
Fair
Value
Unrealized
Losses
No. of
Sec.
Fair
Value
Unrealized
Losses
December 31, 2020
U.S. government obligations 9 $ 1,511.0 $ (3.7) 9 $ 1,511.0 $ (3.7) 0 $ 0 $ 0
State and local governmentobligations 30 208.7 (0.7) 30 208.7 (0.7) 0 0 0
Corporate debt securities 7 129.4 (0.1) 7 129.4 (0.1) 0 0 0
Residential mortgage-backedsecurities 21 44.4 (0.9) 0 0 0 21 44.4 (0.9)
Commercial mortgage-backedsecurities 43 893.3 (10.0) 9 93.6 (0.3) 34 799.7 (9.7)
Other asset-backed securities 22 183.7 (0.5) 9 74.4 (0.1) 13 109.3 (0.4)
Redeemable preferred stocks 1 11.0 (1.4) 0 0 0 1 11.0 (1.4)
Total fixed maturities 133 $ 2,981.5 $ (17.3) 64 $ 2,017.1 $ (4.9) 69 $ 964.4 $ (12.4)
Total
No. of
Sec.
Total
Fair
Value
Gross
Unrealized
Losses
Less than 12 Months 12 Months or Greater
($ in millions)
No. of
Sec.
Fair
Value
Unrealized
Losses
No. of
Sec.
Fair
Value
Unrealized
Losses
December 31, 2019
U.S. government obligations 23 $ 5,152.4 $ (43.7) 19 $ 5,057.2 $ (43.6) 4 $ 95.2 $ (0.1)
State and local governmentobligations 67 314.3 (2.7) 52 287.5 (2.6) 15 26.8 (0.1)
Corporate debt securities 16 247.6 (0.5) 12 191.4 (0.5) 4 56.2 0
Residential mortgage-backedsecurities 41 292.8 (2.0) 12 163.7 (0.9) 29 129.1 (1.1)
Commercial mortgage-backedsecurities 98 1,742.4 (6.0) 79 1,400.0 (5.3) 19 342.4 (0.7)
Other asset-backed securities 61 1,000.6 (1.4) 43 938.5 (0.9) 18 62.1 (0.5)
Redeemable preferred stocks 1 11.2 (1.3) 0 0 0 1 11.2 (1.3)
Total fixed maturities 307 $ 8,761.3 $ (57.6) 217 $ 8,038.3 $ (53.8) 90 $ 723.0 $ (3.8)
App.-A-13

During 2020, we had seven securities that had their credit ratings downgraded, with a combined fair value of$65.0 million and an unrealized loss of $1.6 million as of December 31, 2020, comprised of residential andcommercial mortgage-backed securities.
A review of the securities in an unrealized loss position indicated that the issuers were current with respect to theirinterest obligations and that there was no evidence of deterioration of the current cash flow projections that wouldindicate we would not receive the remaining principal at maturity.
Allowance For Credit and Uncollectible Losses Weare required to measure the amount of potential creditlosses for all fixed-maturity securities in an unrealizedloss position. We did not record any allowances forcredit losses or any write-offs for amounts deemed tobe uncollectible during 2020 and did not have a creditloss allowance balance as of December 31, 2020. Weconsidered several factors and inputs related to theindividual securities as part of our analysis. Themethodology and significant inputs used to measure theamount of credit losses in our portfolio included:
• current performance indicators on the businessmodel or underlying assets (e.g., delinquencyrates, foreclosure rates, and default rates);
• credit support (via current levels of subordination);• historical credit ratings; and• updated cash flow expectations based upon these
performance indicators.
In order to determine the amount of credit loss, if any,we initially reviewed securities in a loss position todetermine whether it was likely that we would berequired, or intended, to sell any of the securities priorto the recovery of their respective cost bases (whichcould be maturity). If we were likely to, or intended to,sell prior to a potential recovery, we would write off theunrealized loss. For those securities that we determinedwe were not likely to, or did not intend to, sell prior to a
potential recovery, we calculated the net present value(NPV) of the cash flows expected (i.e., expectedrecovery value) using the current book yield for eachsecurity. The NPV was then compared to the security’scurrent amortized value to determine if a credit lossexisted. In the event that the NPV was below theamortized value, and the amount was determined to bematerial individually, or in aggregate, a credit loss wouldbe deemed to exist, and either an allowance for creditlosses would be created, or if an allowance currentlyexisted, either a recovery of the previous allowance, oran incremental loss, would be recorded to net realizedgains (losses) on securities.
As of December 31, 2020, we believe none of theunrealized losses relate to material credit losses on anyspecific securities, or in the aggregate, based on ourreview. We continue to expect all the securities in ourportfolio to pay their principal and interest obligations.
In addition, we reviewed our accrued investment incomeoutstanding on those securities in an unrealized lossposition at December 31, 2020, to determine if theaccrued interest amounts were determined to beuncollectible. Based on our analysis, we believe theissuers have sufficient liquidity and capital reserves tomeet their current interest, and future principal,obligations and, therefore, did not write off any accruedincome as uncollectible at December 31, 2020.
App.-A-14

Realized Gains (Losses) The components of net realized gains (losses) for the years ended December 31, were:
(millions) 2020 2019 2018
Gross realized gains on security sales
Available-for-sale securities:U.S. government obligations $ 612.5 $ 164.4 $ 6.7State and local government obligations 102.4 6.1 9.5Corporate and other debt securities 161.9 100.1 2.4Residential mortgage-backed securities 0 0.2 0Commercial mortgage-backed securities 23.7 8.1 2.0Other asset-backed securities 0.2 0.8 0.1Redeemable preferred stocks 0 2.2 4.5
Total available-for-sale securities 900.7 281.9 25.2Equity securities:
Nonredeemable preferred stocks 24.4 36.2 4.1Common equities 88.6 61.7 286.6
Total equity securities 113.0 97.9 290.7
Subtotal gross realized gains on security sales 1,013.7 379.8 315.9
Gross realized losses on security sales
Available-for-sale securities:U.S. government obligations (9.6) (20.4) (98.7)State and local government obligations (0.7) (0.7) (2.9)Corporate and other debt securities (6.5) (7.9) (10.4)Residential mortgage-backed securities 0 (2.3) (0.1)Commercial mortgage-backed securities (12.8) (2.2) (6.3)Other asset-backed securities 0 (0.1) (1.1)Redeemable preferred stocks 0 (0.4) (0.1)
Total available-for-sale securities (29.6) (34.0) (119.6)Equity securities:
Nonredeemable preferred stocks (8.7) (3.2) (3.9)Common equities (60.7) (8.0) (21.7)
Total equity securities (69.4) (11.2) (25.6)
Subtotal gross realized losses on security sales (99.0) (45.2) (145.2)
Net realized gains (losses) on security sales
Available-for-sale securities:U.S. government obligations 602.9 144.0 (92.0)State and local government obligations 101.7 5.4 6.6Corporate and other debt securities 155.4 92.2 (8.0)Residential mortgage-backed securities 0 (2.1) (0.1)Commercial mortgage-backed securities 10.9 5.9 (4.3)Other asset-backed securities 0.2 0.7 (1.0)Redeemable preferred stocks 0 1.8 4.4
Total available-for-sale securities 871.1 247.9 (94.4)Equity securities:
Nonredeemable preferred stocks 15.7 33.0 0.2Common equities 27.9 53.7 264.9
Total equity securities 43.6 86.7 265.1
Subtotal net realized gains (losses) on security sales 914.7 334.6 170.7
Net holding period gains (losses)
Hybrid securities 7.4 18.0 (10.4)
Equity securities 706.5 739.9 (497.5)Derivatives 1.4 0 0
Subtotal net holding period gains (losses) 715.3 757.9 (507.9)
Other-than-temporary impairment lossesOther asset impairment 0 (63.3) (68.3)
Subtotal other-than-temporary impairment losses 0 (63.3) (68.3)
Total net realized gains (losses) on securities $ 1,630.0 $ 1,029.2 $ (405.5)
App.-A-15

Realized gains (losses) on securities sold are computed using the first-in-first-out method. During 2020, we sold U.S.Treasury securities in order to selectively increase holdings across the remainder of the portfolio, predominantly in ourcorporate debt securities.
For 2019 and 2018, the other asset impairment losses related to federal renewable energy tax credit fundinvestments, which were reported in other assets on the consolidated balance sheets, and are based on an analysisthat our investments in those funds will not generate the cash flows that we anticipated.
The following table reflects our holding period realized gains (losses) on equity securities recognized for therespective years ended December 31, for equity securities held at the respective year end:
(millions) 2020 2019 2018
Total net gains (losses) recognized during the period on equity securities $ 750.1 $ 826.6 $ (232.4)
Less: Net gains (losses) recognized on equity securities sold during the period 43.6 86.7 265.1
Net holding period gains (losses) recognized during the period on equity securitiesheld at period end $ 706.5 $ 739.9 $ (497.5)
Net Investment Income The components of net investment income for the years ended December 31, were:
(millions) 2020 2019 2018
Available-for-sale securities:
Fixed maturities:
U.S. government obligations $166.3 $ 268.6 $196.8
State and local government obligations 62.7 36.5 37.7
Corporate debt securities 284.0 268.9 217.9
Residential mortgage-backed securities 11.8 21.6 27.6
Commercial mortgage-backed securities 152.9 150.1 93.9
Other asset-backed securities 96.7 117.3 75.7
Redeemable preferred stocks 14.9 19.0 12.3
Total fixed maturities 789.3 882.0 661.9
Short-term investments 29.0 41.7 52.9
Total available-for-sale securities 818.3 923.7 714.8
Equity securities:
Nonredeemable preferred stocks 60.6 61.8 45.9
Common equities 57.7 56.5 59.8
Total equity securities 118.3 118.3 105.7
Investment income 936.6 1,042.0 820.5
Investment expenses (20.0) (24.6) (24.3)
Net investment income $916.6 $1,017.4 $796.2
The amount of investment income (interest anddividends) we earn varies based on the average assetsheld during the year and the book yields of thesecurities in our portfolio. On a year-over-year basis,investment income decreased 10%, compared to lastyear, due to a decrease in the portfolio yield, which waspartially offset by an increase in average assets. Therecurring investment book yield decreased 23%,compared to 2019, as a result of investing cash from
operations and reinvesting cash from sales, maturities,paydowns, and other redemptions at market yields thatwere significantly lower than the portfolio’s overall yield.The income reduction from the negative yield changewas partially offset by an increase in income earned asa result of investing the $1.0 billion of proceeds from thedebt issued during March 2020, as well as strongpremium growth, underwriting profitability, and strongportfolio results, net of common and preferred stock
App.-A-16

dividends. The year-over-year increase in netinvestment income in 2019 compared to 2018, was dueto a combination of an increase in average assets andan increase in portfolio yields. The decrease ininvestment expenses in 2020, compared to 2019,primarily reflects lower expenses incurred due to ourdecision to no longer maintain an actively managedequity portfolio, and lower incentive-basedcompensation recognized.
Derivative Instruments During 2020, we opened andclosed U.S. Treasury Note futures to manage theportfolio duration and recorded a net realized gain of$1.4 million. The maximum notional value held at onetime during the year was $114.6 million. AtDecember 31, 2020, 2019, and 2018, we had no openderivative positions.
3. FAIR VALUE
We have categorized our financial instruments, basedon the degree of subjectivity inherent in the method bywhich they are valued, into a fair value hierarchy ofthree levels, as follows:
• Level 1: Inputs are unadjusted, quoted prices inactive markets for identical instruments at themeasurement date (e.g., U.S. governmentobligations, which are continually priced on adaily basis, active exchange-traded equitysecurities, and certain short-term securities).
• Level 2: Inputs (other than quoted pricesincluded within Level 1) that are observable forthe instrument either directly or indirectly (e.g.,certain corporate and municipal bonds andcertain preferred stocks). This includes:(i) quoted prices for similar instruments in activemarkets, (ii) quoted prices for identical or similarinstruments in markets that are not active,(iii) inputs other than quoted prices that areobservable for the instruments, and (iv) inputs
that are derived principally from or corroboratedby observable market data by correlation or othermeans.
• Level 3: Inputs that are unobservable.Unobservable inputs reflect our subjectiveevaluation about the assumptions marketparticipants would use in pricing the financialinstrument (e.g., certain structured securities andprivately held investments).
Determining the fair value of the investment portfolio isthe responsibility of management. As part of theresponsibility, we evaluate whether a market isdistressed or inactive in determining the fair value forour portfolio. We review certain market level inputs toevaluate whether sufficient activity, volume, and newissuances exist to create an active market. Based onthis evaluation, we concluded that there was sufficientactivity related to the sectors and securities for whichwe obtained valuations.
App.-A-17

The composition of the investment portfolio by major security type and our outstanding debt was:
Fair Value
(millions) Level 1 Level 2 Level 3 Total Cost
December 31, 2020
Fixed maturities:
U.S. government obligations $ 12,740.0 $ 0 $ 0 $ 12,740.0 $ 12,437.9
State and local government obligations 0 3,221.8 0 3,221.8 3,099.4
Corporate debt securities 0 10,185.2 0 10,185.2 9,579.7Subtotal 12,740.0 13,407.0 0 26,147.0 25,117.0
Asset-backed securities:
Residential mortgage-backed 0 509.5 0 509.5 503.3
Commercial mortgage-backed 0 6,175.1 0 6,175.1 6,042.6
Other asset-backed 0 3,784.6 0 3,784.6 3,745.0
Subtotal asset-backed securities 0 10,469.2 0 10,469.2 10,290.9
Redeemable preferred stocks:
Financials 0 51.6 0 51.6 51.1
Utilities 0 11.7 0 11.7 10.0
Industrials 10.8 120.6 0 131.4 120.1
Subtotal redeemable preferred stocks 10.8 183.9 0 194.7 181.2
Total fixed maturities 12,750.8 24,060.1 0 36,810.9 35,589.1
Short-term investments 4,704.9 513.6 0 5,218.5 5,218.5
Total available-for-salesecurities 17,455.7 24,573.7 0 42,029.4 40,807.6
Equity securities:
Nonredeemable preferred stocks:
Financials 117.7 1,212.3 35.0 1,365.0 1,278.6
Utilities 0 41.9 0 41.9 40.0
Industrials 0 24.3 16.7 41.0 40.1
Subtotal nonredeemable preferredstocks 117.7 1,278.5 51.7 1,447.9 1,358.7
Common equities:
Common stocks 4,049.9 0 0 4,049.9 1,184.2
Other risk investments 0 0 3.1 3.1 3.1
Subtotal common equities 4,049.9 0 3.1 4,053.0 1,187.3
Total equity securities 4,167.6 1,278.5 54.8 5,500.9 2,546.0
Total portfolio $ 21,623.3 $ 25,852.2 $ 54.8 $ 47,530.3 $ 43,353.6
Debt $ 0 $ 6,793.5 $ 0 $ 6,793.5 $ 5,396.1
App.-A-18

Fair Value
(millions) Level 1 Level 2 Level 3 Total Cost
December 31, 2019
Fixed maturities:
U.S. government obligations $ 13,251.1 $ 0 $ 0 $ 13,251.1 $ 13,100.7
State and local government obligations 0 1,713.3 0 1,713.3 1,686.0
Corporate debt securities 0 7,067.7 0 7,067.7 6,860.3
Subtotal 13,251.1 8,781.0 0 22,032.1 21,647.0
Asset-backed securities:
Residential mortgage-backed 0 627.5 0 627.5 625.0
Commercial mortgage-backed 0 5,076.2 0 5,076.2 5,020.7
Other asset-backed 0 5,179.5 0 5,179.5 5,164.7
Subtotal asset-backed securities 0 10,883.2 0 10,883.2 10,810.4
Redeemable preferred stocks:
Financials 0 51.7 0 51.7 51.5
Utilities 0 11.1 0 11.1 10.0
Industrials 11.1 121.1 0 132.2 124.2
Subtotal redeemable preferred stocks 11.1 183.9 0 195.0 185.7
Total fixed maturities 13,262.2 19,848.1 0 33,110.3 32,643.1
Short-term investments 1,797.4 1.4 0 1,798.8 1,798.8
Total fixed maturities and short-term 15,059.6 19,849.5 0 34,909.1 34,441.9
Equity securities:
Nonredeemable preferred stocks:
Financials 77.4 850.7 27.1 955.2 891.3
Utilities 0 42.3 0 42.3 39.9
Industrials 0 25.4 16.0 41.4 40.1
Subtotal nonredeemable preferredstocks 77.4 918.4 43.1 1,038.9 971.3
Common equities:
Common stocks 3,306.0 0 0 3,306.0 1,125.2
Other risk investments 0 0 0.3 0.3 0.3
Subtotal common equities 3,306.0 0 0.3 3,306.3 1,125.5
Total equity securities 3,383.4 918.4 43.4 4,345.2 2,096.8
Total available-for-sale portfolio $ 18,443.0 $ 20,767.9 $ 43.4 $ 39,254.3 $ 36,538.7
Debt $ 0 $ 5,119.6 $ 0 $ 5,119.6 $ 4,407.1
Our portfolio valuations, excluding short-terminvestments, classified as either Level 1 or Level 2 inthe above tables are priced exclusively by externalsources, including: pricing vendors, dealers/marketmakers, and exchange-quoted prices.
Our short-term investments classified as Level 1 arehighly liquid, actively marketed, and have a very shortduration, primarily 90 days or less to redemption. Thesesecurities are held at their original cost, adjusted for any
accretion of discount, since that value very closelyapproximates what an active market participant would bewilling to pay for such securities. The remainder of ourshort-term investments are classified as Level 2 and arenot priced externally since these securities continuallytrade at par value. These securities are classified asLevel 2 since they are primarily longer-dated securitiesissued by municipalities that contain either liquidityfacilities or mandatory put features within one year.
App.-A-19

At December 31, 2020, vendor-quoted pricesrepresented 76% of our Level 1 classifications (excludingshort-term investments), compared to 80% atDecember 31, 2019. The securities quoted by vendors inLevel 1 primarily represent our holdings in U.S. TreasuryNotes, which are frequently traded and the quotes areconsidered similar to exchange-traded quotes. Thebalance of our Level 1 pricing comes from quotesobtained directly from trades made on active exchanges.
At both December 31, 2020 and 2019, vendor-quotedprices comprised 99% of our Level 2 classifications(excluding short-term investments), while dealer-quotedprices represented 1%. In our process for selecting asource (e.g., dealer or pricing service) to provide pricingfor securities in our portfolio, we revieweddocumentation from the sources that detailed thepricing techniques and methodologies used by thesesources and determined if their policies adequatelyconsidered market activity, either based on specifictransactions for the particular security type or based onmodeling of securities with similar credit quality,duration, yield, and structure that were recentlytransacted. Once a source is chosen, we continue tomonitor any changes or modifications to their processesby reviewing their documentation on internal controls forpricing and market reviews. We review quality controlmeasures of our sources as they become available todetermine if any significant changes have occurred fromperiod to period that might indicate issues or concernsregarding their evaluation or market coverage.
As part of our pricing procedures, we obtain quotes frommore than one source to help us fully evaluate themarket price of securities. However, our internal pricingpolicy is to use a consistent source for individualsecurities in order to maintain the integrity of ourvaluation process. Quotes obtained from the sources arenot considered binding offers to transact. Under ourpolicy, when a review of the valuation received from ourselected source appears to be outside of what isconsidered market level activity (which is defined astrading at spreads or yields significantly different thanthose of comparable securities or outside the generalsector level movement without a reasonableexplanation), we may use an alternate source’s price. Tothe extent we determine that it may be prudent tosubstitute one source’s price for another, we will contactthe initial source to obtain an understanding of the factorsthat may be contributing to the significant price variance.
To allow us to determine if our initial source is providinga price that is outside of a reasonable range, we review
our portfolio pricing on a weekly basis. Whennecessary, we challenge prices from our sources whena price provided does not match our expectations basedon our evaluation of market trends and activity. Initially,we perform a review of our portfolio by sector to identifysecurities whose prices appear outside of a reasonablerange. We then perform a more detailed review of fairvalues for securities disclosed as Level 2. We reviewdealer bids and quotes for these and/or similarsecurities to determine the market level context for ourvaluations. We then evaluate inputs relevant for eachclass of securities disclosed in the preceding hierarchytables.
For our structured debt securities, including commercial,residential, and other asset-backed securities, weevaluate available market-related data for these andsimilar securities related to collateral, delinquencies,and defaults for historical trends and reasonablyestimable projections, as well as historical prepaymentrates and current prepayment assumptions and cashflow estimates. We further stratify each class of ourstructured debt securities into more finite sectors (e.g.,planned amortization class, first pay, second pay,senior, subordinated, etc.) and use duration, creditquality, and coupon to determine if the fair value isappropriate.
For our corporate debt and preferred stock (redeemableand nonredeemable) portfolios, as well as the notesissued by The Progressive Corporation (see Note 4 –Debt), we review securities by duration, coupon, andcredit quality, as well as changes in interest rate andcredit spread movements within that stratification. Thereview also includes recent trades, including: volumetraded at various levels that establish a market; issuerspecific fundamentals; and industry specific economicnews as it comes to light.
For our municipal securities (e.g., general obligations,revenue, and housing), we stratify the portfolio toevaluate securities by type, coupon, credit quality, andduration to review price changes relative to creditspread and interest rate changes. Additionally, we lookto economic data as it relates to geographic location asan indication of price-to-call or maturity predictors. Formunicipal housing securities, we look to changes incash flow projections, both historical and reasonablyestimable projections, to understand yield changes andtheir effect on valuation.
Lastly, for our short-term securities, we look atacquisition price relative to the coupon or yield. Since
App.-A-20

our short-term securities are typically 90 days or less tomaturity, with the majority listed in Level 2 being 30days or less to redemption, we believe that acquisitionprice is the best estimate of fair value.
We also review data assumptions as supplied by oursources to determine if that data is relevant to currentmarket conditions. In addition, we independently revieweach sector for transaction volumes, new issuances,and changes in spreads, as well as the overallmovement of interest rates along the yield curve todetermine if sufficient activity and liquidity exists toprovide a credible source for our market valuations.
During each valuation period, we create internalestimations of portfolio valuation (performance returns),based on current market-related activity (i.e., interestrate and credit spread movements and other credit-related factors) within each major sector of our portfolio.We compare our internally generated portfolio resultswith those generated based on quotes we receiveexternally and research material valuation differences.We compare our results to index returns for each majorsector adjusting for duration and credit qualitydifferences to better understand our portfolio’s results.Additionally, we review on a monthly basis our externalsales transactions and compare the actual final marketsales prices to previous market valuation prices. Thisreview provides us further validation that our pricingsources are providing market level prices, since we areable to explain significant price changes (i.e., greaterthan 2%) as known events occur in the marketplace andaffect a particular security’s price at sale.
This analysis provides us with additional comfortregarding the source’s process, the quality of its review,and its willingness to improve its analysis based onfeedback from clients. We believe this effort helpsensure that we are reporting the most representativefair values for our securities.
Except as described below, our Level 3 securities arealso priced externally; however, due to several factors(e.g., nature of the securities, level of activity, and lackof similar securities trading to obtain observable marketlevel inputs), these valuations are more subjective innature. Certain private equity investments included inthe Level 3 category are valued using external pricingsupplemented by internal review and analysis.
After all the valuations are received and our review iscomplete, if the inputs used by vendors are determined tonot contain sufficient observable market information, wewill reclassify the affected security valuations to Level 3. AtDecember 31, 2020 and 2019, we did not have anysecurities in our fixed-maturity portfolio listed as Level 3.
At December 31, 2020, we owned four privatenonredeemable preferred securities that were pricedinternally or by a pricing firm, and we held three privatenonredeemable preferred securities at December 31,2019. At December 31, 2020, we held two Level 3 otherrisk investments that were priced using the costmethod, compared to one Level 3 other risk investmentat December 31, 2019.
To the extent we receive prices from external sourcesfor the Level 3 securities, we would review those pricesfor reasonableness using internally developedassumptions and then compare our derived prices tothe prices we received. During 2020 or 2019, there wereno material assets or liabilities measured at fair value ona nonrecurring basis.
Based on our review, all prices received from externalsources remained unadjusted. Due to the relative sizeof the Level 3 securities’ fair values compared to thetotal portfolio’s fair value, any changes in pricingmethodology would not have a significant change invaluation that would materially impact net orcomprehensive income.
The following tables provide a summary of changes in fair value associated with Level 3 assets for the years endedDecember 31, 2020 and 2019:
Level 3 Fair Value
(millions)
Fair Valueat Dec. 31,
2019
Calls/Maturities/Paydowns Purchases Sales
Net Realized(Gain)/Loss
on SalesChange inValuation
NetTransfers
In (Out)
Fair Valueat Dec. 31,
2020
Equity securities:
Nonredeemable preferredstocks:
Financials $ 27.1 $ (27.1) $ 35.0 $ 0 $ 0 $ 0 $ 0 $ 35.0
Industrials 16.0 0 0 0 0 0.7 0 16.7
Common equities:
Other riskinvestments 0.3 0 2.8 0 0 0 0 3.1
Total Level 3securities $ 43.4 $ (27.1) $ 37.8 $ 0 $ 0 $ 0.7 $ 0 $ 54.8
App.-A-21

Level 3 Fair Value
(millions)
Fair Valueat Dec. 31,
2018
Calls/Maturities/Paydowns Purchases Sales
Net Realized(Gain)/Loss
on SalesChange inValuation
NetTransfers
In (Out)
Fair Valueat Dec. 31,
2019
Equity securities:
Nonredeemable preferredstocks:
Financials $ 25.1 $ 0 $ 2.0 $ 0 $ 0 $ 0 $ 0 $ 27.1
Industrials 5.0 0 10.0 0 0 1.0 0 16.0
Common equities:
Other riskinvestments 0.3 0 0 0 0 0 0 0.3
Total Level 3securities $ 30.4 $ 0 $ 12.0 $ 0 $ 0 $ 1.0 $ 0 $ 43.4
The following tables provide a summary of the quantitative information about Level 3 fair value measurements for ourapplicable securities at December 31:
Quantitative Information about Level 3 Fair Value Measurements
($ in millions)Fair Value at
Dec. 31, 2020 Valuation Technique Unobservable Input
UnobservableInput
Assumption
Equity securities:
Nonredeemable preferred stocks:
Financials1 $ 25.0 Internal priceUnadjusted purchase price
per share 3.7
Financials2 10.0 Internal priceUnadjusted purchase price
per share 16.9
Industrials 6.9 Pricing firm
Market Approach(Guideline Public Company
Method) 5.4
Industrials 9.8 Pricing firm
Market Approach(Guideline Public Company
Method) 4.8
Subtotal Level 3 securities 51.7
Pricing exemption securities 3.1
Total Level 3 securities $ 54.8
1This security was purchased in May 2020.2This security was purchased in November 2020.
Quantitative Information about Level 3 Fair Value Measurements
($ in millions)Fair Value at
Dec. 31, 2019 Valuation Technique Unobservable Input
UnobservableInput
Assumption
Equity securities:
Nonredeemable preferred stocks:
Financials $ 27.1 Pricing firmRecent transaction price per
share 9.0
Industrials 6.0 Pricing firm
Performance-basedtransaction price adjustment
per share 4.8
Industrials1 10.0 Internal priceUnadjusted purchase price
per share 4.9
Subtotal Level 3 securities 43.1
Pricing exemption securities 0.3
Total Level 3 securities $ 43.4
1The security was purchased in November 2019.
App.-A-22

4. DEBT
Debt at December 31, consisted of:
2020 2019
(millions)Carrying
ValueFair
ValueCarrying
ValueFair
Value
3.75% Senior Notes due 2021 (issued: $500.0, August 2011) $ 499.8 $ 510.9 $ 499.4 $ 515.6
2.45% Senior Notes due 2027 (issued: $500.0, August 2016) 497.3 541.1 496.9 501.5
6 5/8% Senior Notes due 2029 (issued: $300.0, March 1999) 296.9 409.4 296.6 392.5
4.00% Senior Notes due 2029 (issued: $550.0, October 2018) 545.5 660.4 545.0 614.3
3.20% Senior Notes due 2030 (issued: $500.0, March 2020) 496.1 575.5 0 0
6.25% Senior Notes due 2032 (issued: $400.0, November 2002) 396.0 582.0 395.7 552.6
4.35% Senior Notes due 2044 (issued: $350.0, April 2014) 346.7 459.7 346.7 417.0
3.70% Senior Notes due 2045 (issued: $400.0, January 2015) 395.5 481.0 395.4 434.2
4.125% Senior Notes due 2047 (issued: $850.0, April 2017) 841.7 1,113.1 841.6 986.1
4.20% Senior Notes due 2048 (issued: $600.0, March 2018) 590.0 806.7 589.8 705.8
3.95% Senior Notes due 2050 (issued: $500.0, March 2020) 490.6 653.7 0 0
Total $5,396.1 $ 6,793.5 $4,407.1 $5,119.6
All of the outstanding debt was issued by TheProgressive Corporation and includes amounts thatwere borrowed and contributed to the capital of itsinsurance subsidiaries or used, or made available foruse, for other business purposes. Fair values for thesedebt instruments are obtained from external sources.There are no restrictive financial covenants or creditrating triggers on the outstanding debt.
Interest on all debt is payable semiannually at the statedrates. All principal is due at the stated maturity. Each noteis redeemable, in whole or in part, at any time; however,the redemption price will equal the greater of the principalamount of the note or a “make whole” amount calculatedby reference to the present values of remaining scheduledprincipal and interest payments under the note.
We issued $500 million of 3.20% Senior Notes due 2030and $500 million of 3.95% Senior Notes due 2050 inMarch 2020, in an underwritten public offering. The netproceeds from these issuances, after deductingunderwriters’ discounts, commissions, and other issuancecosts, were approximately $986.3 million in aggregate.
Aggregate required principal payments on debtoutstanding at December 31, 2020, were as follows:
(millions)Year Payments
2021 $ 500
2022 0
2023 0
2024 0
2025 0
Thereafter 4,950
Total $ 5,450
Prior to certain issuances of our debt securities, weentered into forecasted transactions to hedge againstpossible rises in interest rates. When the contracts wereclosed upon the issuance of the applicable debtsecurities, we recognized the unrealized gains (losses)on these contracts as part of accumulated othercomprehensive income (see Note 1 – Reporting andAccounting Policies for further discussion). Theseunrealized gains (losses) are being amortized as
App.-A-23

adjustments to interest expense over the life of therelated notes. The following table shows the originalgain (loss) recognized at debt issuance and theunamortized balance at December 31, 2020, on apretax basis:
(millions)
UnrealizedGain (Loss)
at Debt Issuance
UnamortizedBalance at
December 31, 2020
3.75% Senior Notes $ (5.1) $ (0.4)
6 5/8% SeniorNotes (4.2) (2.2)
6.25% Senior Notes 5.1 3.2
4.35% Senior Notes (1.6) (1.4)
3.70% Senior Notes (12.9) (11.4)
4.125% SeniorNotes (8.0) (7.5)
We reclassified $1.1 million in 2020, and $1.0 million in2019 and 2018, of net unrealized losses fromaccumulated other comprehensive income to interestexpense on our closed debt issuance cash flow hedges.
During 2020, we renewed the line of credit with PNCBank, National Association (PNC), in the maximumprincipal amount of $250 million. Subject to the termsand conditions of the line of credit documents, advancesunder the line of credit (if any) will bear interest at avariable rate equal to the higher of PNC’s Prime Rate orthe sum of the Federal Funds Open Rate plus 175 basispoints. Each advance must be repaid on the 30th dayafter the advance or, if earlier, on April 30, 2021, theexpiration date of the line of credit. Prepayments arepermitted without penalty. The line of credit isuncommitted and, as such, all advances are subject toPNC’s discretion. We had no borrowings under eitherline of credit in 2020 or 2019.
5. INCOME TAXES
The components of our income tax provision for the years ended December 31, were as follows:
(millions) 2020 2019 2018
Current tax provision
Federal $ 1,395.7 $ 1,133.2 $ 673.1
State 35.6 27.3 21.5
Deferred tax expense (benefit)
Federal 35.8 16.8 (145.9)
State 1.5 3.0 (6.1)
Total income tax provision $ 1,468.6 $ 1,180.3 $ 542.6
The provision for income taxes in the accompanying consolidated statements of comprehensive income differed fromthe statutory rate for the years ended December 31, as follows:
(millions) 2020 2019 2018
Income before income taxes $7,173.2 $5,160.3 $3,163.6
Tax at statutory federal rate $1,506.4 21% $1,083.7 21% $ 664.4 21%
Tax effect of:
Reversal of prior year tax credits 0 0 163.2 3 0 0
Tax credits1 (5.4) 0 (43.9) (1) (76.3) (2)
Stock-based compensation (22.7) (1) (25.9) (1) (25.1) (1)
Tax-deductible dividends (25.1) (1) (14.6) 0 (14.6) 0
Tax-preferenced investment income (15.2) 0 (14.0) 0 (15.6) (1)
Nondeductible compensation expense 6.4 0 8.1 0 (0.2) 0
State income taxes, net of federal taxes 29.3 1 24.0 1 12.2 0
Other items, net (5.1) 0 (0.3) 0 (2.2) 0
Total income tax provision $1,468.6 20% $1,180.3 23% $ 542.6 17%
1Includes $0, $38.1 million, and $71.0 million for 2020, 2019, and 2018, respectively, of benefits on investments in federal renewable energy taxcredit funds.
App.-A-24

In late December 2018, we learned of allegations ofpotential fraudulent conduct by the sponsor of three taxcredit fund investments we made from 2016 through2018, including information about ongoing federalinvestigations. Based on our investigations and otherinformation that became available to us, we concludedthe sponsor had committed fraud through these taxcredit funds and that all the tax credits and other taxbenefits related to those investments were not valid. Asa result, during 2019, we increased our provision forincome taxes by $163.2 million ($252.0 million currentincome taxes payable, offset by $88.8 million reductionof deferred tax liability), principally reflecting the total
reversal of the tax credits and other tax benefitspreviously recognized from certain renewable energyinvestments, plus interest. In addition, we paid$100.0 million related to the 2018 tax year, whichreduced net taxes payable, and made protectivedeposits of $152.1 million for tax years 2017 and 2016.During 2020, $48.8 million of this deposit was appliedagainst our 2016 tax liability, including interest. Theremaining protective deposit of $103.3 million isincluded in other assets on our consolidated balancesheets. The principals of the sponsor and various otherindividuals have pleaded guilty to federal criminalcharges relating to the fraudulent tax credit funds.
Deferred income taxes reflect the effect for financial statement reporting purposes of temporary differences betweenthe financial statement carrying amounts and the tax bases of assets and liabilities. The following table shows thecomponents of the net deferred tax asset (liability) at December 31, 2020 and 2019, respectively.
(millions) 2020 2019
Federal deferred income tax assets:
Unearned premiums reserve $ 552.5 $ 498.2
Non-deductible accruals 238.2 181.8
Loss and loss adjustment expense reserves 170.0 153.3
Operating lease liabilities 37.4 42.3
Investment basis difference 18.6 27.4
Hedges on forecasted transactions 4.1 4.4
Other 25.8 15.3
Federal deferred income tax liabilities:
Net holding period gains on equity securities (620.5) (472.2)
Deferred acquisition costs (259.8) (221.9)
Net unrealized gains on fixed-maturity securities (253.4) (96.5)
Property and equipment (105.6) (108.6)
Loss and loss adjustment expense reserve transition adjustment (39.3) (47.2)
Operating lease assets (37.4) (42.3)
Intangible assets (27.6) (38.9)
Prepaid expenses (5.5) (4.8)
Other (7.5) (8.3)
Net federal deferred income taxes (310.0) (118.0)
State deferred income tax assets1 11.9 15.2
State deferred income tax liabilities1 (4.0) (1.2)
Total $ (302.1) $ (104.0)
1Recorded in “other assets” and “accounts payable, accrued expenses, and other liabilities,” respectively, on the consolidated balance sheets; theprior year amounts were reclassified into these line items from “net federal deferred income taxes” to conform to the current year presentation.
Although realization of the deferred tax assets is notassured, management believes that it is more likely thannot that the deferred tax assets will be realized basedon our expectation that we will be able to fully utilize thedeductions that are ultimately recognized for tax
purposes and, therefore, no valuation allowance wasneeded at December 31, 2020 or 2019.
At December 31, 2020 and 2019, we had $163.5 millionand $224.0 million, respectively, of net taxes payable
App.-A-25

(included in other liabilities on our consolidated balancesheets). Net taxes payable included the impact from thereversal of the tax credit benefits for 2017 and 2016.
The Progressive Corporation and its subsidiaries file aconsolidated federal income tax return. Effective April2018, we acquired additional shares of ARX HoldingCorp. (“ARX”) to increase our ownership above 80%. Asa result, ARX and its subsidiaries were first included inThe Progressive Corporation consolidated federalincome tax return for the period from April 2018 toDecember 31, 2018. ARX filed a final consolidatedfederal income tax return with its subsidiaries for theperiod from January to March 2018.
The Progressive Corporation and its eligiblesubsidiaries participated in the Compliance AssuranceProgram (CAP) from 2007 through 2018. Under CAP,the IRS begins its examination process for the tax yearbefore the tax return is filed, by examining significanttransactions and events as they occur; however, a CAPexamination does not include equity investments inpass-through entities in which the taxpayer owns lessthan 100% (e.g., partnerships, jointventures, etc.). The goal of the CAP program is toexpedite the exam process and to reduce the level ofuncertainty regarding a taxpayer’s tax filing positions.
All federal income tax years prior to 2017 are closed toexamination for The Progressive Corporation. The IRSCAP exams for 2017 and 2018 for The ProgressiveCorporation have been completed and the returns wereaccepted as filed. We consider these years to beeffectively settled (other than with respect to equityinvestments in pass-through entities). The 2019 and2020 tax years remain open to examination.
For the tax year ended March 2018, and for 2017 andprior years, ARX and its eligible subsidiaries filed theirown consolidated federal income tax returns. All taxyears prior to 2017 are closed and the 2017 and short2018 tax years remain open to examination.
The statute of limitations for state income tax purposesgenerally remains open for three to four years from thereturn filing date, depending upon the jurisdiction. Therehas been no significant state income tax audit activity.
We recognize interest and penalties, if any, as acomponent of income tax expense. For the years endedDecember 31, 2020, 2019, and 2018, $0, $9.9 million,and $0, respectively, of interest and penalties expensehas been recorded in the tax provision. We have notrecorded any unrecognized tax benefits, or any relatedinterest and penalties, as of December 31, 2020 and2019.
6. LOSS AND LOSS ADJUSTMENT EXPENSE RESERVES
We write personal and commercial auto insurance,residential property insurance, and other specialty property-casualty insurance and related services throughout theUnited States. As a property-casualty insurance company,we are exposed to hurricanes or other catastrophes. Weare unable to predict the frequency or severity of any suchevents that may occur in the near term or thereafter. Tohelp mitigate this risk in our Property business, we currentlymaintain excess of loss reinsurance coverage, both on anaggregate and a per occurrence basis, and had aggregatestop-loss reinsurance coverage covering accident years2017 to 2019.
As we are primarily an insurer of motor vehicles andresidential property, we have limited exposure toenvironmental, asbestos, and general liability claims.We have established reserves for such exposures,which represent about 0.1% of our total loss and lossadjustment expense reserves. We believe thesereserves to be adequate based on information currentlyknown. These claims are not expected to have amaterial effect on our liquidity, financial condition, cashflows, or results of operations.
Loss and Loss Adjustment Expense Reserves
Loss and loss adjustment expense (LAE) reservesrepresent our best estimate of our ultimate liability forlosses and LAE relating to events that occurred prior to theend of any given accounting period but have not yet beenpaid. For our Personal and Commercial Lines vehiclebusinesses, which represent about 94% of our total carriedreserves, we establish loss and LAE reserves aftercompleting reviews at a disaggregated level of grouping.Progressive’s actuarial staff reviews over 400 subsets ofbusiness data, which are at a combined state, product,and line coverage level, to calculate the needed loss andLAE reserves. During a reserve review, ultimate lossamounts are estimated using several industry standardactuarial projection methods. These methods take intoaccount historical comparable loss data at the subset leveland estimate the impact of various loss developmentfactors, such as the frequency (number of losses perearned car year), severity (dollars of loss per each claim),and average premium (dollars of premium per earned caryear), as well as the frequency and severity of lossadjustment expense costs.
App.-A-26

We begin our review of a set of data by producingmultiple estimates of needed reserves, using both paidand incurred data, to determine if a reserve change isrequired. In the event of a wide variation among resultsgenerated by the different projections, our actuarialgroup will further analyze the data using additionalquantitative analysis. Each review develops a pointestimate for a relatively small subset of the business,which allows us to establish meaningful reserve levelsfor that subset. We believe our comprehensive processof reviewing at a subset level provides us moremeaningful estimates of our aggregate loss reserves.
The actuarial staff completes separate projections ofneeded case and incurred but not recorded (IBNR)reserves. Since a large majority of the parties involvedin an accident report their claims within a short timeperiod after the occurrence, we do not carry asignificant amount of IBNR reserves for older accidentyears. Based on the methodology we use to estimatecase reserves for our vehicle businesses, we do nothave expected development on reported claimsincluded in our IBNR reserves. We do, however, includeanticipated salvage and subrogation recoveries in ourIBNR reserves, which could result in negative carriedIBNR reserves, primarily in our physical damagereserves.
Changes from historical data may reduce thepredictiveness of our projected future loss costs.Internal considerations that are process-related, whichgenerally result from changes in our claimsorganization’s activities, include claim closure rates, thenumber of claims that are closed without payment, andthe level of the claims representatives’ estimates of theneeded case reserve for each claim. These changesand their effect on the historical data are studied at thestate level versus on a larger, less indicative,countrywide basis. External items considered includethe litigation atmosphere, state-by-state changes inmedical costs, and the availability of services to resolveclaims. These also are better understood at the statelevel versus at a more macro, countrywide level. Theactuarial staff takes these changes into considerationwhen making their assumptions to determine neededreserve levels.
Similar to our vehicle businesses, our actuarial staffanalyzes loss and LAE data for our Property businesson an accident period basis. Many of the methodologiesand key parameters reviewed are similar. In addition,for our Property business, since claims adjustersprimarily establish the case reserves, the actuarial staffincludes expected development on case reserves as acomponent of the overall IBNR reserves.
Activity in the loss and LAE reserves is summarized as follows:
(millions) 2020 2019 2018
Balance at January 1 $ 18,105.4 $ 15,400.8 $ 13,086.9
Less reinsurance recoverables on unpaid losses 3,212.2 2,572.7 2,170.1
Net balance at January 1 14,893.2 12,828.1 10,916.8
Incurred related to:
Current year 24,926.5 25,238.2 21,632.5
Prior years 195.3 232.3 88.5
Total incurred 25,121.8 25,470.5 21,721.0
Paid related to:
Current year 15,584.4 16,105.0 13,792.1
Prior years 7,963.0 7,300.4 6,017.6
Total paid 23,547.4 23,405.4 19,809.7
Net balance at December 31 16,467.6 14,893.2 12,828.1
Plus reinsurance recoverables on unpaid losses 3,798.2 3,212.2 2,572.7
Balance at December 31 $ 20,265.8 $ 18,105.4 $ 15,400.8
We experienced unfavorable reserve development of $195.3 million, $232.3 million, and $88.5 million in 2020, 2019,and 2018, respectively, which is reflected as “Incurred related to prior years” in the table above.
App.-A-27

2020• Approximately $59 million of the unfavorable prior year reserve development was attributable to accident year
2019, $107 million to accident year 2018, and the remainder to 2017 and prior accident years.• Our personal auto products incurred about $136 million of unfavorable loss and LAE reserve development, with
the Agency and Direct auto businesses each contributing about half, primarily attributable to higher thananticipated frequency of reopened personal injury protection (PIP) claims, primarily in Florida, updatedestimates of our per claim settlement costs, and late reported losses occurring toward the end of 2019 but notreported until 2020, which was partially offset by higher than anticipated salvage and subrogation recoveries.
• Our Commercial Lines business experienced about $98 million of unfavorable development, primarily due toincreased injury severity and the emergence of large injury claims at rates higher than originally anticipated.
• Our special lines and Property businesses experienced about $25 million and $14 million, respectively, of favorabledevelopment driven by favorable case development across all products, as severity was lower than expected.
2019• Approximately $131 million of the unfavorable prior year reserve development was attributable to accident year
2018, $73 million to accident year 2017, and the remainder to 2016 and prior accident years.• Our personal auto products incurred about $121 million of unfavorable loss and LAE reserve development, with
the Agency and Direct auto businesses each contributing about half, primarily reflecting increased injuryseverity, a higher than anticipated frequency of reopened PIP claims, primarily in Florida, and late reportedlosses occurring late 2018 but not reported until 2019.
• Our Commercial Lines business experienced about $83 million of unfavorable development, primarily due toincreased injury severity and more emergence of large injury claims than originally anticipated.
• Our special lines business experienced about $14 million of unfavorable development, primarily due to lesssalvage and subrogation recoveries than originally anticipated and increased severity of late reported claims.
• Our Property businesses experienced about $12 million of unfavorable development, primarily due to higherthan originally anticipated homeowner and dwelling costs and fire liability costs.
2018• Approximately $99 million of unfavorable prior year reserve development was attributable to accident years
2017 and 2016. This unfavorable development was offset by about $10 million of favorable developmentattributable to accident year 2015 and prior accident years.
• Our personal auto products incurred almost $85 million of unfavorable loss and LAE reserve development, withapproximately 70% attributable to the Agency business and 30% attributable to the Direct business, primarilyreflecting unfavorable development from reopened Florida PIP claims.
• Our special lines and Property businesses experienced about $5 million and $3 million of unfavorabledevelopment, respectively, while our commercial auto products had about $4 million of favorable reservedevelopment.
Incurred and Paid Claims Development by Accident Year
The following tables present our incurred, net ofreinsurance, and paid claims development by accidentyear for the last five years, which generally representsthe maximum development period for claims in any ofour segments. The tables below includeinception-to-date information for companies acquiredand wholly exclude companies disposed of, rather thanincluding information from the date of acquisition, oruntil the date of disposition. We believe the mostmeaningful presentation of claims development isthrough the retrospective approach by presenting allrelevant historical information for all periods presented.
We have elected to present our incurred and paidclaims development consistent with our GAAPreportable segments (see Note 10 – SegmentInformation for a discussion of our segment reporting),with a further disaggregation of our Personal Lines andCommercial Lines claims development between liabilityand physical damage, since the loss patterns are
significantly different between them. The other businessprimarily includes reserves for our run-off products,which are not considered material, and, therefore, weare not including separate claims development tables.
Only 2020 is audited; all prior years are consideredrequired supplementary information and, therefore, areunaudited. Expected development on our case reservesis excluded from the IBNR reserves on our vehiclebusinesses, as discussed above. For the Propertybusiness, the IBNR reserves include expected casedevelopment based on the methodology used inestablishing the case reserves for that segment. Thecumulative number of incurred claims are based onaccident coverages (e.g., bodily injury, collision,comprehensive, personal injury protection, propertydamage) related to opened claims. Coverage countsrelated to claims closed without payment are excludedfrom the cumulative number of incurred claims.
App.-A-28

Personal Lines - Agency - Liability
($ in millions) As of
Incurred Claims and Allocated Claim Adjustment Expenses, Net of Reinsurance December 31, 2020
For the years ended December 31,
Total of IBNRLiabilities Plus
ExpectedDevelopmenton Reported
Claims
CumulativeNumber of
Incurred ClaimCountsAccident Year 20161 20171 20181 20191 2020
2016 $ 4,082.9 $ 4,130.0 $ 4,152.0 $ 4,177.3 $ 4,137.8 $ 0 740,535
2017 4,474.8 4,485.8 4,511.1 4,546.4 72.3 779,303
2018 5,141.8 5,182.1 5,192.7 100.0 856,108
2019 5,885.0 5,886.9 264.3 913,063
2020 5,433.8 926.8 750,654
Total $ 25,197.6
Cumulative Paid Claims and Allocated Claim Adjustment Expenses, Net of Reinsurance
For the years ended December 31,
Accident Year 20161 20171 20181 20191 2020
2016 $ 1,941.6 $ 3,231.5 $ 3,723.1 $ 3,969.5 $ 4,062.5
2017 2,074.0 3,478.5 4,048.5 4,285.5
2018 2,378.0 4,028.7 4,635.0
2019 2,715.2 4,533.2
2020 2,383.0
Total $ 19,899.2
All outstanding liabilities before 2016, net of reinsurance1 80.3
Liabilities for claims and claim adjustment expenses, net of reinsurance $ 5,378.7
1 Required supplementary information (unaudited)
Personal Lines - Agency - Physical Damage
($ in millions) As of
Incurred Claims and Allocated Claim Adjustment Expenses, Net of Reinsurance December 31, 2020
For the years ended December 31,
Total of IBNRLiabilities Plus
ExpectedDevelopmenton Reported
Claims
CumulativeNumber of
Incurred ClaimCountsAccident Year 20161 20171 20181 20191 2020
2016 $ 2,423.4 $ 2,398.9 $ 2,401.8 $ 2,400.1 $ 2,402.8 $ 0 1,399,156
2017 2,635.5 2,638.5 2,643.5 2,640.6 (4.0) 1,514,873
2018 2,819.0 2,822.6 2,821.7 (3.4) 1,694,997
2019 3,277.9 3,254.7 (13.4) 1,876,942
2020 3,328.5 (183.4) 1,768,482
Total $ 14,448.3
Cumulative Paid Claims and Allocated Claim Adjustment Expenses, Net of Reinsurance
For the years ended December 31,
Accident Year 20161 20171 20181 20191 2020
2016 $ 2,391.0 $ 2,406.9 $ 2,402.1 $ 2,402.2 $ 2,401.8
2017 2,599.8 2,643.2 2,640.9 2,640.8
2018 2,769.1 2,827.4 2,819.9
2019 3,242.5 3,259.2
2020 3,250.1
Total $ 14,371.8
All outstanding liabilities before 2016, net of reinsurance1 5.9
Liabilities for claims and claim adjustment expenses, net of reinsurance $ 82.4
1 Required supplementary information (unaudited)
App.-A-29

Personal Lines - Direct - Liability
($ in millions) As of
Incurred Claims and Allocated Claim Adjustment Expenses, Net of Reinsurance December 31, 2020
For the years ended December 31,
Total of IBNRLiabilities Plus
ExpectedDevelopmenton Reported
Claims
CumulativeNumber of
Incurred ClaimCountsAccident Year 20161 20171 20181 20191 2020
2016 $ 3,819.0 $ 3,843.9 $ 3,871.2 $ 3,897.8 $ 3,866.1 $ 0 735,791
2017 4,209.5 4,209.9 4,229.3 4,254.4 61.3 772,986
2018 4,904.8 4,980.9 5,003.2 88.0 870,978
2019 5,756.5 5,811.7 243.5 954,209
2020 5,356.9 901.1 786,809
Total $ 24,292.3
Cumulative Paid Claims and Allocated Claim Adjustment Expenses, Net of Reinsurance
For the years ended December 31,
Accident Year 20161 20171 20181 20191 2020
2016 $ 1,780.6 $ 2,991.1 $ 3,476.9 $ 3,714.6 $ 3,799.1
2017 1,912.6 3,255.2 3,808.3 4,035.6
2018 2,235.1 3,863.5 4,481.7
2019 2,630.3 4,452.5
2020 2,301.3
Total $ 19,070.2
All outstanding liabilities before 2016, net of reinsurance1 55.2
Liabilities for claims and claim adjustment expenses, net of reinsurance $ 5,277.3
1 Required supplementary information (unaudited)
Personal Lines - Direct - Physical Damage
($ in millions) As of
Incurred Claims and Allocated Claim Adjustment Expenses, Net of Reinsurance December 31, 2020
For the years ended December 31,
Total of IBNRLiabilities Plus
ExpectedDevelopmenton Reported
Claims
CumulativeNumber of
Incurred ClaimCountsAccident Year 20161 20171 20181 20191 2020
2016 $ 2,521.0 $ 2,475.4 $ 2,477.7 $ 2,475.6 $ 2,478.5 $ 0 1,676,396
2017 2,750.6 2,743.7 2,749.0 2,745.6 (5.1) 1,791,582
2018 3,202.3 3,181.9 3,182.0 (5.1) 2,069,684
2019 3,787.9 3,737.8 (22.7) 2,269,857
2020 3,775.6 (264.5) 2,137,810
Total $ 15,919.5
Cumulative Paid Claims and Allocated Claim Adjustment Expenses, Net of Reinsurance
For the years ended December 31,
Accident Year 20161 20171 20181 20191 2020
2016 $ 2,505.0 $ 2,485.8 $ 2,479.3 $ 2,478.5 $ 2,477.8
2017 2,742.1 2,753.5 2,748.4 2,747.6
2018 3,170.0 3,193.8 3,183.0
2019 3,782.6 3,751.3
2020 3,720.0
Total $ 15,879.7
All outstanding liabilities before 2016, net of reinsurance1 0.8
Liabilities for claims and claim adjustment expenses, net of reinsurance $ 40.6
1Required supplementary information (unaudited)
App.-A-30

Commercial Lines - Liability
($ in millions) As of
Incurred Claims and Allocated Claim Adjustment Expenses, Net of Reinsurance December 31, 2020
For the years ended December 31,
Total of IBNRLiabilities Plus
ExpectedDevelopmenton Reported
Claims
CumulativeNumber of
Incurred ClaimCountsAccident Year 20161 20171 20181 20191 2020
2016 $ 1,185.8 $ 1,204.8 $ 1,231.1 $ 1,238.9 $ 1,224.9 $ 0 92,688
2017 1,374.1 1,366.6 1,393.3 1,374.6 18.3 97,448
2018 1,700.8 1,736.5 1,789.7 41.5 111,767
2019 2,103.1 2,175.6 116.3 126,959
2020 2,161.8 369.8 105,900
Total $ 8,726.6
Cumulative Paid Claims and Allocated Claim Adjustment Expenses, Net of Reinsurance
For the years ended December 31,
Accident Year 20161 20171 20181 20191 2020
2016 $ 298.6 $ 639.9 $ 886.0 $ 1,073.3 $ 1,153.4
2017 325.8 712.9 1,027.3 1,183.6
2018 382.7 913.4 1,290.5
2019 455.4 1,120.1
2020 427.6
Total $ 5,175.2
All outstanding liabilities before 2016, net of reinsurance1 34.9
Liabilities for claims and claim adjustment expenses, net of reinsurance $ 3,586.3
1Required supplementary information (unaudited)
Commercial Lines - Physical Damage
($ in millions) As of
Incurred Claims and Allocated Claim Adjustment Expenses, Net of Reinsurance December 31, 2020
For the years ended December 31,
Total of IBNRLiabilities Plus
ExpectedDevelopmenton Reported
Claims
CumulativeNumber of
Incurred ClaimCountsAccident Year 20161 20171 20181 20191 2020
2016 $ 379.6 $ 379.8 $ 378.2 $ 377.8 $ 378.1 $ 0 74,199
2017 415.4 412.1 411.0 409.9 (0.9) 77,170
2018 475.0 478.2 476.6 (1.4) 82,134
2019 577.8 574.2 (3.3) 88,897
2020 575.2 (14.1) 87,333
Total $ 2,414.0
Cumulative Paid Claims and Allocated Claim Adjustment Expenses, Net of Reinsurance
For the years ended December 31,
Accident Year 20161 20171 20181 20191 2020
2016 $ 336.7 $ 376.9 $ 376.8 $ 377.5 $ 377.6
2017 369.0 409.4 409.2 409.4
2018 426.0 475.1 475.3
2019 516.9 571.5
2020 497.9
Total $ 2,331.7
All outstanding liabilities before 2016, net of reinsurance1 0.4
Liabilities for claims and claim adjustment expenses, net of reinsurance $ 82.7
1Required supplementary information (unaudited)
App.-A-31

Property Business
($ in millions) As of
Incurred Claims and Allocated Claim Adjustment Expenses, Net of Reinsurance December 31, 2020
For the years ended December 31,
Total of IBNRLiabilities Plus
ExpectedDevelopmenton Reported
Claims
CumulativeNumber of
Incurred ClaimCountsAccident Year 20161 20171 20181 20191 2020
2016 $ 568.6 $ 541.2 $ 537.1 $ 536.5 $ 535.5 $ 2.4 53,693
2017 672.8 680.9 683.4 681.3 1.3 74,140
2018 839.0 845.2 845.4 18.2 63,722
2019 971.7 965.2 11.7 72,396
2020 1,223.5 252.4 80,820
Total $ 4,250.9
Cumulative Paid Claims and Allocated Claim Adjustment Expenses, Net of Reinsurance
For the years ended December 31,
Accident Year 20161 20171 20181 20191 2020
2016 $ 415.2 $ 498.2 $ 516.9 $ 526.4 $ 530.8
2017 506.7 647.1 670.1 675.0
2018 595.9 781.2 812.6
2019 708.0 930.4
2020 832.5
Total $ 3,781.3
All outstanding liabilities before 2016, net of reinsurance1 5.1
Liabilities for claims and claim adjustment expenses, net of reinsurance $ 474.7
1Required supplementary information (unaudited)
App.-A-32

The following table reconciles the net incurred and paid claims development tables to the liability for claims and claimadjustment expenses:
(millions) 2020 2019
Net outstanding liabilities
Personal Lines
Agency, Liability $ 5,378.7 $ 5,117.4
Agency, Physical Damage 82.4 32.4
Direct, Liability 5,277.3 4,936.8
Direct, Physical Damage 40.6 (7.7)
Commercial Lines
Liability 3,586.3 3,080.8
Physical Damage 82.7 66.6
Property 474.7 357.2
Other business 66.7 30.8
Liabilities for unpaid claims and claim adjustment expenses, net of reinsurance 14,989.4 13,614.3
Reinsurance recoverable on unpaid claims
Personal Lines
Agency, Liability 959.6 930.7
Agency, Physical Damage 0 0
Direct, Liability 1,475.8 1,314.1
Direct, Physical Damage 0 0
Commercial Lines
Liability 758.5 482.6
Physical Damage (0.3) 0.5
Property 226.9 184.1
Other business 358.6 288.1
Total reinsurance recoverable on unpaid claims 3,779.1 3,200.1
Unallocated claims adjustment expense related to:
Liabilities for unpaid claims and claim adjustment expenses, net of reinsurance 1,478.2 1,278.9
Reinsurance recoverable on unpaid claims 19.1 12.1
Total gross liability for unpaid claims and claim adjustment expense $ 20,265.8 $ 18,105.4
The following table shows the average historical claims duration as of December 31, 2020:
(Required Supplementary Information - Unaudited)
Average Annual Percentage Payout of Incurred Claims by Age, Net ofReinsurance
Years
1 2 3 4 5
Personal Lines
Agency, Liability 45.6% 31.2% 12.0% 5.6% 2.2%
Agency, Physical Damage 98.6 1.2 (0.2) 0 0
Direct, Liability 44.7 31.7 12.6 5.7 2.2
Direct, Physical Damage 100.0 (0.1) (0.3) 0 0
Commercial Lines
Liability 21.7 29.3 21.4 13.2 6.5
Physical Damage 88.9 10.0 0 0.1 0
Property 71.9 20.8 3.5 1.2 0.8
App.-A-33

7. REINSURANCE
The effect of reinsurance on premiums written and earned for the years ended December 31, was as follows:
2020 2019 2018
(millions) Written Earned Written Earned Written Earned
Direct premiums $ 41,736.4 $ 40,687.7 $ 39,222.0 $ 37,519.7 $ 33,753.1 $ 31,970.2
Ceded premiums:
Regulated (648.2) (686.5) (711.1) (670.8) (596.4) (557.5)
Non-Regulated (519.5) (739.6) (933.0) (656.5) (546.8) (479.4)
Total ceded premiums (1,167.7) (1,426.1) (1,644.1) (1,327.3) (1,143.2) (1,036.9)
Net premiums $ 40,568.7 $ 39,261.6 $ 37,577.9 $ 36,192.4 $ 32,609.9 $ 30,933.3
Regulated refers to federal or state run plans andprimarily include the following:
• Federal reinsurance plan• National Flood Insurance Program (NFIP)
• State-provided reinsurance facilities• Michigan Catastrophic Claims Association
(MCCA)• North Carolina Reinsurance Facility (NCRF)• Florida Hurricane Catastrophe Fund (FHCF)
• State-mandated involuntary plans• Commercial Automobile Insurance
Procedures/Plans (CAIP)
Non-Regulated represents voluntary externalreinsurance contracts entered into by the company.These include amounts ceded on our Commercial Linesbusiness primarily related to transportation networkcompany (TNC) business under quota-sharereinsurance agreements and amounts ceded on ourProperty business under catastrophic occurrence
excess of loss, aggregate excess of loss, beginningJanuary 1, 2020, and, for accident years 2017-2019,aggregate stop-loss reinsurance agreements.
At December 31, 2020, we wrote TNC business in 20states and the District of Columbia, compared to 17states and 4 states at year-end 2019 and 2018,respectively. While expanding our footprint in the TNCbusiness increased our ceded written premium in 2019,during 2020 the impact of this expansion was mitigatedby a significant decrease in vehicle miles driven, whichwas attributable to COVID-19 restrictions. Premiumswritten on TNC policies are estimated based onprojections of miles driven during the policy term, andsuch estimates are revised monthly based on actualmiles driven and revised estimates of miles driven forthe remaining policy term. The increase in cededearned premiums in both 2020 and 2019 reflects thegrowth in the TNC business.
Our reinsurance recoverables and prepaid reinsurance premiums were comprised of the following at December 31:
Reinsurance Recoverables Prepaid Reinsurance Premiums
($ in millions) 2020 2019 2020 2019
Regulated:
MCCA $ 2,428.8 60% $ 2,247.1 67% $ 33.3 9% $ 71.8 12%
CAIP 397.8 10 332.4 10 84.7 23 93.8 15
NCRF 88.6 2 84.4 2 41.9 11 33.8 5
FHCF 54.8 1 86.0 3 0 0 0 0
NFIP 24.2 1 11.6 0 60.7 17 58.7 9
Other 3.2 0 3.1 0 1.3 0 1.0 0
Total Regulated 2,997.4 74 2,764.6 82 221.9 60 259.1 41
Non-Regulated:
Commercial Lines 753.2 19 459.5 14 134.5 37 352.9 56
Property 261.7 7 146.8 4 11.7 3 14.5 3
Other 7.1 0 8.0 0 0 0 0 0
Total Non-Regulated 1,022.0 26 614.3 18 146.2 40 367.4 59
Total $ 4,019.4 100% $ 3,378.9 100% $ 368.1 100% $ 626.5 100%
App.-A-34

The increase in our reinsurance recoverables on ourCommercial Lines business primarily reflects the growthin the TNC business, while the decrease in the prepaidreinsurance premiums is due to the reduction ofpremiums written due to the COVID-19 restrictions asdiscussed above.
Reinsurance contracts do not relieve us from ourobligations to policyholders. Failure of reinsurers tohonor their obligations could result in losses to us. Ourexposure to losses from the failure of Regulated plans isminimal, since these plans are funded by the federalgovernment or by mechanisms supported by insurancecompanies in applicable states. We evaluate thefinancial condition of our other reinsurers and monitorconcentrations of credit risk to minimize our exposure tosignificant losses from reinsurer insolvencies.
We routinely monitor changes in the credit quality andconcentration risks of the reinsurers who are counterparties to our reinsurance recoverables to determine ifan allowance for credit losses should be established.For at-risk uncollateralized recoverable balances, weevaluate a number of reinsurer specific factors,including reinsurer credit quality rating, credit ratingoutlook, historical experience, reinsurer surplus,recoverable duration, and collateralization compositionin respect to our net exposure (i.e., the reinsurancerecoverable amount less premiums payable to thereinsurer, where the right to offset exists). AtDecember 31, 2020, the allowance for credit lossesrelated to these contracts was not material to ourfinancial condition or results of operations.
8. STATUTORY FINANCIAL INFORMATION
Consolidated statutory surplus was $15,194.6 million and$13,671.1 million at December 31, 2020 and 2019,respectively. Statutory net income was $4,911.4 million,$3,489.7 million, and $2,643.0 million for the years endedDecember 31, 2020, 2019, and 2018, respectively.
At December 31, 2020, $1,142.0 million of consolidatedstatutory surplus represented net admitted assets of ourinsurance subsidiaries and affiliates that are required tomeet minimum statutory surplus requirements in suchentities’ states of domicile. The companies may belicensed in states other than their states of domicile,which may have higher minimum statutory surplusrequirements. Generally, the net admitted assets ofinsurance companies that, subject to other applicable
insurance laws and regulations, are available fortransfer to the parent company cannot include the netadmitted assets required to meet the minimum statutorysurplus requirements of the states where the companiesare licensed.
During 2020, the insurance subsidiaries paid aggregatecash dividends of $4,096.5 million to their parentcompany. Based on the dividend laws currently ineffect, the insurance subsidiaries could pay aggregatedividends of $4,612.6 million in 2021 without priorapproval from regulatory authorities, provided thedividend payments are not made within 12 months ofprevious dividends paid by the applicable subsidiary.
9. EMPLOYEE BENEFIT PLANS
Retirement Plans Progressive has a definedcontribution pension plan (401(k) Plan) that coversemployees who have been employed with the companyfor at least 30 days. Under Progressive’s 401(k) Plan,we match up to a maximum of 6% of an employee’seligible compensation contributed to the plan. Employeeand company matching contributions are invested, atthe direction of the employee, in a number ofinvestment options available under the plan, includingvarious mutual funds, a self-directed brokerage option,and a Progressive common stock fund.
Progressive’s common stock fund is an employee stockownership program (ESOP) within the 401(k) Plan. AtDecember 31, 2020, the ESOP held 21.5 million of ourcommon shares, all of which are included in shares
outstanding. Dividends on these shares are reinvestedin common shares or paid out in cash, at the election ofthe participant, and the related tax benefit is recordedas part of our tax provision. Matching contributions tothese plans for the years ended December 31, 2020,2019, and 2018 were $131.2 million, $120.8 million, and$106.8 million, respectively.
Postemployment Benefits Progressive providesvarious postemployment benefits to former or inactiveemployees who meet eligibility requirements, and totheir beneficiaries and covered dependents.Postemployment benefits include salary continuationand disability-related benefits, including workers’compensation and, if elected, continuation of health-care benefits for specified limited periods. The liabilityfor these benefits was $24.1 million and $22.2 million atDecember 31, 2020 and 2019, respectively.
App.-A-35

Incentive Compensation Plans – Employees
Progressive’s incentive compensation programs includeboth non-equity incentive plans (cash) and equityincentive plans. Progressive’s cash incentivecompensation included an annual cash incentive
program (i.e., Gainsharing Program) for virtually allemployees. Progressive’s equity incentivecompensation plans provide for the granting ofrestricted stock unit awards to key members ofmanagement.
The amounts charged to expense for incentive compensation plans for the years ended December 31, were:
2020 2019 2018
(millions) Pretax After Tax Pretax After Tax Pretax After Tax
Non-equity incentive plans – cash $ 688.8 $ 544.2 $ 598.4 $ 472.7 $ 539.5 $ 426.2
Equity incentive plans:
Equity awards 89.4 70.6 90.1 71.2 76.2 60.2
Liability awards1 0 0 0.1 0.1 1.0 0.81Relates to stock options granted to key employees of ARX, which were exercised in 2020. See Note 15 – Redeemable Noncontrolling Interest forfurther discussion.
Under Progressive’s 2015 Equity Incentive Plan, whichprovides for the granting of equity-based compensationto officers and other key employees, 17.0 millionshares, in the aggregate, were authorized for issuance.
The restricted equity awards are issued as either time-based or performance-based awards. Generally, equityawards are expensed pro rata over their respectivevesting periods, based on the market value of theawards at the time of grant, with accelerated expensefor participants who reach qualified retirementprovisions. The time-based awards vest in equalinstallments upon the lapse of specified periods of time,typically three, four, and five years, subject to theretirement provisions of the applicable awardagreements.
Performance-based awards that contain variablevesting criteria are expensed based on management’sexpectation of the percentage of the award, if any, thatwill ultimately vest. These estimates can changeperiodically throughout the measurement period.Vesting of performance-based awards is contingentupon the achievement of pre-determined performancegoals within specified time periods.
The performance-based awards were granted toexecutives and other senior managers in 2020, inaddition to their time-based awards, to provideadditional incentive to achieve pre-establishedprofitability and growth targets or relative investmentperformance. The targets for the performance-basedawards, as well as the number of units that ultimatelymay vest, vary by grant.
The details of the performance-based equity awards that were outstanding at December 31, 2020, are as follows:
Performance Measurement Year(s) of Grant
Vesting range(as a percentage of
target)
Growth of our personal auto and commercial auto businesses and homeownersmulti-peril business, each compared to its respective market 2018-2020 0-250%
Investment results relative to peer group 2018-2020 0-200%
All restricted equity awards are settled at or after vesting in Progressive common shares from existing treasury shareson a one-to-one basis.
App.-A-36

A summary of all employee restricted equity award activity during the years ended December 31, follows:
2020 2019 2018
Restricted Equity AwardsNumber of
Shares1
WeightedAverage
GrantDate Fair
ValueNumber of
Shares1
WeightedAverage
GrantDate Fair
ValueNumber of
Shares1
WeightedAverage
GrantDate Fair
Value
Beginning of year 3,879,077 $ 48.28 4,856,356 $ 38.56 5,858,848 $ 30.47
Add (deduct):
Granted2 1,629,534 55.28 1,835,145 49.61 1,876,109 45.55
Vested (1,861,442) 36.19 (2,691,337) 31.85 (2,811,070) 26.41
Forfeited (76,898) 52.79 (121,087) 43.98 (67,531) 36.10
End of year3,4 3,570,271 $ 57.68 3,879,077 $ 48.28 4,856,356 $ 38.561Includes restricted stock units. All performance-based awards are included at their target amounts.2We reinvest dividend equivalents on restricted stock units. For 2020, 2019, and 2018, the number of units “granted” shown in the table aboveincludes 144,389, 210,159, and 144,688 of dividend equivalent units, respectively, at a weighted average grant date fair value of $0, since thedividends were factored into the grant date fair value of the original grant.
3At December 31, 2020, the number of shares included 707,293 performance-based units at their target amounts. We expect 1,658,308 units tovest based upon our current estimates of the likelihood of achieving the pre-determined performance goals applicable to each award.
4At December 31, 2020, the total unrecognized compensation cost related to unvested equity awards was $102.1 million, which includesperformance-based awards at their currently estimated vesting value. This compensation expense will be recognized into the consolidatedstatements of comprehensive income over the weighted average vesting period of 2.3 years.
The aggregate fair value of the restricted equity awardsthat vested during the years ended December 31, 2020,2019, and 2018, was $148.9 million, $191.6 million, and$162.7 million, respectively, based on the actual stockprice on the applicable vesting date.
Incentive Compensation Plans – Directors
Progressive’s 2017 Directors Equity Incentive Plan,which provides for the granting of equity-based awards,including restricted stock awards, to non-employeedirectors, was approved by shareholders in 2017 andoriginally authorized awards for up to 0.5 million shares.
The Progressive Corporation permits eachnon-employee director to indicate a preference toreceive either 100% of their compensation in the form ofa restricted stock award or 60% in the form of arestricted stock award and 40% in the form of cash. If
the director does not state a preference, it is presumedthat he or she preferred to receive 100% of theircompensation in the form of restricted stock. Afterconsidering such preferences, the CompensationCommittee of the Board of Directors determines theawards (restricted stock, or restricted stock and cash)for each non-employee director.
The restricted stock awards are issued as time-basedawards. The vesting period (i.e., requisite serviceperiod) is typically 11 months from the date of eachgrant. To the extent a director is newly appointed duringthe year, or a director’s committee assignments change,the vesting period may be shorter. Both the restrictedstock awards and cash, if elected, are expensed prorata over their respective vesting periods based on themarket value of the awards at the time of grant.
A summary of all directors’ restricted stock activity during the years ended December 31, follows:
2020 2019 2018
Restricted StockNumber of
Shares
WeightedAverage
GrantDate Fair
ValueNumber of
Shares
WeightedAverage
GrantDate Fair
ValueNumber of
Shares
WeightedAverage
GrantDate Fair
Value
Beginning of year 38,451 $ 73.43 41,706 $ 62.23 53,284 $ 40.54
Add (deduct):
Granted 39,403 74.77 38,451 73.43 41,706 62.23
Vested (38,451) 73.43 (41,706) 62.23 (53,284) 40.54
End of year1 39,403 $ 74.77 38,451 $ 73.43 41,706 $ 62.23
1At December 31, 2020, 2019, and 2018, the remaining unrecognized compensation cost related to restricted stock awards was $0.9 million,$0.8 million, and $0.9 million, respectively.
App.-A-37

The aggregate fair value of the restricted stock vested during the years ended December 31, 2020, 2019, and 2018,was $3.0 million, $3.0 million, and $3.2 million, respectively, based on the actual stock price at time of vesting.
Deferred Compensation The Progressive CorporationExecutive Deferred Compensation Plan (Deferral Plan)permits eligible Progressive executives to defer receiptof some or all of their annual incentive payments and allof their annual equity awards. Deferred cashcompensation is deemed invested in one or moreinvestment funds, including Progressive commonshares, offered under the Deferral Plan and elected bythe participant. All Deferral Plan distributions attributableto deferred cash compensation will be paid in cash.
For all equity awards granted in or after March 2005,and deferred pursuant to the Deferral Plan, the deferredamounts are deemed invested in our common sharesand are ineligible for transfer to other investment fundsin the Deferral Plan; distributions of these deferredawards will be made in Progressive common shares.For all restricted stock awards granted prior to that date,the deferred amounts are eligible to be transferred to
any of the investment funds in the Deferral Plan;distributions of these deferred awards will be made incash. We reserved 11.1 million of our common sharesfor issuance under the Deferral Plan.
An irrevocable grantor trust has been established toprovide a source of funds to assist us in meeting ourliabilities under the Deferral Plan. The Deferral PlanIrrevocable Grantor Trust account held the followingassets at December 31:
(millions) 2020 2019
Progressive common shares1 $ 134.2 $ 121.6
Other investment funds2 167.2 151.2
Total $ 301.4 $ 272.81Included 2.8 million and 3.2 million common shares as ofDecember 31, 2020 and 2019, respectively, to be distributed incommon shares, and are reported at grant date fair value.
2Amount is included in other assets on the consolidated balance sheets.
10. SEGMENT INFORMATION
We write personal and commercial auto insurance,personal residential and commercial property insurance,general liability insurance, and other specialty property-casualty insurance and related services. Our PersonalLines segment writes insurance for personal autos andrecreational vehicles (our special lines products). ThePersonal Lines segment is comprised of both the Agencyand Direct businesses. The Agency business includesbusiness written by our network of more than 40,000independent insurance agencies, including brokerages inNew York and California, and strategic alliance businessrelationships (including other insurance companies,financial institutions, and national agencies). The Directbusiness includes business written directly by us online,by phone, or on mobile devices. We operate ourPersonal Lines businesses throughout the United States.
Our Commercial Lines segment writes auto-relatedprimary liability and physical damage insurance, andgeneral liability and property insurance, predominately forsmall businesses. This segment operates throughout theUnited States and is distributed through both theindependent agency and direct channels.
Our Property segment writes residential property insurancefor homeowners, other property owners, and rentersthrough both the independent agency and direct channel,and writes flood insurance through the “Write Your Own”program for the National Flood Insurance Program, throughthe agency channel. Our Property segment operatesthroughout the majority of the United States.
Our service businesses provide insurance-relatedservices, including processing CAIP business andserving as an agent for homeowners, general liability,and workers’ compensation insurance, among otherproducts, through programs in our direct Personal Linesand Commercial Lines businesses.
We evaluate profitability based on pretax underwritingprofit (loss) for the Personal Lines, Commercial Lines,and Property segments. Pretax underwriting profit (loss)is calculated as net premiums earned plus fees andother revenues, less: (i) losses and loss adjustmentexpenses; (ii) policy acquisition costs; and (iii) otherunderwriting expenses. Service business pretax profit(loss) is the difference between service businessrevenues and service business expenses.
Assets and income taxes are not allocated to operatingsegments, as such allocation would be impractical.Expense allocations are based on certain assumptionsand estimates primarily related to revenue and volume;stated segment operating results would change ifdifferent methods were applied. We do not separatelyidentify depreciation expense by segment.Companywide depreciation expense was $274.9 millionin 2020, $239.8 million in 2019, and $190.4 million in2018. The accounting policies of the operatingsegments are the same as those described in Note 1 –Reporting and Accounting Policies.
App.-A-38

Following are the operating results for the years ended December 31:
2020 2019 2018
(millions) Revenues
PretaxProfit
(Loss) Revenues
PretaxProfit
(Loss) Revenues
PretaxProfit
(Loss)
Personal Lines
Agency $ 15,789.5 $ 2,236.5 $ 14,904.1 $ 1,673.2 $ 13,017.2 $ 1,435.7
Direct 16,830.6 2,076.5 15,305.9 1,181.4 13,017.5 1,088.5
Total Personal Lines1 32,620.1 4,313.0 30,210.0 2,854.6 26,034.7 2,524.2
Commercial Lines 4,875.8 634.8 4,427.6 458.8 3,610.9 478.6
Property2 1,765.7 (125.1) 1,554.8 (26.1) 1,287.7 (88.7)
Other indemnity 0 0 0 0 0 0.9
Total underwriting operations 39,261.6 4,822.7 36,192.4 3,287.3 30,933.3 2,915.0
Fees and other revenues3 603.5 NA 563.7 NA 472.2 NA
Service businesses 226.4 20.9 195.0 16.1 158.5 24.4
Investments4 2,566.6 2,546.6 2,071.2 2,046.6 415.0 390.7
Interest expense NA (217.0) NA (189.7) NA (166.5)
Consolidated total $ 42,658.1 $ 7,173.2 $ 39,022.3 $ 5,160.3 $ 31,979.0 $ 3,163.6
NA = Not applicable1Personal auto insurance accounted for 94% of the total Personal Lines segment net premiums earned in 2020, 2019, and 2018; insurance for ourspecial lines products (e.g., motorcycles, ATVs, RVs, watercraft, and snowmobiles) accounted for the balance of the Personal Lines net premiumsearned.
2During 2020, 2019, and 2018, pretax profit (loss) includes $56.9 million, $66.3 million, and $72.0 million, respectively, of amortization expensepredominately associated with intangible assets. See Note 16 - Goodwill and Intangible Assets for further discussion.
3Pretax profit (loss) for fees and other revenues is allocated to operating segments.4Revenues represent recurring investment income and total net realized gains (losses) on securities; pretax profit is net of investment expenses.
Our management uses underwriting margin and combined ratio as primary measures of underwriting profitability, asdefined above. The underwriting margin is the pretax underwriting profit (loss) expressed as a percentage of netpremiums earned (i.e., revenues from underwriting operations). Combined ratio is the complement of the underwritingmargin. Following are the underwriting margins and combined ratios for our underwriting operations for the yearsended December 31:
2020 2019 2018
UnderwritingMargin
CombinedRatio
UnderwritingMargin
CombinedRatio
UnderwritingMargin
CombinedRatio
Personal Lines
Agency 14.2% 85.8 11.2% 88.8 11.0% 89.0
Direct 12.3 87.7 7.7 92.3 8.4 91.6
Total Personal Lines 13.2 86.8 9.5 90.5 9.7 90.3
Commercial Lines 13.0 87.0 10.4 89.6 13.3 86.7
Property1 (7.1) 107.1 (1.7) 101.7 (6.9) 106.9
Total underwriting operations 12.3 87.7 9.1 90.9 9.4 90.61Included in 2020, 2019, and 2018, are 3.2 points, 4.3 points, and 5.6 points, respectively, of amortization expense predominately associated withthe acquisition of a controlling interest in ARX.
App.-A-39

11. OTHER COMPREHENSIVE INCOME (LOSS)
The components of other comprehensive income (loss), including reclassification adjustments by income statementline item, for the years ended December 31, were as follows:
Components of Changes inAccumulated Other
Comprehensive Income (after tax)
(millions)
Pretax totalaccumulated
othercomprehensive
income (loss)
Total tax(provision)
benefit
After tax totalaccumulated
othercomprehensive
income (loss)
Total netunrealized
gains(losses)
on securities
Net unrealizedgains (losses)
onforecasted
transactions
(Income)loss
attributableto NCI
Balance at December 31, 2019 $ 435.7 $ (94.0) $ 341.7 $ 360.8 $ (16.4) $ (2.7)
Reclassification of disproportionateamounts1 3.4 (0.7) 2.7 0 0 2.7
Adjusted balance at December 31, 2019 439.1 (94.7) 344.4 360.8 (16.4) 0
Other comprehensive income (loss) beforereclassifications:
Investment securities 1,557.2 (306.1) 1,251.1 1,251.1 0 0
Loss attributable to noncontrollinginterest (NCI) 0 0 0 0 0 0
Total other comprehensive income (loss)before reclassifications 1,557.2 (306.1) 1,251.1 1,251.1 0 0
Less: Reclassification adjustment foramounts realized in net income byincome statement line item:
Net realized gains (losses) onsecurities 810.0 (145.4) 664.6 664.6 0 0
Interest expense (1.1) 0.3 (0.8) 0 (0.8) 0
Total reclassification adjustment foramounts realized in net income 808.9 (145.1) 663.8 664.6 (0.8) 0
Total other comprehensive income (loss) 748.3 (161.0) 587.3 586.5 0.8 0
Balance at December 31, 2020 $ 1,187.4 $ (255.7) $ 931.7 $ 947.3 $ (15.6) $ 0
1Adjustment to reflect the change in value on (income) loss attributable to NCI in conjunction with the purchase transaction (See Note 15 -Redeemable Noncontrolling Interest for additional information).
Components of Changes inAccumulated Other
Comprehensive Income (after tax)
(millions)
Pretax totalaccumulated
othercomprehensive
income (loss)
Total tax(provision)
benefit
After tax totalaccumulated
othercomprehensive
income (loss)
Total netunrealized
gains(losses)
on securities
Net unrealizedgains (losses)
onforecasted
transactions
(Income)loss
attributableto NCI
Balance at December 31, 2018 $ (153.0) $ 32.1 $ (120.9) $ (105.6) $ (17.2) $ 1.9
Other comprehensive income (loss) beforereclassifications:
Investment securities 825.8 (174.9) 650.9 650.9 0 0
Loss attributable to noncontrollinginterest (NCI) (5.9) 1.3 (4.6) 0 0 (4.6)
Total other comprehensive income (loss)before reclassifications 819.9 (173.6) 646.3 650.9 0 (4.6)
Less: Reclassification adjustment foramounts realized in net income by incomestatement line item:
Net realized gains (losses) on securities 232.2 (47.7) 184.5 184.5 0 0
Interest expense (1.0) 0.2 (0.8) 0 (0.8) 0
Total reclassification adjustment foramounts realized in net income 231.2 (47.5) 183.7 184.5 (0.8) 0
Total other comprehensive income (loss) 588.7 (126.1) 462.6 466.4 0.8 (4.6)
Balance at December 31, 2019 $ 435.7 $ (94.0) $ 341.7 $ 360.8 $ (16.4) $ (2.7)
App.-A-40

Components of Changes inAccumulated Other
Comprehensive Income (after tax)
(millions)
Pretax totalaccumulated
othercomprehensive
income (loss)
Total tax(provision)
benefit
After tax totalaccumulated
othercomprehensive
income (loss)
Total netunrealized
gains(losses)
on securities
Net unrealizedgains (losses)
onforecasted
transactions
(Income)loss
attributableto NCI
Balance at December 31, 2017 $ 1,977.8 $ (695.6) $ 1,282.2 $ 1,295.0 $ (14.8) $ 2.0
Cumulative effect adjustment1 (2,006.0) 705.8 (1,300.2) (1,300.2) 0 0
Reclassification of disproportionate amounts2 (4.3) (3.4) (7.7) (1.1) (3.2) (3.4)
Adjusted balance at December 31, 2017 (32.5) 6.8 (25.7) (6.3) (18.0) (1.4)
Other comprehensive income (loss) beforereclassifications:
Investment securities (224.1) 47.0 (177.1) (177.1) 0 0
Loss attributable to noncontrolling interest(NCI) 4.3 (1.0) 3.3 0 0 3.3
Total other comprehensive income (loss)before reclassifications (219.8) 46.0 (173.8) (177.1) 0 3.3
Less: Reclassification adjustment for amountsrealized in net income by income statement lineitem:
Net realized gains (losses) on securities (98.3) 20.5 (77.8) (77.8) 0 0
Interest expense (1.0) 0.2 (0.8) 0 (0.8) 0
Total reclassification adjustment for amountsrealized in net income (99.3) 20.7 (78.6) (77.8) (0.8) 0
Total other comprehensive income (loss) (120.5) 25.3 (95.2) (99.3) 0.8 3.3
Total at December 31, 2018 $ (153.0) $ 32.1 $ (120.9) $ (105.6) $ (17.2) $ 1.9
1Reflects the fair value changes on equity securities as of December 31, 2017, which are reported as realized gains (losses) under the newaccounting guidance. See Note 1 - Reporting and Accounting Policies for additional information.
2Reflects the effect of the change in U.S. federal tax rate on our available-for-sale fixed-maturity securities and our hedges on forecastedtransactions as of December 31, 2017 (see Note 1 - Reporting and Accounting Policies for additional information) and the adjustment to reflect thechange in value on (income) loss attributable to NCI in conjunction with the “put” transaction (see Note 15 - Redeemable Noncontrolling Interest foradditional information).
In an effort to manage interest rate risk, we may enter into forecasted transactions on Progressive’s debt issuances.We expect to reclassify $0.9 million (pretax) into interest expense during the next 12 months, related to net unrealizedlosses on forecasted transactions (see Note 4 – Debt for further discussion).
12. LITIGATION
The Progressive Corporation and/or its insurancesubsidiaries are named as defendants in variouslawsuits arising out of claims made under insurancepolicies written by our insurance subsidiaries in theordinary course of business. We consider all legalactions relating to such claims in establishing our lossand loss adjustment expense reserves.
In addition, The Progressive Corporation and/or itssubsidiaries are named as defendants in a number ofclass action or individual lawsuits that challenge certainof the operations of the subsidiaries. Other insurancecompanies face many of these same issues.
We describe litigation contingencies for which a loss isprobable. In addition, we establish accruals for theselawsuits when we can reasonably estimate potentialloss exposure, which may include a range of loss, andwe will disclose such amount or range of loss if material.
As to lawsuits for which the loss is considered probablebut not estimable, we do not establish an accrual.Nevertheless, we continue to evaluate this pendinglitigation to determine if any losses not deemedprobable and estimable become so, at which point wewould establish an accrual at our best estimate of theloss or range of loss.
We also describe litigation contingencies for which aloss is reasonably possible (but not probable). Whendisclosing reasonably possible litigation contingencies,we will disclose the amount or range of possible loss, ifwe are able to make that determination and if material.We review all reasonably possible losses on an ongoingbasis to determine whether the likelihood of incurring aloss has become probable, or whether thecircumstances have changed such that we may nowreasonably estimate a range of loss.
App.-A-41

We may also be exposed to litigation contingencies thatare remote. Remote litigation contingencies are thosefor which the likelihood of a loss is slight at period end.We do not disclose, or establish accruals for, remotelitigation contingencies, but we evaluate thesecontingencies on an ongoing basis to determinewhether the likelihood of a loss has increased.
Each year, certain of our pending litigation matters arebrought to conclusion. For cases that have settled, butfor which settlement is not complete, an accrual isestablished at our best estimate of the loss exposure.We regularly review these and other accruals to ensurethey are adequate.
Settlements that are complete are fully reflected in ourfinancial statements. The amounts accrued and/or paidfor settlements during the periods presented were notmaterial to our consolidated financial condition, cashflows, or results of operations.
The pending lawsuits summarized below are in variousstages of development, and the outcomes are uncertainor, if probable and estimable, are accrued andimmaterial as of December 31, 2020. At period end,except to the extent an immaterial accrual has beenestablished, we do not consider the losses from thesepending cases to be both probable and estimable, andwe are unable to estimate a range of loss at this time. It
is not possible to determine loss exposure for a numberof reasons, including, without limitation, one or more ofthe following: liability appears to be remote; putativeclass action lawsuits generally pose immaterialexposure until a class is actually certified, which,historically, has not been granted by courts in the vastmajority of our cases in which class certification hasbeen sought; even certified class action lawsuits aresubject to decertification, denial of liability and/orappeal; class definitions are often indefinite andpreclude detailed exposure analysis; and complaintsrarely state an amount sought as relief, and when suchamount is stated, it often is a function of pleadingrequirements and may be unrelated to the potentialexposure.
We plan to contest these suits vigorously, but maypursue settlement negotiations in some cases, as wedeem appropriate. In the event that any one or more ofthese cases results in a substantial judgment againstus, or settlement by us, or if our accruals (if any) proveto be inadequate, the resulting liability could have amaterial adverse effect on our consolidated financialcondition, cash flows, and/or results of operations.Based on information currently known, we do notbelieve that the outcome of any pending casesdescribed below will have a material impact on ourconsolidated financial condition, cash flows, and/orresults of operations.
At December 31, 2020, pending lawsuits as described above that challenge certain of the operations of oursubsidiaries included:
Lawsuits seeking class/collective action status:• alleging we sell or charge insureds for illusory coverage or coverage lower than amounts allowed by law for
PIP coverage and pay related claims at levels lower than allowed by law.• challenging how physical damage claims are handled, adjusted, and ultimately paid, including how we value
total loss claims, the payment of fees and taxes associated with total losses, and the payment of diminutiondamages.
• challenging our practices in Florida of adjusting PIP claims.• challenging our use of used original equipment manufacturer parts in the repair of a leased vehicle.• challenging our adjustment of medical bills submitted by insureds or medical providers in medical claims.• challenging our payment and reimbursement practices to Medicare Advantage Plans on first party medical,
PIP, and bodily injury claims.• challenging our acceptance of uninsured motorist rejection.• alleging we sell illusory underinsured motorist coverage.• alleging we wrongfully withheld payments owed to insureds under uninsured/underinsured motorist
coverage.• alleging that we wrongly pursue subrogation of medical payments paid directly to providers and not to
insureds.• alleging that we must pay an insured the pre-loss actual cash value of a totaled vehicle in addition to the
value of the salvage vehicle if we take ownership of the salvage vehicle.• alleging that we improperly calculate basic economic loss as it relates to wage loss coverage.• alleging that we violated the Telephone Consumer Protection Act.
App.-A-42

• alleging that we provided an insufficient amount of premium relief to Illinois insureds in response to theCOVID-19 pandemic.
• challenging certain of our pay practices and overtime payment practices.• alleging that we fail to pay overtime to certain employees who we classify as exempt from overtime pay
requirements.
Lawsuits certified or conditionally certified as class/collective actions:• alleging we improperly sell secondary PIP coverage to Medicare and Medicaid beneficiaries in New Jersey.• challenging how we value total loss claims in Florida and Louisiana.• challenging the payment of fees and taxes associated with total losses in Florida.
13. LEASES
Included in our consolidated balance sheets are certainoperating leases for office space, computer equipment,and vehicles that are reported as a component of otherassets and accounts payable, accrued expenses, andother liabilities.
The leased assets represent our right to use anunderlying asset for the lease term and the leaseliabilities represent our obligation to make leasepayments arising from the lease. An incrementalborrowing rate is used to calculate the present value ofthe remaining lease payments.
Each contract is reviewed at inception to determine if itcontains a lease and whether the lease qualifies as anoperating or financing lease. We do not have materialfinancing leases.
Operating leases are expensed on a straight-line basisover the term of the lease. In determining the leaseterm, we consider the probability of exercising renewaloptions. We elected to account for leases with bothlease and non-lease components as a single leasecomponent and to apply a portfolio approach to accountfor our vehicle leases.
The following table summarizes the carrying amounts ofour operating leased assets and liabilities atDecember 31, along with key inputs used to discountour lease liabilities:
(millions) 2020 2019
Operating lease assets $ 165.5 $ 188.2
Operating lease liabilities $ 179.0 $ 201.5
Weighted-average remainingterm 3.0 years 3.3 years
Weighted-average discountrate 2.5% 3.0%
At December 31, 2020, the following table shows ouroperating lease liabilities, on an undiscounted basis forthe periods indicated:
(millions) Commitments
2021 $ 78.9
2022 48.7
2023 29.1
2024 18.4
2025 9.8
Thereafter 0.5
Total 185.4
Interest (6.4)
Present value of lease liabilities $ 179.0
The operating lease expense for the years endedDecember 31, was as follows:
(millions) Expense
2020 $ 95.4
2019 102.0
2018 77.3
App.-A-43

14. DIVIDENDS
Following is a summary of our common and preferred share dividends that were declared and/or paid in the last threeyears:
(millions, except per share amounts) Amount
Declared Payable Per Share Accrued1
Common - Annual Variable Dividends:
December 2020 January 2021 $ 4.50 $ 2,635.9
December 2019 January 2020 2.25 1,316.9
December 2018 February 2019 2.5140 1,467.9
December 2017 February 2018 1.1247 655.1
Common - Quarterly Dividends:
December 2020 January 2021 0.10 58.6
August 2020 October 2020 0.10 58.6
May 2020 July 2020 0.10 58.5
February 2020 April 2020 0.10 58.5
December 2019 January 2020 0.10 58.5
August 2019 October 2019 0.10 58.5
May 2019 July 2019 0.10 58.4
February 2019 April 2019 0.10 58.4
Preferred Dividends:
December 2020 March 2021 26.875 13.4
August 2020 September 2020 26.875 13.4
February 2020 March 2020 26.875 13.4
August 2019 September 2019 26.875 13.4
February 2019 March 2019 26.875 13.4
August 2018 September 2018 27.024 13.5
1The accrual is based on an estimate of shares outstanding as of the record date and the common share accrual is recorded as “dividends payableon common shares” on the Consolidated Balance Sheets; the prior year common share amount was reclassified into this line item from “accountspayable, accrued expenses, and other liabilities” to conform to the current year presentation.
Common Share DividendsThe Board of Directors adopted a policy of declaringregular quarterly common share dividends, and on atleast an annual basis, to consider declaring anadditional common share dividend, which was effectivebeginning in 2019.
Prior to 2019, we maintained a policy of paying anannual variable dividend. Under the policy, the dividendwas based on a target percentage of 33-1/3%, asdetermined by the Board, of after-tax underwritingincome multiplied by a performance factor (Gainsharefactor). The Gainshare factor was 1.91 and 1.79 for thedividends declared in 2018 and 2017, respectively.
Preferred Share DividendsIn March 2018, we issued 500,000 Series BFixed-to-Floating Rate Cumulative Perpetual SerialPreferred Shares, without par value (the “Series BPreferred Shares”), with a liquidation preference of$1,000 per share (the “stated amount”). Holders of theSeries B Preferred Shares are entitled to receivecumulative cash dividends semi-annually in March andSeptember, if and when declared by the Board ofDirectors. Until March 15, 2023 (the “fixed-rate period”),the annual dividend rate is fixed at 5.375% of the statedamount per share. Beginning March 15, 2023, theannual dividend rate switches to a floating rate equal tothe three-month London Interbank Offered Rate(LIBOR) (or comparable successor base rate) plus a
App.-A-44

spread of 2.539% applied to the stated amount pershare. After the fixed-rate period and up untilredemption of the Series B Preferred Shares, thedividends would be payable quarterly, if and whendeclared by the Board of Directors. The Series B
Preferred Shares are perpetual and have no statedmaturity date. After the fixed-rate period, we mayredeem the Series B Preferred Shares at the statedamount plus all accrued and unpaid dividends.
15. REDEEMABLE NONCONTROLLING INTEREST
In connection with the April 2015 acquisition of acontrolling interest in ARX, The Progressive Corporationentered into a stockholders’ agreement with the otherARX stockholders. During 2018, minority ARXstockholders put 204,527 shares, including 5,483shares that were issued upon the exercise ofoutstanding stock options. Progressive acquired theseadditional shares, in a cash transaction, for a total costof $295.9 million. On April 1, 2020, Progressivepurchased all remaining outstanding stock, includingshares from exercised stock options, of ARX under aseparately negotiated purchase agreement at a totalcost of $243.0 million.
Since these securities were redeemable upon theoccurrence of an event that was not solely within thecontrol of Progressive, we recorded the redeemablenoncontrolling interest (NCI) as mezzanine equity onour consolidated balance sheets, representing theminority shares at the current estimated purchase pricepursuant to the put and call provisions of thestockholders’ agreement.
The changes in the components of redeemable NCIduring the years ended December 31, were:
(millions) 2020 2019 2018
Balance, beginning ofyear $ 225.6 $214.5 $ 503.7
Net income attributable toNCI 0 9.7 5.7
Other comprehensiveincome (loss) attributableto NCI1 0 4.6 (3.3)
Exercise of stock options 16.0 7.7 9.4
Purchase/change of ARXminority shares (241.6) (11.2) (298.2)
Change in redemptionvalue 0 0.3 (2.8)
Balance, end of year $ 0 $225.6 $ 214.5
1 Amount represents the other comprehensive income (loss)attributable to NCI, as reflected on the consolidated statements ofcomprehensive income; changes in accumulated othercomprehensive income (loss) attributable to NCI due to a change inthe minority ownership percentage does not impact the amount ofredeemable NCI.
16. GOODWILL AND INTANGIBLE ASSETS
Goodwill
Goodwill recorded at December 31, 2020, and 2019, was $452.7 million. The majority of the goodwill recorded as ofDecember 31, 2020 and 2019, relates to the April 1, 2015, acquisition of a controlling interest in ARX. No impairmentlosses have been recorded on any of the outstanding goodwill.
Intangible Assets
The following table is a summary of the net carrying amount of other intangible assets as of December 31:
(millions) 2020 2019
Intangible assets subject to amortization $159.0 $215.9
Indefinite-lived intangible assets1 12.4 12.4
Total $171.4 $228.31Indefinite-lived intangible assets are comprised of state insurance and agent licenses. State insurance licenses were previously subject toamortization under superseded accounting guidance and have $0.6 million of accumulated amortization for both years presented.
App.-A-45

Intangible assets subject to amortization for the years ended December 31, consisted of the following:
(millions) 2020 2019
Category
GrossCarryingAmount
AccumulatedAmortization
Net CarryingAmount
GrossCarryingAmount
AccumulatedAmortization
Net CarryingAmount
Policies in force $ 256.2 $ 210.4 $ 45.8 $ 256.2 $ 173.9 $ 82.3
Agency relationships 159.2 65.4 93.8 159.2 54.0 105.2
Software rights 69.1 49.7 19.4 79.1 50.7 28.4
Trade name 0 0 0 34.8 34.8 0
Total $ 484.5 $ 325.5 $ 159.0 $ 529.3 $ 313.4 $ 215.9
Amortization expense was $56.9 million, $66.3 million, and $72.0 million for the years ended December 31, 2020,2019, and 2018, respectively. During 2020, one software rights intangible asset, with a gross carrying value of$10.0 million, was fully amortized.
The estimated aggregate amortization on these intangible assets for each of the next five years as of December 31,2020, follows:
(millions)
YearAmortization
Expense
2021 $ 56.6
2022 29.2
2023 13.5
2024 11.4
2025 11.4
17. SUBSEQUENT EVENT
On February 16, 2021, we announced that we have entered into a definitive agreement with Protective InsuranceCorporation (“Protective”) to acquire all of Protective’s outstanding Class A and Class B common shares for $23.30per share in cash, or approximately $338 million in aggregate. This transaction is expected to close prior to the end ofthe third quarter 2021, subject to customary closing conditions, including the receipt of certain required regulatoryapprovals and approval of Protective’s Class A shareholders.
App.-A-46

Report of Independent Registered Public Accounting Firm
To the Board of Directors and Shareholders of The Progressive Corporation
Opinions on the Financial Statements and Internal Control over Financial Reporting
We have audited the accompanying consolidated balance sheets of The Progressive Corporation and its subsidiaries(the “Company”) as of December 31, 2020 and 2019, and the related consolidated statements of comprehensiveincome, of changes in shareholders’ equity and of cash flows for each of the three years in the period endedDecember 31, 2020, including the related notes (collectively referred to as the “consolidated financial statements”).We also have audited the Company’s internal control over financial reporting as of December 31, 2020, based oncriteria established in Internal Control - Integrated Framework (2013) issued by the Committee of SponsoringOrganizations of the Treadway Commission (COSO).
In our opinion, the consolidated financial statements referred to above present fairly, in all material respects, thefinancial position of the Company as of December 31, 2020 and 2019, and the results of its operations and its cashflows for each of the three years in the period ended December 31, 2020 in conformity with accounting principlesgenerally accepted in the United States of America. Also in our opinion, the Company maintained, in all materialrespects, effective internal control over financial reporting as of December 31, 2020, based on criteria established inInternal Control - Integrated Framework (2013) issued by the COSO.
Basis for Opinions
The Company’s management is responsible for these consolidated financial statements, for maintaining effectiveinternal control over financial reporting, and for its assessment of the effectiveness of internal control over financialreporting, included in the accompanying Management’s Report on Internal Control over Financial Reporting. Ourresponsibility is to express opinions on the Company’s consolidated financial statements and on the Company’sinternal control over financial reporting based on our audits. We are a public accounting firm registered with the PublicCompany Accounting Oversight Board (United States) (PCAOB) and are required to be independent with respect tothe Company in accordance with the U.S. federal securities laws and the applicable rules and regulations of theSecurities and Exchange Commission and the PCAOB.
We conducted our audits in accordance with the standards of the PCAOB. Those standards require that we plan andperform the audits to obtain reasonable assurance about whether the consolidated financial statements are free ofmaterial misstatement, whether due to error or fraud, and whether effective internal control over financial reportingwas maintained in all material respects.
Our audits of the consolidated financial statements included performing procedures to assess the risks of materialmisstatement of the consolidated financial statements, whether due to error or fraud, and performing procedures thatrespond to those risks. Such procedures included examining, on a test basis, evidence regarding the amounts anddisclosures in the consolidated financial statements. Our audits also included evaluating the accounting principlesused and significant estimates made by management, as well as evaluating the overall presentation of theconsolidated financial statements. Our audit of internal control over financial reporting included obtaining anunderstanding of internal control over financial reporting, assessing the risk that a material weakness exists, andtesting and evaluating the design and operating effectiveness of internal control based on the assessed risk. Ouraudits also included performing such other procedures as we considered necessary in the circumstances. We believethat our audits provide a reasonable basis for our opinions.
Definition and Limitations of Internal Control over Financial Reporting
A company’s internal control over financial reporting is a process designed to provide reasonable assurance regardingthe reliability of financial reporting and the preparation of financial statements for external purposes in accordancewith generally accepted accounting principles. A company’s internal control over financial reporting includes thosepolicies and procedures that (i) pertain to the maintenance of records that, in reasonable detail, accurately and fairlyreflect the transactions and dispositions of the assets of the company; (ii) provide reasonable assurance thattransactions are recorded as necessary to permit preparation of financial statements in accordance with generally
App.-A-47

accepted accounting principles, and that receipts and expenditures of the company are being made only inaccordance with authorizations of management and directors of the company; and (iii) provide reasonable assuranceregarding prevention or timely detection of unauthorized acquisition, use, or disposition of the company’s assets thatcould have a material effect on the financial statements.
Because of its inherent limitations, internal control over financial reporting may not prevent or detect misstatements. Also,projections of any evaluation of effectiveness to future periods are subject to the risk that controls may become inadequatebecause of changes in conditions, or that the degree of compliance with the policies or procedures may deteriorate.
Critical Audit Matters
The critical audit matter communicated below is a matter arising from the current period audit of the consolidatedfinancial statements that was communicated or required to be communicated to the audit committee and that(i) relates to accounts or disclosures that are material to the consolidated financial statements and (ii) involved ourespecially challenging, subjective, or complex judgments. The communication of critical audit matters does not alter inany way our opinion on the consolidated financial statements, taken as a whole, and we are not, by communicatingthe critical audit matter below, providing a separate opinion on the critical audit matter or on the accounts ordisclosures to which it relates.
Valuation of Loss and Loss Adjustment Expense Reserves
As described in Notes 1 and 6 to the consolidated financial statements, as of December 31, 2020, the Company reporteda $20.3 billion loss and loss adjustment expense (“LAE”) reserve liability of which 94% relate to Personal and CommercialLines vehicle businesses. Reserves are based on estimates of ultimate liability for losses and LAE relating to events thatoccurred prior to the end of any given accounting period but have not yet been paid. Management establishes loss andLAE reserves after completing reviews at a disaggregated level of grouping. During a reserve review, ultimate lossamounts are estimated using several industry standard actuarial projection methods. These methods take into accounthistorical comparable loss data at the subset level and estimate the impact of various loss development factors, such asthe frequency (number of losses per earned car year), severity (dollars of loss per each claim), and average premium(dollars of premium per earned car year), as well as the frequency and severity of LAE costs.
The principal considerations for our determination that performing procedures relating to the valuation of loss and LAEreserves is a critical audit matter are (i) the significant judgment by management when developing their estimate ofloss and LAE reserves, which in turn led to a significant degree of auditor judgment and subjectivity in performingprocedures relating to the valuation; (ii) the significant audit effort and judgment in evaluating audit evidence relatingto the various actuarial projection methods, historical comparable loss data and aforementioned loss developmentfactors; and (iii) the audit effort included the involvement of professionals with specialized skill and knowledge toassist in performing these procedures and evaluating the audit evidence obtained.
Addressing the matter involved performing procedures and evaluating audit evidence in connection with forming our overallopinion on the consolidated financial statements. These procedures included testing the effectiveness of controls relating tothe Company’s valuation of loss and LAE reserves, including controls over the various projection methods and developmentof the loss development factors. These procedures also included, among others, testing the completeness and accuracy ofhistorical data provided by management and the involvement of professionals with specialized skill and knowledge to assistin (i) independently estimating reserves for certain lines of businesses using actual historical comparable loss data,independently derived loss development factors, and industry data and comparing this independent estimate tomanagement’s actuarial determined reserves and (ii) evaluating the appropriateness of the actuarial methods andreasonableness of the loss development factors, related to the aforementioned frequency, severity, and average premium aswell as the frequency and severity of LAE costs, for determining the reserve balances for certain lines of businesses.
Cleveland, OhioMarch 1, 2021
We have served as the Company’s auditor since 1984.
App.-A-48

Management’s Report on Internal Control over Financial Reporting
Progressive’s management is responsible for establishing and maintaining adequate internal control over financialreporting, as such term is defined in Rule 13a-15(f) under the Securities Exchange Act of 1934. Our internal controlstructure was designed under the supervision of our Chief Executive Officer and Chief Financial Officer to providereasonable assurance regarding the reliability of financial reporting and the preparation of financial statements forexternal purposes in accordance with accounting principles generally accepted in the United States of America.
Our internal control over financial reporting includes policies and procedures that pertain to the maintenance ofrecords that, in reasonable detail, accurately and fairly reflect our transactions and dispositions of assets; providereasonable assurance that transactions are recorded as necessary to permit preparation of financial statements inaccordance with generally accepted accounting principles, and that our receipts and expenditures are being madeonly in accordance with authorizations of our management and our directors; and provide reasonable assuranceregarding prevention or timely detection of unauthorized acquisition, use, or disposition of our assets that could havea material effect on our financial statements.
Under the supervision and with the participation of our management, including our Chief Executive Officer and ChiefFinancial Officer, we conducted an evaluation of the effectiveness of our internal control over financial reporting basedon the framework in Internal Control – Integrated Framework (2013) issued by the Committee of SponsoringOrganizations of the Treadway Commission (COSO). Based on our evaluation under the framework in InternalControl – Integrated Framework (2013), management concluded that our internal control over financial reporting waseffective as of December 31, 2020.
PricewaterhouseCoopers LLP, an independent registered public accounting firm that audited the financial statementsincluded in this Annual Report, has audited, and issued an attestation report on the effectiveness of, our internalcontrol over financial reporting as of December 31, 2020; such report appears herein.
CEO and CFO Certifications
Susan Patricia Griffith, President and Chief Executive Officer of The Progressive Corporation, and John P. Sauerland,Vice President and Chief Financial Officer of The Progressive Corporation, have issued the certifications required bySections 302 and 906 of The Sarbanes-Oxley Act of 2002 and applicable SEC regulations with respect toProgressive’s 2020 Annual Report on Form 10-K, including the financial statements provided in this Report. Amongother matters required to be included in those certifications, Mrs. Griffith and Mr. Sauerland have each certified that,to the best of their knowledge, the financial statements, and other financial information included in the Annual Reporton Form 10-K, fairly present in all material respects the financial condition, results of operations, and cash flows ofProgressive as of, and for, the periods presented. See Exhibits 31 and 32 to Progressive’s Annual Report on Form10-K for the complete Sections 302 and 906 certifications, respectively.
App.-A-49

The Progressive Corporation and SubsidiariesManagement’s Discussion and Analysis of Financial Condition and Results of Operations
Management’s Discussion and Analysis of Financial Condition and Results of Operations (“MD&A”) is intended tohelp the reader understand our financial condition and results of operations. MD&A should be read in conjunction withthe consolidated financial statements and the related notes, and supplemental information.
I. OVERVIEW
The Progressive insurance organization has beenoffering insurance to consumers since 1937. TheProgressive Corporation is a holding company that doesnot have any revenue producing operations, physicalproperty, or employees of its own. The ProgressiveCorporation, together with its insurance andnon-insurance subsidiaries and affiliates, comprise whatwe refer to as Progressive.
We report three operating segments. Our PersonalLines segment writes insurance for personal autos andrecreational vehicles (referred to as our special linesproducts). Our Commercial Lines segment writes auto-related primary liability and physical damage insurance,general liability insurance, and property insurance,predominately for small businesses. Lastly, our Propertysegment writes residential property insurance forhomeowners, other property owners, and renters. Weoperate throughout the United States through both theindependent agency and direct distribution channels.We are the third largest private passenger auto insurerin the country, the number one writer of commercialauto insurance, and one of the top 15 homeownersinsurance carriers, in each case, based on premiumswritten.
Our underwriting operations, combined with our serviceand investment operations, make up the consolidatedgroup.
A. Operating Results
During 2020, policies in force grew 11% over last yearand net premiums written grew 8% to end the year at$40.6 billion, $3.0 billion more premiums written than2019. From April through December, we filed personalauto rate changes that averaged a decrease ofapproximately 3% and continue to monitor our drivingand claims data to determine where additional actionsand rate adjustments may be appropriate. During 2020,we added 2.4 million policies bringing companywidepolicies in force to 24.7 million at December 31, 2020.
On a year-over-year basis, net income andcomprehensive income increased 44% and 42%,
respectively, driven by a 47% increase in underwritingincome and a 24% increase in net investment income,which includes recurring investment income (e.g.,dividends and interest) plus net realized gains onsecurities, less investment expenses.
The increased underwriting profitability primarilyreflected a decrease in the loss and loss adjustmentexpense ratio due to a 24% decrease in personal autoaccident frequency on a year-over-year basis.Beginning in March 2020, federal, state, and local socialdistancing and shelter-in-place restrictions were put inplace to stop or slow the spread of the novelcoronavirus COVID-19 (“COVID-19 restrictions”). As aresult of these restrictions, we started to experiencedriving patterns that differed from levels historicallyexperienced. The decrease in frequency was partiallyoffset by a 10% increase in personal auto severity andthe policyholder credits we provided to our autocustomers during the year. During 2020, we paid$1.1 billion, via credits to their policies or payments, toour personal auto policyholders to recognize thedecrease in loss costs we were experiencing, especiallyin the first few months of the pandemic, and to helpthem deal with the uncertainty of the pandemic.
Recurring investment income, including interest anddividends, decreased 10% on a year-over-year basis.The portfolio yield decreased from 3.1% for 2019 to2.4% for 2020 as we invested new cash at lowerinterest rates. The lower yield was partially offset by anincrease in average assets during the year, reflectingcash flow from operations and our issuance of $1 billionof debt securities in March 2020. In addition, netrealized gains on securities increased 58% over 2019,driven by sales in our fixed-income portfolio.
We ended 2020 with total capital (debt plusshareholders’ equity) of $22.4 billion, $4.3 billion morethan 2019. The year-over-year increase primarilyreflects our comprehensive income and the debtissuance, in part offset by our common and preferredshare dividends of $2.9 billion declared during the year.
App.-A-50

B. Insurance Operations
For 2020, our companywide underwriting profit marginwas 12.3%, compared to 9.1% in 2019. Our PersonalLines and Commercial Lines operating segments wereprofitable with underwriting margins of 13.2% and13.0%, respectively, while our Property segment had anunderwriting loss of 7.1% for the year, which included24.0 points of catastrophe losses and 3.2 points ofamortization expense on intangible assets.
Our overall incurred frequency in our personal autobusinesses decreased about 24%, while severityincreased about 10%, compared to the prior year.Vehicle accidents were significantly lower than the prioryear as vehicle miles driven were down during the year,especially during the early months of the pandemic, anddriving patterns have not returned to their historicallevels. We incurred unfavorable prior accident yeardevelopment in 2020 consistent with last year.
During the year, on a companywide basis, werecognized 2.2 loss ratio points related to catastrophelosses, compared to 1.5 points in 2019, primarily due tothe increase in our catastrophe losses in our Propertybusiness, which nearly doubled year over year. Propertybusiness catastrophe losses contributed 1.1 points toour overall loss ratio in 2020, compared to 0.6 pointslast year. The majority of the 2020 catastrophe losseswere due to hurricanes and wind, hail, and tornadosthroughout the United States.
On a year-over-year basis, net premiums written grewin each of our segments with Personal Lines growing7%, Commercial Lines 11%, and Property 13%.Changes in net premiums written are a function of newbusiness applications (i.e., policies sold), premium perpolicy, and retention. Policies in force grew 11%companywide, with Personal Lines, Commercial Lines,and Property growing 10%, 9%, and 13%, respectively.
During 2020, total new personal auto application growthwas flat on a year-over-year basis, with our Agencyauto decreasing 5% and Direct auto increasing 5%.Agency auto new applications are down compared tolast year, as COVID-19 restrictions significantlyimpacted agents and their ability to get their operationsback to pre-COVID levels. Our competitive productofferings, position in the marketplace, and our increasein advertising expense during 2020 resulted in anincrease in Direct auto new applications. We willcontinue to invest in advertising as long as we generatesales at a cost below the maximum amount we arewilling to spend to acquire a new customer. Wecontinued to generate new business application growth
in our bundled auto and home customers (i.e.,Robinsons) in both the Agency and Direct channels.
The increase in net premiums written in our CommercialLines business reflects growth in all of our businessmarket targets, but especially in our for-hiretransportation business market target, reflecting greaterdemand for shipping services in light of the pandemic.This growth was in part offset by a decrease in ourtransportation network company (TNC) business,reflecting a decrease in the miles driven, which is thebasis for determining premiums written for thisbusiness. For our commercial auto business, excludingTNC, new applications increased 5% for the year,driven by both increased quote volume and rate ofconversion. During 2020, while we increased rates, ourcommercial auto growth was driven by ourcompetitiveness in the marketplace.
Our Property business new applications increased 12%for the year, primarily reflecting the impact of targetedunderwriting changes made throughout 2019. We alsocontinue to expand our direct Property offerings throughHomeQuote Explorer®, which provides online quotingfor homeowners policies issued by us and unaffiliatedinsurance companies on a nationwide basis, andprovides some of these shoppers with the ability to alsobuy a policy online.
During 2020, on a year-over-year basis, writtenpremium per policy was flat in our Agency auto anddecreased 1% in our Direct personal auto businesses.Rate decreases implemented throughout the year werepartially offset by shifts in the mix of business. Writtenpremium per policy for our special lines productsincreased 3%, compared to the prior year.
Commercial Lines experienced a 4% increase in writtenpremium per policy in our commercial auto products,which reflects rate increases of about 5%, on average,during the year. Written premium per policy growth forour Property business was flat in 2020.
To grow policies in force, it is critical that we retain ourcustomers for longer periods. Consequently, increasingretention continues to be one of our most importantpriorities. Our efforts to increase our share of multi-product households remains a key initiative and we willcontinue to make investments to improve the customerexperience to continue to support that goal. Policy lifeexpectancy, which is our actuarial estimate of the averagelength of time that a policy will remain in force beforecancellation or lapse in coverage, is our primary measure
App.-A-51

of customer retention in our Personal Lines andCommercial Lines businesses. Due to insurance marketvolatility brought on by the COVID-19 virus, it may bedifficult to assess the progress we are making against ourretention goals. We evaluate retention using a trailing12-month total auto policy life expectancy and trailing3-month total auto policy life expectancy, which does notaddress seasonality and can reflect more volatility. On atrailing 3-month basis, our personal auto policy lifeexpectancy was up 7% year over year. Our trailing12-month total personal auto policy life expectancy wasup 10% year over year. We believe that part of thisincrease is attributable to suspending cancellations ofpolicies for nonpayment as part of the billing leniencyprograms that were in place primarily from mid-Marchthrough mid-May 2020. Our trailing 12-month policy lifeexpectancy increased 4% for special lines, 5% forCommercial Lines, and decreased 3% for Property.
C. Investments
The fair value of our investment portfolio was$47.5 billion at December 31, 2020, compared to$39.3 billion at December 31, 2019. The increase fromyear-end 2019, primarily reflected cash flows fromoperations of $6.9 billion and the $1.0 billion ofproceeds from the debt we issued during March,partially offset by $1.6 billion related to the payment ofshareholder dividends during 2020.
Our asset allocation strategy is to maintain 0%-25% ofour portfolio in Group I securities, with the balance(75%-100%) of our portfolio in Group II securities (thesecurities allocated to Group I and II are defined belowunder Results of Operations – Investments). AtDecember 31, 2020, 14% of our portfolio was allocatedto Group I securities and 86% to Group II securities,compared to 12% and 88%, respectively, atDecember 31, 2019.
Our recurring investment income generated a pretaxbook yield of 2.4% for 2020, compared to 3.1% for2019, primarily due to investing new cash at lowerinterest rates. Our investment portfolio produced a fullytaxable equivalent (FTE) total return of 7.9% for both2020 and 2019. Our fixed-income and common stockportfolios had FTE total returns of 6.7% and 24.3%,respectively, for 2020, compared to 6.0% and 30.5% for2019. The year-over-year increase in our fixed-incomeFTE total return was the result of a reduction in interestrates and narrowing credit spreads in the last threequarters of the year. Our common stock portfolio’s FTEtotal return declined early in the year in response to theeconomic uncertainty due to the COVID-19 restrictionsand showed an improvement throughout the rest of theyear as investors continued to move back into riskassets.
At December 31, 2020, the fixed-income portfolio had aweighted average credit quality of AA- and a duration of2.9 years, compared to AA and 3.0 years atDecember 31, 2019. We shortened our portfolioduration over the previous twelve months and it remainsslightly below the midpoint of our 1.5 year to 5 yearrange, which we believe provides some protectionagainst an increase in interest rates.
Based on uncertainty of whether the London InterbankOffered Rate (LIBOR) will continue to be available after2021, we reviewed our portfolio for securities that couldbe affected by the proposed LIBOR change (i.e., reset toa fixed rate from a LIBOR-based rate or change to aLIBOR-replacement rate). Based on this review, we donot expect a change from LIBOR to have a material effecton our portfolio. We continue to monitor ongoingdiscussions and updates to the planned migration and itspotential effects on the LIBOR-linked securities in ourportfolio.
II. FINANCIAL CONDITION
A. Liquidity and Capital Resources
The Progressive Corporation receives cash throughsubsidiary dividends, security sales, borrowings, andother transactions, and uses these funds to contributeto its subsidiaries (e.g., to support growth), to makepayments to shareholders and debt holders (e.g.,dividends and interest, respectively), and to repurchaseits common shares and debt, as well as for acquisitionsand other business purposes that may arise.
During 2020, The Progressive Corporation receivedcash from the following sources:
• Subsidiary dividends - received $4.1 billion ofdividends, net of capital contributions, from ourinsurance and non-insurance subsidiaries.
• Debt issuances - issued $500 million of 3.20%Senior Notes due 2030 and $500 million of 3.95%Senior Notes due 2050 in underwritten publicofferings.
App.-A-52

The Progressive Corporation deployed capital throughthe following actions in 2020:
• Dividends• Common shares - declared aggregate
dividends of $4.90 per common share, or$2.87 billion.
• Preferred shares - declared aggregateSeries B Preferred dividends of$40.2 million.
• Common Share Repurchases - acquired 1.3 millionof our common shares at a total cost of$111.6 million to neutralize dilution from equity-based compensation granted during the yearconsistent with our financial policies. Therepurchases were made in the open market orpursuant to our equity compensation plans (i.e.,repurchased shares to cover tax obligations uponvesting of restricted stock units).
• Acquisitions - acquired all remaining outstandingshares of ARX Holding Corp. (ARX) at a cost of$243.0 million.
Over the last three years, The Progressive Corporationreceived dividends from its subsidiaries, net of capitalcontributions, of $6.9 billion, and issued $2.2 billion ofsenior notes and $500 million of our Series B PreferredShares. Regulatory restrictions on subsidiary dividendsare described in Note 8 – Statutory FinancialInformation. The covenants on The ProgressiveCorporation’s existing debt securities do not include anyrating or credit triggers that would require an adjustmentof the interest rate or an acceleration of principalpayments in the event that our debt securities aredowngraded by a rating agency. While we have had aseries of unsecured discretionary lines of creditavailable to us during the last three years in theaggregate amount of $250 million, we did not borrowunder these arrangements, or engage in other short-term borrowings, during this period to fund ouroperations or for liquidity purposes.
In the aggregate for the last three years, we made thefollowing payments:• $3.9 billion for common and preferred share
dividends;• $0.6 billion to acquire outstanding shares of ARX;• $0.5 billion for interest on our outstanding debt; and• $0.3 billion to repurchase our common shares.
For the three years ended December 31, 2020,operations generated positive cash flows of about$19.5 billion, and cash flows are expected to remainpositive in the reasonably foreseeable future. In 2020,operating cash flows increased $0.6 billion, compared to
2019, primarily due to an increase in premiumscollected in excess of paid losses due to the growthduring the year. Beginning in March, when COVID-19restrictions were put in place, we experienced asignificant decrease in accident claim frequency and, asa result, the amount of cash required to pay claims alsodecreased countrywide. In response to the reduction inauto accident frequency, we issued a total of $1.1 billionof credits to our personal auto policyholders in 2020.We have continued to assess miles driven, weatherevents and other components of expected loss costs ona state-by-state basis and, where appropriate, adjustedrates accordingly.
As of December 31, 2020, we held $18.0 billion in short-term investments and U.S. Treasury securities. Basedon our portfolio allocation and investment strategies, webelieve that we have sufficient readily availablemarketable securities to cover our claims payments inthe event our cash flow from operations were to benegative. See Item 1A, “Risk Factors,” in our 2020 Form10-K filed with the Securities and ExchangeCommission for a discussion of certain matters that mayaffect our portfolios and capital position.
Progressive’s insurance operations create liquidity bycollecting and investing premiums from new andrenewal business in advance of paying claims. Asprimarily an auto insurer, our claims liabilities aregenerally short in duration. Typically, at any point intime, approximately 50% of our outstanding loss andloss adjustment expense (LAE) reserves are paid withinthe following twelve months and less than 20% are stilloutstanding after three years. See Note 6 – Loss andLoss Adjustment Expense Reserves for furtherinformation on the timing of claims payments.
Insurance companies are required to satisfy regulatorysurplus and premiums-to-surplus ratio requirements. Asof December 31, 2020, our consolidated statutorysurplus was $15.2 billion, compared to $13.7 billion atDecember 31, 2019. Our net premiumswritten-to-surplus ratio was 2.7 to 1 at year-end 2020and 2019 and 2.8 to 1 at year-end 2018. At year-end2020, we also had access to $6.2 billion of securitiesheld in a non-insurance subsidiary, portions of whichcould be contributed to the capital of our insurancesubsidiaries to support growth or for other purposes. InJanuary 2021, we used proceeds from the sale of$2.7 billion of these securities to pay the common sharedividends declared by the Board in December 2020.See Note 14 – Dividends for further discussion of ourdividend policy.
App.-A-53

Insurance companies are also required to satisfy risk-based capital ratios. These ratios are determined by aseries of dynamic surplus-related calculations requiredby the laws of various states that contain a variety offactors that are applied to financial balances based onthe degree of certain risks (e.g., asset, credit, andunderwriting). Our insurance subsidiaries’ risk-basedcapital ratios are in excess of applicable minimumregulatory requirements. Nonetheless, the payment ofdividends by our insurance subsidiaries are subject tocertain limitations. See Note 8 – Statutory FinancialInformation for additional information on insurancesubsidiary dividends.
We seek to deploy our capital in a prudent manner anduse multiple data sources and modeling tools toestimate the frequency, severity, and correlation ofidentified exposures, including, but not limited to,catastrophic and other insured losses, natural disasters,and other significant business interruptions, to estimateour potential capital needs. Management views ourcapital position as consisting of three layers, each with aspecific size and purpose:
• The first layer of capital, which we refer to as“regulatory capital,” is the amount of capital we needto satisfy state insurance regulatory requirementsand support our objective of writing all the businesswe can write and service, consistent with ourunderwriting discipline of achieving a combined ratioof 96 or better. This capital is held by our variousinsurance entities.
• The second layer of capital we call “extremecontingency.” While our regulatory capital is, bydefinition, a cushion for absorbing financialconsequences of adverse events, such as lossreserve development, litigation, weathercatastrophes, and investment market corrections,we view that as a base and hold additional capital foreven more extreme conditions. The modeling usedto quantify capital needs for these conditions isextensive, including tens of thousands ofsimulations, representing our best estimates of suchcontingencies based on historical experience. Thiscapital is held either at a non-insurance subsidiary ofthe holding company or in our insurance entities,where it is potentially eligible for a dividend to theholding company.
• The third layer is capital in excess of the sum of thefirst two layers and provides maximum flexibility tofund other business opportunities, repurchase stock
or other securities, satisfy acquisition-relatedcommitments, and pay dividends to shareholders,among other purposes. This capital is largely held ata non-insurance subsidiary of the holding company.
At all times during the last two years, our total capitalexceeded the sum of our regulatory capital layer plusour self-constructed extreme contingency layer. AtDecember 31, 2020, we held total capital (debt plusshareholders’ equity) of $22.4 billion, compared to$18.1 billion at December 31, 2019. Our debt-to-totalcapital (debt plus shareholders’ equity, which does notinclude redeemable noncontrolling interest) ratios atDecember 31, 2020, 2019, and 2018 were 24.1%,24.4%, and 28.9%, respectively, and were consistentwith our financial policy of maintaining a ratio of lessthan 30%, which we target to meet annually.
Based upon our capital planning and forecasting efforts,we believe we have sufficient capital resources andcash flows from operations to support our currentbusiness, scheduled principal and interest payments onour debt, anticipated dividends on our common sharesand Series B Preferred Shares, our contractualobligations, and other expected capital requirements forthe foreseeable future, including the $500 million of3.75% Senior Notes maturing in August of 2021. Inaddition, in February 2021, Progressive entered into adefinitive agreement to acquire all of the outstandingcommon shares of Protective Insurance Corporation for$23.30 per share, or approximately $338 million inaggregate. This transaction is expected to close prior tothe end of the third quarter 2021, subject to customaryclosing conditions, including the receipt of certainrequired regulatory approvals. We expect to fund thistransaction with cash from operations or securities wecurrently hold. See Note 17 – Subsequent Event forfurther discussion.
Nevertheless, we may determine to raise additionalcapital to take advantage of attractive terms in themarket and provide additional financial flexibility. Wehave an effective shelf registration with the U.S.Securities and Exchange Commission so that we mayperiodically offer and sell an indeterminate aggregateamount of senior or subordinated debt securities,preferred stock, depositary shares, common stock,purchase contracts, warrants, and units. The shelfregistration enables us to raise funds from the offeringof any securities covered by the shelf registration aswell as any combination thereof, subject to marketconditions.
App.-A-54

B. Commitments, Contingencies, and Other Off-Balance-Sheet Arrangements
Contractual Obligations
A summary of our noncancelable contractual obligations as of December 31, 2020, follows:Payments due by period
(millions) TotalLess than
1 year1-3
years3-5
yearsMore than
5 years
Debt $ 5,450.0 $ 500.0 $ 0 $ 0 $ 4,950.0
Interest payments on debt 3,831.2 223.9 410.3 410.3 2,786.7
Operating lease obligations 185.4 78.9 77.8 28.2 0.5
Purchase obligations 830.4 727.4 92.9 9.9 0.2
Catastrophe excess of loss reinsurance contracts1 191.1 140.2 38.5 12.4 0
Loss and loss adjustment expense reserves 20,265.8 9,920.4 6,888.9 1,835.9 1,620.6
Total $ 30,753.9 $ 11,590.8 $ 7,508.4 $ 2,296.7 $ 9,358.01Our Property business has several multiple-layer property catastrophe reinsurance contracts with various reinsurers with terms ranging from oneto three years.
Purchase obligations represent our noncancelablecommitments for goods and services (e.g., softwarelicenses, maintenance on information technologyequipment, and media placements). Unlike many otherforms of contractual obligations, loss and LAE reservesdo not have definitive due dates and the ultimatepayment dates are subject to a number of variables anduncertainties. As a result, the total loss and LAE reservepayments to be made by period, as shown above, areestimates based on our recent payment patterns. To
further understand our claims payments, see Note 6 –Loss and Loss Adjustment Expense Reserves.
Off-Balance-Sheet Arrangements
During 2020, our only off-balance-sheet arrangementsincluded purchase obligations and catastrophe excessof loss reinsurance contracts (see Note 1 – Reportingand Accounting Policies for further discussion). We didnot have any open derivative positions at December 31,2020 or 2019.
III. RESULTS OF OPERATIONS – UNDERWRITING
A. Segment Overview
We report our underwriting operations in threesegments: Personal Lines, Commercial Lines, andProperty. As a component of our Personal Linessegment, we report our Agency and Direct businessresults to provide further understanding of our productsby distribution channel.
The following table shows the composition of ourcompanywide net premiums written, by segment, for theyears ended December 31:
2020 2019 2018
Personal Lines
Agency 40 % 41 % 41 %
Direct 42 42 42
Total Personal Lines 82 83 83
Commercial Lines 13 13 12
Property 5 4 5
Total underwriting operations 100 %100 % 100 %
Our Personal Lines segment writes insurance forpersonal autos (which accounts for about 94% of thesegment’s net written premiums) and special linesproducts (e.g., motorcycles, watercraft, and RVs).Within Personal Lines we often refer to our fourconsumer segments, which include:• Sam - inconsistently insured;• Diane - consistently insured and maybe a renter;• Wrights - homeowners who do not bundle auto and
home; and• Robinsons - homeowners who bundle auto and
home
While our personal auto policies are primarily written for6-month terms, we write 12-month auto policies in ourPlatinum agencies to promote bundled auto and homegrowth. At year-end 2020, 12% of our Agency autopolicies in force were 12-month policies, compared toabout 10% a year earlier. While the shift to 12-monthpolicies is slow, to the extent our Agency new businessapplication mix of annual policies grows, that shift inpolicy term could increase our written premium mix by
App.-A-55

channel as 12-month policies have about twice theamount of net premiums written compared to 6-monthpolicies. The special lines products are written for12-month terms.
Our Commercial Lines business writes auto-relatedprimary liability and physical damage insurance, andother liability and property insurance, predominately forsmall businesses. The majority of our Commercial Linesbusiness is written through the independent agencychannel. The amount of commercial auto businesswritten through the direct channel, excluding our TNCbusiness, represented about 9% of premiums written for2020, compared to 8% for both 2019 and 2018. Toserve our direct channel customers, we continued toexpand our product offerings, including adding states
where we offer our business owners policy and includethe product on our digital platform serving direct smallbusiness consumers (BusinessQuote Explorer®). About90% of our Commercial Lines policies are written for12-month terms.
Our Property business writes residential propertyinsurance for single family homes, condominium unitowners, renters, etc. We write the majority of ourProperty business through the independent agencychannel; however, we continue to expand thedistribution of our Property product offerings in thedirect channel, which represented about 18% ofpremiums written for 2020, compared to 16% and 13%for 2019 and 2018, respectively. Property policies arewritten for 12-month terms.
B. Profitability
Profitability for our underwriting operations is defined by pretax underwriting profit, which is calculated as netpremiums earned plus fees and other revenues less losses and loss adjustment expenses, policy acquisition costs,other underwriting expenses, and policyholder credits. We also use underwriting margin, which is underwriting profitor loss expressed as a percentage of net premiums earned, to analyze our results. For the three years endedDecember 31, our underwriting profitability results were as follows:
2020 2019 2018
UnderwritingProfit (Loss)
UnderwritingProfit (Loss)
UnderwritingProfit (Loss)
($ in millions) $ Margin $ Margin $ Margin
Personal Lines
Agency $ 2,236.5 14.2 % $ 1,673.2 11.2 % $ 1,435.7 11.0 %
Direct 2,076.5 12.3 1,181.4 7.7 1,088.5 8.4
Total Personal Lines 4,313.0 13.2 2,854.6 9.5 2,524.2 9.7
Commercial Lines 634.8 13.0 458.8 10.4 478.6 13.3
Property1 (125.1) (7.1) (26.1) (1.7) (88.7) (6.9)
Other indemnity2 0 NM 0 NM 0.9 NM
Total underwriting operations $ 4,822.7 12.3 % $ 3,287.3 9.1 % $ 2,915.0 9.4 %1During 2020, 2019, and 2018, pretax profit (loss) includes $56.9 million, $66.3 million, and $72.0 million, respectively, of amortization expense onintangible assets.
2 Underwriting margins for our other indemnity businesses are not meaningful (NM) due to the low level of premiums earned by, and the variabilityof loss costs in, such businesses.
The increases in underwriting profit margin experienced in the Personal Lines business were driven by lower personalauto accident frequency experienced during 2020, partially offset by an increase in auto severity, policyholder creditsissued to personal auto customers, and an increase in advertising spend. Our special lines products also had aprofitable year, however, the underwriting profit did not have an impact on the overall total Personal Lines profitmargin. The increase in underwriting profit margin of our Commercial Lines business was primarily attributable tolower accident frequency experienced during 2020, partially offset by an increase in loss severity and policyholderbilling credits issued during the year. The decrease in the Property underwriting profit margin was primarily driven by ahigh volume of catastrophe losses during 2020.
App.-A-56

Underwriting results for our Personal Lines business, including results by distribution channel, the Commercial Linesbusiness, the Property business, and our underwriting operations in total, were as follows:Underwriting Performance1 2020 2019 2018
Personal Lines – Agency
Loss & loss adjustment expense ratio 63.5 69.8 69.8
Underwriting expense ratio 22.3 19.0 19.2
Combined ratio 85.8 88.8 89.0
Personal Lines – Direct
Loss & loss adjustment expense ratio 62.9 71.4 71.4
Underwriting expense ratio 24.8 20.9 20.2
Combined ratio 87.7 92.3 91.6
Total Personal Lines
Loss & loss adjustment expense ratio 63.2 70.6 70.6
Underwriting expense ratio 23.6 19.9 19.7
Combined ratio 86.8 90.5 90.3
Commercial Lines
Loss & loss adjustment expense ratio 64.5 68.5 66.3
Underwriting expense ratio 22.5 21.1 20.4
Combined ratio 87.0 89.6 86.7
Property
Loss & loss adjustment expense ratio 77.3 71.2 72.8
Underwriting expense ratio2 29.8 30.5 34.1
Combined ratio2 107.1 101.7 106.9
Total Underwriting Operations
Loss & loss adjustment expense ratio 64.0 70.4 70.2
Underwriting expense ratio 23.7 20.5 20.4
Combined ratio 87.7 90.9 90.6
Accident year – Loss & loss adjustment expense ratio3 63.5 69.8 69.91Ratios are expressed as a percentage of net premiums earned; fees and other revenues are deducted from underwriting expenses in the ratiocalculations.
2Included in 2020, 2019, and 2018, are 3.2 points, 4.3 points, and 5.6 points, respectively, of amortization expense on intangible assets. Excludingthis expense, the Property business would have reported expense ratios of 26.6, 26.2, and 28.5, and combined ratios of 103.9, 97.4, and 101.3,for 2020, 2019, and 2018, respectively.
3The accident year ratios include only the losses that occurred during the period noted. As a result, accident period results will change over time,either favorably or unfavorably, as we revise our estimates of loss costs when payments are made or reserves for that accident period arereviewed.
App.-A-57

Losses and Loss Adjustment Expenses (LAE)
(millions) 2020 2019 2018
Change in net lossand LAE reserves $ 1,574.4 $ 2,065.1 $ 1,911.3
Paid losses and LAE 23,547.4 23,405.4 19,809.7
Total incurredlosses and LAE $25,121.8 $25,470.5 $21,721.0
Claims costs, our most significant expense, representpayments made, and estimated future payments to bemade, to or on behalf of our policyholders, includingexpenses needed to adjust or settle claims. Claimscosts are a function of loss severity and frequency and,for our vehicle businesses, are influenced by inflationand driving patterns, among other factors, some ofwhich are discussed below. In our Property business,severity is primarily a function of construction costs andthe age of the structure. Accordingly, anticipated
changes in these factors are taken into account whenwe establish premium rates and loss reserves. Lossreserves are estimates of future costs and our reservesare adjusted as underlying assumptions change andinformation develops. See Critical Accounting Policiesfor a discussion of the effect of changing estimates.
Our total loss and LAE ratio decreased 6.4 points in2020 and increased 0.2 points in 2019, each comparedto the prior year. Our accident year loss and LAE ratio,which excludes the impact of prior accident year reservedevelopment during each calendar year, decreased 6.3points and 0.1 points in 2020 and 2019, respectively.Several factors that contributed to the year-over-yearchanges are discussed below and include the impact ofcatastrophe losses, changes in severity and frequency,and prior accident year reserve development.
We experienced severe weather conditions in several areas of the country during each of the last three years.Hurricanes, hail storms, tornadoes, and wind activity contributed to catastrophe losses each year. The following tableshows catastrophe losses incurred, net of reinsurance, for the years ended December 31:($ in millions) 2020 2019 2018
Personal Lines $ 439.4 $ 323.4 $ 326.2
Commercial Lines 14.8 13.6 10.9
Property 423.8 214.5 268.8
Total catastrophe losses incurred $878.0 $551.5 $605.9
Combined ratio effect 2.2 pts. 1.5 pts. 2.0 pts.
The catastrophe losses in 2020 occurred throughout theUnited States. We have responded, and plan tocontinue to respond, promptly to catastrophic eventswhen they occur in order to provide exemplary claimsservice to our customers.
We do not have catastrophe-specific reinsurance for ourPersonal Lines or Commercial Lines businesses, but wereinsure portions of our Property business againstvarious risks, including, but not limited to, catastrophiclosses. The Property business reinsurance programsinclude: multi-year catastrophe excess of loss,aggregate excess of loss, a catastrophe bond, and, foraccident years 2017 through 2019, aggregate stop-losscoverage. See Item 1 – Description of Business-Reinsurance in our Annual Report on Form 10-K for theyear ended December 31, 2020 and Note 7 –Reinsurance for a discussion of our various reinsuranceprograms.
Under our various reinsurance agreements, we cededthe following losses and ALAE, including developmenton prior year storms, during the years ended December31:(in millions) 2020 2019 2018
Aggregate excess of loss $120.9 NA NA
Per occurrence excess of loss:
Current accident year 10.0 $ 0 $ 70.0
Prior accident years 117.5 191.4 81.0
Aggregate stop-loss1 12.7 57.2 7.9
Total $261.1 $248.6 $158.9
NA = Not applicable; this reinsurance coverage was entered into onJanuary 1, 2020.1 The aggregate stop-loss agreements cover accident years 2017-2019; activity in 2020 represents development on the prior yearlosses and ALAE.
The following discussion of our severity and frequencytrends in our personal auto businesses excludes
App.-A-58

comprehensive coverage because of its inherentvolatility, as it is typically linked to catastrophic lossesgenerally resulting from adverse weather. For ourcommercial auto products, the reported frequency andseverity trends include comprehensive coverage.Comprehensive coverage insures against damage to acustomer’s vehicle due to various causes other thancollision, such as windstorm, hail, theft, falling objects,and glass breakage.
Total personal auto incurred severity (i.e., average costper claim, including both paid losses and the change incase reserves) on a calendar-year basis was up overthe prior-year periods 10% in 2020, 7% in 2019, and 5%in 2018.• 2020 - Severity increased about 14% for our
personal injury protection (PIP) coverage, 12%for our bodily injury coverage, 9% for ourproperty damage coverage, and 5% for ourcollision coverage.
• 2019 - Severity increased about 8% for our bodilyinjury coverage, 7% for our PIP coverage, and6% for our collision and property damagecoverages.
• 2018 - Severity increased about 8% for ourcollision coverage, about 4% for our propertydamage and bodily injury coverages, and about2% for our PIP coverage.
On a calendar-year basis, our commercial autoproducts incurred severity, excluding our TNC business,increased 10% in both 2020 and 2018, compared to19% in 2019. Since the loss patterns in the TNCbusiness are not indicative of our other commercial autoproducts, disclosing severity and frequency trendsexcluding that business is more indicative of our overallexperience for the majority of our commercial autoproducts. In addition to general trends in themarketplace, the increase in our commercial autoproducts severity reflects increased medical costs andactuarially determined reserves due to accelerating paidloss trends and shifts in the mix of business to for-hiretransportation, which has higher average severity thanthe business auto and contractor business markettargets.
It is a challenge to estimate future severity, especiallyfor bodily injury and PIP claims, but we continue tomonitor changes in the underlying costs, such asmedical costs, health care reform, court decisions, andjury verdicts, along with regulatory changes and otherfactors that may affect severity.
Our personal auto incurred frequency, on a calendar-year basis, was down about 24% in 2020 and 3% inboth 2019 and 2018.• 2020 - Frequency decreased 28% for our PIP
coverage, 27% for our property damagecoverage, 25% for our bodily injury coverage,and 23% for our collision coverage.
• 2019 - Frequency decreased 5% for our PIPcoverage, 4% for our collision and propertydamage coverages, and 3% for our bodily injurycoverage.
• 2018 - Frequency decreased about 3% for allcoverages (PIP, collision, property damage, andbodily injury).
We closely monitor the changes in frequency, but thedegree or direction of near-term frequency change isnot something that we are able to predict with anydegree of confidence, given the uncertainty of thecurrent environment. We saw the number of vehiclemiles driven decrease dramatically when the COVID-19restrictions were first put in place, especially during theearly months of the pandemic, and driving patternshave not returned to their historical levels. We analyzetrends to distinguish changes in our experience fromother external factors, such as changes in the numberof vehicles per household, miles driven, gasoline prices,advances in vehicle safety, and unemployment rates,versus those resulting from shifts in the mix of ourbusiness or changes in driving patterns, to allow us toreserve more accurately for our loss exposures.
On a year-over-year basis, incurred frequency in ourCommercial Lines business saw a decrease of about15% in 2020, 4% in 2019, and 3% in 2018. The 2020frequency decrease was in part due to COVID-19restrictions and continued product segmentation andunderwriting, which created a mix shift toward morepreferred, lower-frequency, business.
App.-A-59

The table below presents the actuarial adjustments implemented and the loss reserve development experienced on acompanywide basis in the years ended December 31:($ in millions) 2020 2019 2018
ACTUARIAL ADJUSTMENTS
Reserve decrease (increase)
Prior accident years $ (27.5) $ (65.8) $(25.0)
Current accident year 68.4 (120.4) 17.0
Calendar year actuarial adjustments $ 40.9 $(186.2) $ (8.0)
PRIOR ACCIDENT YEARS DEVELOPMENT
Favorable (unfavorable)
Actuarial adjustments $ (27.5) $ (65.8) $(25.0)
All other development (167.8) (166.5) (63.5)
Total development $(195.3) $(232.3) $(88.5)
(Increase) decrease to calendar year combined ratio (0.5) pts. (0.6) pts. (0.3) pts.
Total development consists of both actuarialadjustments and “all other development” on prioraccident years. The actuarial adjustments represent thenet changes made by our actuarial staff to both currentand prior accident year reserves based on regularlyscheduled reviews. Through these reviews, ouractuaries identify and measure variances in theprojected frequency and severity trends, which allowthem to adjust the reserves to reflect the current costtrends. For our Property business, 100% of catastrophelosses are reviewed monthly, and any development oncatastrophe reserves are included as part of theactuarial adjustments. For the Personal Lines andCommercial Lines businesses, development forcatastrophe losses for the vehicle businesses would bereflected in “all other development,” discussed below, tothe extent they relate to prior year reserves. We reportthese actuarial adjustments separately for the currentand prior accident years to reflect these adjustments aspart of the total prior accident years development.
“All other development” represents claims settling formore or less than reserved, emergence of unrecordedclaims at rates different than anticipated in our incurredbut not recorded (IBNR) reserves, and changes inreserve estimates on specific claims. Although webelieve the development from both the actuarialadjustments and “all other development” generallyresults from the same factors, we are unable to quantifythe portion of the reserve development that might beapplicable to any one or more of those underlyingfactors, excluding the unfavorable developmentresulting from the impact from COVID-19 restrictions.
Our objective is to establish case and IBNR reservesthat are adequate to cover all loss costs, while incurringminimal variation from the date the reserves are initiallyestablished until losses are fully developed. As reflectedin the table above, we experienced unfavorable prioryear development during each of these years. For 2020,we incurred unfavorable reserve development primarilyrelated to a higher than anticipated frequency ofreopened PIP claims in our personal auto business andan increase in bodily injury severity and the emergenceof large bodily injury claims in our Commercial Linesbusiness. For 2019, the unfavorable reservedevelopment was primarily attributable to higher thananticipated claims occurring in late 2018 but notreported until 2019, a higher than anticipated frequencyof reopened PIP claims in our personal auto business,and increased bodily injury severity. For 2018, theunfavorable reserve development was primarily due toreopened PIP claims in our personal auto business. SeeNote 6 – Loss and Loss Adjustment Expense Reservesfor a more detailed discussion of our prior accident yeardevelopment. We continue to focus on our loss reserveanalysis, attempting to enhance accuracy and to furtherour understanding of our loss costs.
Underwriting Expenses
The companywide underwriting expense ratio (i.e.,policy acquisition costs, other underwriting expenses,and policyholder credits, net of fees and otherrevenues, expressed as a percentage of net premiumsearned) increased 3.2 points. During the year, weincurred 2.7 points of policyholder credits issued topersonal auto customers. In addition to the credits
App.-A-60

issued to personal auto customers, our CommercialLines business worked directly with their policyholdersand agents to provide premium and billing credits duringthe year, which contributed to a 0.7 point increase in theCommercial Lines expense ratio during 2020.
Progressive’s other underwriting expenses, whichexcludes the policyholder credits, increased 12% in
2020 and 19% in 2019, in part reflecting increasedadvertising spend in both years. On a year-over-yearbasis, our advertising expenditures increased 18% and29% in 2020 and 2019, respectively. We will continue toinvest in advertising as long as we generate sales at acost below the maximum amount we are willing tospend to acquire a new customer.
C. Growth
For our underwriting operations, we analyze growth interms of both premiums and policies. Net premiumswritten represent the premiums from policies writtenduring the period less any premiums ceded toreinsurers. Net premiums earned, which are a functionof the premiums written in the current and prior periods,
are earned as revenue over the life of the policy using adaily earnings convention. Policies in force, ourpreferred measure of growth since it removes thevariability due to rate changes or mix shifts, representall policies under which coverage was in effect as of theend of the period specified.
For the years ended December 31, 2020 2019 2018
($ in millions) $ % Growth $ % Growth $ % Growth
NET PREMIUMS WRITTEN
Personal Lines
Agency $ 16,133.8 5 % $ 15,336.5 13 % $ 13,562.3 16 %
Direct 17,208.8 9 15,765.7 16 13,595.3 21
Total Personal Lines 33,342.6 7 31,102.2 15 27,157.6 18
Commercial Lines 5,315.3 11 4,791.8 20 3,996.4 28
Property 1,910.8 13 1,683.9 16 1,455.9 33
Total underwriting operations $ 40,568.7 8 % $ 37,577.9 15 % $ 32,609.9 20 %
NET PREMIUMS EARNED
Personal Lines
Agency $ 15,789.5 6 % $ 14,904.1 14 % $ 13,017.2 16 %
Direct 16,830.6 10 15,305.9 18 13,017.5 21
Total Personal Lines 32,620.1 8 30,210.0 16 26,034.7 19
Commercial Lines 4,875.8 10 4,427.6 23 3,610.9 29
Property 1,765.7 14 1,554.8 21 1,287.7 30
Total underwriting operations $ 39,261.6 8 % $ 36,192.4 17 % $ 30,933.3 20 %
December 31, 2020 2019 2018
(# in thousands) # % Growth # % Growth # % Growth
POLICIES IN FORCE
Agency auto 7,617.0 9 % 6,994.3 10 % 6,358.3 12 %
Direct auto 8,881.4 13 7,866.5 12 7,018.5 16
Total auto 16,498.4 11 14,860.8 11 13,376.8 14
Special lines1 4,915.1 8 4,547.8 4 4,382.2 0
Personal Lines - total 21,413.5 10 19,408.6 9 17,759.0 10
Commercial Lines 822.0 9 751.4 8 696.9 8
Property 2,484.4 13 2,202.1 14 1,936.5 32
Companywide total 24,719.9 11 % 22,362.1 10 % 20,392.4 12 %1 Includes insurance for motorcycles, watercraft, RVs, and similar items.
App.-A-61

To analyze growth, we review new policies, rate levels,and the retention characteristics of our segments.During 2020, the growth in net premiums writtenreflected growth in policies in force, partially offset byrate decreases taken in our Personal Lines businessduring the year. At year-end 2020, we had 2.4 millionmore policies in force than at the end of 2019, with all ofour segments contributing to this unit growth. From Aprilthrough December, we filed personal auto rate changesthat averaged a decrease of approximately 3%,primarily in response to driving and claims datagathered during the year.
Although new policies are necessary to maintain agrowing book of business, we continue to recognize theimportance of retaining our current customers as acritical component of our continued growth. As shown inthe tables below, we measure retention by policy lifeexpectancy. We review our customer retention for ourpersonal auto products using both a trailing 3-monthand a trailing 12-month period. Although using a trailing3-month measure does not address seasonality and canreflect more volatility, this measure is more responsiveto current experience and generally can be an indicatorof how retention rates are moving, especially given theevents that occurred during 2020.
We believe the growth in our personal auto trailing12-month policy life expectancy could be distorted due tothe impact on the measure from suspending cancellationsof policies for nonpayment, which impacted renewalactivity during 2020. We continue to disclose our changesin policy life expectancy using both a trailing 3-month and12-month period; however, we believe that the trailing12-month measure will be positively impacted by the factordiscussed above through mid-2021.
D. Personal Lines
The following table shows our year-over-year changesfor our Personal Lines business:
Growth Over PriorYear
2020 2019 2018
Applications
New 3 % 8 % 17 %
Renewal 8 13 11
Written premium per policy -Auto (1) 2 4
Policy life expectancy - Auto
Trailing 3-months 7 0 (4)
Trailing 12-months 10 0 3
While new application growth in our Personal Linesproducts was up 3%, our personal auto new applicationgrowth was flat and our special lines products saw newapplications increase 18% during the year, driven byhigh demand due to the overall growth in the RV andboat industries. We continued to see strong personalauto renewal application growth, which we believe wasaided, in part, by our countrywide billing leniency effortsand the moratoriums that were put in place frommid-March through mid-May 2020, suspendingcancellations of policies for non-payment.
During 2020, overall personal auto quote volumes andrates of conversion (i.e., converting a quote to a sale)were flat, compared to last year. In response to lowervehicle miles driven caused by COVID-19 restrictions,we decreased rates during 2020, contributing to thedecrease in written premium per policy.
We report our Agency and Direct business resultsseparately as components of our Personal Linessegment to provide further understanding of ourproducts by distribution channel.
The Agency Business
Growth Over PriorYear
2020 2019 2018
Applications - Auto
New (5)% 7 % 14 %
Renewal 7 12 12
Written premium per policy -Auto 0 3 5
Policy life expectancy - Auto
Trailing 3-months 6 4 (2)
Trailing 12-months 10 3 4
The Agency business includes business written by morethan 40,000 independent insurance agencies thatrepresent Progressive, as well as brokerages in NewYork and California. During 2020, only 14 statesgenerated new Agency auto application growth,including only two of our top 10 largest Agency states.While we believe we remain competitive in our productofferings and position in the marketplace, newapplication growth is down compared to last year, asCOVID-19 restrictions significantly impacted agents andtheir ability to get their operations back to pre-COVIDlevels and we saw a temporary shift of consumerpreference toward shopping in the direct channel.
App.-A-62

We experienced a modest decrease in new autoapplications in our Sam and Diane consumer segmentson a year-over-year basis, while the Wrights andRobinsons experienced a slight increase.
During 2020, we experienced a 2% year-over-yeardecrease in Agency auto quotes and a 3% decrease inthe rate of conversion. Robinsons quote volumeexperienced low double-digit growth, while Sams saw alow double-digit decline. The increase in Robinsonsresulted from expansion of our integrated agencyquoting system, which provides a faster, more intuitivesystem to quote multiple products.
Written premium per policy for new Agency autobusiness increased 1% and was flat for renewalbusiness during 2020, compared to last year. During theyear, we experienced an increase in the percentage ofbundled Agency auto policies written for 12-monthterms, which have higher written premiums than policieswritten for 6-month terms.
The Direct Business
Growth Over PriorYear
2020 2019 2018
Applications - Auto
New 5 % 9 % 25 %
Renewal 11 17 15
Written premium per policy -Auto (1) 2 4
Policy life expectancy - Auto
Trailing 3-months 6 (3) (5)
Trailing 12-months 10 (3) 1
The Direct business includes business written directly byProgressive on the Internet, through mobile devices, andover the phone. During 2020, we generated new Directauto application growth in 31 states, including eight of ourtop 10 largest Direct states. New and renewal applicationsincreased on a year-over-year basis, primarily reflectingour competitiveness in the marketplace.
We continued to grow our new Direct auto applicationsacross all consumer segments, with the largestpercentage of new application growth generated fromour Robinsons. As a result of increased marketinginvestments that targeted auto/home bundlers, we grewour Direct Robinsons applications at a rate about fourtimes higher than the other consumer segmentscombined, albeit on a smaller base.
During 2020, we experienced an increase in quotes inall of our consumer segments, except Dianes, whichhad flat volume during the year. Our total year-over-year Direct auto quote volume increased 3%, with aconversion rate growth of 2%.
Written premium per policy for both new and renewalDirect auto business decreased 1% during 2020,compared to last year, primarily reflecting a reduction inrates in response to lower loss costs recognized duringthe year and our expectation of future loss costs.
E. Commercial Lines
Growth Over PriorYear
2020 2019 2018
Applications - Auto
New 5 % 11 % 12 %
Renewal 6 9 6
Written premium per policy 4 8 14
Policy life expectancyTrailing 12-months 5 (2) 1
Note: Table excludes our TNC and business owners policybusinesses.
Our Commercial Lines business operates in five traditionalbusiness markets, which include business auto, for-hiretransportation, contractor, for-hire specialty, and towmarkets, and writes transportation network company(TNC) business and business owners policy (BOP)insurance.
Our commercial auto product experienced solid year-over-year new application growth in 2020, reflecting an increasein conversion, a generally strong economy, and ourcompetitiveness in the marketplace. New applicationgrowth during the year was primarily driven by growth inour for-hire transportation business market target, due togreater demand for shipping services in light of thepandemic.
In addition, we continue to believe we are well positionedto offer competitive rates to the safety conscious owners/operators and small fleets through Smart Haul®, ourpredictive usage-based insurance program, which ispredominantly used by our for-hire transportationpolicyholders.
We continue to monitor the growth and profitability acrossall of our business market targets and will imposeunderwriting restrictions when we believe it is necessary tomeet our profitability objectives.
App.-A-63

During the year, we expanded our footprint in the TNCbusiness by adding a total of 3 states plus the District ofColumbia to our rideshare coverage. Offsetting theimpact of expansion, TNC premiums were downsignificantly compared to last year due to a reduction inthe miles driven under these policies as a result of theCOVID-19 restrictions put in place starting in mid-March2020, and the social distancing guidelines that remain.We began to see mileage increase as rideshare usagestarted to recover during the second half of 2020.
We also continued to invest in our BOP product during2020, geared specifically to small businesses typicallywith fewer than 20 employees, by adding our BOPproduct to our digital BusinessQuote Explorer® platform.In 2020, we expanded our BOP coverage to 13 newstates.
F. Property
Growth Over PriorYear
2020 2019 2018
Applications
New 12 % (1)% 53 %
Renewal 14 22 25
Written premium per policy 0 2 (3)
Policy life expectancyTrailing 12-months (3) (1) (3)
Our Property business writes residential propertyinsurance for homeowners, other property owners, andrenters, in the agency and direct channels. During 2020,the Property business experienced an increase in newapplications, primarily driven by growth in our directchannel and our Robinsons consumer segment, asdiscussed above, and a continued rebound in thehousing market for new home sales.
During 2020, we made targeted rate increases in hailprone states and will continue to increase rates whereneeded to get us more closely in line with ourprofitability target. However, our Property businessexperienced flat written premium per policy on a year-over-year basis, primarily attributable to a shift in themix of business to a larger share of renters policies,which have lower written premiums per policy.
Our Property segment was not significantly impacted byCOVID-19 restrictions during the year.
G. Litigation
The Progressive Corporation and/or its insurancesubsidiaries are named as defendants in various
lawsuits arising out of claims made under insurancepolicies issued by its subsidiaries in the ordinary courseof business. We consider all legal actions relating tosuch claims in establishing our loss and loss adjustmentexpense reserves.
In addition, various Progressive entities are named asdefendants in a number of alleged class/collective/representative actions or individual lawsuits arising outof the operations of the insurance subsidiaries. Thesecases include those alleging damages as a result of,among other things, our practices in evaluating orpaying medical or injury claims or benefits, including,but not limited to, personal injury protection, medicalpayments, uninsured motorist/underinsured motorist,and bodily injury benefits, and for reimbursing medicalcosts incurred by Medicare/Medicaid beneficiaries; ourpractices in evaluating or paying physical damageclaims, including, but not limited to, our payment of totalloss claims and labor rates paid to auto body repairshops; our insurance product design, including ourresponse to the COVID-19 pandemic; employmentmatters; and cases challenging other aspects of ourclaims or marketing practices or other businessoperations. Other insurance companies and/or largeemployers face many of these same issues. During thelast three years, we have settled several class/collectiveaction and individual lawsuits. These settlements did nothave a material effect on our financial condition, cashflows, or results of operations. See Note 12 – Litigationfor a more detailed discussion.
H. Income Taxes
At December 31, 2020 and 2019, we had net currentincome taxes payable of $163.5 million and$224.0 million, respectively, which were reported as partof “other liabilities.” The decrease in 2020 primarilyresulted from the application of $48.8 million of theprotective deposit that we made in the prior year againstadditional taxes and interest owed for 2016. See Note 5– Income Taxes for further information.
A deferred tax asset or liability is a tax benefit orexpense that is expected to be realized in a future taxreturn. At December 31, 2020 and 2019, we reportednet deferred tax liabilities. We determined that we didnot need a valuation allowance on our gross deferredtax assets for either year. Although realization of thegross deferred tax assets is not assured, managementbelieves it is more likely than not that the gross deferredtax assets will be realized based on our expectation wewill be able to fully utilize the deductions that areultimately recognized for tax purposes.
App.-A-64

Our effective tax rate was 20% for 2020, compared to23% and 17% for 2019 and 2018, respectively. Thedecrease in the effective tax rate during 2020,compared to 2019, was primarily attributable to thereversal of prior year tax credits in 2019 as discussed inNote 5 – Income Taxes. The effective tax rate in 2020,2019, and 2018, also reflects $0, $38.1 million, and$71.0 million, respectively, of federal tax benefits
resulting from our investments in renewable energy; allof the tax benefits from these investments wererecorded in our income tax provision during 2019 and2018, respectively.
Consistent with prior years, we had no uncertain taxpositions. See Note 5 – Income Taxes for furtherinformation.
IV. RESULTS OF OPERATIONS – INVESTMENTS
A. Portfolio Summary
At year-end 2020, the fair value of our investmentportfolio was $47.5 billion, compared to $39.3 billion atyear-end 2019. The increase during the year primarilyreflected cash flows from operations of $6.9 billion andthe $1.0 billion of proceeds from the debt issued duringMarch, partially offset by $1.6 billion related to thepayment of shareholder dividends during 2020.
Our investment income (interest and dividends)decreased 10% in 2020 due to a decrease in the
portfolio yield, which was partially offset by an increasein average assets. Our investment income increased27% in 2019, as compared to the prior year, reflectingboth higher average assets and yields. Our total netrealized gains (losses) include gains (losses) fromsecurity sales, holding period gains (losses), andimpairment losses. For 2019 and 2018, the impairmentlosses solely related to “other asset” impairments onrenewable energy tax credit fund investments.
B. Investment Results
Our management philosophy governing the portfolio isto evaluate investment results on a total return basis.The fully taxable equivalent (FTE) total return includesrecurring investment income, adjusted to a fully taxableamount for certain securities that receive preferentialtax treatment (e.g., municipal securities), and total netrealized, and changes in total unrealized, gains (losses)on securities.
The following summarizes investment results for theyears ended December 31:
2020 2019 2018
Pretax recurring investment bookyield 2.4 % 3.1 % 2.8 %
Weighted average FTE bookyield 2.4 3.1 2.9
FTE total return:
Fixed-income securities 6.7 6.0 1.5
Common stocks 24.3 30.5 (4.4)
Total portfolio 7.9 7.9 1.2
The decrease in the book yield during 2020 reflectsinvesting new cash from operations and portfolioturnover during the year in lower interest rate securities.The year-over-year increase in our fixed-income totalreturn was the result of a reduction in interest rates andnarrowing credit spreads in the last three quarters of theyear.
A further break-down of our FTE total returns for ourfixed-income portfolio for the years endedDecember 31, follows:
2020 2019 2018
Fixed-income securities:
U.S. Treasury Notes 7.4 % 4.9 % 1.3 %
Municipal bonds 9.4 5.5 2.3
Corporate bonds 8.4 8.9 1.0
Residential mortgage-backedsecurities 3.0 3.3 2.7
Commercial mortgage-backedsecurities 4.2 6.2 2.1
Other asset-backed securities 2.8 3.4 2.2
Preferred stocks 6.6 13.8 (1.9)
Short-term investments 1.0 2.4 2.0
App.-A-65

C. Portfolio Allocation
The composition of the investment portfolio at December 31, was:
($ in millions) Fair Value
% of
Total
Portfolio
Duration
(years) Rating1
2020
U.S. government obligations $ 12,740.0 26.8 % 3.3 AAA
State and local government obligations 3,221.8 6.8 4.4 AA
Corporate debt securities 10,185.2 21.4 3.8 BBB
Residential mortgage-backed securities 509.5 1.1 1.0 AA
Commercial mortgage-backed securities 6,175.1 13.0 3.2 AA-
Other asset-backed securities 3,784.6 7.9 1.0 AA+
Preferred stocks 1,642.6 3.5 3.6 BBB-
Short-term investments 5,218.5 11.0 <0.1 AA
Total fixed-income securities 43,477.3 91.5 2.9 AA-
Common equities 4,053.0 8.5 na na
Total portfolio2 $ 47,530.3 100.0 % 2.9 AA-
2019
U.S. government obligations $ 13,251.1 33.7 % 4.9 AAA
State and local government obligations 1,713.3 4.4 3.1 AA+
Corporate debt securities 7,067.7 18.0 2.7 BBB
Residential mortgage-backed securities 627.5 1.6 0.9 AA
Commercial mortgage-backed securities 5,076.2 12.9 2.0 AA
Other asset-backed securities 5,179.5 13.2 0.8 AAA-
Preferred stocks 1,233.9 3.2 2.6 BBB-
Short-term investments 1,798.8 4.6 0.1 AA-
Total fixed-income securities 35,948.0 91.6 3.0 AA
Common equities 3,306.3 8.4 na na
Total portfolio2 $ 39,254.3 100.0 % 3.0 AA
na = not applicable1 Represents ratings at December 31, 2020 and 2019. Credit quality ratings are assigned by nationally recognized statistical rating organizations.To calculate the weighted average credit quality ratings, we weight individual securities based on fair value and assign a numeric score of 0-5, withnon-investment-grade and non-rated securities assigned a score of 0-1. To the extent the weighted average of the ratings falls between AAA andAA+, we assign an internal rating of AAA-.
2 Our portfolio reflects the effect of net unsettled security transactions; at December 31, 2020, $95.5 million was included in “other liabilities,”compared to $11.9 million at December 31, 2019.
The total fair value of the portfolio at December 31, 2020 and 2019, included $6.2 billion and $3.2 billion, respectively, of securities held in aconsolidated, non-insurance subsidiary of the holding company, net of any unsettled security transactions. A portion of these investments weresold and proceeds used to pay our common share dividends, see Note 14 – Dividends for additional information.
Our asset allocation strategy is to maintain 0-25% of ourportfolio in Group I securities, with the balance(75%-100%) of our portfolio in Group II securities.
We define Group I securities to include:• common equities,• nonredeemable preferred stocks,• redeemable preferred stocks, except for 50% of
investment-grade redeemable preferred stocks withcumulative dividends, which are included inGroup II, and
• all other non-investment-grade fixed-maturitysecurities.
App.-A-66

Group II securities include:• short-term securities, and• all other fixed-maturity securities, including 50% of
investment-grade redeemable preferred stocks withcumulative dividends.
We believe this asset allocation strategy allows us toappropriately assess the risks associated with thesesecurities for capital purposes and is in line with thetreatment by our regulators.
The following table shows the composition of our Group I and Group II securities at December 31:
2020 2019
($ in millions) Fair Value
% of Total
Portfolio Fair Value
% of Total
Portfolio
Group I securities:
Non-investment-grade fixed maturities $ 1,006.4 2.1 % $ 327.2 0.8 %
Redeemable preferred stocks1 97.3 0.2 117.6 0.3
Nonredeemable preferred stocks 1,447.9 3.1 1,038.9 2.7
Common equities 4,053.0 8.5 3,306.3 8.4
Total Group I securities 6,604.6 13.9 4,790.0 12.2
Group II securities:
Other fixed maturities 35,707.2 75.1 32,665.5 83.2
Short-term investments 5,218.5 11.0 1,798.8 4.6
Total Group II securities 40,925.7 86.1 34,464.3 87.8
Total portfolio $ 47,530.3 100.0 % $ 39,254.3 100.0 %
1 Included non-investment-grade redeemable preferred stocks of $40.2 million at December 31, 2019; we held no non-investment-graderedeemable preferred stocks at December 31, 2020.
To determine the allocation between Group I and GroupII, we use the credit ratings from models provided by theNational Association of Insurance Commissioners(NAIC) for classifying our residential and commercialmortgage-backed securities, excluding interest-onlysecurities, and the credit ratings from nationallyrecognized statistical rating organizations (NRSROs) forall other debt securities.
NAIC ratings are based on a model that considers thebook price of our securities when assessing theprobability of future losses in assigning a credit rating.As a result, NAIC ratings can vary from credit ratingsissued by NRSROs. Management believes NAIC ratingsmore accurately reflect our risk profile when determiningthe asset allocation between Group I and II securities.
Unrealized Gains and Losses
As of December 31, 2020, our fixed-maturity portfoliohad pretax net unrealized gains, recorded as part ofaccumulated other comprehensive income, of$1,206.6 million, compared to $459.4 million atDecember 31, 2019. The change from December 2019,reflected decreasing interest rates, which resulted in
valuation increases in all fixed-maturity sectors, mostprominently in the U.S. government, municipal, andcorporate portfolios.
See Note 2 – Investments for further details on ourgross unrealized gains (losses).
App.-A-67

Holding Period Gains (Losses)
The following table provides the balance and activity for both the gross and net holding period gains (losses) for 2020:
(millions)
Gross Holding
Period Gains
Gross Holding
Period Losses
Net Holding
Period Gains
(Losses)
Balance at December 31, 2019
Hybrid fixed-maturity securities $ 7.8 $ 0 $ 7.8
Equity securities 2,263.9 (15.5) 2,248.4
Total holding period securities 2,271.7 (15.5) 2,256.2
Current year change in holding period securities
Hybrid fixed-maturity securities 7.4 0 7.4
Equity securities 697.6 8.9 706.5
Total changes in holding period securities 705.0 8.9 713.9
Balance at December 31, 2020
Hybrid fixed-maturity securities 15.2 0 15.2
Equity securities 2,961.5 (6.6) 2,954.9
Total holding period securities $ 2,976.7 $ (6.6) $ 2,970.1
Changes in holding period gains (losses), similar to unrealized gains (losses) in our fixed-maturity portfolio, are theresult of changes in market performance as well as sales of securities based on various portfolio managementdecisions.
Fixed-Income Securities
The fixed-income portfolio is managed internally andincludes fixed-maturity securities, short-terminvestments, and nonredeemable preferred stocks.Following are the primary exposures for the fixed-income portfolio.
Interest Rate Risk This risk includes the change in valueresulting from movements in the underlying market ratesof debt securities held. We manage this risk bymaintaining the portfolio’s duration (a measure of theportfolio’s exposure to changes in interest rates) between1.5 and 5 years. The duration of the fixed-incomeportfolio was 2.9 years at December 31, 2020, comparedto 3.0 years at December 31, 2019. The distribution ofduration and convexity (i.e., a measure of the speed atwhich the duration of a security is expected to changebased on a rise or fall in interest rates) is monitored on aregular basis.
The duration distribution of our fixed-income portfolio,excluding short-term investments, represented by theinterest rate sensitivity of the comparable benchmarkU.S. Treasury Notes, at December 31, was:
Duration Distribution 2020 2019
1 year 19.5 % 23.9 %
2 years 18.7 11.8
3 years 24.9 20.6
5 years 18.5 23.1
7 years 10.9 15.1
10 years 7.5 5.5
Total fixed-income portfolio 100.0 % 100.0 %
Credit Rate Risk This exposure is managed bymaintaining an A+ minimum average portfolio creditquality rating, as defined by NRSROs. Our credit qualityrating was above the minimum threshold during both2020 and 2019.
App.-A-68

The credit quality distribution of the fixed-incomeportfolio at December 31, was:
Rating 2020 2019
AAA 53.3 % 60.8 %
AA 9.8 9.9
A 11.1 7.9
BBB 22.9 19.5
Non-investment grade/non-rated:1
BB 2.4 1.4
B 0.2 0.3
CCC and lower 0.1 0
Non-rated 0.2 0.2
Total fixed-income portfolio 100.0 % 100.0 %1 The ratings in the table above are assigned by NRSROs. Thenon-investment grade fixed-income securities based upon our Group Iclassification represented 2.9% of the total fixed-income portfolio atDecember 31, 2020, compared to 1.7% at December 31, 2019.
Concentration Risk Our investment constraints limitinvestment in a single issuer, other than U.S. TreasuryNotes or a state’s general obligation bonds, to 2.5% ofshareholders’ equity, while the single issuer guidelineon preferred stocks and/or non-investment-grade debtis 1.25% of shareholders’ equity. Additionally, theguideline applicable to any state’s general obligationbonds is 6% of shareholders’ equity. We considerconcentration risk both overall and in the context ofindividual asset classes and sectors, including but notlimited to common equities, residential and commercialmortgage-backed securities, municipal bonds, and high-yield bonds. At December 31, 2020 and 2019, we werewithin all of the constraints described above.
Prepayment and Extension Risk We are exposed to thisrisk especially in our asset-backed (i.e., structuredproduct) and preferred stock portfolios. Prepayment risk
includes the risk of early redemption of security principalthat may need to be reinvested at less attractive rates.Extension risk includes the risk that a security will not beredeemed when anticipated, and that the security that isextended will have a lower yield than a security wemight be able to obtain by reinvesting the expectedredemption principal. Our holdings of different types ofstructured debt and preferred securities help managethis risk. During 2020 and 2019, we did not experiencesignificant adverse prepayment or extension of principalrelative to our cash flow expectations in the portfolio.
Liquidity Risk Our overall portfolio remains very liquidand we believe that it is sufficient to meet expectednear-term liquidity requirements. Theshort-to-intermediate duration of our portfolio provides asource of liquidity, as we expect approximately$4.9 billion, or 19.3%, of principal repayment from ourfixed-income portfolio, excluding U.S. Treasury Notesand short-term investments, during 2021. Cash frominterest and dividend payments provides an additionalsource of recurring liquidity.
The duration of our U.S. government obligations, whichare included in the fixed-income portfolio, wascomprised of the following at December 31, 2020:
($ in millions)Fair
ValueDuration(years)
U.S. Treasury Notes
Less than one year $ 895.3 0.5
One to two years 3,377.1 1.6
Two to three years 3,208.1 2.6
Three to five years 3,428.2 4.2
Five to seven years 850.4 6.2
Seven to ten years 980.9 8.5Total U.S. Treasury Notes $12,740.0 3.3
App.-A-69

ASSET-BACKED SECURITIESIncluded in the fixed-income portfolio are asset-backed securities, which were comprised of the following atDecember 31:
($ in millions)
Fair
Value
Net Unrealized
Gains
(Losses)
% of Asset-
Backed
Securities
Duration
(years)
Rating
(at period
end)1
2020
Residential mortgage-backed securities $ 509.5 $ 6.2 4.9 % 1.0 AA
Commercial mortgage-backed securities 6,175.1 132.5 59.0 3.2 AA-
Other asset-backed securities 3,784.6 39.6 36.1 1.0 AA+
Total asset-backed securities $ 10,469.2 $ 178.3 100.0 % 2.3 AA
2019
Residential mortgage-backed securities $ 627.5 $ 2.5 5.8 % 0.9 AA
Commercial mortgage-backed securities 5,076.2 55.5 46.6 2.0 AA
Other asset-backed securities 5,179.5 14.8 47.6 0.8 AAA-
Total asset-backed securities $ 10,883.2 $ 72.8 100.0 % 1.4 AA+
1The credit quality ratings are assigned by NRSROs.
Residential Mortgage-Backed Securities (RMBS) The following table details the credit quality rating and fair value ofour RMBS, along with the loan classification and a comparison of the fair value at December 31, 2020, to our originalinvestment value (adjusted for returns of principal, amortization, and write-downs):
Residential Mortgage-Backed Securities (at December 31, 2020)
($ in millions)
Rating1 Non-Agency Government/GSE2 Total
% of
Total
AAA $ 339.6 $1.9 $ 341.5 67.0 %
AA 79.6 0.6 80.2 15.8
A 30.4 0 30.4 6.0
BBB 11.1 0 11.1 2.2
Non-investment grade/non-rated:
BB 1.2 0 1.2 0.2
B 11.4 0 11.4 2.2
CCC and lower 9.7 0 9.7 1.9
Non-rated 24.0 0 24.0 4.7
Total fair value $ 507.0 $ 2.5 $ 509.5 100.0 %
Increase (decrease) in value 1.2 % 8.3 % 1.2 %
1The credit quality ratings are assigned by NRSROs; when we assign the NAIC ratings for our RMBS, $40.5 million of our non-investment-gradesecurities are rated investment grade and classified as Group II and $5.8 million, or 1.1% of our total RMBS, are not rated by the NAIC and areclassified as Group I.
2The securities in this category are insured by a Government Sponsored Entity (GSE) and/or collateralized by mortgage loans insured by theFederal Housing Administration (FHA) or the U.S. Department of Veteran Affairs (VA).
In the residential mortgage-backed sector, our portfolio consists of deals that are backed by high-credit qualityborrowers or have strong structural protections through underlying loan collateralization. In our view, the risk/rewardpotential during 2020 was lower in this portfolio relative to other comparable investments.
App.-A-70

Commercial Mortgage-Backed Securities (CMBS) The following table details the credit quality rating and fair value ofour CMBS, along with a comparison of the fair value at December 31, 2020, to our original investment value (adjustedfor returns of principal, amortization, and write-downs):
Commercial Mortgage-Backed Securities (at December 31, 2020)
($ in millions)Rating1 Multi-Borrower Single-Borrower Total
% ofTotal
AAA $ 456.9 $ 2,178.4 $2,635.3 42.7 %
AA 27.7 1,625.2 1,652.9 26.8
A 42.2 951.7 993.9 16.1
BBB 33.6 759.7 793.3 12.8
Non-investment grade/non-rated:
BB 16.0 83.3 99.3 1.6
B 0.4 0 0.4 0
Total fair value $ 576.8 $ 5,598.3 $6,175.1 100.0 %
Increase (decrease) in value 3.1 % 2.1 % 2.2 %
1The credit quality ratings are assigned by NRSROs; when we assign the NAIC ratings for our CMBS, $35.3 million of our investment-gradesecurities are rated non-investment grade and classified as Group I, resulting in $135.0 million, or 2.2% of our total CMBS, being classified asGroup I.
The CMBS portfolio experienced significant volatility in2020. Throughout the year, our purchases and saleswere contingent on overall spread levels. In thebeginning of the year, spreads were reasonably tightand we selectively added securities in the new issuemarket while scaling back on positions that hadperformed well or were no longer core to our strategy.When spreads widened significantly through the secondquarter, we added securities both in the new issue and
secondary single-asset single-borrower (SASB) marketsas well as selectively added new issue securities inother segments. As spreads tightened in the third andfourth quarters of 2020, we continued to add to theportfolio, albeit at a more measured pace. Toward theend of the year, spreads were in a more balancedrange, so we adjusted our holdings based on relativevalue and our view of the underlying credits.
Other Asset-Backed Securities (OABS) The following table details the credit quality rating and fair value of our OABS,along with a comparison of the fair value at December 31, 2020, to our original investment value (adjusted for returnsof principal, amortization, and write-downs):
Other Asset-Backed Securities (at December 31, 2020)
($ in millions)Rating Automobile Credit Card Student Loan
Whole BusinessSecuritizations Equipment Other Total
% ofTotal
AAA $1,267.6 $ 336.5 $ 206.9 $ 0 $ 752.2 $ 264.5 $ 2,827.7 74.7 %
AA 165.9 0 26.6 0 101.3 16.1 309.9 8.2
A 38.0 0 10.2 0 131.2 61.6 241.0 6.4
BBB 2.5 0 0 403.5 0 0 406.0 10.7
Total fairvalue $1,474.0 $ 336.5 $ 243.7 $ 403.5 $ 984.7 $ 342.2 $ 3,784.6 100.0 %
Increase(decrease)in value 0.7 % 0.6 % 1.6 % 1.9 % 1.4 % 0.9 % 1.1 %
As valuations across other asset classes were more attractive since March 2020, our OABS portfolio offered lessrelative value. We selectively added across the spectrum to our portfolio, mainly through the new issue market. Weprimarily focused on auto, equipment, credit card backed, and student loans. Due to amortization and scheduledpaydowns, our portfolio decreased during the year.
App.-A-71

MUNICIPAL SECURITIES
The following table details the credit quality rating of ourmunicipal securities at December 31, 2020, without thebenefit of credit or bond insurance:
Municipal Securities (at December 31, 2020)
(millions)Rating
GeneralObligations
RevenueBonds Total
AAA $ 627.7 $ 328.5 $ 956.2
AA 471.3 1,029.0 1,500.3
A 0 763.7 763.7
BBB 0 1.6 1.6
Total $ 1,099.0 $ 2,122.8 $ 3,221.8
Included in revenue bonds were $538.0 million ofsingle-family housing revenue bonds issued by statehousing finance agencies, of which $383.1 million weresupported by individual mortgages held by the state
housing finance agencies and $154.9 million weresupported by mortgage-backed securities. Of theprograms supported by mortgage-backed securities,approximately 25% were collateralized by Fannie Maeand Freddie Mac mortgages; the remaining 75% werecollateralized by Ginnie Mae mortgages, which are fullyguaranteed by the U.S. government.
Of the programs supported by individual mortgages heldby the state housing finance agencies, the overall creditquality rating was AA+. Most of these mortgages weresupported by FHA, VA, or private mortgage insuranceproviders. Throughout 2020, we added high-creditquality rated state general obligations, water and sewer,airport, and higher education revenue bonds. We alsoincreased our focus on the taxable portion of themunicipal market, which continued to grow and wasmore attractive to us on a relative basis.
CORPORATE SECURITIESThe following table details the credit quality rating of our corporate securities at December 31, 2020:
Corporate Securities (at December 31, 2020)
(millions)
Rating Consumer Industrial Communication
Financial
Services Technology
Basic
Materials Energy Total
AAA $ 0 $ 0 $ 0 $ 30.1 $ 0 $ 0 $ 0 $ 30.1
AA 152.9 0 0 144.6 26.2 0 8.1 331.8
A 579.2 101.5 233.2 1,038.6 286.1 129.5 67.3 2,435.4
BBB 2,340.8 1,580.2 172.9 1,281.8 358.2 44.0 743.9 6,521.8
Non-investmentgrade/non-rated:
BB 268.6 122.4 79.5 90.7 129.8 23.1 40.1 754.2
B 77.7 2.1 0 0 0 0 0 79.8
CCC andlower 32.1 0 0 0 0 0 0 32.1
Totalfairvalue $ 3,451.3 $ 1,806.2 $ 485.6 $ 2,585.8 $ 800.3 $ 196.6 $ 859.4 $ 10,185.2
During the first half of 2020, we took advantage of moreattractive credit spreads prevailing in the market andincreased the size of our corporate portfolio and itsduration. As credit spreads narrowed later in the year,we sold some positions for which we believed the risk/reward for holding the positions was no longer justified.
Overall, our corporate securities are a larger percentageof the fixed-income portfolio when compared to last year.
At December 31, 2020, the portfolio was 23.4% of ourfixed-income portfolio, compared to 19.7% atDecember 31, 2019. We increased the size of thisportfolio as we felt supportive fiscal and monetary policywould create an environment that would be conducive toa further compression in credit spreads. In addition, welengthened our duration during the year and ended 2020at 3.8 years, compared to 2.7 years at the end of 2019.
App.-A-72

PREFERRED STOCKS – REDEEMABLE AND NONREDEEMABLE
The table below shows the exposure break-down for our preferred stocks by sector and rating at year end:Preferred Stocks (at December 31, 2020)
Financial services
(millions)Rating U.S. Banks
ForeignBanks Insurance
OtherFinancial Industrials Utilities Total
A $ 51.2 $ 0 $ 0 $ 9.6 $ 0 $ 0 $ 60.8
BBB 979.5 0 148.0 48.2 131.4 11.7 1,318.8
Non-investment grade/non-rated:
BB 25.8 119.3 0 0 24.3 41.9 211.3
Non-rated 0 0 0 35.0 16.7 0 51.7
Total fair value $ 1,056.5 $ 119.3 $ 148.0 $ 92.8 $ 172.4 $ 53.6 $ 1,642.6
The majority of our preferred securities have fixed-ratedividends until a call date and then, if not called,generally convert to floating-rate dividends. The interestrate duration of our preferred securities is calculated toreflect the call, floor, and floating-rate features. Althougha preferred security will remain outstanding if not called,its interest rate duration will reflect the variable nature ofthe dividend. Our non-investment-grade preferredstocks were with issuers that maintain investment-gradesenior debt ratings.
We also face the risk that dividend payments on ourpreferred stock holdings could be deferred for one or
more periods or skipped entirely. As of December 31,2020, all of our preferred securities continued to paytheir dividends in full and on time. Approximately 79% ofour preferred stock securities pay dividends that havetax preferential characteristics, while the balance paydividends that are fully taxable.
During 2020, we added to our preferred stock portfolio,primarily purchasing nonredeemable preferredsecurities. The portfolio valuation improved fromdeclines earlier in 2020, as equities increased, creditspreads narrowed, and investor sentiment improved.
Common Equities
Common equities, as reported on the consolidated balance sheets at December 31, were comprised of the following:
($ in millions) 2020 2019
Common stocks $4,049.9 99.9 % $3,306.0 100.0 %
Other risk investments 3.1 0.1 0.3 0
Total common equities $4,053.0 100.0 % $3,306.3 100.0 %
The majority of our common stock portfolio consists ofindividual holdings selected based on their contributionto the correlation with the Russell 1000 Index. We held854 out of 1,017, or 84%, of the common stockscomprising the index at December 31, 2020, whichmade up 96% of the total market capitalization of theindex. At December 31, 2020, the year-to-date totalreturn of the indexed portfolio, based on GAAP income,was within the designated tracking error, which is +/- 50basis points. In addition to the indexed portfolio, ourcommon stock portfolio includes other common stocks
we may hold, including one of our preferred stockholdings that went public as a common stock toward theend of the year and recognized a significant increase invalue following the public offering.
The other risk investments consist of limited partnershipinterests. During 2020, we funded $0.4 million on apartnership investment and have an open fundingcommitment of $7.2 million at December 31, 2020 onthis investment.
App.-A-73

The following is a summary of our indexed common stock portfolio holdings by sector compared to the Russell 1000Index composition:
Sector
Equity PortfolioAllocation at
December 31, 2020
Russell 1000Allocation at
December 31, 2020Russell 1000 Sector
Return in 2020
Consumer discretionary 16.9 % 18.0 % 42.9 %
Consumer staples 5.3 5.4 7.1
Financial services 10.4 9.8 7.2
Health care 12.5 12.7 17.1
Materials and processing 1.7 1.9 17.6
Other energy 2.4 2.2 (30.8)
Producer durable 14.0 13.5 11.8
Real estate 3.1 3.0 (6.5)
Technology 27.3 27.0 46.7
Telecommunications 3.7 3.7 0.7
Utilities 2.7 2.8 (0.1)
Total common stocks 100.0 % 100.0 % 21.0 %
For 2020, our common stock portfolio FTE total return was 24.3%, compared to 21.0% for the Russell 1000 Index,due to common stocks we hold outside of the index, as discussed above.
V. CRITICAL ACCOUNTING POLICIES
Progressive is required to make certain estimates andassumptions when preparing its financial statementsand accompanying notes in conformity with GAAP.Actual results could differ from those estimates in avariety of areas. The two areas we view as most criticalwith respect to the application of estimates andassumptions is the establishment of our loss reservesand the methods for measuring expected credit losseson financial instruments.
A. Loss and LAE Reserves
Loss and loss adjustment expense (LAE) reservesrepresent our best estimate of our ultimate liability forlosses and LAE relating to events that occurred prior tothe end of any given accounting period but have not yetbeen paid. At December 31, 2020, we had $16.5 billionof net loss and LAE reserves, which included$13.2 billion of case reserves and $3.3 billion ofincurred but not recorded (IBNR) reserves. Personalauto liability and commercial auto liability reservesrepresent approximately 94% of our total carried netreserves. For this reason, the following discussionfocuses on our vehicle businesses.
We do not review our loss reserves on a macro leveland, therefore, do not derive a companywide range of
reserves to compare to a standard deviation. Instead,we review a large majority of our reserves by product/state subset combinations on a quarterly time frame,with the remaining reserves generally reviewed on asemiannual basis. A change in our scheduled reviews ofa particular subset of the business depends on the sizeof the subset or emerging issues relating to the productor state. By reviewing the reserves at such a detailedlevel, we have the ability to identify and measurevariances in the trends by state, product, and linecoverage that otherwise would not be seen on aconsolidated basis. We believe our comprehensiveprocess of reviewing at a subset level provides us moremeaningful estimates of our aggregate loss reserves.
In analyzing the ultimate accident year loss and LAEexperience, our actuarial staff reviews in detail, at thesubset level, frequency (number of losses per earnedcar year), severity (dollars of loss per each claim), andaverage premium (dollars of premium per earned caryear), as well as the frequency and severity of our LAEcosts. The loss ratio, a primary measure of lossexperience, is equal to the product of frequency timesseverity divided by the average premium. The averagepremium for personal and commercial auto businessesis not estimated. The actual frequency experienced willvary depending on the change in the mix in class of
App.-A-74

drivers we insure, but the frequency projections for theselines of business are generally stable in the short term,because a large majority of the parties involved in anaccident report their claims within a short time periodafter the occurrence. The severity experienced byProgressive is much more difficult to estimate, especiallyfor injury claims, since severity is affected by changes inunderlying costs, such as medical costs, jury verdicts,and regulatory changes. In addition, severity will varyrelative to the change in our mix of business by limit.
Assumptions regarding needed reserve levels made bythe actuarial staff take into consideration influences onavailable historical data that reduce the predictivenessof our projected future loss costs. Internalconsiderations that are process-related, which generallyresult from changes in our claims organization’sactivities, include claim closure rates, the number ofclaims that are closed without payment, and the level ofthe claims representatives’ estimates of the neededcase reserve for each claim. These changes and theireffect on the historical data are studied at the state levelversus on a larger, less indicative, countrywide basis.
External items considered include the litigationatmosphere, changes in medical costs, and theavailability of services to resolve claims. These also arebetter understood at the state level versus at a moremacro, countrywide level. The impact COVID-19 has onthe items above, as well as additional considerationssuch as the type of accident and change in reportingpatterns, are closely monitored.
At December 31, 2020, Progressive had $20.3 billion ofcarried gross reserves and $16.5 billion of net reserves(net of reinsurance recoverables on unpaid losses). Ournet reserve balance implicitly assumes that the loss andLAE severity for accident year 2020 over accident year2019 would be 11.9% higher for personal auto liabilityand 12.3% higher for commercial auto liability. Asdiscussed above, the severity estimates are influencedby many variables that are difficult to precisely quantifyand which influence the final amount of claimssettlements. That, coupled with changes in internalclaims practices, the legal environment, and stateregulatory requirements, requires significant judgment inthe estimate of the needed reserves to be carried.
The following table highlights what the effect would be to our carried loss and LAE reserves, on a net basis, as ofDecember 31, 2020, if during 2021 we were to experience the indicated change in our estimate of severity for the2020 accident year (i.e., claims that occurred in 2020):
Estimated Changes in Severity for Accident Year 2020
(millions) -4% -2% As Reported +2% +4%
Personal auto liability $ 11,244.9 $ 11,492.1 $ 11,739.3 $ 11,986.5 $ 12,233.7Commercial auto liability 3,675.6 3,723.2 3,770.8 3,818.4 3,866.0Other1 957.5 957.5 957.5 957.5 957.5
Total $ 15,878.0 $ 16,172.8 $ 16,467.6 $ 16,762.4 $ 17,057.2
1Includes reserves for personal and commercial auto physical damage claims and our non-auto lines of business; no change in estimates ispresented due to the immaterial level of these reserves.
Note: Every percentage point change in our estimate of severity for the 2020 accident year would affect our personal auto liability reserves by$123.6 million and our commercial auto reserves by $23.8 million.
Our 2020 year-end loss and LAE reserve balance also includes claims from prior years. Claims that occurred in 2020,2019, and 2018, in the aggregate, accounted for approximately 93% of our reserve balance. If during 2021 we were toexperience the indicated change in our estimate of severity for the total of the prior three accident years (i.e., 2020,2019, and 2018), the effect to our year-end 2020 reserve balances would be as follows:
Estimated Changes in Severity for Accident Years 2020, 2019, and 2018
(millions) -4% -2% As Reported +2% +4%
Personal auto liability $ 10,250.1 $ 10,994.7 $ 11,739.3 $ 12,483.9 $ 13,228.5
Commercial auto liability 3,501.6 3,636.2 3,770.8 3,905.4 4,040.0
Other1 957.5 957.5 957.5 957.5 957.5
Total $ 14,709.2 $ 15,588.4 $ 16,467.6 $ 17,346.8 $ 18,226.0
1 Includes reserves for personal and commercial auto physical damage claims and our non-auto lines of business; no change in estimates ispresented due to the immaterial level of these reserves.
Note: Every percentage point change in our estimate of severity for the 2020, 2019, and 2018 accident years would affect our personal autoliability reserves by $372.3 million and our commercial auto reserves by $67.3 million.
App.-A-75

Our best estimate of the appropriate amount for ourreserves as of year-end 2020 is included in our financialstatements for the year. Our goal is to ensure that totalreserves are adequate to cover all loss costs, whilesustaining minimal variation from the time reserves areinitially established until losses are fully developed. Atthe point in time when reserves are set, we have noway of knowing whether our reserve estimates willprove to be high or low, or whether one of thealternative scenarios discussed above is “reasonablylikely” to occur. The above tables show the potentialfavorable or unfavorable development we will realize ifour estimates miss by 2% or 4%.
B. Credit Losses on Financial Instruments
An allowance for credit losses is established when theultimate realization of a financial instrument isdetermined to be impaired due to a credit event.Measurement of expected credit losses is based onjudgment when considering relevant information aboutpast events, including historical loss experience, currentconditions, and forecasts of the collectability of thereported financial instrument. The allowance forexpected credit losses is measured and recorded at thepoint ultimate recoverability of the financial instrument isexpected to be impaired, including upon the initialrecognition of the financial instrument, where warranted.We evaluate financial instrument credit losses related toour available-for-sale securities, reinsurancerecoverables, and premiums receivables.
Available-For-Sale Securities
We routinely monitor our fixed-maturity portfolio forpricing changes that might indicate potential losses existand perform detailed reviews of securities with unrealizedlosses to determine if an allowance for credit losses, achange to an existing allowance (recovery or additionalloss), or a write-off for an amount deemed uncollectibleneeds to be recorded. In such cases, changes in fairvalue are evaluated to determine the extent to whichsuch changes are attributable to: (i) credit related losses,which are specific to the issuer (e.g., financial conditions,business prospects) where the present value of cashflows expected to be collected is lower than theamortized cost basis of the security or (ii) market relatedfactors, such as interest rates or credit spreads.
If we do not expect to hold the security to allow for apotential recovery of those expected losses, we willwrite off the security to fair value and recognize arealized loss in the comprehensive income statement.
For securities whose losses are credit related losses,and for which we do not intend to sell in the near term,
we will review the non-market components to determineif a potential future credit loss exists, based on existingfinancial data available related to the fixed-maturitysecurities. If we anticipate that a credit loss exists, wewill record an allowance for the credit loss andrecognize a realized loss in the comprehensive incomestatement. For all securities for which an allowance forcredit losses has been established, we will re-evaluatethe securities, at least quarterly, to determine if furtherdeterioration has occurred or if we project a subsequentrecovery in the expected losses, which would require anadjustment to the allowance for credit losses. To theextent we determine that we will likely sell a securityprior to recovery of the credit loss, or if the loss isdeemed uncollectible, we will write-down the security toits fair value and reverse any credit loss allowance thatmay have been previously recorded.
For an unrealized loss that is determined to be relatedto current market conditions, we will not record anallowance for credit losses or a write-off of the fairvalue. We will continue to monitor these securities todetermine if underlying factors other than the currentmarket conditions are contributing to the loss in value.
Based on an analysis of our fixed-maturity portfolio, wehave determined our allowance for credit losses relatedto available-for-sale securities was not material to ourfinancial condition or results of operations for the periodending December 31, 2020.
Reinsurance Recoverables
We routinely monitor changes in the credit quality andconcentration risks of the reinsurers who are counterparties to our reinsurance recoverables. AtDecember 31, 2020, approximately 75% of ourreinsurance recoverables were held in severalmandatory state pools, including the MichiganCatastrophic Claims Association, Florida HurricaneCatastrophe Fund, and North Carolina ReinsuranceFacility, and in plans where we act as a servicing agentto state-mandated involuntary plans for commercialvehicles (Commercial Automobile InsuranceProcedures/Plans) and as a participant in the “WriteYour Own” program for federally regulated plans forflood (National Flood Insurance Program). All of theseprograms are governed by insurance regulations. Theremaining balance of our recoverables are composed ofvoluntary external contractual arrangements thatprimarily relate to the Property business and to ourtransportation network company (TNC) business writtenby our Commercial Lines business. For these privatelyplaced reinsurance arrangements, we regularly monitorreinsurer credit strength and analyze our reinsurance
App.-A-76

recoverable balances for expected credit losses at leastquarterly, or more frequently if indicators of reinsurercredit deterioration, either individually or in aggregate,exists. For at-risk uncollateralized recoverable balances,we evaluate a number of reinsurer specific factors,including reinsurer credit quality rating, credit ratingoutlook, historical experience, reinsurer surplus,recoverable duration, and collateralization compositionin respect to our net exposure (i.e., the reinsurancerecoverable amount less premiums payable to thereinsurer, where the right to offset exists). Based on thisassessment, reinsurers with credit risks will beindividually subject to a credit default model, and anallowance for credit loss will be established, wherewarranted.
Based on the analysis of reinsurers, we havedetermined our allowance for credit losses related to our
reinsurance recoverables was not material to ourfinancial condition or results of operations for the periodending December 31, 2020.
Premium Receivables
We routinely monitor historical premium collections datafor our premiums receivable balances, through actuarialanalyses, to project the future recoverability of recordedreceivables. As part of these analyses, we determinehistorical collectability rates and modify those ratesbased on current economic assumptions to establishestimates on default. These rates are applied to thestratified subsets of our consumer receivable balances,based on the age of the receivable to establish anallowance for credit losses. See Note 1 – Reporting andAccounting Policies for a description of our process anda rollforward of the allowance account during 2020 and2019.
App.-A-77

Safe Harbor Statement Under the Private Securities Litigation Reform Act of 1995: Investors are cautioned thatcertain statements in this report not based upon historical fact are forward-looking statements as defined in thePrivate Securities Litigation Reform Act of 1995. These statements often use words such as “estimate,” “expect,”“intend,” “plan,” “believe,” and other words and terms of similar meaning, or are tied to future periods, in connectionwith a discussion of future operating or financial performance. Forward-looking statements are based on currentexpectations and projections about future events, and are subject to certain risks, assumptions and uncertainties thatcould cause actual events and results to differ materially from those discussed herein. These risks and uncertaintiesinclude, without limitation, uncertainties related to:
• our ability to underwrite and price risks accurately and to charge adequate rates to policyholders;• our ability to establish accurate loss reserves;• the impact of severe weather, other catastrophe events and climate change;• the effectiveness of our reinsurance programs;• the highly competitive nature of property-casualty insurance markets;• whether we innovate effectively and respond to our competitors’ initiatives;• whether we effectively manage complexity as we develop and deliver products and customer experiences;• how intellectual property rights could affect our competitiveness and our business operations;• whether we adjust claims accurately;• our ability to maintain a recognized and trusted brand;• our ability to attract, develop and retain talent and maintain appropriate staffing levels;• compliance with complex laws and regulations;• litigation challenging our business practices, and those of our competitors and other companies;• the impacts of a security breach or other attack involving our computer systems or the systems of one or
more of our vendors;• the secure and uninterrupted operation of the facilities, systems, and business functions that are critical to our
business;• the success of our efforts to develop new products or enter into new areas of business and navigate related risks;• our continued ability to send and accept electronic payments;• the possible impairment of our goodwill or intangible assets;• the performance of our fixed-income and equity investment portfolios;• the potential elimination of, or change in, the London Interbank Offered Rate;• our continued ability to access our cash accounts and/or convert securities into cash on favorable terms;• the impact if one or more parties with which we enter into significant contracts or transact business fail to perform;• legal restrictions on our insurance subsidiaries’ ability to pay dividends to The Progressive Corporation;• limitations on our ability to pay dividends on our common shares under the terms of our outstanding preferred
shares;• our ability to obtain capital when necessary to support our business and potential growth;• evaluations by credit rating and other rating agencies;• the variable nature of our common share dividend policy;• whether our investments in certain tax-advantaged projects generate the anticipated returns;• the impact from not managing to short-term earnings expectations in light of our goal to maximize the long-term
value of the enterprise;• impacts from the outbreak of the novel coronavirus, or COVID-19, and the restrictions put in place to help slow and/
or stop the spread of the virus; and• other matters described from time to time in our releases and publications, and in our periodic reports and other
documents filed with the United States Securities and Exchange Commission, including, without limitation, the RiskFactors section of our Annual Report on Form 10-K for the year ending December 31, 2020.
In addition, investors should be aware that generally accepted accounting principles prescribe when a company mayreserve for particular risks, including litigation exposures. Accordingly, results for a given reporting period could besignificantly affected if and when we establish reserves for one or more contingencies. Also, our regular reservereviews may result in adjustments of varying magnitude as additional information regarding claims activity becomesknown. Reported results, therefore, may be volatile in certain accounting periods.
App.-A-78

Supplemental Information
The Progressive Corporation and SubsidiariesQuarterly Financial and Common Share Data
(unaudited)
(millions – except per share amounts) Stock Price1
QuarterTotal
RevenuesNet
Income
Net IncomeAttributable to
Progressive2
PerCommon
Share3 CloseRate ofReturn4
DividendsDeclared Per
CommonShare4
2020
1 $ 9,323.4 $ 699.1 $ 692.7 $ 1.17 $ 73.84 $ 0.10
2 10,971.7 1,790.4 1,790.4 3.04 80.11 0.10
3 10,947.2 1,530.8 1,530.8 2.59 94.67 0.10
4 11,415.8 1,684.3 1,684.3 2.85 98.88 4.60
$42,658.1 $5,704.6 $ 5,704.6 $ 9.66 $ 98.88 41.4% $ 4.90
2019
1 $ 9,300.0 $1,082.8 $ 1,078.4 $ 1.83 $ 72.09 $ 0.10
2 9,450.7 979.0 979.4 1.66 79.93 0.10
3 9,530.5 843.6 841.7 1.42 77.25 0.10
4 10,741.1 1,074.6 1,070.8 1.81 72.39 2.35
$39,022.3 $3,980.0 $ 3,970.3 $ 6.72 $ 72.39 25.1% $ 2.65
2018
1 $ 7,430.1 $ 729.8 $ 718.0 $ 1.22 $ 60.93 $ 0
2 8,018.0 701.2 704.2 1.19 59.15 0
3 8,495.8 930.2 928.4 1.57 71.04 0
4 8,035.1 259.8 264.7 0.44 60.33 2.5140
$31,979.0 $2,621.0 $ 2,615.3 $ 4.42 $ 60.33 9.3% $ 2.5140
1Prices are as reported on the New York Stock Exchange (NYSE). Progressive’s common shares are listed under the symbol PGR.
2The 2020 sum does not equal the total due to the reclassification of $6.4 million of income attributable to noncontrolling interest for the threemonths ended March 31, 2020, as a result of the purchase of all remaining outstanding stock of ARX Holding Corp. in April 2020.
3Represents diluted earnings per common share. Based on net income available to Progressive common shareholders, which is net of preferredshare dividends. The sum may not equal the total because the average equivalent shares differ in the quarterly and annual periods.
4Represents annual rate of return, assuming dividend reinvestment. For a discussion of Progressive’s dividend policy, see Note 14 – Dividends forfurther information.
App.-A-79

The Progressive Corporation and SubsidiariesTen Year Summary – Selected Financial Information(unaudited)
(millions – except ratios, policies in force, per shareamounts, and number of people employed) 2020 2019 2018 2017 2016
Net premiums written $ 40,568.7 $ 37,577.9 $ 32,609.9 $ 27,132.1 $ 23,353.5
Growth 8 % 15 % 20 % 16 % 14 %
Net premiums earned $ 39,261.6 $ 36,192.4 $ 30,933.3 $ 25,729.9 $ 22,474.0
Growth 8 % 17 % 20 % 14 % 13 %
Policies in force (thousands):
Personal Lines 21,413.5 19,408.6 17,759.0 16,075.5 14,656.8
Growth 10 % 9 % 10 % 10 % 6 %
Commercial Lines 822.0 751.4 696.9 646.8 607.9
Growth 9 % 8 % 8 % 6 % 9 %
Property1 2,484.4 2,202.1 1,936.5 1,461.7 1,201.9
Growth1 13 % 14 % 32 % 22 % 12 %
Total revenues $ 42,658.1 $ 39,022.3 $ 31,979.0 $ 26,839.0 $ 23,441.4
Underwriting margins:2
Personal Lines 13.2 % 9.5 % 9.7 % 6.9 % 4.7 %
Commercial Lines 13.0 % 10.4 % 13.3 % 7.7 % 6.4 %
Property1 (7.1)% (1.7)% (6.9)% (5.1)% 3.8 %
Total underwriting operations 12.3 % 9.1 % 9.4 % 6.6 % 4.9 %
Net income attributable to Progressive $ 5,704.6 $ 3,970.3 $ 2,615.3 $ 1,592.2 $ 1,031.0
Per common share - diluted 9.66 6.72 4.42 2.72 1.76
Average equivalent common shares - diluted 587.6 587.2 586.7 585.7 585.0
Comprehensive income attributable to Progressive $ 6,291.9 $ 4,432.9 $ 2,520.1 $ 1,941.0 $ 1,164.0
Total assets $ 64,098.3 $ 54,895.3 $ 46,575.0 $ 38,701.2 $ 33,427.5
Debt outstanding 5,396.1 4,407.1 4,404.9 3,306.3 3,148.2
Redeemable noncontrolling interest 0 225.6 214.5 503.7 483.7
Total shareholders’ equity 17,038.6 13,673.2 10,821.8 9,284.8 7,957.1
Statutory surplus 15,194.6 13,671.1 11,571.8 9,664.4 8,560.0
Common shares outstanding 585.2 584.6 583.2 581.7 579.9
Common share close price (at December 31) $ 98.88 $ 72.39 $ 60.33 $ 56.32 $ 35.50
Rate of return3 41.4 % 25.1 % 9.3 % 61.6 % 14.7 %
Market capitalization $ 57,864.6 $ 42,319.2 $ 35,184.5 $ 32,761.3 $ 20,586.5
Book value per common share 28.27 22.54 17.71 15.96 13.72
Ratios:
Return on average common shareholders’ equity:
Net income attributable to Progressive 35.6 % 31.3 % 24.7 % 17.8 % 13.2 %
Comprehensive income attributable toProgressive 39.3 % 35.0 % 23.8 % 21.7 % 14.9 %
Debt to total capital4 24.1 % 24.4 % 28.9 % 26.3 % 28.3 %
Price to earnings 10.2 10.8 13.6 20.7 20.2
Price to book 3.5 3.2 3.4 3.5 2.6
Net premiums written to statutory surplus 2.7 2.7 2.8 2.8 2.7
Statutory combined ratio 87.9 90.5 89.9 92.8 94.8
Dividends declared per common share5 $ 4.90 $ 2.65 $ 2.5140 $ 1.1247 $ 0.6808
Number of people employed 43,326 41,571 37,346 33,656 31,721
1 We began reporting our Property business as a segment on April 1, 2015, therefore, year-over-year growth for 2015 is not applicable (NA).2Underwriting margins are calculated as pretax underwriting profit (loss), as defined in Note 10 – Segment Information, as a percentage of netpremiums earned.
3 Represents annual rate of return, assuming dividend reinvestment.
App.-A-80

(millions – except ratios, policies in force, per share
amounts, and number of people employed) 2015 2014 2013 2012 2011
Net premiums written $ 20,564.0 $ 18,654.6 $ 17,339.7 $ 16,372.7 $ 15,146.6
Growth 10 % 8 % 6 % 8 % 5 %
Net premiums earned $ 19,899.1 $ 18,398.5 $ 17,103.4 $ 16,018.0 $ 14,902.8
Growth 8 % 8 % 7 % 7 % 4 %
Policies in force (thousands):
Personal Lines 13,764.7 13,261.9 13,056.4 12,735.3 12,283.8
Growth 4 % 2 % 3 % 4 % 5 %
Commercial Lines 555.8 514.7 514.6 519.6 509.1
Growth 8 % 0 % (1)% 2 % 0 %
Property1 1,076.5 — — — —
Growth1 NA — — — —
Total revenues $ 20,853.8 $ 19,391.4 $ 18,170.9 $ 17,083.9 $ 15,774.6
Underwriting margins:2
Personal Lines 6.5 % 6.7 % 6.6 % 4.4 % 6.8 %
Commercial Lines 15.9 % 17.2 % 6.5 % 5.2 % 9.1 %
Property1 10.1 % — — — —
Total underwriting operations 7.5 % 7.7 % 6.5 % 4.4 % 7.0 %
Net income attributable to Progressive $ 1,267.6 $ 1,281.0 $ 1,165.4 $ 902.3 $ 1,015.5
Per common share - diluted 2.15 2.15 1.93 1.48 1.59
Average equivalent common shares - diluted 589.2 594.8 603.6 607.8 636.9
Comprehensive income attributable to Progressive $ 1,044.9 $ 1,352.4 $ 1,246.1 $ 1,080.8 $ 924.3
Total assets $ 29,819.3 $ 25,787.6 $ 24,408.2 $ 22,694.7 $ 21,844.8
Debt outstanding 2,707.9 2,164.7 1,860.9 2,063.1 2,442.1
Redeemable noncontrolling interest 464.9 — — — —
Total shareholders’ equity 7,289.4 6,928.6 6,189.5 6,007.0 5,806.7
Statutory surplus 7,575.5 6,442.8 5,991.0 5,605.2 5,269.2
Common shares outstanding 583.6 587.8 595.8 604.6 613.0
Common share close price (at December 31) $ 31.80 $ 26.99 $ 27.27 $ 21.10 $ 19.51
Rate of return3 20.9 % 5.3 % 30.9 % 15.4 % 0.2 %
Market capitalization $ 18,558.5 $ 15,864.7 $ 16,247.5 $ 12,757.1 $ 11,959.6
Book value per common share 12.49 11.79 10.39 9.94 9.47
Ratios:
Return on average common shareholders’ equity:
Net income attributable to Progressive 17.2 % 19.1 % 17.7 % 14.5 % 16.5 %
Comprehensive income attributable toProgressive 14.2 % 20.1 % 19.0 % 17.4 % 15.0 %
Debt to total capital4 27.1 % 23.8 % 23.1 % 25.6 % 29.6 %
Price to earnings 14.8 12.6 14.1 14.3 12.3
Price to book 2.5 2.3 2.6 2.1 2.1
Net premiums written to statutory surplus 2.7 2.9 2.9 2.9 2.9
Statutory combined ratio 91.8 92.1 93.4 95.2 92.9
Dividends declared per common share5 $ 0.8882 $ 0.6862 $ 1.4929 $ 1.2845 $ 0.4072
Number of people employed 28,580 26,501 26,145 25,889 25,007
4 Ratio reflects debt as a percent of debt plus shareholders’ equity; redeemable noncontrolling interest is not part of this calculation.5Represents dividends pursuant to the dividend policy in place for the applicable year, plus special cash dividends of $1.00 per common share in2013 and 2012 (see Note 14 – Dividends for further discussion).
App.-A-81

The Progressive Corporation and SubsidiariesPerformance Graph
(unaudited)
The following performance graph compares the performance of Progressive’s Common Shares (“PGR”) to theStandard & Poor’s Index (“S&P Index”) and the Value Line Property/Casualty Industry Group (“P/C Group”) for thelast five years.
Cumulative Five-Year Total Return*
PGR, S&P Index, P/C Group (Performance Results through 12/31/20)
$400
$300
$200
$100
$02015
PGR S&P Index P/C Group
2016 2017 2018 2019 2020
(Assumes $100 was invested at the close of trading on December 31, 2015)
For the years ended December 31, 2016 2017 2018 2019 2020
PGR $ 114.74 $ 185.44 $ 202.72 $ 253.51 $ 358.42S&P Index 111.93 136.40 130.40 171.48 202.92
P/C Group1 118.26 148.59 147.61 187.90 195.18
*Assumes reinvestment of dividends
1 Per Value Line Publishing LLC
App.-A-82

The Progressive Corporation and SubsidiariesQuantitative Market Risk Disclosures
(unaudited)
Quantitative market risk disclosures are only presentedfor market risk categories when risk is consideredmaterial. Materiality is determined based on the fairvalue of the financial instruments at December 31,2020, and the potential for near-term losses fromreasonably possible near-term changes in market ratesor prices. The discussion below relates to instruments
entered into for purposes other than trading; we had notrading financial instruments at December 31, 2020 and2019. See Management’s Discussion and Analysis ofFinancial Condition and Results of Operations for ourdiscussion of the qualitative information about marketrisk.
Financial instruments subject to interest rate risk were:
Fair Value
-200 bps -100 bps +100 bps +200 bps(millions) Change1 Change1 Actual Change Change
U.S. government obligations $ 12,905.6 $ 12,905.6 $ 12,740.0 $ 12,326.0 $ 11,931.0
State and local government obligations 3,304.6 3,304.3 3,221.8 3,080.7 2,939.9
Asset-backed securities 10,568.4 10,568.4 10,469.2 10,231.7 9,993.1
Corporate securities 10,371.6 10,371.6 10,185.2 9,810.3 9,452.9
Preferred stocks 1,671.1 1,643.8 1,642.6 1,587.2 1,525.9
Short-term investments 5,218.5 5,218.5 5,218.5 5,214.9 5,211.2
Total at December 31, 2020 $ 44,039.8 $ 44,012.2 $ 43,477.3 $ 42,250.8 $ 41,054.0
Total at December 31, 2019 $ 37,869.2 $ 37,056.0 $ 35,948.0 $ 34,903.2 $ 33,908.6
1The amounts reflect an interest rate of 1 basis point (bps) when the hypothetical decline in interest rates would have pushed yields to a negativelevel.
Exposure to risk is represented in terms of changes infair value due to selected hypothetical movements inmarket rates. Bonds and preferred stocks areindividually priced to yield to the worst case scenario,which includes any issuer-specific features, such as a
call option. Asset-backed securities and state and localgovernment housing securities are priced assumingdeal specific prepayment scenarios, considering thedeal structure, prepayment penalties, yield maintenanceagreements, and the underlying collateral.
Financial instruments subject to equity market risk were:
Fair Value
(millions) -10% Actual +10%
Common equities at December 31, 2020 $ 3,612.3 $ 4,053.0 $ 4,493.7
Common equities at December 31, 2019 $ 2,975.7 $ 3,306.3 $ 3,636.9
The model represents the estimated value of ourcommon equity portfolio given a +/-10% change in themarket, based on the common stock portfolio’sweighted average beta of 1.09 for 2020 and 1.00 for2019. The beta is derived from recent historicalexperience, using the S&P 500 as the market surrogate.The historical relationship of the common stock
portfolio’s beta to the S&P 500 is not necessarilyindicative of future correlation, as individual company orindustry factors may affect price movements. Betas arenot available for all securities. In such cases, thechange in fair value reflects a direct +/-10% change; theportion of our securities without betas is 0.1%.
App.-A-83

The Progressive Corporation and SubsidiariesNet Premiums Written by State
(unaudited)
($ in millions) 2020 2019 2018 2017 2016
Florida $ 5,533.7 13.6 % $ 5,233.4 13.9 % $ 4,700.9 14.4 % $ 3,808.0 14.0 % $ 3,305.1 14.1 %
Texas 4,530.5 11.2 4,081.0 10.8 3,388.6 10.4 2,704.9 10.0 2,226.8 9.5
California 2,241.2 5.5 2,208.8 5.9 1,836.0 5.6 1,520.5 5.6 1,284.8 5.5
New York 1,932.8 4.8 1,843.2 4.9 1,699.0 5.2 1,472.8 5.4 1,279.4 5.5
Georgia 1,860.9 4.6 1,645.3 4.4 1,452.9 4.5 1,177.0 4.4 939.4 4.0
Michigan 1,797.6 4.4 1,673.5 4.4 1,423.7 4.4 1,186.8 4.4 971.3 4.2
Ohio 1,404.2 3.4 1,339.5 3.6 1,194.0 3.7 1,033.5 3.8 905.2 3.9
Pennsylvania 1,327.2 3.3 1,268.3 3.4 1,157.4 3.5 1,005.5 3.7 895.8 3.8
New Jersey 1,242.0 3.1 1,192.3 3.2 1,088.1 3.3 985.8 3.6 902.8 3.9
Louisiana 1,039.4 2.6 965.6 2.6 856.5 2.6 739.2 2.7 694.7 3.0
All other 17,659.2 43.5 16,127.0 42.9 13,812.8 42.4 11,498.1 42.4 9,948.2 42.6
Total $40,568.7 100.0 % $37,577.9 100.0 % $32,609.9 100.0 % $27,132.1 100.0 % $23,353.5 100.0 %
App.-A-84

Principal Office
The Progressive Corporation6300 Wilson Mills RoadMayfield Village, Ohio 44143440-461-5000progressive.com
24-Hour Insurance Quotes, Claims Reporting, and Customer Service
Personal autos, motorcycles, recreational vehicles,homeowners, other property, and renters
Commercial autos/trucks, business property, andgeneral liability
To receive a quote 1-800-PROGRESSIVE (1-800-776-4737)progressive.com
1-888-806-9598progressivecommercial.com
To report a claim 1-800-PROGRESSIVE (1-800-776-4737)progressive.com
1-800-PROGRESSIVE (1-800-776-4737)
For customer service:
If you bought yourpolicy through anindependent agent orbroker
1-800-925-2886 (1-800-300-3693 inCalifornia) progressive.com/agent
1-800-444-4487progressivecommercial.com
If you bought yourpolicy directly throughProgressive online orby phone
1-800-PROGRESSIVE (1-800-776-4737)progressive.com
1-800-895-2886progressivecommercial.com
In addition, iPhone® and Android® users can download the Progressive App to start a quote, report a claim, or servicea policy.
Annual Meeting The Annual Meeting of Shareholders will be held on May 7, 2021, at 10:00 a.m., eastern time. Themeeting will be held by online webcast only. You will be able to attend the Annual Meeting, vote, and submit yourquestions during the meeting via live webcast by visiting www.virtualshareholdermeeting.com/PGR2021. Toparticipate in the meeting, you must have your 16-digit control number that is shown on your proxy card. You will notbe able to attend the Annual Meeting in person. There were 1,896 shareholders of record on December 31, 2020.
Online Annual Report and Proxy Statement Our 2020 Annual Report to Shareholders can be found at:progressive.com/annualreport.
Our 2021 Proxy Statement and 2020 Annual Report to Shareholders, in a PDF format, can be foundat: progressiveproxy.com.
Shareholder/Investor Relations Progressive does not maintain a mailing list for distribution of shareholders’ reports.To view Progressive’s publicly filed documents, shareholders can access our website: progressive.com/sec. To viewour earnings and other releases, access: progressive.com/financial-releases.
For financial-related information or to request copies of Progressive’s publicly filed documents free of charge, write to:The Progressive Corporation, Investor Relations, 6300 Wilson Mills Road, Box W33, Mayfield Village, Ohio 44143,email: [email protected], or call: 440-395-2222.
For all other company information, call: 440-461-5000 or access our website at: progressive.com/contactus.
Transfer Agent and Registrar
Registered Shareholders: If you have questions or changes to your account and your Progressive common shares areregistered in your name, write to: American Stock Transfer & Trust Company, Attn: Operations Center, 6201 15th Avenue,Brooklyn, NY 11219; phone: 1-866-709-7695; email: [email protected]; or visit their website at: astfinancial.com.
App.-A-85

Beneficial Shareholders: If your Progressive common shares are held in a brokerage or other financial institutionaccount, contact your broker or financial institution directly regarding questions or changes to your account.
Common Shares and Dividends The Progressive Corporation’s common shares are traded on the New York StockExchange (symbol PGR). Progressive currently has a dividend policy under which the Board expects to declareregular, quarterly common share dividends and, on at least an annual basis, to consider declaring an additionalvariable common share dividend. The dividend policy can be found at: progressive.com/dividend.
Counsel Baker & Hostetler LLP, Cleveland, Ohio
Corporate Governance Progressive’s Corporate Governance Guidelines and Board Committee Charters areavailable at: progressive.com/governance.
Accounting Complaint Procedure Any employee or other interested party with a complaint or concern regardingaccounting, internal accounting controls, or auditing matters relating to Progressive may report such complaint orconcern directly to the Chairperson of the Audit Committee, as follows: Patrick H. Nettles, Ph.D., Chair of the AuditCommittee, [email protected].
Any such complaint or concern also may be reported anonymously over the following toll-free Alert Line:1-800-683-3604 or online at: www.progressivealertline.com. Progressive will not retaliate against any individual byreason of his or her having made such a complaint or reported such a concern in good faith. View the completeprocedures at: progressive.com/governance.
Contact Non-Management Directors Interested parties have the ability to contact the non-management directors as agroup by sending a written communication clearly addressed to the non-management directors to either of the following:
Lawton W. Fitt, Chairperson of the Board, The Progressive Corporation, email: [email protected]; or
Daniel P. Mascaro, Secretary, The Progressive Corporation, 6300 Wilson Mills Road, Mayfield Village, Ohio 44143or email: [email protected].
The recipient will forward communications so received to the non-management directors.
Whistleblower Protections Progressive will not retaliate against any officer or employee of Progressive because ofany lawful act done by the officer or employee to provide information or otherwise assist in investigations regardingconduct that the officer or employee reasonably believes to be a violation of federal securities laws or of any rule orregulation of the Securities and Exchange Commission. View the complete Whistleblower Protections at:progressive.com/governance.
Charitable Contributions We contribute annually to: (i) The Insurance Institute for Highway Safety to further its workin reducing the human trauma and economic costs of auto accidents; (ii) Humble Design, a nonprofit organization wepartnered with to furnish homes for families and veterans transitioning from homelessness; and, (iii) The ProgressiveInsurance Foundation, which provides matching funds to eligible 501(c)(3) charitable organizations to whichemployees contribute. Over the last five years, the matching funds provided by The Progressive InsuranceFoundation averaged approximately $4 million per year. In 2020, we also contributed about $21.5 million to a varietyof charitable organizations to assist shareholders, customers, employees, agents, and communities aimed atlessening the economic impact caused by the spread of the novel coronavirus, COVID-19.
Social Responsibility and Sustainability Progressive uses an online format to communicate our socialresponsibility efforts, and we see sustainability as part of the value we bring to our shareholders, customers,employees, agents, and communities. Our social responsibility and sustainability reports can be found at:progressive.com/socialresponsibility and progressive.com/sustainability, respectively.
App.-A-86

Directors
Philip Bleser3,5,7 Lawton W. Fitt2,4,5,7 Patrick H. Nettles, Ph.D.1,6,7
Retired Chairman of Global Corporate Chairperson of the Board, Executive Chairman,
Banking, Retired Partner, Ciena Corporation
J. P. Morgan Chase & Co. Goldman Sachs Group (telecommunications)
(financial services) (financial services)
Stuart B. Burgdoerfer1,7 Susan Patricia Griffith2 Barbara R. Snyder3,7
Executive Vice President and President and President,
Chief Financial Officer, Chief Executive Officer, The Association of American Universities
L Brands, Inc. The Progressive Corporation (higher education)
(retailing)
Pamela J. Craig3,6,7 Devin C. Johnson7 Jan E. Tighe6,7
Retired Chief Financial Officer, Chief Operating Officer, United States Navy, Vice Admiral, Retired
Accenture PLC The SpringHill Company (military)
(global management consulting) (global consumer and entertainment)
Charles A. Davis4,7 Jeffrey D. Kelly1,7 Kahina Van Dyke4,7
Chief Executive Officer, Retired Chief Operating Officer and Global Head, Digital Channels and
Stone Point Capital LLC Chief Financial Officer, Client Data Analytics,
(private equity investing) RenaissanceRe Holdings Ltd. Standard Chartered PLC
(reinsurance services) (international banking)
Roger N. Farah2,3,5,7
Former Executive Director,
Tory Burch LLC
(retailing)
1 Audit Committee Member
2 Executive Committee Member
3 Compensation Committee Member
4 Investment and Capital Committee
Member
5 Nominating and Governance
Committee Member
6 Technology Committee Member
7 Independent Director
App.-A-87

Corporate Officers
Lawton W. Fitt
Chairperson of the Board
(non-executive)
Susan Patricia Griffith
President
and Chief Executive Officer
John P. Sauerland
Vice President
and Chief Financial Officer
Daniel P. Mascaro
Vice President, Secretary,
and Chief Legal Officer
Patrick S. Brennan
Treasurer
Mariann Wojtkun Marshall
Vice President, Assistant Secretary,
and Chief Accounting Officer
Other Executive Officers
Karen B. Bailo
Commercial Lines President
Jonathan S. Bauer
Chief Investment Officer
Steven A. Broz
Chief Information Officer
Patrick K. Callahan
Personal Lines President
M. Jeffrey Charney
Chief Marketing Officer
John Murphy
Customer Relationship Management
President
Lori Niederst
Chief Human Resource Officer
Andrew J. Quigg
Chief Strategy Officer
Michael D. Sieger
Claims President
©2021 The Progressive Corporation
App.-A-88