Embed Size (px)
DESCRIPTION
Central and Eastern European countries (CEE) had emerged as new players on theworld market, opening its economies to international trade, FDI and internationalisation ofproducts. This paper (i) refers to classical Vernon theory of Product Cycle (PCT), thenanalyses its evolution and following tests by other authors and by Vernon himself, (ii) studiesPCT’s application on Chinese case, in particular on Central office switches industry’s successduring last few years; and CEE countries’ case (CEE is seen as new global location inelectronic industry), and (iii) makes an attempt to analyse Ukrainian economy’s case in termsof PCT, analyses which lessons Ukraine should learn on its way to internationalisation of itsproduction.
Citation preview
1
The Product Cycle Theory for Developing Countries.
Ukrainian case.
Olena Gurova, PhD Student
University of Rouen
Abstract: Central and Eastern European countries (CEE) had emerged as new players on the
world market, opening its economies to international trade, FDI and internationalisation of
products. This paper (i) refers to classical Vernon theory of Product Cycle (PCT), then
analyses its evolution and following tests by other authors and by Vernon himself, (ii) studies
PCT’s application on Chinese case, in particular on Central office switches industry’s success
during last few years; and CEE countries’ case (CEE is seen as new global location in
electronic industry), and (iii) makes an attempt to analyse Ukrainian economy’s case in terms
of PCT, analyses which lessons Ukraine should learn on its way to internationalisation of its
production.
Key words: International Trade, Product Cycle Theory, FDI, MNCs, Vernon,
Technological Gap, CEE.
Introduction Central and Eastern Europe (CEE) has just recently opened its economies to
international trade after the decline of Soviet Era. That means not only liberalization of trade
itself and opening its market for international producers, but also its own production’s
internationalisation. We insist here that market integration is necessary but not sufficient
condition for benefiting from global integration. It is often assumed that industrial integration
would automatically follow the market integration. However, most often this is far from being
a case and the failure of Washington consensus in CEE and CIS countries proved it recently.
Countries could be integrated through markets but not necessarily through production and
technology networks. World economy is much more integrated through finance and trade than
through production and much less through technology. Similar levels of market integration do
not necessarily lead to similar levels of production and technology integration.
2
Thus, here is a question arise – what determines whether firms are able to brake into to
foreign markets? Which are the steps the company and the country should take to make its
product competitive at the international market? What determines the positive input of FDI?
To answer these questions, we propose to use Product Cycle Theory’s (PCT) approach
and to analyse which are the chances for developing countries or countries with transitional
economies for accomplishing the task of bringing new competitive product on foreign market
or at least, to move from the “developing countries” status to “follower” or “leader” in terms
of PCT.
In aim of answering these questions for CEE countries, we find it useful to study some
recent cases such as Chinese, where we already can observe some significant success of
accomplishing Product Cycle.
And, to move to more particular case, we take example of Ukraine, the country that
follows its CEE neighbours in its economical transition; and to try to answer some important
questions rising:
1) Which sectors of Ukrainian economy are developed enough to be export-intensive?
Which sectors of economy should and may Ukraine develop to become a serious
competitor on the international market?
2) Which foreign markets are open and which might be open in the future for Ukraine
as exporter?
3) Which conditions should Ukraine meet to participate in competition on the
international market? What are the obstacles at the moment for FDI hosting and
developing pro-export production?
4) Could PCT be useful for programming the development economies in transition and
in particular Ukrainian?
I - Theoretical approach 1. Classic Theory of Product Cycle by Vernon
The Product Cycle Theory is generalization and extension of the technological gap
model, sketched by M.P. POSNER in 1961, a great deal of the trade among industrialized
countries is based on the introduction of new products and new production process.
3
These give the innovating firm and nation a temporary monopoly in the world market.
Such a temporary monopoly is often based on patens and copyrights, which are granted to
stimulate the flow of inventions.
As the most technologically advanced countries, US exports a large number of new
high-technology products. However, as foreign producers acquire the new technology, they
eventually are able to conquer markets abroad, and even US market for the product, because
of their lower labour cost.
In the mean time, American producers may have introduced still newer product and
the productions processes and may be able to export these products based on the new
technological gap established. A shortcoming of this model, however, is that it does not
explain the size of the technological gaps and doesn’t explore the reason that technological
gaps arise or exactly how they are eliminated over time.
The Product Cycle Theory says that FDI starts to work only when traditional export of
goods doesn’t bring enough of profit any more to the company and as a solution the company
chooses the organizing of production abroad.
The PCT is concerned with the life-cycle of a typical « new product » and its impact
on international trade. R. VERNON (1966) developed his theory in response to the failure of
the United States – the main country to do so – to conform empirically to the Heckscher-
Ohlin Model.
R. VERNON emphasizes manufactured goods, and the theory begins with the
developing a new product in the USA. The new product had two principal characteristics:
1) it caters to high-income demands because the US is a high-income country
2) it promises, in its production process, to be labour-saving and capital-using in
nature.
The reason for including the potential labour-saving nature of the production process
is that the US is widely regarded as a labour-scarce country. Thus, technological change will
emphasize production processes with the potential to conserve this scarce factor of
production.
The theory of R. VERNON divides the life cycle of this new product into three stages
(Figure. 1):
1) The new product stage (innovation stage, production inside the country) –
the product is produced and consumed only inside the country (USA by
Vernon).

4
2) Maturing product stage (export of product) – some general standards for the
product and its characteristics begin to emerge, and mass production
techniques start to be adopted.
At this stage the prices competition is increasing and the costs of products plays
more and more important role. But the company continues the export of the product and
avoids direct investments as long as production costs and transportation costs of this
product are lower than the cost of production abroad. If this proportion changes and
production abroad (investments) becomes more efficient, the company shifts production
of this product to the country with the similar structure of demand and lower level of
salary (as example – for USA in 1960s it was Western Europe).
3) Standardized product stage (technology’s export and product’s import)
– by this time in the product’s life cycle, the characteristics of the
product itself and the production process are well known; the product is
familiar to consumers and the production process to producers.

5
Figure 1. Trade pattern for innovating country.
Vernon hypothesizes that production may shift to the developing countries. Labour
cost again plays an important role, and the developed countries are busy introducing other
products.
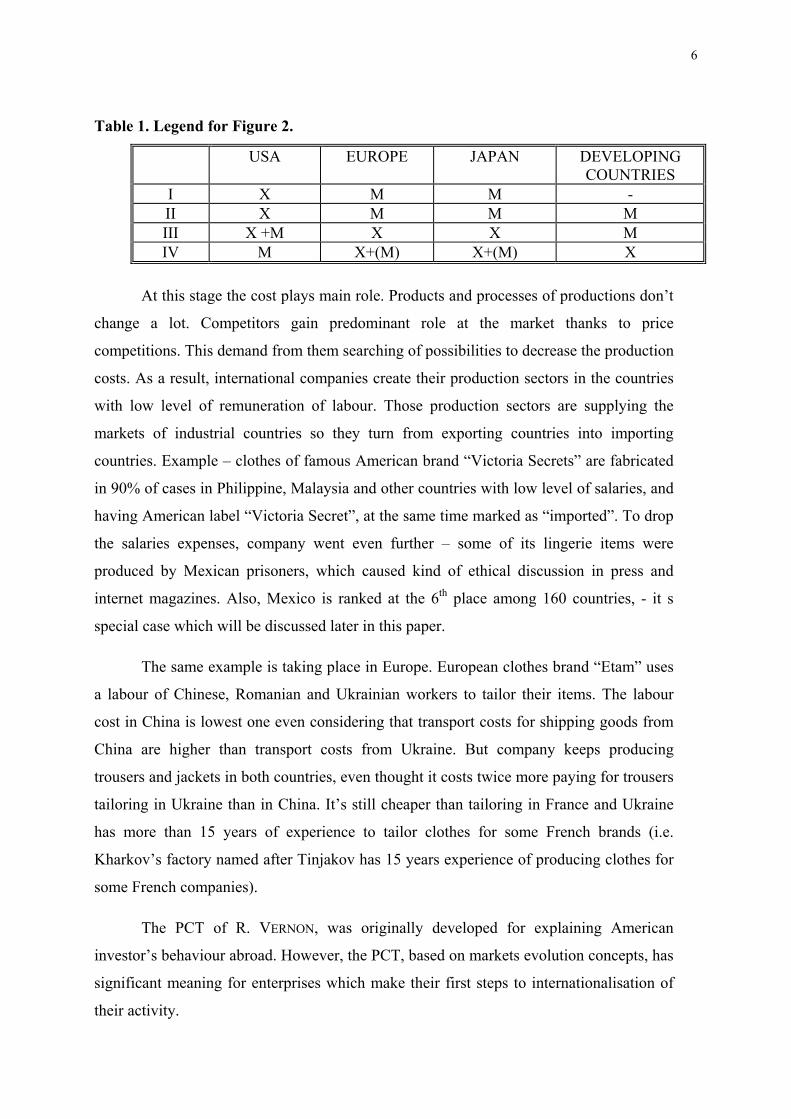
Figure 2. PCT in application on 3 types of countries.
Expo
rts (X
) “Leaders” countries
Intermediate countries (“followers”)
Developing countries
Time
I II III IV
Impo
rts (M
)
Innovating country’s consumption
Innovating country’s production
imports Exports
Production Consumption of product
t0 New product stage t1 Maturing product t2 Standardized product stage Time stage
6
Table 1. Legend for Figure 2.
USA
EUROPE JAPAN DEVELOPING COUNTRIES
I X M M - II X M M M III X +M X X M IV M X+(M) X+(M) X
At this stage the cost plays main role. Products and processes of productions don’t
change a lot. Competitors gain predominant role at the market thanks to price
competitions. This demand from them searching of possibilities to decrease the production
costs. As a result, international companies create their production sectors in the countries
with low level of remuneration of labour. Those production sectors are supplying the
markets of industrial countries so they turn from exporting countries into importing
countries. Example – clothes of famous American brand “Victoria Secrets” are fabricated
in 90% of cases in Philippine, Malaysia and other countries with low level of salaries, and
having American label “Victoria Secret”, at the same time marked as “imported”. To drop
the salaries expenses, company went even further – some of its lingerie items were
produced by Mexican prisoners, which caused kind of ethical discussion in press and
internet magazines. Also, Mexico is ranked at the 6th place among 160 countries, - it s
special case which will be discussed later in this paper.
The same example is taking place in Europe. European clothes brand “Etam” uses
a labour of Chinese, Romanian and Ukrainian workers to tailor their items. The labour
cost in China is lowest one even considering that transport costs for shipping goods from
China are higher than transport costs from Ukraine. But company keeps producing
trousers and jackets in both countries, even thought it costs twice more paying for trousers
tailoring in Ukraine than in China. It’s still cheaper than tailoring in France and Ukraine
has more than 15 years of experience to tailor clothes for some French brands (i.e.
Kharkov’s factory named after Tinjakov has 15 years experience of producing clothes for
some French companies).
The PCT of R. VERNON, was originally developed for explaining American
investor’s behaviour abroad. However, the PCT, based on markets evolution concepts, has
significant meaning for enterprises which make their first steps to internationalisation of
their activity.

7
What is the evidence on the PCT? The product cycle hypothesis suggests two
orderings:
1) more advanced countries are able to begin exporting earlier than developing
countries;
2) less advanced products are developed and exported earlier.
In general, advanced countries are expected to begin exporting more advanced
products earlier than less advanced countries.
However this model can’t describe sufficiently the process of division of markets
by international companies in different countries, it doesn’t explain their specific
advantages.
2. Developing and testing Vernon’s Theory
There is no single all-encompassing test (such as W. LEONTIEF test of Heckscher-
Ohlin) to verify empirically the product cycle theory.
Instead, researches have examined particular features of the PCT to see if they are
consistent with real-world experience. For example, new product development is critical to
the PCT, and it is often the result of research and development (R&D) expeditures.
Therefore, economists hypothesize that, in the USA manufacturing sector, there
should be a positive correlation between R&D expeditures and successful export performance
by industry.
A number of tests indicated this result, including those by D. KEESING (1967) and W.
GRUBER, D. MEHTA, R. VERNON (1967).
I. KRAVIS and R. LIPSAY (1982) found that high R&D intensity was positively
associated with large shares of export by US multinational companies (MNCs).
Furthermore, over the last 25 years, greater shares of US MNCs’ exports have come
from overseas production, which is consistent with the direct-investment and export-
displacement features of the PCT.
In addition, in 1969, L. WELLS examined the income elasticity of demand of the
fastest-growing US exports and found – again, an occurrence consistent with the PCT. It was
Wells, who summarized the product life cycle in tabular form (see table 2).

8
Table 2. PCT by L. Wells (1969).
CYCLE PHASE Early Growth Mature
Demand Structure Low price elasticity for aggregate demand and for individual firm. Nature of demand not well understood by firm
Growing price elasticity for firm. Price competition begins.
Basis of competition is price or product differentiation through marketing techniques.
Production Short runs, rapidly changing techniques dependent on skilled labor. Low capital intensity.
Mass production methods.
Long runs with stable techniques. Labor skills unimportant. Capital intensive.
Industry Structure Small number of firms.
Large number of firms, but many casualties and mergers.
Number of firms declining.
Source: Louis T. Wells, Jr., “The Product Life Cycle Approach”. Among the many other empirical works is G. HUFBAUER’s (1966) study on trade in
synthetic materials. Hufbauer found that the US and other developed countries tended to
export new products while developing countries tended to export older products.
W. GRUBER, D. MEHTA, and R. VERNON (1967) also discovered that research-
intensive US industries have a high propensity to invest abroad.
This is consistent with the maturing product stage of theory.
In 1979 R. VERNON modified his original PCT with respect to the role of
multinationals. Because of the changes that occurred in production conditions in the USA –
mostly because of the convergence of labour costs with other technological leaders such as
Japan, but also the convergence of the level income – it seems likely that the actual
production of new products could take place somewhere else other that in the country in
which the research laboratory is.
For example, while R&D activities will take place in the MNC’s headquarters, usually
in one of the more highly DC’s, the initial production could easily tale place in one of the
MNC’s subsidiary companies located in a developing country. However, this modification
does not bring the product-cycle and the HO trade models any closer together.
In 1972, J. MORRALL found that US industries that were successful exporters also
tended to have relatively high expenditures on non-payroll costs such as advertising, sales
promotions, and so forth.

9
Taking into account all the difficulties in measuring technological advantage, the
empirical evidence is as favorable toward the product-cycle theory as it could be. A number
of studies have incorporated some type of technology-related variables as determinants of the
pattern of trade. A comprehensive survey of the many avenues taken in empirical testing is
presented by A. DEARDORFF (1984). He stresses that all the variables used to explain trade in
these technology-based models are related to two things:
1) the “newness” of the products or process
2) the special knowledge possessed by individuals, firms, and countries that enables
them to develop and exploit available technologies.
This leads A. DEARDORFF to conclude that it is difficult to distinguish the evidence
supporting technology from the evidence supporting human capital and skills as determinants
of trade.
R. FEENSTRA and A. ROSE (2000) use intuitions of Vernon’s Theory to produce a
ranking of products and a ranking of country sophistications. The product and country
ranking are based on the product cycle notion that all goods are not exported by most
countries and that countries tend to export goods to the United States in a sequential order.
First, the ranking of unobserved product sophistication is constructed according to the first
year of exportation. A product is deemed less advanced if it begins to be exported earlier
to the United States. Second, the ranking of country sophistication is constructed
according to the first year in which a country exported each commodity to the United
States.
Empirical analysis shows that countries ranked as more advanced, in the sense that
they tend to export sooner to the United States, tend to grow faster and to display higher
levels of economic activity and of total factor productivity than countries ranked as less
advanced.
The top more sophisticated countries, according to a ranking based on the exports
of manufacturing goods, are Japan, Germany, Canada, the United Kingdom, France, Italy,
Switzerland, the Netherlands, and Mexico. Notice, that the ranking is affected by trade
relations with the United States, which explains why Mexico is number nine among 160
countries as we stated before.
One of the most important questions rising for our further analysis is what
determines whether firms are able to break into foreign markets?

10
A. BERNARD and J. JENSEN (2001) undertake a dynamic econometric analysis
benefiting from the availability of data at the plant level. The study uses a panel of 13 550
US manufacturing plants that operated continuously during the export growth period
1984-92. the plants in the sample were a small percentage of the almost 200 000 plants
surveyed in the Census of Manufactures in 1987 but accounted for 41 percent of total
manufacturing employment and 70 percent of total manufacturing exports in that year.
About 48 percent of the plants in the sample exported in 1984 and 54 percent in 1992.
The econometric analysis tests for the effects of entry costs, exchange rates, plant
characteristics, state export promotion, and other factors, on the probability of exporting.
Entry costs discourage exporting, a finding that is also reported by M. ROBERTS
and J. TYBOUT (1997) for Colombia. Favourable exchange rate shocks and plants
characteristics indicative of past successes are found to significantly increase the
probability of exporting. Export promotion by the states is found to have positive but
statistically insignificant effects on exporting probabilities.
However, the authors indicate that the evidence is subject to the caveat that the
study focuses on the sample of large firms but state export promotion – which mounted to
USD 96 million in 1992 – often targets small and medium enterprises.
II - Application of PCT
1. China’s case
Before we start to analyse the possibility of PCT application on Ukrainian case, we
find it very useful to make some research about other economically developing countries who
have already achieved some significant success in technological gap cut. Which lessons we
can learn from China? What might be useful as patterns for Ukraine in its aspiration for
world’s market?
The research of Z. THAN (2001) is analysing application of PCT on Chinese case, in
particular for Telecom Manufacturing Industry as a case.
China has recently emerged as a significant player in the global telecommunication
industry, in late 1980s. The wireless phone network in Chine has experienced an even higher
growth rate than telephone lines. China’s mobile telephone users reached 120,6 million
persons in 2001, which made Chine the largest mobile communication market in the world,
surpassing the 120,1 million users in the US. A late starter on Internet, China is trying to catch

11
up, with 200-300% annual growth rate. Its enormous market size has attracted almost all the
significant manufactures in the world to engage in various trade and production activities
(AT&T, Motorola, CISCO, Nortel, Ericsson, Nokia, Alcatel, Siemens, NEC, Fujitsu,
Samsung etc.). Direct imports from post-industrial countries continue to support most of
China high-end market. Local subsidiaries and joint ventures of multinational telecom
manufactures have grown to supply a large percentage of the medium-end of Chinese market.
Government policy of China. China has recognized that involving MNCs is a part of
the solution to national economic and social development (UNITCAD, 1999). But China
apparently also realized that “Development of the host countries is a fortuitous side effect at
best, which will only come about if the host government maintains enough autonomy and
control to guarantee that the benefits of foreign direct investments are shared between
providers and recipients of foreign capital” (STALLINGS, 1990). Regulations and policy have
been actively formulated to promote the production localization of MNCs’ subsidiaries and
joint ventures and to nurture indigenous manufacturers in China’s telecom industry. Chinese
government issues and updated regularly “Government Guidelines for Foreign Investment in
Telecommunications”, dividing foreign entries into three categories: encouraged, restricted,
and prohibited.
Central office Switches is a good example of PCT application on China’s case.
Traditional Central Office Switch market is an instance where competition among many
MNCs’ is fierce, technology is mature, demand is strong (more than 10 million lines
annually) and China’s government industrial policy can be effectively implemented.
The technology of traditional central office switches is based on the principle of stored
programming control, which originated in the 1960s and became mature in the late 1980s and
1990s. These switches have been deployed on a large-scale in Western countries since 1970s.
Scale of economy limits the production of central office switches to a few large corporations.
In China, switches were mostly purchased by single monopoly buyer, then China Telecom. A
single monopoly buyer leads to a better organized decision-making process, which makes it
more effective for China to implement its industrial policy through procurement and joint
venture negotiation. These market features have determined an evolution with four distinct
stages for central office switches in China (see table 3).
This development is very close to a typical PC except for the last step. Theoretically,
China should start to export these lower cost switches back to Western countries since the
production is localized to a large extent. However, technologically advances have eliminated
the export opportunities because Western markets have moved to more advanced next
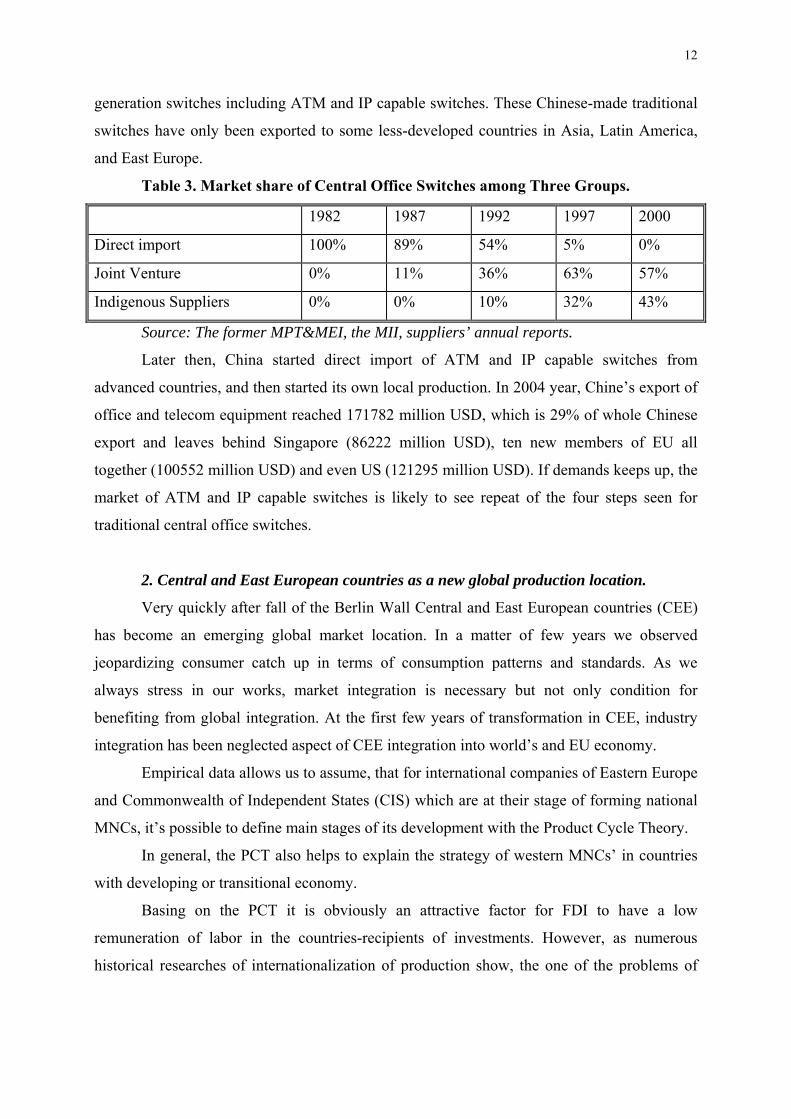
12
generation switches including ATM and IP capable switches. These Chinese-made traditional
switches have only been exported to some less-developed countries in Asia, Latin America,
and East Europe.
Table 3. Market share of Central Office Switches among Three Groups.
1982 1987 1992 1997 2000
Direct import 100% 89% 54% 5% 0%
Joint Venture 0% 11% 36% 63% 57%
Indigenous Suppliers 0% 0% 10% 32% 43%
Source: The former MPT&MEI, the MII, suppliers’ annual reports.
Later then, China started direct import of ATM and IP capable switches from
advanced countries, and then started its own local production. In 2004 year, Chine’s export of
office and telecom equipment reached 171782 million USD, which is 29% of whole Chinese
export and leaves behind Singapore (86222 million USD), ten new members of EU all
together (100552 million USD) and even US (121295 million USD). If demands keeps up, the
market of ATM and IP capable switches is likely to see repeat of the four steps seen for
traditional central office switches.
2. Central and East European countries as a new global production location.
Very quickly after fall of the Berlin Wall Central and East European countries (CEE)
has become an emerging global market location. In a matter of few years we observed
jeopardizing consumer catch up in terms of consumption patterns and standards. As we
always stress in our works, market integration is necessary but not only condition for
benefiting from global integration. At the first few years of transformation in CEE, industry
integration has been neglected aspect of CEE integration into world’s and EU economy.
Empirical data allows us to assume, that for international companies of Eastern Europe
and Commonwealth of Independent States (CIS) which are at their stage of forming national
MNCs, it’s possible to define main stages of its development with the Product Cycle Theory.
In general, the PCT also helps to explain the strategy of western MNCs’ in countries
with developing or transitional economy.
Basing on the PCT it is obviously an attractive factor for FDI to have a low
remuneration of labor in the countries-recipients of investments. However, as numerous
historical researches of internationalization of production show, the one of the problems of
13
using a “cheap” labor by international companies is inevitability of constantly growing level
of salaries. L. KLIMOVICH (1999) sees two reasons why it may happen:
1) self-appraisal of East-European workers which is slightly raised too high because
of their traditionally high social guarantees ;
2) inflation expectations.
Dominating factor in resource's sector is a search for cheapest resources. The bench-
mark of this search is investments in other countries, which will help to form trade flows. To
get access to the resources in foreign country, the company invests there (FDI) and starts to
export this resources from this particular country, which is acceptor of FDI.
Hence, the bench-mark of this process is FDI and international trade flows are its
derivative.
Service's sector. Mechanism of PCT in service’s sector is a bit different. In this sector,
it is necessary to establish company’s subsidiaries in all the beginning. They will demonstrate
the services offered by the company to the clients. The necessity of such presence at the
foreign markets caused some fundamental shifts in the structure of FDI in favour of service
sector.
But there are some serious shifts going on in the service sectors itself too – due to
telecommunication’s sector’s development. The speed of information’s transmission has
increased remarkably during last years. As a result of this process, the demand for FDI in this
sector decreases. At the same time, new opportunities for international business in service
industry arrive – such as information processing, accounting etc.
In other words, we are talking about the activities which were accomplished by each
company themselves; and now are accomplishing by special companies working on
transnational base. In this way company minimize its stuff of accountants and other high-paid
specialists, so it minimize the salary’s payments.
We find not so many examples of such shifting at the Eastern European countries
nowadays. It is probably because there is no necessary level of development of technical base
and specially trained personnel. But we should not exclude the possibility of creation the
international companies’ subsidiaries using the local specialists in the nearest future.
CEEC's electronic industry as a case. Socialist economies of CEE were uncompetitive
in computer production, relying on foreign technology for design and components. Obviously,
their contribution to technology development in electronics was relatively strong only until
the mid-1970s, and dependence later then on foreign technology meant that, in fact, in the
early 1990s, CEECs were still using 1970s electronic technology. It was determined also by

14
poor supply of components and COMECON restrictions. Production was undertaken by
several large electronics companies, which by mid-1990s all but one (Hungarian Videoton)
have been either broken up or slowly deteriorating. The only domestically controlled
successful part of electronics during the 1990s was local PC assembly, especially in Poland.
After the mid-1990s, some of CEECs, like Hungary, the Czech Republic and Poland,
gradually became accepted into the supply base of large electronic companies. The dynamic
of electronics export shown in the table 4.
Table 4. Electronics export of the CEECs, millions current USD 1996 1997 1998 1999 2000 2001 Average
annual rate,%
Hungary 932 3329 4737 6093 7802 7729 42.3 Czech 989 1176 1633 1572 2224 3340 22.5 Poland 612 849 1142 1140 1290 1607 17.5 Russia 784 965 746 929 947 1138 6.4 Romania 36 31 58 176 510 497 54.9 Slovakia 161 246 309 363 382 433 17.9 Slovenia 298 284 276 228 330 350 2.7 Ukraine 57 77 85 94 220 251 28.0 Croatia 123 160 164 124 152 204 8.8 Total 3992 7117 9150 10719 13857 155549 25.4 Source: Reed Electronics Research, The Yearbook of World Electronic Data. 2001/2, 1999/2000 and 2003/4, volume 4, East Europe and World Summary.
In 2003, total electronics production reached 30 milliards USD, which is little above
the production of Mexico (28,5 milliards USD), the bulk of this growth was achieved in the
1997-2000 period. However, this level is still low compared to East Asian economies and
China. For example, Taiwanese electronics production is 5 times larger that Hungarian.
In summary, among emerging markets CEE electronics has become an important
second tier global location i. e. after East Asia with leader producer Hungary, which
electronic production raised from 1,7 milliards USD (1996) to 8,5 milliards USD (2003) –
leaving behind Spain with 6,5 milliards USD (2003).
III. Ukrainian case 1. Economy of Ukraine after collapse of USSR
Ukraine is an Easter European country with a considerable economic potential.
Ukraine produces 5% world’s mineral raw materials and products of its processing. Explored
sources of fossils in Ukraine cost approximately 7 trillions USD. Share of Ukraine in world’s
production of manganese ore is 32%, production of cast iron – 52 million tons, in production

15
of steel – 54 million tons (Ukraine remains on of the largest steel and iron producers in the
world, see appendix 1), production of rolled metal 41,5 million tons. Ukraine holds fifth
place in the world by these indexes.
Detailed analysis of economics potential of Ukraine is done in our previous work (G.
DUTHIL, O. GUROVA, 2005). Here we would mention only some most important points in aim
for possible application of PCT on Ukrainian case.
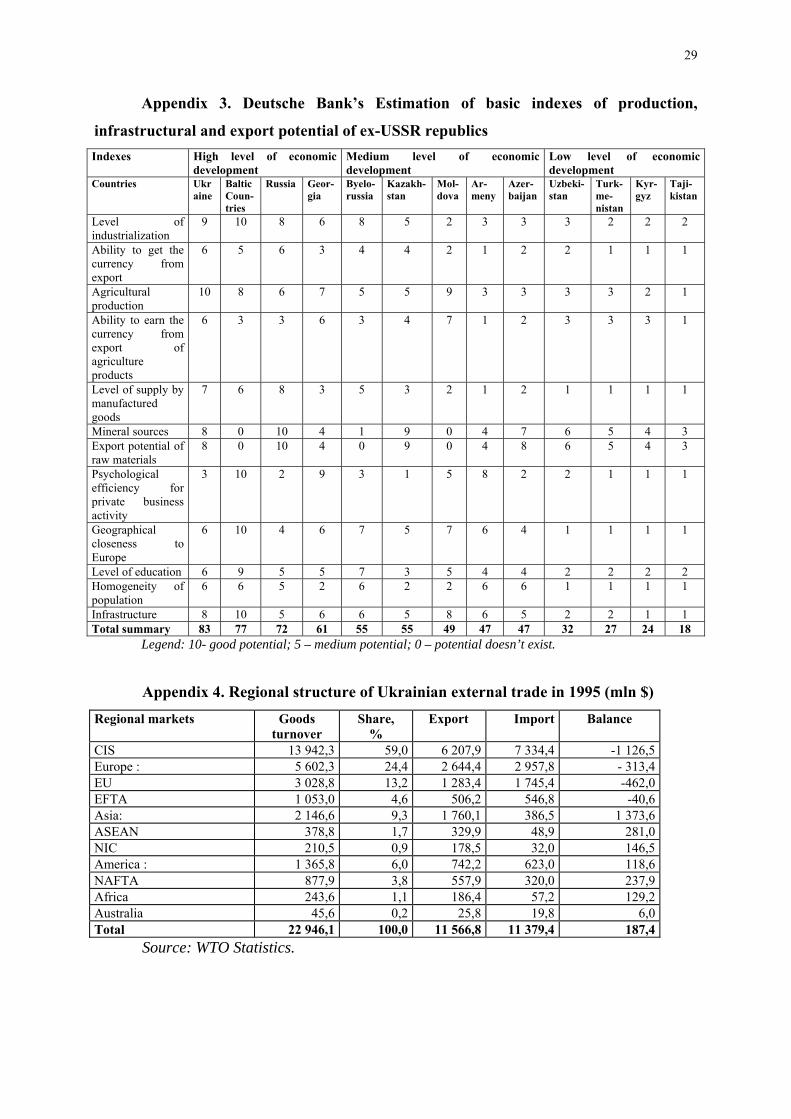
We should stress that at the moment of USSR’s collapse Ukraine was considered by
specialists of Deutsche Bank as one of the most developed its republics with the best
integration indexes (see appendix 2). In general there were three groups of the country
specified in this work:
1) High level of economic development (Ukraine, Baltic countries, Russia, Georgia)
2) Medium level of economic development (Byelorussia, Kazakhstan, Moldova,
Armenia, Azerbaijan)
3) Low level of economic development (Uzbekistan, Turkmenistan, Kyrgyz,
Tadjikistan).
Ukraine also is a country which has legged in the transition stakes (see EBRD, 1997;
World Bank, 1996).
From the moment of its independence Ukraine started to host foreign investments. By
some optimistic expectations, from the moment of USSR’s collapse, Ukraine had good
chances to receive foreign investments, due to some positive factors: its large market with (at
that moment) 51-million population; high level of education of local working population; low
level of salaries; presence of raw materials’ sources; presence of scientific and technical
creations of world’s level; high qualification of workers; relatively developed infrastructure;
good geographical position. However, these estimations didn’t come true, and investment
activity seriously slowed down during 1990-1996 years (investment decreased for 78.5% and
the share of investments in GDP decreased from 22.7% to 13%).
Then, during 2000-2004 years the situation with FDI improved (see Appendix 2). For
last year investments (gross fixed) remained at the level of 20.9% of GDP, which is half less
than the same index in China in the same period of time, although a bit higher than in
Macedonia (with 18,3%) and even Poland (18.2%).
2. International trade evolution

16
Since its independence and fall of certain export restrictions, Ukraine achieved certain
progress in its international trade. The Balance of Ukrainian international trade is shown in
the table 4.
Table 4. Balance of Ukrainian International Trade during, 1996-2006 (million US
dollars)
Years External trade
turnover
Export Import Balance
1997 37516,6 18970,3 -18546,3 424
1998 32563,7 16457,2 -16106, 5 350,7
1999 32295 17058 -15237 1821
2000 37638 19522 -18116 1406
2001 41570 21068 -20502 566
2002 44845 23351 -21494 1857
2003 56618 28953 -27665 1288
2004 73590 39415 -34175 5240
2005 85336 38220 -37180 1040
2006* 95080 51748 -43332 8416
*- forecast by CASE Ukraine, [12]
Source: NBU, CASE Ukrainian Estimations.
It should be mentioned that in spite of very optimistic forecast of some economists
(CASE, 2004), influenced my Orange Revolution Inspiration, the exports level didn’t achieve
expected 45979 million USD in 2005 year, while import was a bit lower than expected 39357
million USD. It still left trade balance positive, but it is one of the worst balance data since
1998 for Ukraine. Instead of programmed 6622 million USD, Ukraine has achieved the
balance of 1040 million USD.
While the trade balance of Ukraine recently remained positive, its structure has had
some negative changes. The main index of export for Ukraine was always iron and steel and
its share in total volume of export constantly growing. Ukraine remains always among few
leading exporters of iron and steel and its share in world’s iron and steel export was 4.2%
which is 6th place among world’s leaders iron and steel exporters.
Table 5 Detailed trade balance of Ukraine by industries, 2000-2005.
INDEX VALUE, MILLION USD SHARE IN ECONOMY’S TOTAL MERCHANDISE EXPORT OR IMPORT, %
IF NOT MENTIONED

17
OTHERWISE 2000 2001 2002 2003 2004 2000 2004 or
nearest year
Imports of agricultural products 1092 n\a 1308 2467 2235 7.8 7.7
Import of fuels and mining
products
5997 6439 6652 7856 10160 43.0 395.0
Exports of manufactures 9,77 10,44 11,86 15.23 22.68 67.1 69.4
Imports of manufactures 5.74 7,01 8,21 11.61 15.19 52.4 15.19
Exports of automotive products 145 167 154 126 214 0.1 0,7
Imports of automotive products 446 617 921 1730 2144 3.2 7,4
Textile exports 127 n\a 158 205 225 0.9 0.7
Textile imports 450 493 516 643 741 3.2 2.6
Clothing exports 417 498 503 568 671 2.9 2,1
Clothing imports 60 82 94 128 124 0.4 0,4
WTO. Statistics: International trade statistic 2005, trade by sector.
At the moment, there are some important structural tendencies of Ukrainian export-
import worth mentioning:
- export of row materials predominant (about 70%), mainly consisting of
ferrous metallurgy’s products – 32%, chemical production – 12%, food
industry – 10%, machine-building – 10%.
- Import, oriented on “vitally important” production – petroleum, gas (52%),
products of machine-building (13%), close burning coal, medical supplies,
food products;
- Extreme irregular allocation of export potential of Ukraine, which means that
4 regions from 25 supply more than 50% of whole export (Dnepropetrovsk,
Donetsk, Lougansk, Odessa regions);
- High orientation of Ukrainian trade on republics of ex-USSR (up to 70% of
external trade turnover in some sectors) predominated during few first years
of independence;
- Domination of raw material intensive equipment in export of products of
machine-building.
One of the most significant changes in Ukrainian international trade is change of its
main trade partners or regional structure of trade.

18
If we look through statistics of few first years of independence, for example 1995year
(see appendix 2), we would notice that 59% of Ukrainian external trade was realized with
CIS countries and only 24% with European countries, which is logical. Ten years later, the
most important export partners for Ukraine are Russia 19.3%, Turkey 7%, Italy 6.1% (2005)
and the most important importers are Russia 33.9%, Germany 11.3%, Poland 6.7%, China
6.5%, and Turkmenistan 5.5% (2005).
3. PCT and chances for Ukraine. Classification of economical sectors
Considering internationalization of Ukrainian companies, it is probably possible (there
are no exact application of the model done yet), to apply the classic Vernon’s model. In this
case we can only hypothesize a second stage of the model – initiation of exporting of selected
goods.
In his later works, R. VERNON (1972) moves forward with his theory and makes very
important remarks about disposition of a country to develop a new product, which means to
become a “leader” in some fields. He says that in order for substantial industrial innovation to
take place in the country, a body of trained engineers and interested businessmen must exist.
But this is not enough. The new products that engineers and businessmen are likely to develop
are those which seem most wanted in the country, that is, those which seem to have the most
ready local market. But there are no two countries in which local market conditions are quite
alike.
In industrial field, to be sure, all countries welcome new products or processes that
will cut costs, Vernon underline (1972). But in the country where skilled labor is exceedingly
scarce and dear while capital is abundant and cheap, the innovations that will cut costs tend to
be labor saving and capital-using. And the countries where raw materials are scarce and dear
while labor is abundant and cheap, the innovations that will capture the imagination of
businessmen and engineers tend to be material-saving and labor saving.
Some authors (L. KLIMOVICH and others) suppose, taking into consideration positive
examples of China, Poland, Czech Republic, Hungary (as analyzed above), that it is possible
for the ex-USSR countries to gain a part of European market. Of course, for the moments it is
only assumption.
For example, Byelorussian metallurgical plant (BMP), after applying certain
innovations, started to produce high tech metal production and became a monopolist on

19
internal market and at the Russian market. Geographical expansion of the sales allowed this
company to occupy 14 % of world market of metal cord. It’s also contributed to effective
export policy of the enterprise. There are some joint ventures founded with partners of this
company. They are located in Western Europe. At the moment there is creation of joint
venture with US partners going on. Unfortunately, there are always some obstacles for
export’s growth in Byelorussia remaining which is beyond the scope of this paper to discuss.
According classification of Pavitt (1984) there are two main sectors of economy exist:
Traditional sectors: in developing countries and countries with transitional economy
this sector hosts up to 44% of FDI in particular in Poland and Ukraine. As an example it is
food production, mineral sources, raw material sectors in Ukraine which attract FDI at the
moment.
Innovation sectors: are not always popular among foreign investors. In whole Central
and Eastern Europe it is Hungary, Czech Republic and Poland who host 82% of all FDI in
innovation sectors.
As competitive high-technological (or innovative) sectors of Ukrainian economy we
have mentioned the aerospace technologies, and aircrafts production. Here might be the key to
the question of possible leading at the international markets for Ukraine. Let’s see the
situation in details in those branches of the economy.
As for aerospace technologies, according to E. KUZNETCOV (2005), vice-president of
National Aerospace Agency of Ukraine, Ukraine just finished to prepare the project of
agreement with EU considering the programme of global civil satellite system EGNOS
Galileo: “We just worked out the project of agreement between Ukraine and EU considering
integration of Ukraine into “Galileo” system. Ukraine will give its on-earth stations of
observation, which will treat telemetric data of European satellites”. The Global European
system of navigation will be expanding in 2007-2008 years. It’s planned to send to the orbit
up to 30 spacecrafts for telecommunication and Earth’s sounding. The total cost of the project
is over 3 milliards euros. “Thanks to Galileo System, the owners of vehicles may always have
the exact information about its location” – E. KUZNETCOV also stressed: “We would like also
to participate in development, production and launching of space technical equipment for
Galileo system, but we faced some refuse because European countries are interested in
promoting their equipment and services, they see Ukraine as serious competitor in this
sphere”. The main competitor for Ukraine in this sphere is France, but French carrier rocket
“Arian” has fewer contracts for space transporting services than Ukrainian carrier rockets
“Cyclone” and “Zenith”.

20
Agreement between Ukraine and EU should lead to their collaboration in civil satellite
navigation. Besides this, the agreement should become a base for following projects and
programmes considering participating of Ukraine in management of Galileo project and help
to approaching between Ukraine and European space agency (ESA).
Galileo is the first common programme of EU and ESA. This new navigation satellite
system is supposed to provide by 2008 year the same level of service as American system
Global Position System (GPS). It’s preview to product and launch to the orbit 38 satellites.
It’s supposed that participation in EGNOS Galileo would provide high-effectiveness
of international transporting corridors going through Ukraine, and will access to high-
frequency navigation information of very vary application, including national economy,
science, national security system etc.
Another product, giving an economic perspective to Ukraine is its aircrafts creation
and construction.
Well-known Ukrainian transporting aircraft AN-225 “Mria” keeps the record on
shipping of large dimension cargo and even mentioned in Guinness Record book (information
by press-service of АНТК named after Antonov with the reference to International Aerospace
Federation - FAI). Furthermore, Antonov’s company has another six international records
achieved at 16, 18, and 19 of June, 2004 by the plane AN-225 “Mrija” after establishing of
commercial flights Prague-Tashkent (transportation of big-volume goods). There are also
some speed records in two classes of turbo-reactive planes C1 and C1t (with the takeoff
weight more than 300 tons) on the approved by FAI routes Prague-Kiiv, Kiiv-Ulianovsk,
Tashkent-Kiiv. The plane AN-225 “Mrija” achieved the speed of 684,67; 662; 693,2 km per
hour. Thus, the plane AN-225 “Mrija” has 240 international records, as a plane which took off
with the maximal weight 640860 kilograms and which has maximum of records, AN-225
“Mrija” was included in Guiness Records book at November,9 2004.
Service's sector in Ukraine is one of developing at the moment.
Summing up, there are some sectors of Ukrainian economy which have certain
potential to become export-intensive. Unfortunately, hosting of FDI in Ukraine is still pretty
chaotic, innovative and service sectors have luck of investment while traditional sectors which
are better to protect, remaining the main destination of FDI.
What are the obstacles which delay the braking into international market for those
potentially successful products for Ukraine? Let’s see in the next part of the paper.
21
4. Obstacles for PCT application on Ukrainian case. Perspectives of further
industrial upgrading.
Considering all said above we can assume, that the country has no chances to
transform its economy into post-industrial only with trade liberalisation (complete fail of
Washington consensus is studied more detailed in our paper O. GUROVA “Globalization and
the process of transition in Eastern-European countries. The case of Ukraine”). It is
impossible, stresses PAKHOMOV Y., and other Ukrainian economists, without developing
science intensive technologies. But even considerably developed technologies can not
guarantee success on the world market without certification and respect of common world’s
standards. In process of developing this paper we arrived to conclusion, however, that there
are some important determinants for becoming a trade leader at the world market for
Ukrainian “strong” sectors of economics:
1) Developing of technological clusters
2) realization of common certification for perspective range of products
3) well-balanced governmental policy towards developing exports, hosting FDI,
developing high tech production (example of China is very useful).
Both, M. PORTER (1990) and S. SOKOLENKO (2003) consider that when we talk about
competitiveness of the country, we should talk about competitiveness of its clusters, not
simply particular firms and companies. The main idea of the cluster theory here is the ability
of the cluster to use whole the range of its internal sources on its maximum. M. PORTER,
within his theory of clusters, developed the system of determinants of counties’
competitiveness, which is called “Diamond Model”.
According to M. PORTER’s theory (1990), cluster is a group of geographically close,
interconnected companies (producers, suppliers etc.) and other establishments connected to
them (universities, authorities, infrastructure’s firms), acting in the same field and
supplementing each others. It means that traditional country advantages (land, location,
natural resources, labor, local population size) which are hardly influenced, should not
determine completely national economy’s opportunity, so, to influence country’s economy’s
development, there clusters’ strategy proposed.
M. PORTER says clusters can influence competition in three ways:
- they can increase the productivity of the companies in the cluster;
- they can drive innovation in the field;
- they can stimulate new business in the field.

22
Well-known examples of clusters are USA/Silicon Valley (computers),
Netherlands/Rotterdam (logistics), India/Bangalore (software outsourcing), USA/Hollywood
(movies), France/Paris (fashion).
St. SOKOLENKO (2003) proposes to use the example of France in cluster’s strategy. In
France, there are few important clusters exist at the moment:
1) healthcare cluster(Lyon, Rhone-Alps)
2) Aerospace technologies cluster (Bordeaux, Toulouse)
3) Transportation and navigation integrated system (Île de France)
4) Telecommunications’ systems’ security (Province, Alps, Cote d’Azûr)
5) Nanotechnologies and microelectronics systems (near Grenoble)
6) Biotechnologies cluster (Midi Tech Santé)
Ukrainian scientists already have some potential for leadership in fields as following:
aerospace technologies; science of materials; electrometallurgy; electric welding; mechanics
of interaction of solids with ionized medium and E-field radiation; mechanics of composition
and heterogeneous medium; methods of nano-processes control; radio-physics; functions’
theory; cryobiology and cryological medicine; neurophysiology; marine radio- and
hemoecology. From our point of view, there some of mentioned field of science may become
the basis for future economic clusters in Ukraine.
Detailed examination of M. PORTER’s theory and its application on Ukrainian case is
beyond the scope of this paper, but the aim of our next paper.
Second obstacle mentioned is certification issue. During Soviet time, Ukrainian
industry as well as industry of other 14 Soviet republics, worked under internal common
standards and certification system. That enabled USSR economy to have commonly
respected, high quality certification within the country and COMECON, but disabled to
export majority of them as well as services. This lead CEE and CIS countries to another
significant gap between them and their potential trade partners. Even thought some of
Ukrainian goods have higher quality than Chinese, for example, we can not offer them, at
European market, because of luck of ISO certificates and different standards. Obviously, there
are only one way to resolve this problem – to let Ukrainian goods get ISO certificates and to
enable Ukrainian producers to be equal players at the world market. This is also one of the
major obstacles for the trade liberalization idea: without world’s common certification,

23
Ukraine became just a good market for international companies, exporter of raw materials, but
not an equal trader.
Conclusion:
It is obvious that PCT developed originally only USA and other developed countries
might be applied for others, even developing economies (China as recent evidence).
It is too early to correlate Ukrainian trade and PCT.
Ukraine economy has range of fields where leading might be possible forced by its
scientific potential and/or its relatively cheap and abundant sources.
There are some valuable experience that Ukraine can learn from its CEE neighbours,
especially Poland and Hungary (in electronics production sector), and China with its
governmental control of FDI and production development.
However, there some serious obstacles as luck of certification, lack of support on
governmental level in such important issues as creation of common programme of export
development and FDI hosting, battling corruption (as an important obstacle to FDI hosting)
etc.
In our opinion, Porter’s “Diamond Model” and clusters’ creation might be a solution
for some perspective sectors of Ukrainian economy.
There are some examples of cluster’s creation in Ukraine which development and
efficiency are worth to observe before making conclusion.

24
Literature AHARONI, Yari, (1969)“The Foreign Direct Investment Decision Process”. Boston:
Harvard University, Division of Research, Graduate School of Business Administration
AZHAR T.M. AND LEUNG L.C., (1993) "A Multi-Attribute Product Life-Cycle
Approach To Replacement Decisions: An Application Of Saaty's System-With-Feedback
Method," Engineering Economist, Summer , pp. 321-344.
BAYUS, B.L. (1994) "Are Product Life Cycles Really Getting Shorter?" Journal Of
Product Innovation Management, September, pp. 300-308.
BENNETT R.C. and. COOPER R.G, (October 1984) "The Product Life Cycle Trap,"
Business Horizons, , pp. 7-16.
BELDERBOS R., SLEWAEGEN L., “ Foreign Investment and International Plant
Configuration: Whither the product Cycle?” NIBOR Reseatch Memorandum RM/00/03.
BELL, J. “The internationalization of small computer softwear firms, A further
challenge to “stage” theotires”, European Journal of Marketing, 29 (8), 60-75.
BENNETT R.C. and COOPER R.G., (1984) "The Product Life Cycle Trap," Business
Horizons, October 1984, pp. 7-16.
BERNARD A. B., JENSEN J. B. (2001) Why Some Firms Export. MIT Dept. of
Economics Working Paper # 97-26.
BUCKLEY, P.J. and CASSON M. (1976). The future of Multinational Enterprise. New
York: Holmes&Meier.
BUCKLEY, P.J. and CASSON M (1981). “The optimal timing of foreign direct
investment” Economic Journal, 91, pp.75-87.
CAMPA, J., DONNENFELD S. and WEBER S. (1998) “Market Structure and Foreign
Direct Investment”, Review of International Economics, 6, pp. 361-380.
CASE Ukraine: Ukrainian Economic Outlook. Tendencies, Estimates, Forecasts.
CATWELL, J. (1995). “The globalisation of technology: what remains of the product
cycle model”, Cambridge Journal of Economics, 19, pp. 155-174.

25
CHUN Zhu Susan. Trade, product cycles, and inequality within and between countries.
Canadian Journal of Economics/ Revue canadienne d’Economique, Vol. 37, No.4.
DANIELS, John D. and RADEBAUGH, Lee, ( ) “International Business Environments
and Operations”.
DAVIDSON W.H. (1980) The Location of Foreign Direct Investment Activity: Country
Characteristics and Experience Effects, Journal of International Business Studies, 11, pp. 9-
22.
DEARDORFF, A. V. (1984) An Exposition and Exploration of Krueger’s Trade Model,
Canadian Journal of Economics 36, pp. 167-175.
DICKEN, P. (1998) Global Shift: transforming the world economy, third edition. Paul
Chapman Publishing ltd., London.
DUNNING, John, (1988) “The Eclectic Paradigm of International Production: A
Restatement and Some Possible Extensions”, Journal of International Business Studies, #19.
DUTHIL G., GUROVA O. (2005) « Ukraine: état économique et perspectives dans
l’Europe », 54 Congres of International Association of Economists, Aix-en-Provence, May,
23-25, 2005.
DUTHIL Gerard. (2006) Progrès technique et marché du travail, L’harmattan.
FEENSTRA, R.C., ROSE A. K. (2000) “Putting Things In Order: Trade Dynamics And
Product Cycles”, The Review Of Economics and Statistics, MIT Press, vol. 82(3), pp. 369-
382.
FOMISHIN S.V. (2002) International Economic Relations on the Edge of Millennia/
Kherson: Oldi-plus,.- 560p
GROSSMAN, GENE and E. HELPMAN, (1991), Endogenous Product Cycles, Economic
Journal, 101, 1214-1229.
HIRSCH, S., (1967), Location of Industry and International Competitiveness, Oxford
University Press, Oxford.
International Economics. Appleyard Field. 3rd ed. (p 176-180).
International Trade. Theory, strategies, and evidence. RIVERA-BATIZ A. LUIS, OLIVA
MARIA-ANGELS. Oxford University Press.
KARLSSON, C., (1988), Innovation Adoption and The Product Life Cycle, Umea
Economic Studies No. 185, Umea University.

26
KIRICHENKO A. (1999) “Foreign Trade of Ukraine on the threshold of III millennium”
Foreign Trade Review.- №1-2.
KLEPPER, S., (1996), “Entry, Exit, Growth, and Innovation over the Product Life
Cycle”, American Economic Review, Vol. 86, 3: 562-84.
KLIMOVICH L., (1999) «Тенденции развития транснациональных компаний в
совсременных условиях». Белорусский журнал международного права и
международных отношенийб № 3.
KRAVIS, I. B. and LIPSAY, R. E. (1982) Location of Overseas Production and
Production for Exports by U. S. Multinational Firms. Journal of International Economics. 12:
201-33.
KUZNETS, S., (1929), “Retardation in Economic Growth”, Journal of Economic and
Business History, 1: 534-60.
E. KUZNETCOV (2005), “Delovoj Myr” programme, UT-1.
MADURA, Jeff, (1998) “International Financial Management”, West Publishing, 653p.
MAGEE, S.P, (1977) “Multinational Corporations, the Industry Technology Cycle and
Development”, Journal of World Trade Low, 2:297-321.
MIKIC M. (1998) International Trade. St. Martin’s Press, New York,.
MYSHKO S. « Ukrainian Export's Potential », Business inform 1998.-#11.
NGUYEN Quoc Hung. Jan. (2004), Product Cycle Mechanism with Foreign Direct
Investment, and the technology Transfer.
PARRY, Thomas, (1981) “The Multinational Enterprise: International Investment and
Host Country Impacts”. Journal of International Business Studies, Vol. 12, No. 1, Tenth
Anniversary Special Issue , pp. 156-158.
PAVITT, K., and ROTHWELL R., (1976), « A comment on « A dynamic model of
process and product innovation », Omega, 4 :375-77.
PORTER M. E., (1990) The Competitive advantage of the nation. New York.
POSNER, M. V. (1961) International Trade and Technical Change, Oxford Economic
Papers 13, pp. 323-341.
POTTS G.W., (1988) "Exploit Your Product's Service Life Cycle," Harvard Business
Review, September-October, pp. 32-34.
Review of Ukraine’s Foreign Trade in 2004 http://www3.sympatico.ca
SALVATORE Dominick. International Economics. 7th ed. (185-188)
27
SHAPIRO, Alan, (2004) “Foundations of Multinational Financial Management”, 5th
ed., John Wiley & Sons.
J. SHEWCHUCK, (1992) "Life Cycle Thinking," CMA Magazine, May, pp. 34-36.
UTTERBACK J. M. and ABERNATHY W. J. (1975) “ A dynamic Model of Process and
Product Innovation”, Omega, Vol. 3, 639-56.
VERNON, R. (1973) Economic and political consequences of multinational enterprise.
VERNON, R. (1972) Economic environment of international business.
VERNON, R. (1973) Entreprises multinationals.
VERNON, R. (1985) Exploring the global economy.
VERNON, R. (1966) "International Investment and International Trade in the Product
Cycle," Quarterly Journal of Economics 80(2):190-207.
VERNON, R. (1977) Storm over the multinationals.
VERNON, R. (1970) Technology factor in international trade.
VERNON, R. (1979) “The Product Cycle Hypothesis in a New International
Environment”. Oxford Bulletin of Economics and Statistics, 41, 225-267.
World Bank statistics: http://wbln0018.worldbank.org
www.ukrstat.gov.ua

28
Appendixes Appendix 1 Rating of world’s largest steel’s producers (by beginning of 2004)
Place in the rating
Name of the company Production (million tons)
1 Arcelor 42,8 2 LNM Group 35,3 3 Nippon Steel 31,3 4 JFE 30,2 5 Posco 28,9 6 Shanghai Baosteel 19,9 7 Corus Group 19,1 8 US Steel 17,9 9 ThyssenKrupp 16,1 10 Nuccor 15,8 13 ISG 10,3 28 « Kryvorozhstal »
(« Криворожсталь ») (became a part of Mital Group in 2006)
7,1
31 ММC names after Illich (ММК им Ильича)
6,5
40 Azovstal (“Азовсталь”) 5,3 55 Zaporozhstal
(“Запорожсталь”) 4,4
67 Alchevsk metal combinat (Алчевский меткомбинат)
3,5
73 DMP named after Petrovsky (ДМЗ им.Петровского)
3,2
Data by International Institute of cast iron and steel, compiled by author.
Appendix 2. Direct Foreign Investments into Ukrainian economy 1999-2005yy. Addition (growth) Year
$ mln Times or %
Per habitant, $ Total, milliards $
1999 50 3.1
2001 80 3,923
2002 1074.82 8,4% 111 5,339
2003 1319,9 16-17% 140 6,6576
2004 1559,5 23% 177 8.3539
Data by The State Statistics committee of Ukraine
29
Appendix 3. Deutsche Bank’s Estimation of basic indexes of production,
infrastructural and export potential of ex-USSR republics Indexes High level of economic
development Medium level of economic development
Low level of economic development
Countries Ukraine
Baltic Coun-tries
Russia Geor-gia
Byelo-russia
Kazakh-stan
Mol-dova
Ar-meny
Azer-baijan
Uzbeki-stan
Turk-me-nistan
Kyr-gyz
Taji-kistan
Level of industrialization
9 10 8 6 8 5 2 3 3 3 2 2 2
Ability to get the currency from export
6 5 6 3 4 4 2 1 2 2 1 1 1
Agricultural production
10 8 6 7 5 5 9 3 3 3 3 2 1
Ability to earn the currency from export of agriculture products
6 3 3 6 3 4 7 1 2 3 3 3 1
Level of supply by manufactured goods
7 6 8 3 5 3 2 1 2 1 1 1 1
Mineral sources 8 0 10 4 1 9 0 4 7 6 5 4 3 Export potential of raw materials
8 0 10 4 0 9 0 4 8 6 5 4 3
Psychological efficiency for private business activity
3 10 2 9 3 1 5 8 2 2 1 1 1
Geographical closeness to Europe
6 10 4 6 7 5 7 6 4 1 1 1 1
Level of education 6 9 5 5 7 3 5 4 4 2 2 2 2 Homogeneity of population
6 6 5 2 6 2 2 6 6 1 1 1 1
Infrastructure 8 10 5 6 6 5 8 6 5 2 2 1 1 Total summary 83 77 72 61 55 55 49 47 47 32 27 24 18
Legend: 10- good potential; 5 – medium potential; 0 – potential doesn’t exist.
Appendix 4. Regional structure of Ukrainian external trade in 1995 (mln $) Regional markets Goods
turnover Share,
% Export Import Balance
CIS 13 942,3 59,0 6 207,9 7 334,4 -1 126,5Europe : 5 602,3 24,4 2 644,4 2 957,8 - 313,4ЕU 3 028,8 13,2 1 283,4 1 745,4 -462,0ЕFТA 1 053,0 4,6 506,2 546,8 -40,6Asia: 2 146,6 9,3 1 760,1 386,5 1 373,6АSEAN 378,8 1,7 329,9 48,9 281,0NIC 210,5 0,9 178,5 32,0 146,5America : 1 365,8 6,0 742,2 623,0 118,6NAFTA 877,9 3,8 557,9 320,0 237,9Africa 243,6 1,1 186,4 57,2 129,2Аustralia 45,6 0,2 25,8 19,8 6,0Total 22 946,1 100,0 11 566,8 11 379,4 187,4
Source: WTO Statistics.