Embed Size (px)
Citation preview

TThhee PPrriivvaattee SSeeccttoorr IICC&&II WWaassttee MMaannaaggeemmeenntt SSyysstteemm
iinn OOnnttaarriioo
Report Prepared For Ontario Waste Management Association
By
RIS International Ltd
January 2005

TTaabbllee ooff CCoonntteennttss
Section Title Page
Executive Summary ES-1
1 Introduction 1
2 Ontario Waste Management Industry Statistics 2 2.1 IC&I Waste Generators 2 2.2 Ontario Waste Management Industry Statistics 2 2.3 Ontario Private Sector Waste Management Industry
Statistics 3
2.4 Ontario Public Sector Waste Management Statistics 5
3 IC&I Waste Generation, Diversion and Disposal 7 3.1 Current IC&I and C&D Waste Generation, Diversion and
Disposal in Ontario 7
3.2 IC&I Waste Diversion in Ontario 7 3.3 Current 3Rs Regulations for IC&I Waste Generators in
Ontario 8
3.4 Disposal of IC&I and C&D Waste 9
4 Composition of IC&I Waste 10 4.1 IC&I Waste Generation By Sector and By Material 10 4.2 Composition of Construction and Demolition Waste 11 4.3 Materials Diverted By The Ontario IC&I Sector 12 4.4 Waste Composition for Selected IC&I Generator
Categories 13
5 Transfer of IC&I Waste in Ontario 15 5.1 Transfer Station Inventory 15 5.2 Transfer Station Operations 16 5.3 Approval Requirements for Transfer Stations 17
6 Processing 19 6.1 Processing at Transfer Stations 19 6.2 Recovery of Materials At Landfills 20 6.3 MRFs for Recyclables 20 6.4 Glass Processing 21 6.5 C&D Waste Processing 22 6.6 Wood Processing 22 6.7 Food Waste Processing 23 6.8 Composting and Anaerobic Digestion Operations 23 6.9 Metals 25 6.10 Mixed Waste Processing 25
7 Disposal of IC&I Waste 26

7.1 Number of Landfills in Ontario 27 7.2 Estimate of Landfill Capacity in Ontario in 2003 27 7.3 Permitted Fill Rates for Ontario Landfills 28 7.4 Private Sector Landfill Capacity in Ontario 29 7.5 Background to Waste Export 37 7.6 Waste Exported from Ontario to Michigan 38 7.7 Summary 42
8 Summary of Findings and Conclusions 44
Appendix A
Collection of Industrial, Commercial and Institutional Waste
Appendix
B Impacts of Border Crossings on IC&I Waste Management
Infrastructure in Ontario
LLiisstt ooff TTaabblleess
Table or Figure #
Title Page
2.1 Private Sector and Public Sector Waste Management Industry
Statistics for Ontario 3
2.2 Financial and Employment Characteristics for Business Sector Waste Management Firms in Ontario (2000 and 2002)
4
2.3 Collection Revenues by Source and Activity, 2002 52.4 Financial and Employment Characteristics for Ontario Public
Sector Waste Management Activities (2000 and 2002) 6
3.1 Waste Generation, Diversion and Disposal By Ontario Sources,
2002 7
4.1 Waste Generated By IC&I Sources in Ontario, 2002 104.2 Ontario IC&I Waste Composition, 2002 114.3 Construction and Demolition Waste Composition 124.4 Materials Diverted By the Ontario IC&I Sector in 2002 124.5 Waste Composition fo Retail, Schools, Hotels and Offices 134.6 Waste Composition for Food Service and Food Related Waste
Generators 14
5.1 Transfer Stations in Ontario By Region 16 6.1 Material Recovery Facilities in Ontario 216.2 Composting and Anaerobic Digestion Facilities in Ontario 24 7.1 Ontario Landfill Inventory By Region, 2004 277.2 Landfill Capacity in Ontario By Region 287.3 Annual Permitted Fill Rates for Ontario Landfills By Region 297.4 Major Ontario Private Sector Landfill Expansions in the Planning
Stages in 2004 32
7.5 Export of Solid Waste From Canada to the United States, 2003 377.6 Ontario Waste Landfilled in Michigan by Landfill Site: October 1st, 39
2002 to September 30th, 2003 7.7 Origin of Solid Waste Disposed in Michigan Landfills, 1996 to 2003
(Millions of Tonnes) 39
7.8 Percentage of Solid Waste Disposed in Michigan Landfills From Different Sources, 1996 to 2003 (Millions of Tonnes)
40
7.9 Current Contracts For Disposal of GTA Municipal Waste, 2003 417.10 Non-Hazardous Solid Waste Exported to Michigan Landfills By
Origin, (2002-2003) 42
LLiisstt ooff FFiigguurreess Figure
# Title Page
7.1 IC&I Waste Disposal Capacity in Large Ontario Private Sector
Landfills – No Expansions 30
7.2 Annual Capacity for Disposal of IC&I Waste in Private Sector Landfills in Ontario
31
7.3 Annual Maximum Permitted Fill Rate for IC&I Waste at Private Sector Landfills in Ontario With All Current Expansion Applications Included
32
7.4 IC&I Disposal Capacity at Large Ontario Private Sector Landfills – Expansions in Place By 2008
33
7.5 Projected Landfill Capacity Deficit in Ontario 347.6 Annual Approved Fill Rate For IC&I Waste at Public Sector Landfills
in Ontario Compared To Annual Demand for Disposal Capacity – Expansions Included
35
7.7 Annual Approved Fill Rate For IC&I Waste at Public Sector Landfills in Ontario Compared To Annual Demand for Disposal Capacity – No Expansions
36

Executive Summary The IC&I waste management infrastructure in Ontario is a complex array of businesses, industries and systems that include:
Waste generators Private sector waste collectors Private sector waste processors Private sector waste transfer stations Private sector landfills Brokers and end markets for recycled materials Municipalities who collect IC&I waste Municipalities who process IC&I waste, and Municipalities who own and operate landfills, transfer stations and EFW facilities
where IC&I waste is processed or disposed of. The Ontario waste management industry consists of 436 businesses, ranging in size from single truck “mom and pop” operations to large multi-national corporations. The sector employs 9,116 people in Ontario (8,744 full time and 370 part time employees). Operating revenues are $1.76 billion, with expenditures at $1.52 billion. Approximately $161 million was spent on capital projects in 2002. About 80% of the industry’s collection business is serving private sector accounts; another 19% involves municipal collection contracts. Private sector businesses in Ontario generate 7.6 million tonnes of waste of which 1.4 million tonnes are diverted and 6.2 million tonnes are disposed. About 2 million tonnes of IC&I and C&D materials are currently disposed in the US, mostly in landfills in Michigan, although some waste goes to New York State also. Over 3 million tonnes are disposed in private sector Ontario landfills; the remainder is disposed in municipal landfills. Most Ontario IC&I waste disposal occurs at 11 large private sector landfills. Most of these landfills are located in Southwestern Ontario, and a few are located in Eastern Ontario. These landfills have a permitted maximum fill rate of 3.4 million tonnes per year, significantly less than the 6.2 million tonnes of demand for disposal capacity. IC&I waste is managed through a network of 112 transfer stations, 11 of which are municipal transfer stations, throughout Ontario. About two thirds of these transfer stations are located in the Greater Toronto Area, with 29 located within City of Toronto. Transfer stations have become a more essential part of the IC&I waste management infrastructure since export to the US became a significant component of the waste management system. Permitted operating conditions for transfer stations vary, but the most critical limitation is the “in-out” limit, which is 299 tonnes/day for many transfer stations. This limits the capacity of the Ontario transfer station system, particularly when there is a significant border slowdown or shutdowns. IC&I waste is processed for diversion through a series of 76 MRFs, of which 56 are owned by private sector operators. IC&I waste is processed at some of the 74 composting operations in the province.
Page ES-1 December, 2004

Private Sector IC&I Waste Management System in Ontario
The study identified 37 composting or anaerobic digestion facilities in Ontario which are owned by the private sector. Another 37 are owned by the public sector. Only 15 of the 74 facilities had permitted capacities of over 20,000 tonnes per year, and a sizeable amount of the available capacity is concentrated in 5 facilities. The study identified a constructed capacity to process about 1 million tonnes per year of organic materials. This is less than required and waste collectors identified an “extreme shortage” of composting capacity to meet their needs. A small amount of diversion occurs at processing/transfer facilities and also by sorting mixed loads at landfills. Current permitted landfill capacity in Ontario is estimated at 80 million tonnes. This is lower than previous estimates because of the elimination of the Adams Mine Landfill as a disposal option. Approvals are being sought for an additional 61 million tonnes of capacity; no firm date is known for approval or denial of these applications. The gap between available landfill capacity in Ontario and our current IC&I waste disposal needs is currently filled by available landfill capacity in Michigan, but operators feel that September 11th, 2001 was a “wake-up call” to our vulnerability when access to the US is constrained. Slow downs at the border coupled with reduced hours of service for drivers in the US have created a host of operating challenges for Ontario waste management companies and haulage companies. Among these are driver retention, the need for additional trucks and containers and the unpredictability of border crossing times. It is prudent public policy for Ontario to establish sufficient domestic landfill capacity to meet our own needs. The current Environmental Assessment process in Ontario has discouraged the establishment of sufficient capacity within our own borders. US border laws and Michigan disposal rules now control the management of waste in Ontario.
Page ES-2 December, 2004

Private Sector IC&I Waste Management System in Ontario
1. Introduction This report describes how the private sector IC&I waste management system in the Province of Ontario operates and has evolved to meet changing emergency requirements in Ontario; the amounts of materials handled and how the material is collected, processed and disposed. The focus of this document is the management of non-hazardous IC&I (industrial, commercial and institutional) waste generated in the Province of Ontario. The information in this report has been compiled using a number of sources including:
Information provided through a survey of OWMA members; Information obtained through various published and unpublished reports, which are
referenced throughout the report; RIS in-house files; Interviews with OWMA members and other members of the IC&I and municipal waste
management sector. In this report, IC&I waste is defined as any material generated by industrial, commercial and institutional facilities (IC&I generators) for which the generator has no further use, and which is managed at off-site waste disposal, recycling or composting sites. This definition excludes wastes that are taken directly from the generator to a recycling or reuse application, and also waste which is managed on-site. This definition also excludes:
wastes that are associated with primary resource extraction or harvesting; agricultural wastes; mining wastes; conventional air pollutants; liquid effluents discharged from processing or manufacturing sites; nuclear wastes;
liquid and hazardous wastes (except for household hazardous waste); auto hulks; pathological wastes; gaseous wastes, and gravel and rocks.
This approach is consistent with approaches used by Statistics Canada and provincial governments, where large amounts of waste managed on-site (where they are generated) are not of interest in waste flow and diversion reporting. Wastes from construction and demolition activities which are disposed off-site are included in this definition. Biosolids from municipal waste treatment systems which are managed at landfills are considered municipal rather than IC&I waste.
Page 1 December, 2004

Private Sector IC&I Waste Management System in Ontario
2. Ontario Waste Management Industry Statistics 2.1 IC&I Waste Generators The Province of Ontario had a population of 12.2 million in 2002. There are 800,000 businesses in Ontario; 350,000 are employer businesses, and an additional 450,000 are incorporated or unincorporated businesses that do not have a CRA payroll deductions account1. The workforce of these 450,000 companies may consist of contract workers, family members and/or owners.
75% of the 350,000 employer businesses have less than 5 employees; 18% have 5-19 employees. Less than 10% have 20 employees or more Large businesses are estimated to account for only 2% of Ontario businesses2.
The breakdown for the 450,000 non-employer businesses in the province by size is not known. All of these businesses produce some waste. Most of the IC&I waste in Ontario is managed by private sector waste management service providers who usually haul it to private sector transfer stations for subsequent disposal at privately owned landfill sites. Smaller amounts of IC&I waste are hauled directly to landfill, either publicly or privately owned, depending on distance and tip fee. Some IC&I waste is collected by municipalities and managed in their systems. 2.2 Ontario Waste Management Industry Statistics General statistics for the Ontario waste management sector were obtained from Statistics Canada survey data of companies within NAICS Code 562 (Waste management and remediation services)3. This information was collected by Statistics Canada through a survey of the waste management industry located across Canada. The response rate to the survey was over 70%, but respondents actually represented about 95% of the business activity4, therefore this is considered a very reliable source of information. Table 2.1 summarizes the data from the Statistics Canada 2002 waste management industry survey for Ontario. Information on waste management activities by municipal governments is also included in the data. The Ontario waste management industry has 436 businesses, ranging in size from single truck mom and pop operations to large multi-national corporations. The sector employs 9,116 people in Ontario (8,744 full time and 370 part time employees). Operating revenues are $1.76 billion, with expenditures at $1.52 billion. Approximately $161 million was spent on capital projects in 2002. About 80% of the collection business is serving private sector accounts; another 19% involves municipal collection contracts.
Table 2.1: Private Sector and Public Sector Waste Management Industry Statistics For Ontario 1 Statistics Canada Business Register, June 2003 2 Personal communication, R Marikkar, Interface Flooring, Bellville, 11th August, 2004 3 Statistics Canada, 2004: Waste Management Industry: Business and Government Sectors, 2002 4 Personal communication, John Marshall, Senior Analyst, Waste Management Industry Survey, Statistics Canada, July, 2004
Page 2 December, 2004

Private Sector IC&I Waste Management System in Ontario
Measure Private Sector Public Sector Total
Waste Management Sector
Number of Businesses 437 (2000) 436 (2002)
Number of Employees5 9,606 (2000) 9114 (2002)
2,608
12,214
Operating/Current Expenditures ($ millions)
$1,307 (2000) $1,521 (2002)
$518 $ 1,825
Capital Expenditures ($ millions)
$177 (2000) $161 (2002)
$54
$ 231
Operating Revenues/ Revenue Sources ($ millions)
$1,556 (2000) $1,765(2002)
$226
$ 1,782
The sector had 1,737 businesses in Canada in 2000; this number had increased to 1,785 in 2002. For all of Canada (the Ontario breakdown was not available), the split of business by employment size was:
1,545 businesses had less than 20 employees; 159 businesses had 20-49 employees, and 81 businesses had 50 employees or more.
Applying the above proportions to the 436 businesses in Ontario would suggest the following breakdown by size:
377 businesses would have less than 20 employees; 39 businesses would have 20-49 employees, and 20 businesses would have 50 employees or more.
2.3 Ontario Private Sector Waste Management Industry Statistics Table 2.2 provides a more detailed breakdown of revenues and expenditures for the private sector waste management industry for 2002.
5 Includes full and part-time employees
Page 3 December, 2004

Private Sector IC&I Waste Management System in Ontario
Table 2.2: Financial and Employment Characteristics of Business Sector Waste Management Firms In Ontario (2000 and 20026)
Characteristic Value (Year 2000)
Value Preliminary 2002 Data
Number of Businesses
437 436
Employees Full-time employees Part-time employees
Total Employees
9,306 300 9,606
8,744 370 9,114
Operating Expenditures Wages and salaries Benefits Fuel and electricity Other materials/supplies Maintenance/repairs Depreciation Tipping Fees Operating licenses and permits Purchased services Overhead and administration Other expenses Total operating expenses
($ million) 286 46 57 122 112 111 362 10 9.5 36 155 $1,307
($million) 344 50 60 92 101 83 348 8 153 107 174 $1,521
Capital Expenditures Vehicles Other machinery/equipment Construction/refurbishing of facilities Maintenance/repairs Other Total capital expenditures Avg. capital expenditures per business
($ millions) 56 50 44 12 15 $177 $0.406
($ millions) 61 28 confidential710 confidential $161 $0.37
Operating Revenues Collection and transportation for disposal Collection and transportation for recycling/reuse Operation of a waste transfer facility Preparation of materials for recycling/reuse Operation of a disposal facility Operation of a hazardous waste facility Sewage treatment Sale of recovered materials Other waste management revenues
Total operating revenues
(millions) 823 267 145 107 125 17 4.8 24 42 $1,556
($ Millions) 857 260 184 93 161 34 13.6 157 51 $1,764
6 Statistics Canada, 2004: Waste Management Industry: Business and Government Sectors, 2002 7 Data can not be reported for confidentiality reasons (only one respondent)
Page 4 December, 2004

Private Sector IC&I Waste Management System in Ontario
For Canada (data is not available for Ontario) total operating expenditure for the waste management sector was $3 billion in 2000 and $3.37 billion in 2002. The breakdown of expenditure by industry size for all of Canada was:
$775 million for businesses with less than 20 employees; $573 million for businesses with 20-49 employees, and $2 billion for businesses with 50 employees or more.
If this data is pro-rated to Ontario based on population only (Ontario accounts for 38% of Canada’s population), it would suggest that expenditures in Ontario could be of the following order:
$295 million for businesses with less than 20 employees; $218 million for businesses with 20-49 employees, and $760 million for businesses with 50 employees or more.
Table 2.3 shows the proportion of private sector revenues which come from different sources (2002 data).
Table 2.3: Collection Revenues By Source and Activity, 2002 Residential IC&I Other Garbage Collection 19% 80% 1% Recyclables Collection 43% 56% 1% 2.4 Ontario Public Sector Waste Management Statistics Table 2.4 provides a more detailed breakdown of current expenditures, capital expenditures and revenue sources for public sector waste management activities.
Page 5 December, 2004

Private Sector IC&I Waste Management System in Ontario
Table 2.4: Financial and Employment Characteristics of Ontario Public Sector Waste Management Activities
(2000 and 2002)8
2000 2002 Employees Full-time employees Part-time employees Total employees
2,159 449 2,608
2391 410 2,801
Current Expenditures Collection and transportation Tipping fees Operation of disposal facilities Operation of transfer stations Operation of recycling facilities Operation of organic waste processing facilities Other
Total current expenditures
($ million) 221 82.4 123.5 not asked 38.9 10.7 42.3 $518.7
($millions) 272 51.5 107.3 26 44.7 8.5 55.3 $565.5
Capital Expenditures Collection and transportation Disposal facilities Recycling facilities Organics processing facilities Other Total capital expenditures
($ millions) 8 23 8.5 1.6 8.8 $53.7
($ millions) 6.6 46.2 18.6 2 7 $80.7
Revenue Sources Utility bill payments Contract revenues Sale of recyclable materials Tipping fees Disposal facility royalties Grants, loans, etc. Other revenues (bag tags, permits)
Total revenues
($ million) 3.3 0.9 58.1 144 5.7 3 11.3 $226.2
($millions) 5.9 13.9 70.9 136.9 14.9 9.5 20.3 $272.2
Of the total operating expenditure of $565 million, 44% was expended on in-house employees and 52% (51% in year 2000) was expended on contractors, with 4% expended on “other governments” in 2002. There was minimal change in the expenditure allocations between 2000 and 2002.
8 8 Statistics Canada, 2004: Waste Management Industry: Business and Government Sectors, 2002
Page 6 December, 2004

Private Sector IC&I Waste Management System in Ontario
3. IC&I Waste Generation, Diversion and Disposal 3.1 Current IC&I and C&D Waste Generation, Diversion and Disposal in Ontario Statistics Canada estimates that of the 6.5 million tonnes of IC&I waste generated in Ontario and managed by the waste management industry in 2002, 1.3 million tonnes were diverted and 5.2 million tonnes were disposed. C&D waste generation is estimated at 1.1 million tonnes, with diversion of 145,000 tonnes and disposal of about 1 million tonnes. The estimated diversion rate for IC&I waste is 20%, and the estimated diversion rate for C&D waste of 12%. The Canadian Construction Association disputes this estimate and feels the value is closer to 26%. Table 3.1 summarizes key waste generation, diversion and disposal statistics for Ontario for 2002 based on Statistics Canada 2002 data9. The response rate to the survey is over 70%, representing about 95% of the waste managed in the Province. Most of the large waste management industry players in Ontario have responded to the Statistics Canada survey. The survey responses are extrapolated by Statistics Canada to represent 100% of the waste managed.
Table 3.1: Waste Generation, Diversion and Disposal by Ontario Sources, 200210
(millions of tonnes per year)
Residential Waste
IC&I Waste C&D Waste Total
Total Waste Generation (tonnes per year)
4.4 6.5 1.2 12.0
Total Waste Recycled (tonnes per year)
0.95 1.3 0.144 2.4
Total Waste Disposed (tonnes per year)
3.4 5.2 1.0 9.6
Diversion Rate 22% 20% 12% 20%
3.2 IC&I Waste Diversion In Ontario Diversion of IC&I waste is estimated at about 20% by Statistics Canada. Private sector industry representatives consider the current 20% diversion rate to be the level of diversion which makes economic sense, and is the equilibrium level reached through market forces alone. There is a feeling within the industry that new regulations and enforcement of existing 3Rs regulations are both required to get to higher levels of IC&I waste diversion in Ontario. In the early 1990’s, various market and regulatory forces temporarily altered IC&I diversion practice in Ontario. When landfill tipping fees increased to $150/tonne in the GTA, many small recycling businesses were set up to divert various materials. These businesses were successful in the short term because they could offer diversion services at rates which were cheaper than 9 Statistics Canada, 2004: Waste Management Industry: Business and Government Sectors, 2002 10 Ibid
Page 7 December, 2004

Private Sector IC&I Waste Management System in Ontario
landfill. However, IC&I waste started to move to the US for disposal soon after the tipping fee increase in Toronto, because the cost of shipping waste to the US, plus the disposal fees there, were lower than local disposal in Toronto. At that time, IC&I waste was shipped to Ohio, New York State and Pennsylvania as well as to Michigan. A combination of state transportation regulations, axle weight restrictions in particular, and available disposal capacity at shorter distances from Southern Ontario has resulted in Michigan becoming the most economically attractive disposal destination for Ontario waste in recent years. The movement of waste to the US impacted the small recycling businesses, and also large private sector waste management companies who had set up new recycling operations. They were left with the choice of either repositioning their services towards transfer or go out of business. The demand for diversion services had collapsed due to the lower cost alternative of landfill even with very long haul distances and lack of regulatory enforcement of the 3Rs regulation requirements on the generator. 3.3 Current 3Rs Regulations For IC&I Waste Generators In Ontario Regulations 102, 103 and 104 require IC&I generators in certain categories to carry out waste audits and develop waste reduction plans. The regulations prescribe source separation requirements for businesses of different sizes. The regulations mostly target large IC&I generators. Some specific generators also must carry out packaging audits and develop packaging reduction workplans. Owners of multi-family buildings are required to implement source separation programs. There was an initial flurry of activity in the private sector waste management industry to meet the new needs of their customers following promulgation of the 3Rs regulations. Waste auditing and planning services were set up by a number of large as well as small private sector waste management industry members. A number of processing/transfer operations were constructed to meet the perceived new market needs resulting from the 3Rs regulations. The 3Rs regulations were enforced for a very short period of time, but enforcement ceased over time because of a lack of MOE resources. The Environmental Commissioner of Ontario drew attention to the lack of enforcement and lack of MOE enforcement staff in the 2000-2001 Annual Report11. IC&I waste generators stopped source separation, unless it made economic sense. Where source separation cost more for collection, or involved increased staff time, it was eliminated over time by many companies. Some waste management companies also offered a service to pick up unsorted waste and meet the recycling requirements by sorting the waste at mixed waste MRFs. New recycling or composting businesses which had been set up to meet the requirements of the 3Rs regulations in a temporarily high disposal price market were no longer viable and many went out of business. There is no documented information on the impacts of the 3Rs regulations when they were first introduced. A survey carried out by OWMA at that time established that overall, about 28% of IC&I waste was diverted, even though some individual plants achieved as high as 90% 11 Page 96, Environmental Commissioner of Ontario 2000-2001 Annual Report
Page 8 December, 2004

Private Sector IC&I Waste Management System in Ontario
diversion. The 3Rs regulations certainly prompted many companies to carry out waste audits that led to productivity improvements and lower waste management costs However, without sustained regulatory enforcement and oversight, these activities stopped at the point at which the generator determined that any further activities were non-viable economically. 3.4 Disposal of IC&I and C&D Waste Statistics Canada estimates that 5.2 million tonnes of IC&I waste and 1 million tonnes of C&D waste were disposed from Ontario sources in 2002. The numbers are likely fairly similar for 2003. It is estimated that about 2 million tonnes of this waste were disposed in the US, and the remaining 4.2 million tonnes were disposed in Ontario. Landfill capacity in Ontario is only available for 3.4 million tonnes per year of IC&I and C&D waste in private sector landfills, therefore the remaining 800,000 tonnes were likely disposed in municipal landfills. This implies that almost 13% of the disposal service to IC&I/C&D waste generators in Ontario is provided by municipally owned and operated landfill sites.
Page 9 December, 2004
Private Sector IC&I Waste Management System in Ontario
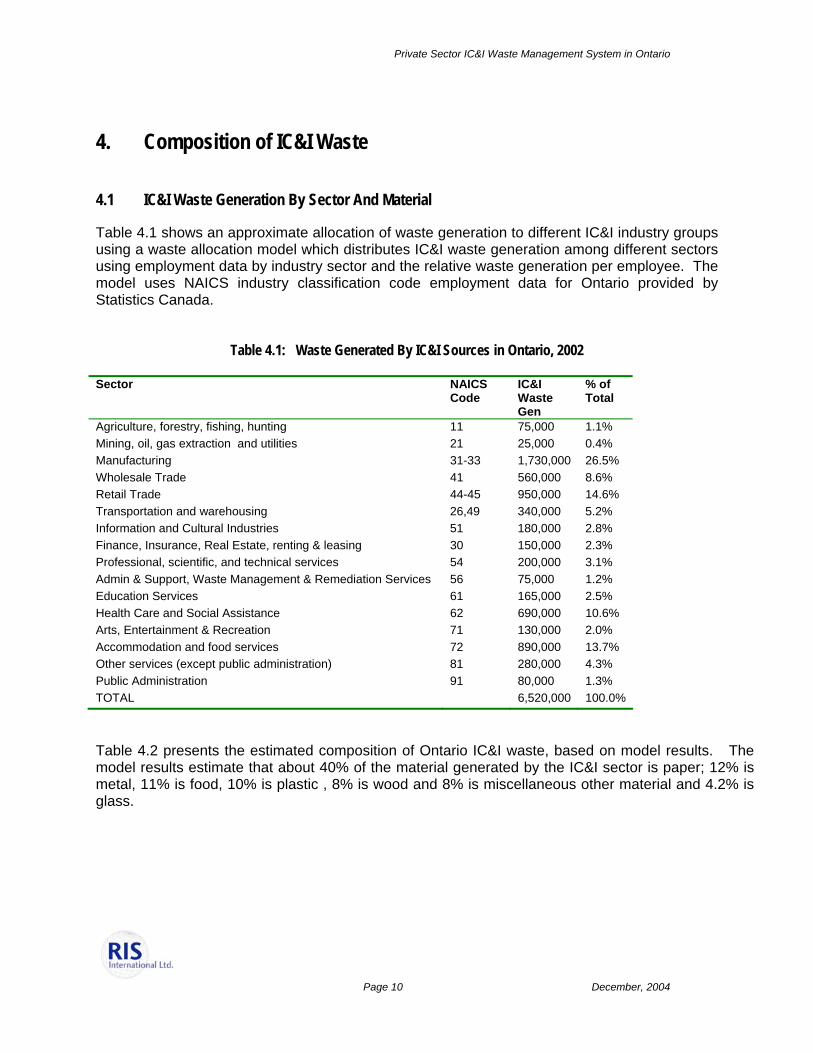
4. Composition of IC&I Waste 4.1 IC&I Waste Generation By Sector And Material Table 4.1 shows an approximate allocation of waste generation to different IC&I industry groups using a waste allocation model which distributes IC&I waste generation among different sectors using employment data by industry sector and the relative waste generation per employee. The model uses NAICS industry classification code employment data for Ontario provided by Statistics Canada.
Table 4.1: Waste Generated By IC&I Sources in Ontario, 2002 Sector NAICS
Code IC&I Waste Gen
% of Total
Agriculture, forestry, fishing, hunting 11 75,000 1.1% Mining, oil, gas extraction and utilities 21 25,000 0.4% Manufacturing 31-33 1,730,000 26.5% Wholesale Trade 41 560,000 8.6% Retail Trade 44-45 950,000 14.6% Transportation and warehousing 26,49 340,000 5.2% Information and Cultural Industries 51 180,000 2.8% Finance, Insurance, Real Estate, renting & leasing 30 150,000 2.3% Professional, scientific, and technical services 54 200,000 3.1% Admin & Support, Waste Management & Remediation Services 56 75,000 1.2% Education Services 61 165,000 2.5% Health Care and Social Assistance 62 690,000 10.6% Arts, Entertainment & Recreation 71 130,000 2.0% Accommodation and food services 72 890,000 13.7% Other services (except public administration) 81 280,000 4.3% Public Administration 91 80,000 1.3% TOTAL 6,520,000 100.0%
Table 4.2 presents the estimated composition of Ontario IC&I waste, based on model results. The model results estimate that about 40% of the material generated by the IC&I sector is paper; 12% is metal, 11% is food, 10% is plastic , 8% is wood and 8% is miscellaneous other material and 4.2% is glass.
Page 10 December, 2004

Private Sector IC&I Waste Management System in Ontario
Table 4.2: Ontario IC&I Waste Composition, 2002 Material Estimated Amount
Generated Estimated Composition
Generated OCC 990,000 15.1% ONP 290,000 4.4% Paper 1,655,000 25.4% Glass 275,000 4.2% Ferrous 470,000 7.2% Non-ferrous 300,000 4.6% HDPE 120,000 1.9% PET 15,000 0.2% Plastic 535,000 8.2% Food 740,000 11.4% Yard 105,000 1.6% Wood 505,000 7.8% Other 520,000 8.0% Total 6,530,00012 100.0%
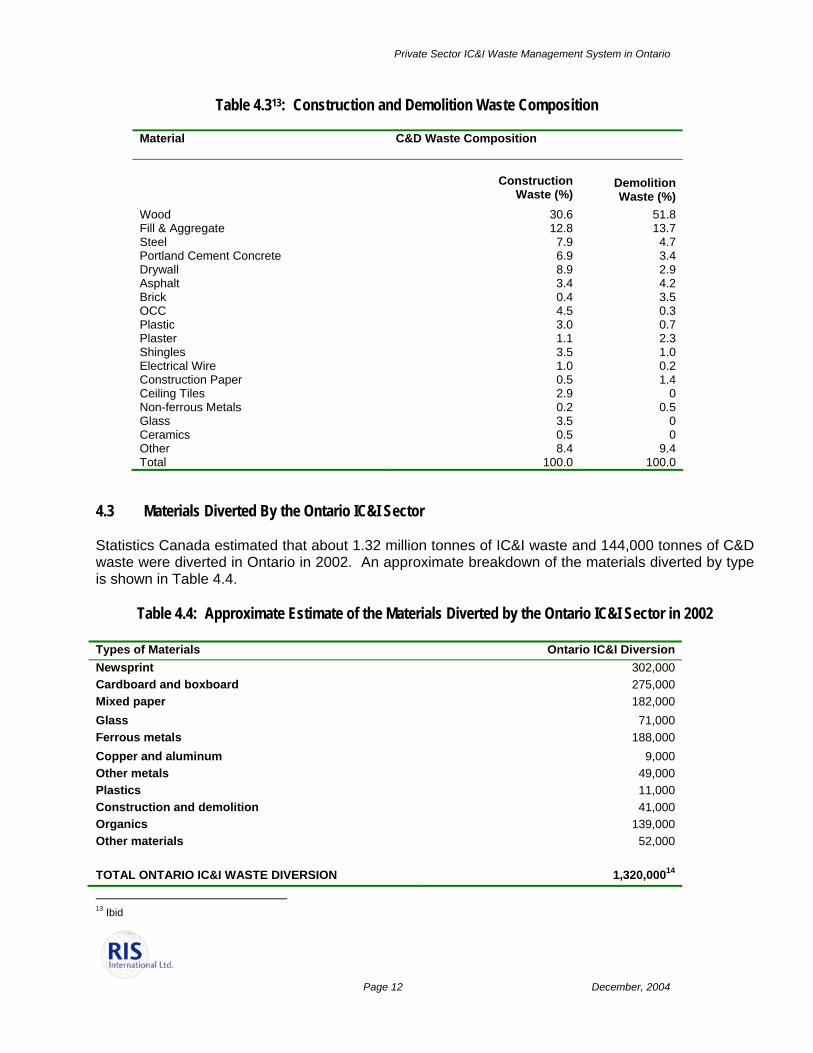
4.2 Composition of Construction and Demolition Waste Table 4.1 excludes 1,159,000 tonnes of C&D waste generated in Ontario. C&D Waste (construction and demolition waste) refers to waste from both construction and demolition activities. The composition of construction waste is quite different to demolition waste. Demolition waste composition will vary depending on the type and age of buildings, structures and/or roadways being demolished. Construction waste composition varies depending on whether residential, commercial or industrial buildings are being constructed. The composition of the two separate construction and demolition waste streams is shown in Table 4.3. Because the split between construction and demolition waste amounts is not known for Ontario in 2002, the composition of the combined C&D waste stream can not be estimated.
12 May not add because of rounding error
Page 11 December, 2004
Private Sector IC&I Waste Management System in Ontario
Table 4.313: Construction and Demolition Waste Composition
Material
C&D Waste Composition
Construction
Waste (%) Demolition Waste (%)
Wood 30.6 51.8 Fill & Aggregate 12.8 13.7 Steel 7.9 4.7 Portland Cement Concrete 6.9 3.4 Drywall 8.9 2.9 Asphalt 3.4 4.2 Brick 0.4 3.5 OCC 4.5 0.3 Plastic 3.0 0.7 Plaster 1.1 2.3 Shingles 3.5 1.0 Electrical Wire 1.0 0.2 Construction Paper 0.5 1.4 Ceiling Tiles 2.9 0 Non-ferrous Metals 0.2 0.5 Glass 3.5 0 Ceramics 0.5 0 Other 8.4 9.4 Total 100.0 100.0
4.3 Materials Diverted By the Ontario IC&I Sector Statistics Canada estimated that about 1.32 million tonnes of IC&I waste and 144,000 tonnes of C&D waste were diverted in Ontario in 2002. An approximate breakdown of the materials diverted by type is shown in Table 4.4.
Table 4.4: Approximate Estimate of the Materials Diverted by the Ontario IC&I Sector in 2002 Types of Materials Ontario IC&I Diversion Newsprint 302,000 Cardboard and boxboard 275,000 Mixed paper 182,000 Glass 71,000 Ferrous metals 188,000 Copper and aluminum 9,000 Other metals 49,000 Plastics 11,000 Construction and demolition 41,000 Organics 139,000 Other materials 52,000 TOTAL ONTARIO IC&I WASTE DIVERSION 1,320,00014
13 Ibid
Page 12 December, 2004

Private Sector IC&I Waste Management System in Ontario
4.4 Waste Composition For Selected IC&I Generator Categories The composition of the waste stream produced by different IC&I generator categories varies significantly depending on the type of business involved. Food waste is only generated within a few industry categories such as restaurants and food processors. Office buildings produce large amounts of paper, but very little food, etc. Retail stores produce large amounts of cardboard (OCC). The different amounts and types of waste produced by different businesses need to be understood to assess the viability of source separation of materials at different waste generator sites. Where specific waste materials are easily source separated at the site, and have value of collected as a separate, clean waste stream, it can save the generator money through lower service fees, and it can generate income for the waste management service provider through sale of recyclables or lower processing fees for different waste materials (such as food, etc.). Opportunities to source separate materials will vary by site; the economics of source separation compared to collecting the waste as a mixed stream can only be assessed when the composition of the waste generated is identified. Waste management service providers generally carry out an assessment of the waste stream as part of setting up a contract with a new customer. Where large amounts of a specific material are generated at a site, source separation and separate collection is often justified.
Table 4.5: Waste Composition for Retail, Schools, Hotels and Offices
Material Category Retail
(%) Hotels
(%) Offices
(%) Schools
(%) Paper OCC 28.5 12.4 11.0 7.7
ONP 3.9 4.1 10.4 4.6 Boxboard 5.3 3.9 4.7 2.6 Office Paper 7.1 9.8 12.0 12.7 Other (non-recyclable) 9.0 11.2 25.1 16.6
Plastic PET 0.1 0.3 0.4 0.2 HDPE 0.4 0.5 0.3 0.4 PS 1.3 1.2 0.9 1.7 Other 6.5 6.0 5.9 8.2
Glass Glass 3.4 11.5 2.6 4.7
Metal Metal 4.7 3.0 3.0 3.7
Organic Landscaping 1.5 0.2 0.6 0.7 Wood 3.4 1.3 2.8 1.5 Food Waste 13.3 19.0 7.2 n/a
Remainder 16.6 24.5 13.1 33.9
Typical waste composition for different categories of IC&I waste generating establishments are shown in Table 4.5 and Table 4.6. 14 Preliminary Statistics Canada 2002 Data
Page 13 December, 2004

Private Sector IC&I Waste Management System in Ontario
Table 4.6: Waste Composition for Food Service and Food Related Generators
Material Category
Food Stores Restaurant Cafeteria Fast Food
Paper OCC 28.4 10.8 18.6 17.1 ONP 3.2 1.1 0.0 0.7 Boxboard 10.7 1.8 1.8 5.8 Office Paper 16.8 1.3 0.1 2.8
Other (non-recyclable) 10.8 9.7 6.6 17.6
Plastic PET 0.1 0.1 0.1 0.0 HDPE 0.0 0.6 2.8 0.7 PS 0.7 0.5 2.9 1.9 Other 5.5 6.4 2.5 7.3
Glass Glass 5.5 13.2 3.3 3.6 Metal Ferrous Metal 1.5 1.7 2.7 2.9
Non-Ferrous Metal 0.4 0.3 0.3 0.1 Organic Yard Waste 0.0 3.4 0.0 1.6
Food Waste 15.7 54.8 54.8 42.9 Wood 0.7 0.6 0.0 0.0
Page 14 December, 2004

Private Sector IC&I Waste Management System in Ontario
5. Transfer of IC&I Waste In Ontario The IC&I waste management system in Ontario is made up of a complex array of different industries and systems, with many linkages between them. The infrastructure includes:
Waste generators Private sector waste collectors Private sector waste processors Private sector waste transfer stations Private sector landfills Brokers and end markets for recycled materials Municipalities who collect IC&I waste Municipalities who process IC&I waste, and Municipalities who own and operate landfills, transfer stations and EFW facilities
where IC&I waste is processed or disposed The collection of IC&I waste is described in Appendix A. This section describes transfer operations. 5.1 Transfer Stations Inventory An inventory of transfer stations in Ontario was developed for this study by reviewing information on the EBR (Environmental Bill of Rights) website. The inventory was distributed to OWMA membership to identify additional facilities not captured through the initial search. The inventory development process identified 112 transfer stations located throughout the Province. Most of the transfer stations (101) are owned and operated by private sector companies. Eleven identified transfer stations are publicly owned by Ontario municipalities. Seven of these, in City of Toronto, are operated by the public sector. Three municipal transfer stations in Hamilton are owned by City of Hamilton and are operated under contract to the city by the private sector; these transfer stations handle mostly residential waste and small amounts of business waste dropeed off at the site or picked up by the City. Table 5.1 shows the geographic distribution of public sector and private sector transfer stations in Ontario.
Page 15 December, 2004

Private Sector IC&I Waste Management System in Ontario
Table 5.1 Transfer Stations in Ontario By Region
Region Private Sector
Transfer Stations Public Sector Transfer Stations
Total Transfer Stations
North of French River 3 0 3 North of GTA, S French River 5 0 5 Toronto 22 7 29 Hamilton/Niagara 10 3 13 Durham 7 0 7 York 13 0 13 Peel/Halton 14 0 14 East 11 0 11 West 16 1 17 Total 101 11 112
At least 60% (total 63)of all the transfer stations in the Province are located in the GTA (Greater Toronto Area). There are at least 29 transfer stations in City of Toronto alone, with an additional 34 in the surrounding GTA (York, Durham, Peel and Halton) regions. The capacity of the transfer stations identified in the inventory is distributed as follows:
10 of the 112 transfer stations can receive more than 1,000 tonnes per day; 8 of the 112 transfer stations can receive 500 to 1,000 tonnes per day; 3 of the 112 transfer stations are approved to receive 300 to 500 tonnes per day and the remaining 91 transfer stations are permitted to receive 299t/day or less.
5.2 Transfer Stations Operations Waste is deposited at transfer stations by front-end loader collection trucks (with a capacity of about 10 tonnes) or roll-off/compactor/lugger trucks. The waste is consolidated and compacted for loading into larger transport trailers. Ideally these transfer trailers need to be as close to 35 tonnes as possible under transportation regulations. Transport trailers haul the waste to landfills in Ontario and the US, and to EFW incinerators in both Ontario and the US. There is only one incinerator in Ontario (Algonquin Power in Peel), which accepts some IC&I waste. Some IC&I waste is also transported to an incinerator in New York State. Transfer station designs vary. Some are outdoors facilities; others are large buildings where operations are fully enclosed; others have some outside storage. Some have bins for source separation of C&D waste, yard waste, metals, and other recyclables.
Page 16 December, 2004

Private Sector IC&I Waste Management System in Ontario
Transfer stations have become an increasingly important part of the waste management system in Ontario with the increased long distance hauling of waste to the US. Issues related to long distance hauling are discussed in Appendix B. 5.3 Approval Requirements for Transfer Stations Conditions on a Certificate of Approval for a transfer station vary, and can include:
Types of wastes received (residential, IC&I, C&D); most private sector transfer stations can receive only IC&I waste;
Organic waste is prohibited in some transfer stations, in fact no IC&I food waste is allowed in many transfer stations. The wording on the Certificate of Approval states “incidental food waste only”. This presents a challenge for truck routing, and many collectors can not pick up loads with high organics content;
“No odours” and “no putrescibles” are often stated as conditions in Certificates of Approval
The amount of waste in and waste out per day varies The “service area” from which waste can be received varies The amount of waste which can be stored on site (one station may only be allowed to
store 100t, whereas another could be allowed to store 2,000t, often without any obvious reason for the differences, which are significant in some cases).
The permit conditions under which transfer stations operate in the Province of Ontario vary widely, and depend to some extent on when the Certificate of Approval for the transfer station was issued. In the past, local MOE regional offices had significant input and control over the issuance of Certificates of Approval for transfer stations. This practice has changed in recent years and all certificates are now issued centrally by MOE. An internal MOE policy document (dated November, 1999) has stated that there is no need for an Environmental Assessment (EA) for a processing facility which ships 199t/day or less, or for a transfer station which ships 299t/day or less. Most transfer stations have limited themselves to this size to avoid the time and expense of an EA. Ontario is actually the only province which regulates transfer stations at the provincial level; other provinces treat transfer stations as industrial facilities, and approvals are handled by the local municipality. Alberta and BC do not require provincial permits for transfer stations and so have no tonnage restrictions. Where a “waste-in-waste-out” restriction applies, some transfer stations often must close early in the day as they have reached their 299t/d “in-out” limit, even when the transfer station is virtually empty (all the waste has been transferred to landfill) and could easily be handling additional waste. This issue is particularly critical to the efficient operation of the Ontario IC&I waste management infrastructure, when border slowdowns cause back-ups in the system. There is sometimes a restriction on food waste at transfer stations, which limit the generators from which a truck can collect, as the truck contents can not be contaminated with food from one generator. Many transfer stations have a “no organics” requirement on their Certificate of
Page 17 December, 2004

Private Sector IC&I Waste Management System in Ontario
Approval, or an “incidental food waste only” restriction. The latter restriction has never been clearly defined. Approved storage limits vary from zero for some transfer stations to 12,000 tonnes for others. Most transfer stations are allowed to store 1,000 tonnes or less. The materials accepted also range, and can include non-hazardous solid waste, IC&I, C&D or other specific materials. The purpose of limiting waste storage is to ensure that waste is not allowed to accumulate at a facility and then the facility is abandoned by the owner with a large quantity of waste abandoned on the site. This is viewed by the waste services industry as the only meaningful use of tonnage control restrictions on a transfer/processing facility. Privately owned waste facilities must post financial assurance with the Ministry of Environment in the event that a facility is abandoned by the owner/operator. The financial assurance should be sufficient to remove any abandoned waste. Unlike a storage limit, a limit on “in-out” is not relevant to environmental protection, but is usually the primary subject of emergency Certificates of Approval when the waste management system backs up because of situations such as slowdowns at the US border or municipal waste worker strikes. A transfer station has a natural limit in what it can handle per day because of physical limits on space and equipment, which can be controlled by a storage limit. The “in-out” limit may have originated as a traffic issue; however, no other business (e.g. Walmart) is restricted by a provincial permit with respect to the amount of traffic which travels to or from its site, or how much material can be brought to or from its site. Some transfer stations are not permitted to carry out materials recovery operations and therefore cannot provide diversion services. They can not remove recyclable materials from the waste stream at the site, and valuable materials are therefore disposed rather than diverted. More flexibility in permitting is needed to maximize the amount of material which can be diverted at transfer stations, and allow waste management companies to respond to the market. Waste generation is very seasonal, therefore fixed year round daily limits at transfer stations do not make sense in a business which is busier in the summer than in the winter.
Page 18 December, 2004

Private Sector IC&I Waste Management System in Ontario
6. Processing 6.1 Processing at Transfer Stations Transfer stations in the Province are permitted as either “transfer” or “process/transfer” material, with the benefit of the latter being the operating flexibility to recover recyclable materials from the wastes delivered. Recyclable materials that are pulled from loads tipped on the transfer station floor, depending on the market for the material, the value of the material, and the time and space available at the transfer station site. Factors which impact on whether recyclable material is recovered at transfer stations include:
Economic viability; Time and space available; Safe working conditions to carry out the manual sort.
When waste is delivered to a transfer station, depending on the operation, it is tipped on the floor of the station. The measure of an efficient transfer operation is the speed at which the waste can be safely loaded into transfer trailers for off-site shipment. With this in mind, many operators look for economically viable opportunities for material recovery at processing/transfer stations. Waste is visually inspected to assess if it contains material worth recovering. If there is a large amount of valuable material such as aluminum, other metal or cardboard in the load, this material is removed for recycling. Alternatively, the customer who discarded the recyclable material may be identifiable and an alternative recycling service may be offered if the waste stream is not from a one-time event. The recyclable materials may be recovered manually by transfer station staff. A “positive sort” may be carried out for pre-determined materials e.g. OCC or metal. Staff pick the materials from the waste pile on the floor by visual inspection. In some cases mobile equipment such as a bobcat, a front end loader, clam buckets or a backhoe are used to assist with the material removal and storage effort. Because of the nature of a transfer station operation, this system generally diverts no more than 1% to 2% of the incoming tonnage. One of the barriers to higher diversion at transfer stations is that many or most loads containing recyclable materials are contaminated with a variety of materials, and are too contaminated for recycling Transfer stations typically have either bunkers or dedicated roll-off bins for metals, cardboard, wood and other recyclable materials storage. The recovered materials are placed in storage until a sufficient quantity has been accumulated for shipment loose to a MRF or end user. The key function of a transfer station is to safely and efficiently consolidate waste from small loads to large trailers for off-site shipment. With this operating priority, it generally means that recovery of recyclables only occurs at off-peak times.
Page 19 December, 2004
Private Sector IC&I Waste Management System in Ontario
Where transfer station operators identify large loads of paper from a particular generator, it is more cost effective to provide source separation bins and a separate collection service to recycle the paper. The hauler generally contacts the generator to suggest this change in service to diversion rather than disposal. The generator is charged for the extra service pick-up at a cost that reflects the value of the recyclables and the avoided disposal cost. 6.2 Recovery of Materials at Landfills A similar approach to that described above is carried out at some landfills, where some materials can be recovered from mixed loads of waste delivered to the site. Again, safety of workers is of the utmost importance, so the work must be carried out in a controlled manner as opposed to scavenging, which is not permitted by regulation. Any materials that can be recovered at the landfill translate into saved airspace, which is a valuable commodity. 6.3 MRFs For Recyclables The term MRF (material recovery facility) generally refers to a mechanized operation which uses conveyor belts, sorting lines and equipment such as magnetic separators and various types of screens to separate particular materials from a source separated recycling stream. MRFs clean and sort recyclable materials to meet market specifications. The level of processing is determined by the incremental revenue received for different grades of recyclables in the market. MRFs can be labour or equipment intensive; some have simple sorting lines with a large number of “manual pickers”; others rely on mechanical equipment to separate different materials. MRFs are broadly defined as co-mingled or fibre MRFs. Commingled MRFs process mostly municipal Blue Box materials; fibre MRFs process paper materials. Container processing is not a significant component of the IC&I business. Some MRFs have two lines; one for commingled material (containers), the other for fibres. These MRFs typically secure at least one municipal contract, and also process IC&I materials. IC&I material is generally fibres rather than containers. Most of the information obtained on MRFs in Ontario and presented in the study database refers to municipally owned MRFs or MRFs built to process materials collected by or for municipalities (mostly residential with a small about of business waste). Many municipally owned MRFs accept loads of IC&I material for a tipping fee. Municipal MRFs which process Blue Box recyclables also processed over 100,000 tonnes of IC&I recyclables in 2002.
Page 20 December, 2004

Private Sector IC&I Waste Management System in Ontario
Table 6.1: Material Recovery Facilities in Ontario
Geographical Area Private Sector Owned MRFs
Public Sector Owned MRFs
Total MRFs
North of French River 9 4 13 North of GTA, S French River 4 0 4 GTA, Hamilton, and Niagara 12 5 17 East 13 4 17 West 17 7 24 Total 55 20 75
Fibre MRFs are specialized, mechanized facilities which sort papers into different grades for sale to paper mills and paper brokers. The paper is baled at the MRF. The paper is source separated by the generator e.g. office tower and collected in dedicated containers and/or collection routes. A number of companies (e.g Wasteco, Consolidated Fibres) specialize in collecting paper from large generators and processing the paper in their own MRFs for sale to end markets. The daily permitted tonnage was not available for most of the MRFs in the database. The Certificate of Approval sometimes stipulates the maximum residue from a MRF. This value varies widely from 12t/d to 700t/d, with a typical value of 150t/d to 300t/d. 6.4 Glass Processing In the past, recycled glass in Ontario was purchased by Consumers Glass for use in container manufacturing. Product specifications were rigorous; glass was colour sorted into green, clear glass and amber glass. Broken glass was not accepted. Differential revenues from $38 to $43/tonne were paid for colour sorted glass through the 1990’s. The $43/tonne value was for flint (clear) glass, and $38/tonne for green glass. Glass loads containing any ceramic materials were rejected. Collected container glass from commercial sources was colour sorted at MRFs to meet these market specifications. This glass was predominantly green, from restaurants and food service locations. The container glass market collapsed in Ontario in 2000 when the Molsons Barrie plant closed, eliminating the demand for green glass. Most glass now is directed to the fiberglass and other markets, which pay lower amounts. Since the collapse of the container glass market, most Ontario glass is processed at three facilities: Nexcycle in Aberfoyle, Rancor in Bellville and a plant in Sarnia. Glass is ground to meet specifications for the container and fiberglass market. A considerable amount of glass is also ground to meet Aggregate B specifications for construction applications.
Page 21 December, 2004
Private Sector IC&I Waste Management System in Ontario
The primary market for these facilities was plate glass from the auto sector in the past. However, the amount of material from this market is shrinking therefore these facilities are also servicing the municipal market. Unical (Montreal) services the eastern Ontario market now. . 6.5 C&D Waste Processing C&D (construction and demolition) sites typically produce concrete, brick, insulation, wood, metals and miscellaneous other materials. New construction produces drywall and OCC, as well as small wooden offcuts, etc. In the early 1990’s, there was a flurry of activity in C&D waste recycling, which has been at a low level for a number of years. However, C&D waste recycling is gaining in popularity in the last year or more, as the economics look more favourable. Harkow Aggregates used to run a C&D waste processing facility at Commissioner St, but it appears through research carried out for this study that the company no longer operates in the GTA. Facilities such as Constrada in Vaughan reportedly process mixed C&D waste loads. If drywall is source separated, it can be processed by New West Gypsum in Oakville. The backing is torn off the drywall and the internal material is crushed for use in manufacturing of new drywall. Therefore companies can actually send their offcuts to a company which guarantees that the recovered material can be purchased in new drywall for their own construction projects. Mechanized C&D waste processing plants generally crush concrete for use as an aggregate substitute. Depending on the economics, this equipment is sometimes brought on-site, rather than hauling the material to a processor. About 200,000 tonnes of concrete from the demolition of Terminal 1 in Toronto Pearson airport is being crushed on-site for reuse in new road construction. The demolition of Terminal 1 is reportedly achieving a 95% diversion rate. 6.6 Wood Processing Wood waste is generally processed to meet size requirements for use as a fuel. Mobile grinders are frequently brought to landfill sites to grind stockpiled wood for a range of markets including:
Landscaping; Compost amendment; Hog fuel and Animal bedding.
Some operations also have a stationary wood grinder. Some haulers report that wood is difficult to handle and is mainly sent to an incinerator in Buffalo, or to the Ajax steam plant. Separating clean wood from contaminated wood (paint, creosote, preservative, glues, laminates, nails etc.) can be difficult and labour intensive.
Page 22 December, 2004

Private Sector IC&I Waste Management System in Ontario
Hardwood can be sold to particleboard markets, but significant quantities like skids are needed to make this business viable. 6.7 Food Waste Processing Food waste is handled as two categories:
food processing plant waste and post-consumer food waste (restaurants etc.).
There is a well established business in Ontario where large quantities of food wastes from the food processing industry are re-processed into animal feed. Similarly, the rendering business has a well established system to collect and re-process greases and fats from restaurants. Food processing wastes are also composted at sites throughout the Province. A number of haulers provide source separated organic waste collection services to restaurants, coffee shops, cafeterias, etc which produce large amounts of food preparation and post consumer waste (plate scrapings, etc). Haulers supply bins for source separation, bring them back to their transfer/processing stations, bulk up the organic material and send a 40 cu yd container to composting sites or farms. Haulers interviewed for this study expressed a concern that there is an “extreme shortage” of facilities that can receive and process food wastes in Ontario. Because organic wastes are very odorous, locating a facility to process and/or transfer the material can be very difficult. To put this in context, most solid waste transfer/processing facilities are allowed to accept only de-minimis amounts of food waste, some are not even allowed to accept waste from trucks that have serviced a restaurant in case the waste contains food scraps. Odour is often the main source of public complaints at waste management facilities and the odour is usually as a result of food waste. 6.8 Composting and Anaerobic Digestion Operations Most aerobic composting operations in Ontario are open windrow sites, although there are a few in-vessel and enclosed facilities (Green Lane in London; Guelph; Ottawa Valley; Herhof at Caledon Landfill in Region of Peel, Wright in Meaford and Ontario Science Centre). There were three anaerobic digestion facilities in the Province (Toronto Dufferin plant, CCI Newmarket and SUBBOR Guelph). The SUBBOR Guelph facility is closed; the Newmarket plant has been purchased by Halton Recycling Limited and is being refurbished. The facility has a Certificate of Approval to accept 150,000t/y of biodegradable material, and is therefore the second largest facility in the province. All Treat Farms in Arthur is undergoing an expansion to increase its aerobic composting capacity to 170,000 tonnes per year. The Toronto Dufferin plant has a design capacity of about 25,000 tonnes per year, and receives source separated organics from the City commercial collection of green bins and also source separated organics from the curbside residential programs in Etobicoke and Scarborough. The facility is operating
Page 23 December, 2004

Private Sector IC&I Waste Management System in Ontario
at capacity and the City sends other collected source separated material to Guelph and Quebec because of a lack of capacity in Ontario. Toronto, York and Durham recently issued a joint tender for almost 300,000 tonnes/year of composting or biodegradable waste processing capacity to meet their joint needs. Composting sites identified through this study are summarized in Table 6.2 by geographical area. The design capacity is not available for all facilities, but for those where it was identified, the combined capacity is over 900,000 tonnes per year. This capacity is concentrated in a few facilities such as All Treat Farms, Grow Rich, IMS (Integrated Municipal Services, a Walker Industries Holdings Ltd company),,Sweda Farms and HRL (Newmarket).
Table 6.2: Composting And Anaerobic Digestion Facilities in Ontario
Area Municipalities Private Sector
Composting Sites
Public Sector
Composting Sites
AD Total Capacity over
20,000t/y
South- West
Essex, Lambton,Elgin, Middlesex, Huron,
Bruce,Oxford, Perth, Chatham-Kent 7 4
11
0
West-Central
Haldimand-Norfolk, Hamilton, Niagara, Waterloo,
Wellington, Brant and Grey 4 15
closed 19
6
South-Central
Peel, Halton, York, Durham,Simcoe, Bruce,
Toronto 6 9
2 17
6
East-Central
Northumberland, Peterborough, Victoria Lakes
3 None identified
3
0
South-East
Ottawa, Hastings, Pr. Ed. Cty Lennox & Addington,
Frontenac, Renfrew, Lanark, Leeds & Grenville, Stormont,
Dundas & Glengarry, Prescott and Russell
11 5
16
3 North-
Central Sudbury, Algoma, Nipissing,
Parry Sound,Muskoka 6 2
8
0
TOTAL 37 35
2 74
15 Only 15 of the 74 composting operations had a capacity of greater than 20,000 tonnes per year. Many of the municipal sites are open windrow facilities predominantly used to compost source separated leaf and yard waste. Some private landfill sites have open windrow facilities as part of an integrated operation and often process leaf and yard waste collected as part of residential waste service. 6.9 Metals
Page 24 December, 2004

Private Sector IC&I Waste Management System in Ontario
Metals have value and if generated in any significant quantity, at a quality acceptable to end markets, they are generally kept out of the mixed waste stream. The scrap metal business is well established and operates outside Ontario’s waste management system. Scrap yards provide bins to significant metals generators and pay them for the material recovered. Waste haulers ship bins of metals collected at transfer stations to facilities such as Triple M or Barrie Metals and get paid for the value of the material. 6.10 Mixed Waste Processing There are no mixed waste processing facilities for IC&I waste in Ontario at this time. Past efforts to process IC&I materials in mixed waste facilities have proven unsuccessful. The industry has concluded that material must be source separated to generate value, allow diversion to increase.
Page 25 December, 2004

Private Sector IC&I Waste Management System in Ontario
7. Disposal of IC&I Waste IC&I waste in Ontario is typically disposed in either:
Privately owned and operated landfills which manage IC&I waste from a large geographic area (usually entire province), and in some cases manage municipal waste from the local area or host community. Less than 3.4 million tonnes/year of IC&I waste is currently disposed in private sector landfills in Ontario.
Municipally owned and operated landfills which manage residential waste and waste
from other municipal operations, generally from the local area (typically the boundary of the local municipality or region) and also accept private sector waste produced by businesses in the local area. Up to 800,000 tonnes of IC&I waste is disposed in municipal landfills.
Export: About 2 million tonnes of Ontario IC&I waste is exported to the US for disposal.
About 200,000 tonnes is sent to New York State and the remainder to landfills in Michigan.
Incineration With Energy Recovery: A small amount of IC&I waste (12,000 tonnes
from Pearson Airport) is incinerated at the Algonquin Power EFW facility in Brampton. All landfills in Ontario require a Certificate of Approval which stipulates conditions such as:
Waste Type Restrictions: In Ontario, not all landfills can accept all types of non-hazardous solid waste. Some landfills are permitted to accept IC&I or C&D waste, but not residential waste.
Service Area Restrictions: The area from which a landfill can accept waste is often
limited. This is particularly true for residential waste; landfills can frequently only accept residential waste and other waste from municipal operations which are generated within the local service area. Some newer Certificates of Approval for private sites include “Province wide” service areas for municipal as well as for IC&I waste.
Limitation on Amount of Waste Received Per Day: Each landfill has a daily limit on
the amount of waste it can receive. Daily limit restrictions are sometimes lifted during emergency periods such as border shut-downs. Even though a landfill may be allowed a significant amount of waste per year, the daily fill rate restriction can often limit how the landfill is operated. Emergency Certificates of Approval may lift the daily rate limit restriction but rarely adjust the annual limit to reflect the amount managed during the short term emergency.
Annual Disposal Limit: Each landfill has an annual limit on the tonnage it can receive.
Even though a landfill may be allowed a significant amount of waste per year, the daily restriction imposes limits on how the landfill is operated.
Page 26 December, 2004

Private Sector IC&I Waste Management System in Ontario
7.1 Number of Landfills in Ontario A landfill inventory was developed as part of this study. A landfill inventory developed by RIS in 1999 was used as a base, and was updated and augmented with additional, updated information from a number of sources. Table 7.1 summarizes the updated inventory by regional area in Ontario.
Table 7.1: Ontario Landfill Inventory By Region, 2004 Geographical Area Private
Sector Public Sector
Total Landfills
North of French River 1 18 19 North of GTA 0 4 4 GTA, Hamilton, and Niagara 2 8 10 East 6 20 26 West 7 15 22 Total 16 65 81 The inventory developed for this study identified 81 landfills in Ontario; this is substantially lower than the 730 landfills in operation in 1989. Many of the 81 landfills are smaller municipal landfills located in Northern Ontario. Difficulties with the Environmental Assessment process, particularly for private sector proponents has resulted in only a handful of landfills being approved in the last 10 to 15 years. Ontario is currently in a position where the landfill capacity in place and proposed for approval is not sufficient for the waste requiring disposal. This situation will persist into the future until current annual disposal capacity meets disposal requirements on a 20-year rolling average basis. 7.2 Estimate of Landfill Capacity in Ontario in 2003 A number of studies have recently looked at available landfill capacity in Ontario:
Warwick Landfill Expansion Environmental Assessment Terms of Reference – Discussion on Issue of Need – Report to Joseph Castrilli by Enviros RIS (April, 1999);
Walker Waste Disposal Environmental Assessment Supporting Document #1: Rationale for Proceeding With the Proposed Undertaking; Gartner Lee Limited August, 2003; and
Summary Report: Availability of Landfill Space in Ontario: Report for Region of York by Earthtech Canada Inc, January, 2004
The total approved usable disposal capacity currently in Ontario was estimated at 117 million tonnes in 1999, when the Adams Mine landfill was still a possibility in Ontario. That possibility has been eliminated with the passage of the Adams Mine Act in 2004.
Page 27 December, 2004

Private Sector IC&I Waste Management System in Ontario
The capacity was estimated at 108 million tonnes15 in the Walker EA background material. The inventory developed for OWMA identified 79.5 million tonnes of available approved capacity as of 1st January, 2005. However, as discussed above, this disposal capacity has a number of geographic and annual fill rate restrictions, so that the total number is misleading. The distribution of remaining landfill capacity is shown in Table 7.2
Table 7.2: Landfill Capacity in Ontario By Region
Geographical Area Private Sector (million tonnes)
Public Sector (million tonnes)
Total (million tonnes)
North of French River Not known 8.58 8.58 North of GTA 0 2.30 2.3 GTA, Hamilton, and Niagara 9.07 6.55 15.62 East 7.75 6.24 13.99 West 20.40 18.57 38.97 Total 37.22 42.24 79.46
The current disposal capacity for IC&I waste in Ontario is provided by 11 private sector landfills, and the Algonquin Power EFW plant in Region of Peel, which is the only incinerator in the province which can accept IC&I waste. Municipal landfills such as Essex Windsor, Brantford, London, Waterloo, Hamilton-Glanbrook and Ottawa Trail Road accept some IC&I waste. Toronto transfer stations accept about 300,000 tonnes/year of IC&I waste and haul this material to Michigan as part of its disposal contract with Republic. 7.3 Permitted Fill Rates for Ontario Landfills Identified annual fill rates for private sector and public sector landfills are shown by region in Table 7.3. The values in the table are underestimates as data could not be identified for a number of sites.
15 Walker Landfill Expansion Environmental Assessment Supporting Document #1: Rationale for Proceeding With the Proposed Undertaking;; Gartner Lee Limited; August, 2003, page 5
Page 28 December, 2004

Private Sector IC&I Waste Management System in Ontario
Table 7.3: Annual Permitted Fill Rates for Ontario Landfills By Region
Geographical Area
Private Sector
Public Sector
Total Annual Capacity
North of French River Not identified 404,500 404,500 plus North of GTA No landfills 80,000 plus 80,000 plus GTA, Hamilton, and Niagara 1,380,000 252,000 plus 1,632,000 plus East 840,000 plus 431,800 plus 1,271,800 plus West 1,200,000 600,000 plus 1,800,000 plus Total 3,420,000 1,768,300 5,188,300
7.4 Private Sector Landfill Capacity in Ontario Figure 7.1 shows that without any landfill expansions, current IC&I waste disposal capacity in Ontario is slightly over 3 million tonnes per year, dropping to 2.4 million tonnes per year around 2009, when Petrolia, WSI Navan and Walker close, if no new Certificates of Approval for landfill expansions are granted. This estimate assumes that 680,000t/y are disposed at the Ridge landfill. This landfill is taking less than this amount at the moment, as a result of the on-going ownership issue. This estimate also assumes that the LaFleche landfill at Moose Creek disposes of 200,000t/year, which is its highest permitted annual fill rate amount. This figure also assumes that the Taro landfill in Hamilton continues to accept about 500,000 tonnes/year (its current fill rate) rather than its maximum permitted fill rate of 750,000 tonnes/year. The Certificate of Approval for the Taro landfill limits its service area to City of Hamilton, and sufficient wastes are not generated to fill to the maximum approved rate; hence some of the available capacity is not used.
Page 29 December, 2004

Private Sector IC&I Waste Management System in Ontario
Figure 7.1: IC&I Waste Disposal Capacity in Larg Private Sector Ontario Landfills e
No Expansions
5,000,000
4,000,000West Ca tonrleWarwick
tonn
es/y
ear p
erm
itted
fill
rate
Walker NiagaraTaroRidge 3,000,000
RichmondPetrolia LaflecheWSI Navan2,000,000Green LaneBlenheim
1,000,000
0 2004 2006 2008 2010 2012 2014 2016 2018 2020 2022 2024
Year
Page 30 December, 2004

Private Sector IC&I Waste Management System in Ontario
Figure 7.2 presents the same data as a stacked bar chart, showing the amount accepted annually at each landfill, and how that amount decreases and eventually ceases.
Figure 7.2: Annual Capacity For Disposal of IC&I Waste In Private Sector Landfills in Ontario
3,500,000
3,000,000
2,500,000 West Carleton
2 tonn
es/y
ear p
e
,000,000
Warwick
rmitt
ed fi
ll ra
te
Walker Niagara
tonn
es/y
ear p
erm
itted
fill
rate
TaroRidgeRichmondPetrolia
1,500,000 LaflecheWSI NavanGreen LaneBlenheim1,000,000
500,000
02004 2005 2006 2007 2008 2009 2010 2011 2012 2013 2014 2015 2016 2017 2018 2019 2020
Year
The amount of landfill capacity available in Ontario at this time is critically less than the 6.2 million tonnes per year of disposal capacity currently required for IC&I and C&D waste generated by Ontario sources. Expansions at four large landfills in Ontario (Warwick, Richmond, Walker and Green Lane) are at various stages in the approvals process. The status of these expansions is uncertain because of the Richmond Sutcliffe decision regarding the current Environmental Assessment process in Ontario. The Walker expansion is just beginning while those at the some of the other sites have been more that five years in the process already. Table 7.4 shows the capacity being requested in these expansion EAs. If ALL these applications were approved and implemented as requested, these sites would add approximately 1.6 million tonnes per year of additional annual capacity. This is still not sufficient to meet Ontario’s disposal requirements of 6.2 million tonnes/year16 of IC&I waste, and is actually short by 2.2 million tonnes/year if current circumstances continue.
Table 7.4: Major Ontario Private Landfill Expansions in the Planning Stages in 2004 16 Assumes that increases in waste generation which would be expected over time will be offset by increasing process efficiency, reduction and reuse.
Page 31 December, 2004

Private Sector IC&I Waste Management System in Ontario
Landfill
Requested Annual Capacity (t)
Requested Site Expanded Capacity (t)
Green Lane, Elgin County 265,000 6,700,000 Richmond, Napanee – Waste Mgt Corp of Canada 750,000 18,500,000 Walker, Niagara Waste Systems 750,00017 17,700,000 Warwick, Lambton County Waste Mgt Corp of Canada 750,000 18,500,000
Additional Capacity Provided 1.5 million tonnes/year above existing 61,400,000
Figure 7.3: Annual Maximum Permitted Fill Rate For IC&I Waste at Private Sector Landfills in Ontario With All Current Expansion Applications Included
5000000
4500000
4000000
3500000 West Carleton WMCC
tonn
es/y
ear p
erm
itted
fill
rate
Warwick WMCCWalker Niagara
3000000TaroRidge
2500000 Richmond WMCCPetrolia WMCCLafleche
2000000WSI NavanGreen LaneBlenheim WMCC1500000
1000000
500000
02004 2006 2008 2010 2012 2014 2016 2018 2022 2024 2026 20282020
Figure 7.3 shows that if all landfill expansions currently on the books are approved and operating by 2008, annual capacity for IC&I waste disposal remains at around 3 million tonnes until 2008. For one year, capacity increases to about 4.4 million tonnes per year, but decreases when WSI Navan and the Waste Management Corporation of Canada Ottawa landfills close in 2009. The capacity remains at 4 million tonnes per year until Taro closes in 2016. This analysis assumes that Taro receives about 500,000 tonnes/year, rather than its currently permitted rate of 750,000 tonnes per year. 17 Plus 100,000 tonnes/year of emergency capacity for Region of Niagara
Page 32 December, 2004

Private Sector IC&I Waste Management System in Ontario
There are practical timing limitations on how quickly a landfill can be constructed. Construction of landfill liners requires a year, as construction can not take place over the winter.
Figure 7.4: IC&I Disposal Capacity at Large Ontario Private Sector Landfills
- Expansions By 2008
5,000,000
tonn
es/y
ear p
erm
itted
fill
rate
4,000,000 West Carleton WMCC Warwick WMCCWalker NiagaraTaroRidge 3,000,000
Richmond WMCCPetrolia WMCCLafleche
2,000,000 WSI NavanGreen LaneBlenheim
1,000,000
0 2004 2006 2008 2010 2012 2014 2016 2018 2020 2022 2024 2026 2028
Year
Figure 7.4 presents the data to show that a spike of capacity would occur around 2009, when new capacity comes on line. However, a number of existing sites would have reached their approved capacity at around the same time, so that the new permitted capacity would simply be replacing capacity which is closing, rather than adding to the current capacity.
Page 33 December, 2004

Private Sector IC&I Waste Management System in Ontario
Figure 7.5:Projected Landfill Capacity Deficit in Ontario
7,000,000
No Expansions
Tonn
es p
er y
ear I
C&
I Dis
posa
l D
efic
it
6,000,000
Current Expansion P roposals Are Approved5,000,000
4,000,000
3,000,000
2,000,000
1,000,000
02004 2006 2008 2010 2012 2014 2016 2018 2020 2022 2024
Year
Figure 7.5 shows the “deficit” of landfill capacity in Ontario by year, with and without landfill expansions currently under consideration. If no expansions occur, the landfill deficit (the difference between landfill requirements and available capacity) remains at around 3 million tonnes per year until 2009, when a number of landfills reach currently approved capacity and can no longer accept waste. It increases then to reach 4.5 million tonnes/year, and increases again to 5 million tonnes in 2016. If the expansions currently in process are approved, the landfill deficit remains at about 3 million tonnes/year until 2009, when the new expansions would be in operation. The deficit reaches a low of 1.8 million tonnes for one year (2009) but then remains at about 2 million tonnes for a number of years, and increases again in 2016 as more landfills reach permitted capacity, and close. The chart shows that the deficit virtually never is lower than 2 million tonnes/year, and is significantly greater, at 4.5 million tonnes per year, if no expansions proceed.
Page 34 December, 2004

Private Sector IC&I Waste Management System in Ontario
7,000,000
6,000,000Business As Us ual
llion
Figure 7.6: Annual Approved Fill Rate for IC&I Waste at Private Sector Landfills in Ontario Compared to Annual Demand for Disposal Capacity
(Expansions Included) Figure 7.6 above shows that even with the four landfill expansion proposals identified at this time, the available landfill capacity in Ontario is still significantly short of the 6.2 million tonnes of capacity currently required. Over time, the population of Ontario will increase, and waste generation will increase as a result of increased population base, and the increased industrial and commercial activity required to support this population base. For this analysis, we have assumed that over time, net waste to disposal will stay at current levels, as increased reduction, reuse and innovation will cancel out the impacts of population growth.
-
1,000,000
2,000,000
3,000,000
4,000,000
5,000,000
2004 2006 2008 2010 2012 2014 2016 2018 2020 2022 2024
West Ca eton rlWarwickWalker NiagaraTaroRidge RichmondPetrolia LaflecheWSI NavanGreen LaneBlenheimDemand (BAU)
Disposal 6.2 mi tonnes per year
tonn
es/y
ear p
erm
itted
fill
rate
Year
Page 35 December, 2004

Private Sector IC&I Waste Management System in Ontario
7,000,000
6,000,000 Disposal Demand 6.2 million t/yBusiness As Usual, Some Reduction and Reuse West Carleton
Warwick5,000,000 Walker Niagara
Tonn
es p
er y
ear I
C&
I dis
posa
l re
quire
men
t for
Ont
ario
Taro
RidgeRichmond4,000,000 Disposal Demand; Increased Petrolia Diversion Over TimeLaflecheWSI Navan
3,000,000 Green LaneBlenheimDemand (Increased Diversion)Demand (BAU)
2,000,000
1,000,000
02004 2006 2008 2010 2012 2014 2016 2018 2020 2022 2024
Year
Figure 7.7: Annual Approved Fill Rate for IC&I Waste at Private Sector Landfills in Ontario Compared to Annual Demand for Disposal Capacity – Current Conditions
Figure 7.7 shows two scenarios: disposal requirements remain at current levels of 6.2 million tonnes per year, or dramatic diversion occurs over the next ten years. In either case, Ontario landfill capacity is insufficient to meet our own needs. All of these figures illustrate a few key points:
Ontario’s industrial, commercial and institutional sectors are hugely dependent on the waste disposal capacity provided by 11 existing private sector landfill sites in Ontario which may or may not be expanded (Warwick, Petrolia, Richmond, Ridge, Green Lane, WSI Navan, Walker, Lafleche, Ottawa, Taro);
Municipal sites have limited interest in accepting IC&I waste, and in most cases (e.g. Brantford, Halton), even when capacity is available, the Certificate of Approval only allows IC&I waste from a local service area:
The current capacity in Ontario’s private sites is 2.8 million tonnes per year less than current IC&I disposal needs of 6.2 million tonnes per year. This shortfall will increase dramatically in 4 to 5 years as existing capacity is consumed.
Ontario is experiencing a full blown disposal capacity crisis which is being managed by export to the US Export is critical to meeting our disposal needs but we are very vulnerable to slow-downs and closure at the US border and/or disposal restrictions at US sites.
Page 36 December, 2004

Private Sector IC&I Waste Management System in Ontario
7.5 Background to Waste Export Southern Ontario exports solid waste to the U.S. for a number of reasons:
1) There is a lack of permitted landfill capacity in Ontario for both residential and IC&I non-hazardous solid waste;
2) GTA and other southern Ontario municipalities have not developed their own landfill capacity for long term needs; they no longer own their own landfills and contract with the private sector for municipal waste disposal;
3) The private sector needs to send non-hazardous waste to Michigan because there is not sufficient permitted disposal capacity in southern Ontario for non-hazardous waste;
4) Disposal fees in Michigan are lower than in southern Ontario for municipal and IC&I non-hazardous waste;
5) Companies who own landfills on both sides of the border use their resources in ways which make good business sense;
6) For some border municipalities, disposal in U.S. landfills makes sense because hauling distances are shorter and economics are better;
7) Many US landfill permits do not restrict receipt of wastes from outside of the state. Exports of non-hazardous solid waste from the Greater Toronto Area have increased substantially due to closures of the Keele Valley Landfill in Vaughan in December 2002 and the Britannia Landfill in Peel in July 2002. All of the non-hazardous solid waste which used to be landfilled at Keele Valley and Britannia Road (except for 50,000 tonnes per year which Region of York sends to Green Lane) is now exported to Michigan under various contracts.
Available information on export of non-hazardous solid waste (residential and IC&I) from Ontario to the United States in 2003 is summarized Table 7.5
Table 7.5: Export of Non-Hazardous Solid Waste from Canada to United States, 2003 Location Export to the U.S. (tonnes)
Ontario to Michigan State 2,854,00018
Ontario to New York State19
171,000
Ontario to Pennsylvania (for 3rd Quarter 2003)20
75
TOTAL 3,025,000 Most of the waste exported from Ontario to the US currently goes to Michigan, although some also goes to the Modern Landfill and the American Refuel incinerator in New York State. Western New York State has large amounts of available disposal capacity, but New York transportation regulations limits truck axle weights on New York State highways. Ontario non-
18 Michigan Department of Environmental Quality, Waste and Hazardous Materials Division Report of Solid Waste Landfilled in Michigan, October 1, 2002 – September 30, 2003 (Dated January, 2004) 19 Personal communication with Gerard Wagner, New York Dept. of Environmental Conservation. March 2004 20 Pennsylvania Department of Environmental Protection, Bureau of Land Recycling and Waste Management
Page 37 December, 2004

Private Sector IC&I Waste Management System in Ontario
hazardous solid waste was also disposed in Ohio and Pennsylvania in the past, but this practice ceased because of a combination of higher tipping fees and lower axle weight restrictions. Impacts of the increased waste export to Michigan are discussed in detail in Appendix B. 7.6 Waste Exported From Ontario To Michigan
The Michigan Department of Environmental Quality reports that about 25% of the waste landfilled in the state in their 2003 fiscal year (October 2002-September 2003) was imported from other US states or Canada, compared to an imported waste percentage of 20% in 2002. Waste from Canada represented the highest amount imported from a single source, at 15% of the waste landfilled in Michigan in their 2003 fiscal year 2003.21 Michigan also imported waste from Connecticut, Illinois, Indiana, Iowa, Maine, Missouri, New Hampshire, New Jersey, New York, Ohio, Pennsylvania and Wisconsin in the same period. Total imports of waste into Michigan landfills increased about 35 percent between their 2002 and 2003 fiscal years. Imports of non-hazardous solid waste to Michigan from Ontario increased by 800,000 tonnes or 43% from the previous year. Most of this increase was probably related to the closure of the Keele Valley landfill and the shipment of all Toronto municipally managed waste (residential, some small business and waste from other municipal activities and from IC&I generators which use Toronto transfer stations) to Michigan as part of the Republic Waste Services contract. About 50% of the waste sent to Michigan from Ontario was disposed at the Carleton Farms Landfill in Wayne County, 32% was disposed at the Pine Tree Acres, Inc. landfill in Macomb County, and the remaining 18% was disposed at 6 other landfills in three other counties (Table 7.5). A small amount of non-hazardous solid waste originating in Canada (presumably Ontario) was landfilled at the Standard Environmental Services, Inc. Rockwood Landfill in Monroe County.
21 Tonnage estimates are based on volume (cubic yard) figures reported in “Report of Solid Waste Landfilled in Michigan: October 1, 2002 – September 30, 2003” prepared by Michigan Department of Environmental Quality, January 30, 2003.
Page 38 December, 2004

Private Sector IC&I Waste Management System in Ontario
Table 7.6: Ontario Waste Landfilled in Michigan by Landfill
October 1, 2002 to September 30, 2003*22
Name of Landfill County Type II
Municipal Solid Waste
Type III ICI and C&D Waste
Total
(tonnes) (tonnes) (tonnes) Arbor Hills West Expanded Sanitary Landfill Washtenaw 239,300 239,300 Brent Run Landfill Genesee 182,879 182,879 Carleton Farms Landfill Wayne 1,387,489 1,387,489City Environmental Services Crawford 3,712 3,712 Pine Tree Acres Macomb 881,179 881,179 Richfield Landfill Genesee 36,253 36,253 Sauk Trail Hills Landfill Wayne 4,373 4,373 Woodland Meadows RDF-Van Buren Wayne 49,978 49,978 Rockwood Landfill (Standard Environmental Services) Monroe 68,733 68,733 Total 2,785,193 68,733 2,853,926 Tables 7.6 and 7.7 show the trends in waste imports to Michigan between the years 1996 to 2003. The tables show that imports to Michigan were steady at approximately 800,000 tonnes/year from 1996 to 1999. This was all likely IC&I waste, and represented the baseline before the various changes in available landfill capacity in Ontario discussed elsewhere. In year 2000, the total increased by 500,000 tonnes (most of this related to the City of Toronto contract), with an additional increase of 500,000 tonnes from 2000 to 2001. The biggest jump was from FY2002 to FY 2003, when an additional 850,000 tonnes per year was disposed in Michigan after the Keele Valley landfill (which also accepted municipally managed waste from York, Durham and Toronto) closed.
Table 7.7: Origin of Solid Waste Disposed in Michigan Landfills From Different Sources
1996 to 2003 (Millions of Tonnes)
FY 1996 FY 1997 FY 1998 FY 1999 FY 2000 FY 2001 FY 2002 FY 2003 Michigan 11.07 11.52 12.41 13.80 14.15 14.64 13.93 14.25 Canada 0.80 0.76 0.77 0.71 1.28 1.78 2.00 2.85 Other States 0.92 0.93 0.96 1.21 1.55 1.81 1.48 1.84 Totals 12.79 13.21 14.14 15.72 16.98 18.23 17.41 18.94 Table 7.8 shows the export data to Michigan as a percentage. All of the waste from Ontario actually only accounts for 15% of all the waste disposed in Michigan landfills (up from 6% in 1996).
22 Conversion of the available information from Michigan from cubic yards to tonnes was carried out using “in truck” density of 653 lbs per cubic yard, or 303 kg per cubic yard. This may be +/- 10% to 20% accuracy
Page 39 December, 2004

Private Sector IC&I Waste Management System in Ontario
Table 7.8: Percentage of Solid Waste Disposed in Michigan Landfills From Different Sources, 1996 to 2003
FY 1996 FY 1997 FY 1998 FY 1999 FY 2000 FY 2001 FY 2002 FY 2003 Michigan 86.5% 87.2% 87.7% 87.8% 83.3% 80.3% 80.0% 75.2% Canada 6.3% 5.7% 5.5% 4.5% 7.5% 9.8% 11.5% 15.1% Other States 7.2% 7.0% 6.8% 7.7% 9.1% 9.9% 8.5% 9.7% Table 7.9 shows the amounts of waste disposed by GTA municipalities in Michigan. This influx of waste has drawn significant negative attention to all waste from Ontario, (including IC&I waste) which had been disposed in Michigan and New York for many years without any significant resistance. The fact that all of Toronto’s and Peel’s municipal waste (1.2 million tonnes in 2003) is disposed at just one landfill (Carleton Farms) draws significant attention to the issue and has galvanized action by a number of environmental groups and local NGOs. Until year 2000, Toronto sent it’s waste to two different landfills (Arbor Hills and Carleton Farms) so the quantities were less noticeable. .
Page 40 December, 2004

Private Sector IC&I Waste Management System in Ontario
Table 7.9 Current Contracts For Disposal of GTA Municipal Waste, 2003
WASTE SOURCE Disposal
Contractor and Landfill Location
Amount in 2003 (rounded to nearest 1,000 tonnes)
Haulage Contractor
Contract Term and Conditions
City of Toronto municipally managed waste
Republic Carleton Farms, Michigan
1,095,000t Wilson Logistics
Contract extends January, 2001 to Dec 2005. Can be extended up to 20 years total. Minimum 100,000 tonnes per year. Must not implement incineration or energy from waste. Can implement “new and emerging technologies” , recycling and composting or any other diversion activity.
Peel residential waste
Republic Carleton Farms, Michigan
85,000t res and small amount of IC&I
Wilson Logistics
Contract period July 2002 to June 2007. Contractor must manage all municipal waste landfilled. No restriction on lower limit of tonnage managed
York residential waste
Onyx Arbor Hills, Michigan Republic Carleton Farms, Michigan Green Lane Landfill, London, Ontario Arbor Hills and Green Lane
91,000t 50,000t 50,000t 20,000t (Georgina TS)
Verspeeten Cartage Ltd Wilson Logistics Green Lane Verspeeten Green Lane
Contract began January 1st, 2003 Runs 5 years, ending Dec 31st, 2007. Possible 5-year extension Same term Same term, 3,5 year extensions possible Same as Green Lane above
Durham residential waste
Waste Management Inc Pine Tree Acres, Michigan Waste Management Inc Pine Tree Acres, Michigan
125,000t 16,000t
Miller Waste Systems Waste Mgt Corporation of Canada (Clarington only)
Miller contract period started January, 2003 for 8 years with optional extensions. Responsible for receiving, hauling and disposal of waste. Contract started January, 2003 and extends to October, 2009. Responsible for receiving, hauling and disposal of waste
Page 41 December, 2004

Private Sector IC&I Waste Management System in Ontario
Table 7.10 shows the breakdown of municipally controlled imports to Michigan by state. Canada (Ontario) is by far the largest importer, followed by Illinois, Indiana and Ohio.
Table 7.10: Non-Hazardous Solid Waste Exported to Michigan Landfills, by Origin (2002/2003)
Imported From FY 2002 (tonnes) FY 2003 (tonnes) Canada 1,993,084 2,785,193 Connecticut 218 31,053 Illinois 513,495 558,560 Indiana 514,719 539,520 Iowa 0 15 Maine 0 26,811 Missouri 18 0 New Hampshire 0 4,058 New Jersey 31 478 New York 1,524 18,178 Ohio 313,147 368,450 Pennsylvania 25 0 Wisconsin 128,090 163,706
7.7 Summary The lack of permitted disposal capacity in Ontario combined with the unpredictable access to the US disposal market leads to an unstable waste disposal system in the Province. The private sector waste management industry in Ontario will invest in business opportunities that are created within a sustainable, predicable waste management system supported by clear and enforced regulatory requirements applied equally to all. The border situation adds an unpredictable amount of extra time to get waste to disposal. This translates to an unpredictable cost to the operator. Because of very unstable, unpredictable conditions, operators have to decide whether to acquire additional truck and trailer assets, additional drivers etc. to ensure that waste moves to disposal every day and that transfer station permit limits are not exceeded. Because of the lack of disposal capacity in Ontario, there is no alternative except to continue to operate within this unsustainable system which is entirely dependent on waste export to the US. If adequate disposal capacity were available in Ontario, the unpredictability of the border and all of the economic impacts of delays could be built into the decision regarding whether or not to export, and would likely lead to a significant reduction in the amount of waste exported. Waste disposal capacity would be subject to normal trade practices in a healthy competitive trade environment. Ontario depends heavily on export to the US as part of our waste management system, and in fact can not survive without this source of disposal capacity. Today, most of our waste exports are disposed in Michigan and to a lesser extent New York State.
Page 42 December, 2004

Private Sector IC&I Waste Management System in Ontario
Waste export is an integral part of our waste management system; IC&I waste has been exported for years without any problems, but the City of Toronto municipal waste disposal contract, and the large amount of traffic to one landfill, Carleton Farms, has galvanized resistance to Ontario waste export into Michigan. In the long term, an adequate supply of competitive waste disposal capacity needs to be available in Ontario to meet the needs of the IC&I sectors.
Page 43 December, 2004

Private Sector IC&I Waste Management System in Ontario
8. Summary of Findings and Conclusions IC&I Waste Diversion Facilities IC&I waste is processed for diversion through a series of 76 MRFs, of which 56 are owned by private sector operators. The study identified 37 composting or anaerobic digestion facilities owned by the private sector. The remaining 37 organics processing facilities are owned by the public sector. IC&I waste is processed at some of the 74 composting operations in the province Only 9 of the 74 organic waste processing (composting and anaerobic digestion) facilities have permitted capacities of over 20,000 tonnes per year. A sizeable amount of the available capacity to process organic waste is concentrated in 5 facilities. The study identified a constructed capacity to process about 1 million tonnes per year of organic materials. This is less than what is required and waste managers identified an “extreme shortage” of composting capacity to meet their needs. A small amount of diversion occurs at processing/transfer facilities and as a “last chance harvest” at landfills. Transfer Stations IC&I waste is managed through a network of 112 transfer stations throughout Ontario. About two thirds of these transfer stations are located in the Greater Toronto Area, with 29 located within City of Toronto. Eleven (11) of the 112 transfer stations are municipally owned. The remainder are owned by the private sector. Transfer stations have become a more essential part of the IC&I waste management infrastructure since export to the US became a significant component of the waste management system. Permitted operating conditions for transfer stations vary, but the most critical limitation is the “in-out” limit, which is 299 tonnes/day for many transfer stations, and therefore limits their capacity and flexibility, particularly when there are slowdowns or closures at the US border. Ontario Landfill Capacity for IC&I Waste Management Current landfill capacity in Ontario is estimated at about 80 million tonnes. About 42 million tonnes of this capacity is in municipal landfills; the remainder is available in private sector landfill sites.
Page 44 December, 2004

Private Sector IC&I Waste Management System in Ontario
Most Ontario IC&I waste disposal occurs at 11 private sector landfills. Most of these private sector landfills are located in Southwestern Ontario; a few are located in Eastern Ontario. The private sector landfills used for IC&I disposal in Ontario have a permitted maximum fill rate of about 3 million tonnes per year, significantly less than the 6.2 million tonnes of annual demand for IC&I and C&D disposal capacity. A number of these landfills will close by 2009, reducing annual capacity in the province to a level significantly below our current and future needs. The gap between available landfill capacity in Ontario and our current IC&I waste disposal needs is currently filled by capacity in the US. Border Issues Waste management professionals feel that September 11th was a “wake-up call” to the vulnerability of the Ontario waste management system when access to the US is constrained. Slow downs at the border coupled with reduced hours of service for drivers in the US have created a host of operating challenges for Ontario waste management companies and haulage companies. Among these are driver retention, the need for additional trucks and containers and the unpredictability of the border crossing times. The need to have sufficient landfill capacity in Ontario to meet our annual needs became evident during the September 11th crisis. Conclusions More permitted landfill capacity is needed in Ontario to meet our current and future needs domestically, even if significant waste diversion occurs over time. The current Environmental Assessment and regulatory approvals process needs to be amended to allow for the efficient and timely approval of composting, transfer station and landfill capacity.
Page 45 December, 2004

Appendix A
Collection of Industrial, Commercial and Institutional Waste
A.1 Collection Service to IC&I Generators Many companies, including large waste management companies, medium sized regional companies and small, local one-truck mom and pop operators are involved in IC&I waste collection. Waste collectors generally service IC&I customers with one of the following collection options:
Front-end loader bin Roll-off box, Lugger bin, or, Compactor.
The waste collector works with the generator to determine the characteristics of the waste and the size, type and frequency of service required. Factors which impact on these decisions include the waste type, generation rate, density, container space, access etc. The characteristics of the waste are frequently assessed as part of the contract, and determine the location to which the waste will be delivered. The collector and generator together identify the size, type and frequency of service which makes the most sense for the generator, and establishes a contract which sets out the frequency of collection (weekly, twice weekly, daily, etc). A front end loader collection truck travels to a number of generators and tips the contents of their bins into the truck. The collector typically operates within a small area and empties the truck (which typically holds 10 tonnes) at a transfer station or landfill. A typical run would involve servicing 10-15 stops, and then going to a transfer station to unload before collecting from another 10-15 stops. Direct haul to landfill by a collector only occurs if the landfill is close to the collection route, and/or an alternative disposal option is not available. Collectors typically operate within a 20-mile radius for one run, and do not like to travel long distances with the collection truck. To save on transportation costs, waste is consolidated into larger (32 tonne) trailers at transfer stations. The location to which a collector delivers the waste depends on the tipping fee charged at the landfill or transfer station, the location of the landfill or transfer station and competition in the marketplace. Depositing at a private sector transfer station is usually cheaper than at a municipal landfill particularly if the landfill is a small, low volume one or if it wants to conserve remaining permitted capacity for residential waste. Luggers and roll-off bins are serviced differently to front end bins. The collection truck arrives at the IC&I generator site, deposits an empty roll-off bin at the site and takes away the full bin. The collection truck contains a mechanism to pull or lift the full bin onto the truck chassis. The
Page A- 1 December, 2004

lugger is lifted or lowered with chains onto/off a flat bed truck whereas a roll-off box is pulled onto rails that are raised or lowered hydraulically. When the roll-off or lugger bin is collected from the site, it is driven directly to a transfer station (or landfill if close) where its contents are deposited. Roll-off bins hold about 2-4 tonnes when full. For certain waste types, particularly organics or OCC recyclables, on-site compactors are sometimes installed. The purpose of the compactor is to reduce the number of times the bin needs to be emptied, and allows more waste to be stored in one bin (e.g. large grocery stores). On-site compactors are picked up using the same type of collection truck as roll-offs. The compactor may be owned by either the waste service provider or the waste generator. Some generators that produce a large amount of cardboard (e.g. big box stores) may have small on-site balers to bale the OCC on-site for sale directly to paper brokers. There is sometimes a restriction on collection of food waste because of restrictions imposed on what materials are acceptable at local transfer stations (see discussion below). This dictates routing of the trucks; however, the collector has no control nor ability to impact what materials the generator puts in the bin, so some food waste may be contained in IC&I loads which may have to be free of food waste depending on the Certificate of Approval requirements of the receiving transfer station or landfill. Collection of garbage is the most frequently offered service, as this is what the customer generally wants, and it is the service which waste management companies are best positioned to provide. Some customers have a separate organics bin (or bins), or have separate bins for recyclables. Customers are charged for each pick-up; therefore, each additional bin is an extra cost to the client. If there is more than one bin, it increases the price for collection. Front-end container lifts are charged at a flat rate; the sales representative estimates the weight likely to be involved and the size of container required, and sells the service to the customer for a set price. Many trucks have load cells which can identify the tonnage collected from each customer. This information is valuable for the service provider and generator. Roll-off, compactor and lugger bin customers are usually charged by weight since they are weighed in individually at the transfer station or landfill. Some collectors give customers a rebate based on the commodity value of the material collected (e.g. for cardboard), and provide an extra bin for the OCC. A.2 Municipal Waste Collection Service to IC&I Generators Some municipalities provide collection to small IC&I generators located on major streets. This is done partly to keep the streets clean. The City of Toronto is the municipality most heavily involved in IC&I waste service provision. City forces provide garbage collection to about 20,000 IC&I generators on major streets. This service has been provided for many years as a “night run”, and converted to a full user pay system, at $3.10 per garbage bag, in 2002. About 58,000 tonnes of garbage are collected through the City of Toronto IC&I collection service. Collection of recyclables and organics is provided free of direct charges.
Page A- 2 December, 2004

Other Ontario municipalities provide varying levels of service to small businesses in the downtown core. Many Ontario municipalities are slowly getting out of the IC&I waste collection business for a number of reasons23.
23 RIS in-house research
Page A- 3 December, 2004

Appendix B
Impacts of Border Crossings on IC&I Waste Management Infrastructure In Ontario
B.1 History of Cross Border Disposal Private sector Ontario companies have been shipping waste to Michigan and other US states for disposal since the 1980’s, when Region of Halton disposed of it’s waste in New York State before it’s new landfill was approved. IC&I waste export to the US was established as a real management option in the early 1990’s, when Toronto raised its tipping fee to $150/tonne in an effort to encourage waste diversion and also conserve landfill capacity for its residential waste for as long as possible. One of the objectives of the tipping fee increase was to encourage the private sector to manage IC&I waste from the GTA independently of municipally owned landfills. The initial increase in tipping fees was followed by a sharp decrease in the amount of waste received in all municipal landfills in GTA, which traditionally managed all IC&I waste generated in the GTA. The sharp decrease is shown in Table B.1 and also Figure B.1. Some of this waste returned to GTA landfills when the price was lowered, but by that time, hauling and contracts had already been established for a number of years at reasonably fixed prices. Table B.1: Metro Toronto IC&I Waste Disposed in Toronto Municipal Landfills, 1986 to 1995
Year Metro Toronto IC&I Waste Disposed
1986 1,578,298 1987 1,621,590 1988 1,535,064 1989 1,369,825 1990 1,293,748 1991 816,116 1992 314,228 1993 351,535 1994 616,551 1995 639,716
Page B- 1 November, 2004

Figure B.1: Impacts of High Tipping Fees and Export on IC&I Waste Disposed of in Metro Toronto Landfills: 1986-1995
1800000
With the closure of Keele Valley landfill at the end of 2002, the remaining 600,000 tonnes of IC&I waste, which had used Toronto landfills and transfer stations from mid-1990’s until 2002 needed new disposal outlets. About 300,000 tonnes is still handled through Toronto municipal transfer stations, although this amount is getting lower with the recent increase in tipping fees at the transfer stations. The waste which went to Keele Valley is now handled by various GTA transfer stations. For many years, shipping of waste to Michigan or other US states was part of doing business for the private sector. However, the recent Toronto contract which ships over 1 million tonnes per year to one landfill (Carleton Farms) has raised the public’s awareness of this long standing trade practice, and has made this option increasingly difficult and not sustainable in the long term. Some industry members feel that if the Toronto municipal waste issue could find an Ontario-based solution, export of IC&I waste from Ontario to Michigan would not attract as much attention. Delays at the border related to homeland security in the US and work to rule by Canadian border staff, and specific events such as September 11th and the BSE-related border closures alerted Ontario companies to the vulnerability of not having Ontario based disposal options this
1986 1987 1988 1989 1990 1991 1992 1993 1994
1,578,2981,621,5901600000
Tonn
es p
er y
ear I
C&
I Dis
posa
l At M
etro
Tor
onto
La
ndfil
ls
1,535,064
14000001,369,825
1,293,748
1200000
1000000
816,116800000
639,716616,551600000
400000351,535
314,228
200000
0
Year
Page B - 2 December, 2004
side of the border. The problem is that there is no certainty to the cost structure of sending waste across the border since 9/11 because the time delays are not predictable. It is difficult to price an unpredictable time delay. A recent work to rule by Canadian border officials has resulted in an additional 15 seconds to process each truck going across the border. This results in a back-up of 3 hours by the end of the day. Some companies deal with this problem by having truck drivers pick up the load the night before and start off early in the morning to get across the border before the back-ups are significant. This raises the issue of storing waste in trailers and the potential leakage of leachate. B.2 Critical Issues Identified By Industry Members A number of waste management company representatives were interviewed to discuss the impacts of shipping over 3 million tonnes of Ontario waste across the US border for landfilling and how this practice has impacted their business, particularly in the last three years. There were ranging opinions, and a number of consistencies in the responses, which identified serous issues. Decreased Efficiency in Truck and Equipment Use: The distance and time involved in shipping waste 500 km reduces the efficiency of many parts of the waste management system. A transport trailer, which holds 32 tonnes of waste, can make 2-3 trips to a local Ontario landfill from a transfer station in one day. This same piece of equipment can complete only one return trip to Michigan in a day. When the Keele Valley Landfill in Vaughan was in operation, transport trailers could complete 4 trips to Keele Valley from transfer stations in Toronto each day; this transport trailer can only do one trip to Michigan, and 4 transport trailers are needed to handle the same amount of waste. Need to Buy More Trucks and Trailers: Many companies have had to buy more trucks and trailers to provide more storage and flexibility in their transportation systems in the event of a border slowdown. Reduced Hours Of Service in Michigan: Reduced hours of service for truck drivers which have been implemented in Michigan and across the US have caused significant challenges for Ontario drivers. The US now limits drivers to 11 consecutive hours of driving. Beyond this point, the driver must stop and sleep for 8 hours. If a driver is delayed because of slow-downs at the border, there is insufficient time to get to the US landfills and back to his/her home base in Ontario, or even back across the US border to Ontario, in one day. Many drivers have been caught on the US side of the border when their limit of 11 hours is reached, and can not return to Ontario until they have slept 8 hours. This limits drivers income as they are not paid for downtime. Numerous drivers have resigned because of this limitation and have found jobs which do not involve crossing the border. A few years ago, a driver could reliably get to and from Michigan in one shift. This is no longer guaranteed for a combination of reasons. Security Alerts In the US: The border slows down because of Homeland Security alerts in the US. Some operators felt that the reduced hours of service and also traffic accidents actually had more of an impact on their business than security alerts.
Page B - 3 December, 2004

Driver Retention and Driver Turnover: The average Ontario truck driver is 48 years old. Young drivers are joining the business in small numbers. It is predicted that there will be a shortage of 225,000 truck drivers for all types of business activity, in Ontario including the waste management industry in the next 5 years; an additional 38,000 drivers per year are needed for all transportation businesses in Ontario. The frustration of being held up at the Canadian side of the border, and also of getting stuck at the US side because of hours of service restrictions has resulted in many drivers quitting their jobs, and finding other work which involves Ontario only trips. Increased Transportation Costs: Contracts now reflect the fact that there will be delays at the border. Transportation costs are typically quoted with an allowance for 30 minutes delay each side of the border and a provision that each additional hour of delay will cost an additional $35-$65. The cost of delays, coupled with increased fuel costs has increased the cost of shipping to Michigan by about $10/tonne. Transfer Station “In and Out” Limitations: There is concern in the industry that current limitations on transfer stations are leading some operators to risk exceeding allowable limits in an effort to keep the waste moving. This creates an unlevel playing field in the industry. An efficient transfer station may actually be close to empty, because all of the waste has been shipped to landfill. This efficient operation could be handling much more waste, thus moving waste through the system in a manner which protects the environment, but can not do so because it has reached its “in-out” daily limit. A more efficient system would allow transfer stations to operate with no in-out limit, but limiting the amount stored on site at the end of the day. This value would be determined by the size of the transfer station building and Fire Code considerations. Storage Capacity at Transfer Stations: Approved storage at transfer stations ranges from 100 tonnes to 12,000 tonnes, depending on when and where the Certificate of Approval was issued. This limits the amount of waste that transfer stations can accept. Closure of Keele Valley Landfill in Vaughan: Many operators point to the closure of Keele Valley landfill, which used to accept about 600,000 tonnes per year of IC&I waste, as a significant strain on the waste management system. Landfill operators in Ontario noticed the increase in truck traffic immediately after the closure of Keele Valley in December, 2002. By June, 2003 landfill operators in Ontario indicated to various haulers that they would have to find other disposal options. This pushed more tonnage back into the transfer station system, which is already overloaded as discussed previously, and put the transfer station out of compliance. Emergency Certificates of Approval: When the border slows down or closes, transfer station operators apply for emergency storage provisions to allow them greater flexibility in finding local disposal options for the waste back-up. Border Staff and Traffic Lanes: Some operators feel that the border is unnecessarily slow because of a lack of staff and also insufficient lanes of traffic. Four additional lanes have been opened at the Ambassador Bridge24, which is used to get to Carleton Farms. This should relieve the back-up. 24 Increased from 9 to 13 lanes
Page B - 4 December, 2004

Border Staff Work To Rule: The recent work to rule by Canadian border staff increased the processing time for each truck by 15 to 20 seconds. By the middle of the day, the delays had reached 3 hours. This occurred with no homeland security concern in the US, and was purely related to a Canadian labour dispute. Limits on Opening Hours at US Landfills: Border delays create problems for drivers because they sometimes arrive late at the US landfill destinations, after the landfills have closed. Losing Trailer Loads: When there are sufficient delays, a waste management company simply cannot handle the backlog, and can not catch up with the business lost as a result of the slowdown. B.3 Impacts on September 11th, BSE Border Closure and Power Outage Specific events have resulted in particular impacts on the cross-border traffic or operation of the transfer station system. September 11th
The border was closed to truck traffic for 1-2 days. Garbage transport trailers with full loads were lined up for a number of miles on this side of the border. After a time, the MOE Director of Approvals issued a blanket emergency certificate to all landfills in South Western Ontario to accept as much waste as possible subject to certain conditions. One of these conditions related to the amount of waste which had been placed in the landfill year to date. In one case, a landfill operator applied to the local MOE office for an emergency certificate, but the local MOE staff did not consider September 11th to be an emergency or that the 9/11 related border closure and the backlog of trucks to be an emergency, and refused to grant the emergency certificate. Emergency certificates which were granted as a result of 9/11 or other border closures allowed the maximum daily limit to be increased, but the annual tonnage limit for the landfill could not be exceeded. Landfills took the waste on an emergency basis, to help relieve the short term crisis, but had to cut off customers later in the year to stay under the annual limit. Empty trucks which were on their way back to Canada were stranded on the US side of the border for 2 days. Drivers had to stay with their trucks, and companies eventually sent relief crews to allow drivers to sleep. In many cases, drivers and trucks were simply sitting on the highway not moving for 18 hours. Eventually, the backlog was disposed in Ontario landfills that had sufficient capacity to handle a short term emergency. The feeling in the waste management business is that September 11th was a wake-up call to the vulnerability of the Ontario waste management business to border closures and slowdowns. Cross border traffic is slower as a result of Homeland Security requirements. This has a significant trickle down effect on the transportation system and the transfer station system and is slowly making disposal across the border much slower, less efficient and more expensive. There is total agreement within the industry that in the long term, Ontario based landfill capacity must be found.
Page B - 5 December, 2004

BSE Closure The border was closed for about 1 day during the BSE crisis. This was less critical for the waste management industry as trucks which were in the US could come back to Canada; therefore, the empty trucks could get back into the system. The closure resulted in the usual pressure on Ontario landfills to take waste on an emergency basis, and some meat related wastes, such as rendering plant wastes, could no longer enter the US and had to be disposed in Ontario. Power Outage The border closed during the North American power outage in August, 2003. Transfer stations were closed because they had no power; trucks were shut down because gas stations could not pump fuel. In Toronto, the Disco and Bermondsey municipal transfer stations came back on line after midnight, which was a significant advantage. With two transfer stations in operation, staff could deal with what was on the truck already. However, there was still no fuel to haul the garbage to disposal. The Medical Officer of Health told people to throw everything out because refrigerators had been out of service during the hot weather. This caused a large spike of waste on Monday/Tuesday after the blackout; in turn this spike caused a backlog into Michigan. Theoretical vs Constructed Capacity: Landfill operators interviewed as part of this project stressed that even if all limitations on landfills were lifted in a longer term emergency, existing Ontario landfills can not simply double the amount of waste they take per day. Each landfill has a limited number of compactors and support machinery for waste compaction at the site. The amount of machinery available is generally chosen to match permitted capacity at the site. Each of the large compaction machines costs $750,000 to $1,000,000 and they take months to order. If additional waste is taken in on an emergency basis, machines can not get high compaction at the landfill; this wastes airspace but more importantly is a concern for health and safety, as other equipment can turn over when it is not on a sufficiently solid base. Some landfills with significant available space could take in tonnage, but would need to store it in piles at the landfill site and landfill it later when the machines could catch up. This double handling would lead to odour generation and other impacts which could upset landfill neighbours. Landfills depend on their good relationships with their neighbours and are not willing to compromise these relationships or risk negative reactions by operating in a less than optimal way. In addition, landfills only construct the capacity they need until the next construction season. Sufficient “constructed capacity” (with liners, leachate collection systems, etc) may simply not be available for a longer term crisis. The GTA Waste Coordinating Committee are assessing constructed capacity for landfills in Ontario What If The Border Closes: Interviewees agreed that if the border to the US closed for any length of time, for reasons we can not contemplate at this time, we can not gear up fast enough to meet our own disposal needs. 9.4 Summary of Key Issues Critical Issue #1: Lack of Disposal Capacity in Ontario
Page B - 6 December, 2004

This is discussed in Section 7 Critical Issue #2: Unpredictable Delays The inability to reasonably predict the time to ship a load of waste to disposal and get the truck back for another load, means that unreasonable conditions are placed on the transfer station infrastructure. This makes it very difficult to operate in compliance with strict tonnage conditions in Certificates of Approvals. For example, a scheduled truck may not make it back across the border in time, (or the driver could exceed his allowable operating hours because of delays), to pick up another load from the transfer station. This situation potentially puts the transfer station out of compliance with it’s storage limit because waste cannot be returned to the generator. This is a risk that transfer stations have always had to deal with to a certain extent because delays can happen from traffic accidents, truck breakdowns, driver sickness etc. and is manageable on a one-off basis within a normal business environment. However, with every truck crossing the border now subject to the same potential delay, combined with the absence of any alternatives in Ontario, the ability for the industry to respond becomes virtually impossible at times. Industry members feel that this situation simply cannot continue. Critical Issue #3: Emergency Amendments to Certificates of Approval Emergency Amendments to Certificates of Approval have been issued in a very cumbersome way in the past. In many cases these emergency amendments have been applied unevenly without any consideration for market consequences. For example, during past labour disputes in the GTA, municipalities have worked with a select number of private sector transfer stations to assist them receive expedited amendments from MOE. This was essential for public health reasons, to ensure that there was a place for municipal waste to go. However, the domino effect that redirecting waste from one transfer station to another, and the impact on the neighboring transfer facilities that have not received amendments but end up with a lot of “new” waste being delivered to them, had not been fully planned for. This practice also raises a business monopoly concern whereby only some facilities are given the municipal support required by the MOE to receive an amendment.
Page B - 7 December, 2004