Embed Size (px)
Citation preview

The Primary Aluminum Industry as a Complex Adaptive System
David L. OlsonJames & H.K. Stuart Chancellor’s Distinguished
ChairFull Professor, University of Nebraska

Complex Adaptive Systems & Supply Chains
• SYSTEM ORGANIZATION– Uncertain, frequent, transaction-oriented business leads to
organizations (Williamson, 1981)• MARKETS – work well with straightforward exchanges, but high levels of
uncertainty (& variance)• HIERARCHIES – cope with bounded rationality, but inefficient
• SUPPLY CHAIN SYSTEMS– Autopoeisis - Systems have a life of their own (Maturana & Varela,
1988)• Rockefeller’s Standard Oil a HIERARCHY
– VERTICAL INTEGRATION
– Supply Chain organizations evolve• MARKET – transaction cost analysis theorizes switching point
– SUPPLY CHAIN

Aluminum System• Bauxite
– Very common mineral, but highly variable in quality (amount of dirt needed to get ton of alumina)
– Strip mines• Alumina
– An aluminum oxide– Created by processing dirt in REFINERY– Lots of capital required– Since volume of dirt high, tend to locate near mines
• Aluminum– Fry Alumina, get rid of slag, end up with Aluminum– SMELTERS – use prodigious quantities of electricity– Since electricity the main cost, tend to locate near cheap power

System• 19th Century
– Europe mined bauxite (Pechiney), depleted• 20th Century
– US mined (Alcoa), depleted all but Arkansas– Shifted to Canada (Alcan), depleted bauxite
• 1960s– Alcoa, Alcan, Pechiney obtained rights to Caribbean sources (Jamaica; Surinam;
Guyana)• 1970s
– Inspired by OPEC, Caribbean sources instigated IBA (International Bauxite Association)
• 1980s– Australia joined IBA, but lowered price, took over world market– IBA basically failed

World Bank ForecastBrown et al. [1983]; web actual(2000)
1965 1970 1975 1980 1985 1990 1995 20000
5000
10000
15000
20000
25000
30000
35000
40000
World Aluminum Demand
Actual Low High

Aluminum Industry CountriesSECTOR Countries involved in Aluminum
LDC (developing countries) Jamaica, Haiti/Dominican, Guyana, Surinam, Brazil, VenezuelaGhana, Guinea, Sierra Leone, CamerounIndia, Indonesia, MalaysiaTurkey, Mexico, Argentina, Egypt, Zaire, South AfricaASEAN, Korea/Taiwan, Mideast
OECD (developed countries) USAWestern EuropeAustraliaCanadaJapan
Communist Eastern Europe (Yugoslavia)USSRChina

Network Model Variables
• Mines (22) http://www.mapsofworld.com/minerals/world-bauxite-producers.htmlhttp://www.indexmundi.com/en/commodities/minerals/bauxite_and_alumina/bauxite_and_alumina_table11.html
– Ore quality variable– Each site capacity limited
• Refineries (84)– Type of ore affects conversion outputwww.world-aluminium.org/statistics production/capacity
• Smelters (29)http://www.mapsofworld.com/minerals/world-aluminium-producers.html
• Demands (18)– Year 2000 forecasts
Supply Chain System Network Features
Elements
Agents Actors – suppliers, manufacturers, retailers, customersPartnerships & alliances
Interaction Resources & activitiesResource exchange (finance, information, knowledge)
Autonomy Relative degree of independence of operation
Learning Knowledge exchange & development

Key Events – 1970-2000
• The International Bauxite Association was formed in the early 1970s.
• In the 1980s Australian mining interests operated in competition with rather than in cooperation with the IBA, gaining a large market share
• In the late 1980s the Chinese government encouraged free market development
• In 1990 communism for the most part was replaced with new freer market economies

Demand
80 81 82 83 84 85 86 87 88 89 90 91 92 93 94 95 96 97 98 99 0 1 2 3 4 5 6 7 8 9 10 11 12 130
10000
20000
30000
40000
50000
60000
Demand for Aluminum 1980-2013Thousand metric tons/year

Price
Series1
0
0.2
0.4
0.6
0.8
1
1.2
1.4
Price of Aluminum 1950-2010Dollars/Pound

Price
2003 2004 2005 2006 2007 2008 2009 2010 2011 2012 2013 20140
0.2
0.4
0.6
0.8
1
1.2
1.4
Primary Aluminum Price - 2003-2014Dollars per pound
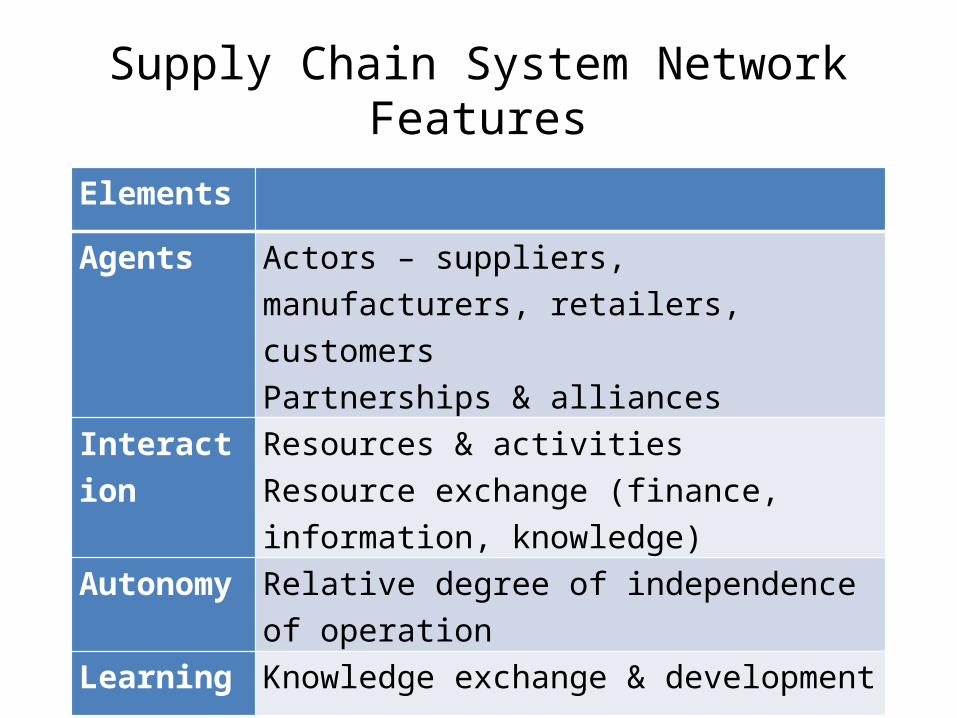
Expropriation by Industry Group1960-1974
INDUSTRY Number of expropriations % of Total
Oil 84 12.0
Extraction 38 18.0
Utilities & Transportation 17 4.0
Insurance & Banking 33 4.0
Manufacturing 30 1.2
Agriculture 19 NA
Sales & Services 16 NA
Land, Property & Construction
23 NA

MINES
• WORLD BANK– More in Caribbean
• NETWORK– Close– We got more in East Europe, China– Venezuela & Brazil compromise locations– If high risk, Australia high• Despite large cost disadvantages

Bauxite
1970 1975 1980 1985 1990 1995 2000 2005 2010 2011 2012 2013 20140
50000
100000
150000
200000
250000
300000
World Bauxite Production(thousand metric tons/year)
IBA Total BRICS Total Europe/US WORLD

IBA Bauxite
1970 1975 1980 1985 1990 1995 2000 2005 2010 2011 2012 2013 20140
10000
20000
30000
40000
50000
60000
70000
80000
90000
IBA Bauxite Production(thousand metric tons/year)
Jamaica Australia Suriname Guyana Guinea
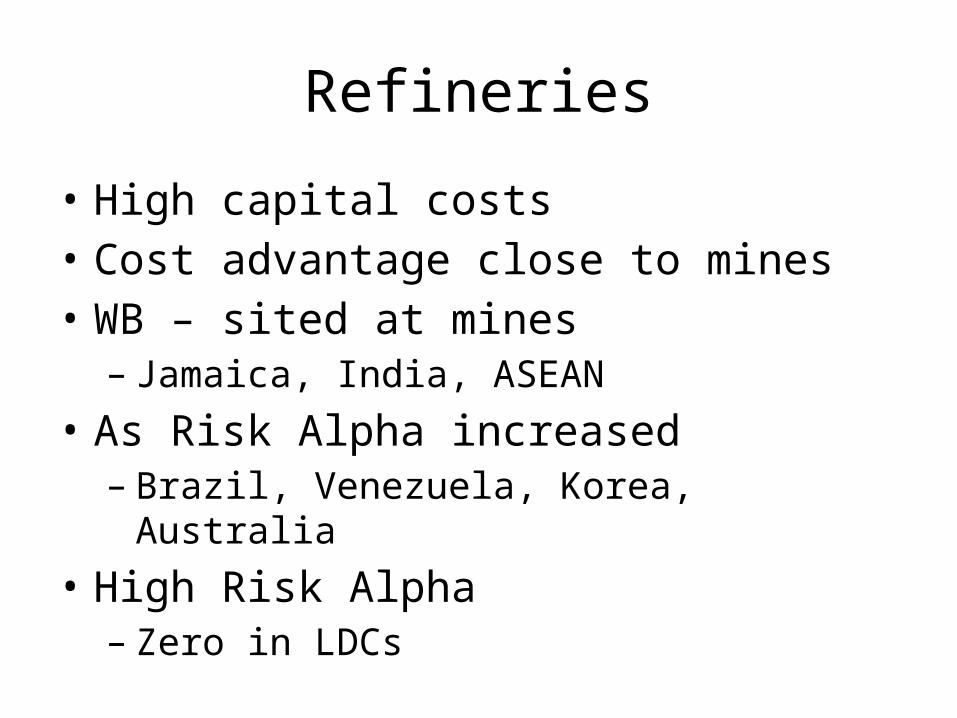
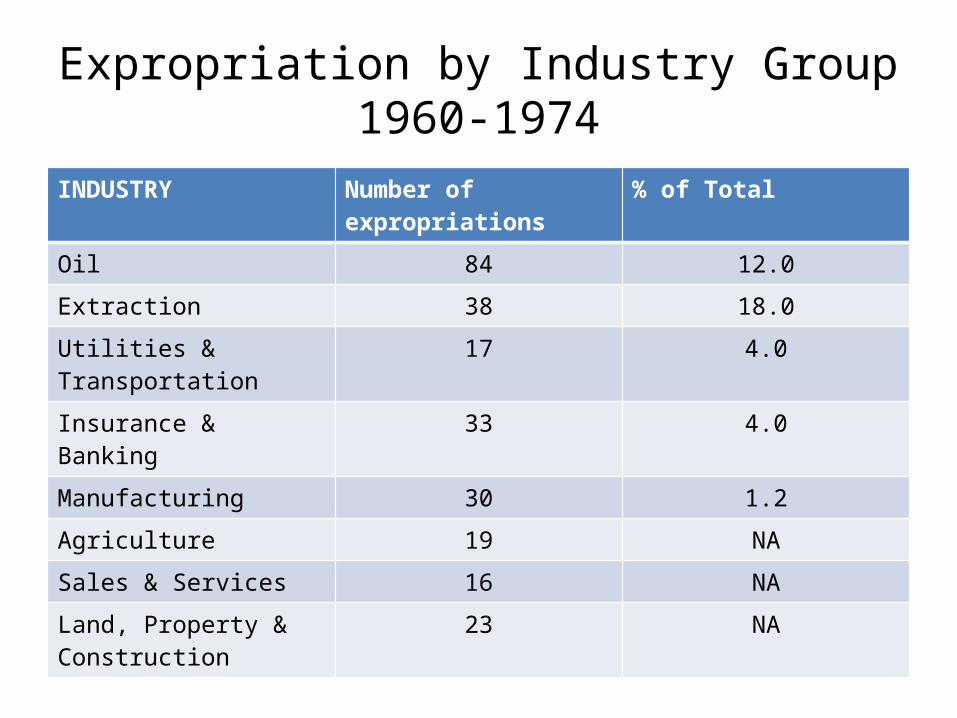
Refineries
• High capital costs• Cost advantage close to mines• WB – sited at mines– Jamaica, India, ASEAN
• As Risk Alpha increased– Brazil, Venezuela, Korea, Australia
• High Risk Alpha– Zero in LDCs

Refining
1970 1975 1980 1985 1990 1995 2000 2005 2010 2011 20120
20000
40000
60000
80000
100000
120000
Alumina Production(thousand metric tons/year)
WORLD IBA BRIC Europe/NA
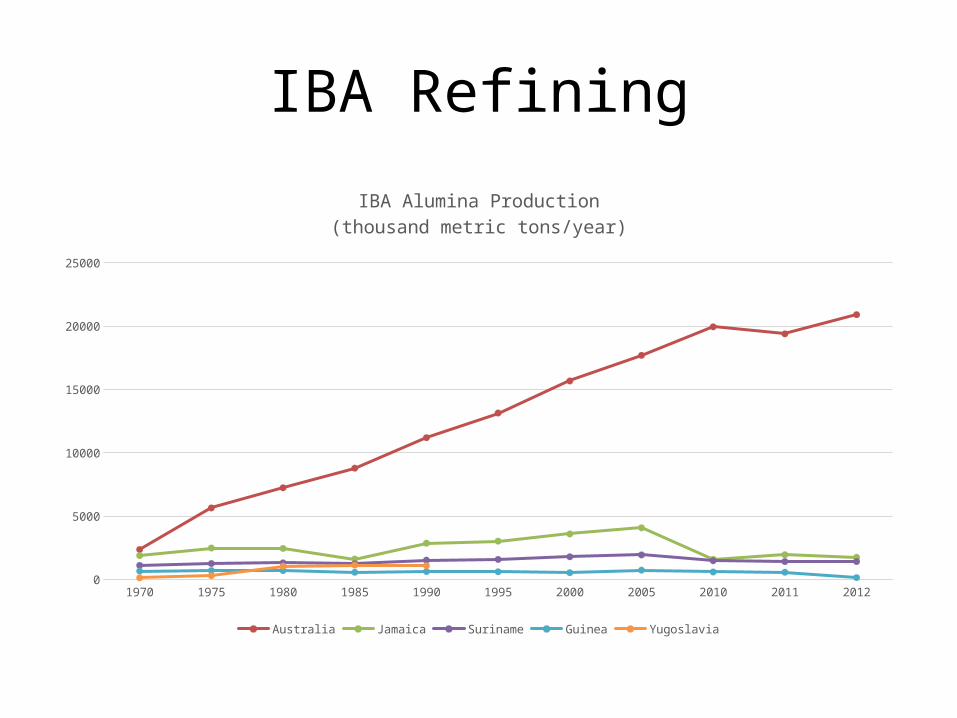
IBA Refining
1970 1975 1980 1985 1990 1995 2000 2005 2010 2011 20120
5000
10000
15000
20000
25000
IBA Alumina Production(thousand metric tons/year)
Australia Jamaica Suriname Guinea Yugoslavia

Smelters
• Close to electricity• WB – forecast high growth in LDCs• ACTUAL– Canada (government subsidized hydropower)– Australia
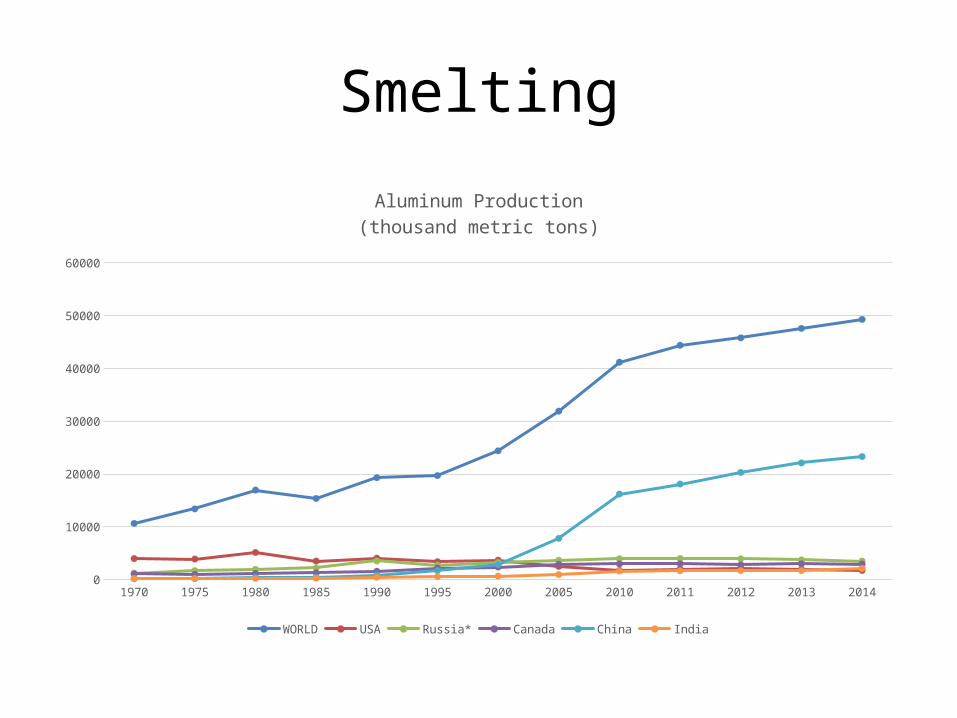
Smelting
1970 1975 1980 1985 1990 1995 2000 2005 2010 2011 2012 2013 20140
10000
20000
30000
40000
50000
60000
Aluminum Production(thousand metric tons)
WORLD USA Russia* Canada China India

Trade Networks
• 1970s– Caribbean – US very strong
• 1980s– Australia – Japan grew– Caribbean declined
• 2008– Australia, Brazil, Indonesia, Jamaica, Guinea expert– Russia, Spain, Canada, Norway production centers– US, China, Japan import final product
• Current– Southern hemisphere primary resource supplier– Production, consumption Northern hemisphere

Complex Adaptive System Elements of Supply Chains CAS DescriptionsInternalMechanism
Agents Agents share interpretive and behavioral rules
Self-organization& emergence
Patterns created through simultaneous and parallel actionsExtensive inter-relationships possible
Connectivity Extensive inter-relationships possible Dimensionality Negative feedback and controls reduce
dimensionalityAutonomy and decentralization increase dimensionality
Environment Dynamism Changes constant and inter-dependent Rugged
landscapeGlobal optimization simple if criteria independentComplex if criteria inter-dependent
Co-Evolution Quasi-equilibrium& state change
Attractors sensitive to change with variance from equilibrium
Non-linearchange
Lack of linear correlation between cause and effect
Non-random future
Common patterns of behavior observable

Linkage of Complex Adaptive System Elements and the Aluminum Production System CAS Aluminum systemInternalMechanism
Agents CustomersFirms (seek to control supply chain)Host countries (set tariffs; implement energy policy)International Bauxite Association (seek to set price)
Self-organization& emergence
Response of Jamaica, Guyana, SurinamAustralian responseChina
Connectivity Degree of coordinationIndependent action of AustraliaFirms become subordinate to host governments
Dimensionality Rule enforcement within IBAEnvironment Dynamism Market – demand/price
Emergence of ChinaCollapse of Yugoslavia, USSR
Rugged landscape IBA difficulty in anticipating consequences of formationCo-Evolution Quasi-equilibrium
& state changeNew balances:Australian, Guinean bauxiteChinese in all three sectors
Non-linearchange
IBA action in 1974Chinese growth in 2000s
Non-random future
New alumina entrants (Ireland, Spain)New aluminum entrants (Iceland, Bahrain)

Aluminum Supply Chain CAS
• Shifting alliances– 1970s bauxite dominated by Caribbean– 1980s saw Australia dominate• Unintended consequence of IBA
– Emergence of China in world economy– New alumina facilities – Ireland & Spain• Guinean bauxite• Norwegian, Icelandic smelting
– Mid-East smelting with flare gas

Aluminum Supply Chain CAS
• Adaptive behavior– First, IBA broke central hierarchical control of
oligopolies– BUT: IBA induced Australian growth• MARKET replaced VERTICAL HIERARCHY
• Additional dynamics– Breakup of Communism• Yugoslavia• Russia