Embed Size (px)
Citation preview

The Price of KnowledgeAccess and Student Finance in Canada
Fourth Edition
Edited by Joseph Berger, Anne Motte and Andrew Parkin

Published in 2009 by
The Canada Millennium Scholarship Foundation
1000 Sherbrooke Street West, Suite 800, Montreal, QC, Canada H3A 3R2
Toll Free: 1-877-786-3999
Fax: (514) 985-5987
Web: www.millenniumscholarships.ca
E-mail: [email protected]
National Library of Canada Cataloguing in Publication
Berger, Joseph 1980-
The Price of Knowledge: Access and Student Finance in Canada — Fourth Edition
Joseph Berger, Anne Motte and Andrew Parkin
Includes bibliographical references.
1. College students—Canada—Economic conditions. 2. Student aid—Canada. 3. Student loan funds—Canada
4. Post-secondary education—Economic aspects—Canada I. Motte, Anne, 1974- II. Parkin, Andrew, 1966-
III. Canada Millennium Scholarship Foundation IV. Title.
Layout Design: Charlton + Company Design Group
The opinions expressed in this research document are those of the authors and do not represent official policies of the Canada Millennium Scholarship Foundation and other agencies or organizations that may have provided support, financial or otherwise, for this project.

Canada Millennium Scholarship Foundation
The Price of KnowledgeAccess and Student Finance in Canada
Fourth Edition
Edited by Joseph Berger, Anne Motte and Andrew Parkin

i
Tables and Figures __________________________________________________________vii
Acknowledgements _________________________________________________________ xi
Introduction ________________________________________________________________ 1
Chapter 1 — The Value of a Degree: Education, Employment and Earnings in Canada __ 5
I. Introduction ____________________________________________________________________________ 7
II. The Earnings Premium ___________________________________________________________________ 9
• Provincial Variations _____________________________________________________________________________________ 11
• The Impact of the Economic Downturn ____________________________________________________________________ 12
• Post-Secondary Education, Earnings and Aboriginal People in Canada ________________________________________ 16
III. Rates of Return ________________________________________________________________________ 17
• Myth: More Access Erodes Quality ________________________________________________________________________ 19
• An International Perspective ______________________________________________________________________________ 21
• Other Economic Indicators _______________________________________________________________________________ 21
IV. Conclusion _________________________________________________________________________________23
Chapter 2 — Participation in Post-Secondary Education: Recent Trends ____________ 25
I. Introduction ___________________________________________________________________________ 27
II. Measuring Post-Secondary Participation in Canada ________________________________________ 29
III. Enrolment _____________________________________________________________________________ 31
• Canada’s Private Career College Students __________________________________________________________________ 31
• Regional Trends in Enrolment ____________________________________________________________________________ 33
IV. Attainment ____________________________________________________________________________ 37
• Myth?: Canada’s High Educational Attainment _____________________________________________________________ 39
V. Participation ___________________________________________________________________________ 41
• Fact Check: Why Don’t the Numbers Agree? ________________________________________________________________ 41
• Myth: Participation in Post-Secondary Education in Canada is Continually Rising ______________________________ 42
Table of Contents

The Price of Knowledge: Access And sTudenT finAnce in cAnAdAii
VI. Access Gaps ___________________________________________________________________________ 45
Parental Income and Education ____________________________________________________________________________ 45
• Myth: The Continuous Post-Secondary Pathway ____________________________________________________________ 50
Aboriginal Peoples ________________________________________________________________________________________ 52
The Urban/Rural Divide ___________________________________________________________________________________ 54
Immigrants _______________________________________________________________________________________________ 55
• Myth: Participation Rates Are Always What They Seem ______________________________________________________ 57
VII. Conclusion ____________________________________________________________________________ 61
Chapter 3 — Persistence in Post-Secondary Education _________________________ 63
I. Introduction ___________________________________________________________________________ 65
II. Persistence Rates in Canada _____________________________________________________________ 67
Background ______________________________________________________________________________________________ 67
New Research ____________________________________________________________________________________________ 67
III. Who Leaves Post-Secondary Education and Why? _________________________________________ 73
• Myth: PSE Continuers “Get it Right” on Their First Try _______________________________________________________ 76
• International Data _______________________________________________________________________________________ 77
IV. Conclusion: The Need for Intervention and Evaluation _____________________________________ 79
• Millennium Pilot Projects ________________________________________________________________________________ 80
• Foundations for Success ____________________________________________________________________________ 80
• LE,NONET ________________________________________________________________________________________ 83
Chapter 4 — Paying for Post-Secondary Education _____________________________ 85
I. Introduction ___________________________________________________________________________ 87
II. Costs and Resources: An Overview ______________________________________________________ 89
III. Update on Costs _______________________________________________________________________ 93
Tuition ___________________________________________________________________________________________________ 93
• Is Net Tuition What Counts? _____________________________________________________________________________ 97
• Canadian Household Spending on Post-Secondary Tuition __________________________________________________ 98
Textbooks ________________________________________________________________________________________________ 99
Rent ____________________________________________________________________________________________________ 100
Transportation ___________________________________________________________________________________________ 102

iiiTable of ConTenTs
IV. Update on Resources __________________________________________________________________103
Employment ____________________________________________________________________________________________ 103
• A Recession Takes Hold _________________________________________________________________________________ 105
• Should Students Work? _________________________________________________________________________________ 108
Family Income and Savings _______________________________________________________________________________ 109
Family Income _____________________________________________________________________________________ 109
Family Savings _____________________________________________________________________________________ 111
Student Financial Assistance ______________________________________________________________________________ 113
Private Borrowing ________________________________________________________________________________________ 115
• Myth: Private Borrowing Costs Less ______________________________________________________________________ 116
V. How Under-Represented Students Make Ends Meet ______________________________________117
Low-Income Students ____________________________________________________________________________________ 117
Student Parents __________________________________________________________________________________________ 118
Aboriginal Students ______________________________________________________________________________________ 118
Students with Disabilities _________________________________________________________________________________ 120
VI. Conclusion ___________________________________________________________________________123
Chapter 5 — Getting to Post-Secondary Studies ______________________________ 125
I. Introduction __________________________________________________________________________127
II. Factors Explaining Participation in Post-Secondary Studies ________________________________129
Gaps Between Boys and Girls ______________________________________________________________________________ 130
Gaps Between Youth from Low- and High-Income Families ___________________________________________________ 132
• Does Money Matter More Than Ability? ___________________________________________________________________ 134
Gaps Between Youth from Different Regions of Canada ______________________________________________________ 136
• Post-Secondary “Intenders”: What Keeps Them Out of Higher Education? ____________________________________ 139
Gaps Between Aboriginal and Non-Aboriginal Youth _________________________________________________________ 140
• Minority Francophone Communities _____________________________________________________________________ 141
Summary _______________________________________________________________________________________________ 143
• The Importance of Employing Varied Methodologies _______________________________________________________ 144
III. The Role of Financial Assistance Policies in Access to Post-Secondary Studies _______________145
IV. Conclusion ___________________________________________________________________________147
Adopt a More Flexible Education System ___________________________________________________________________ 147
Make Sustained Use of Data _______________________________________________________________________________ 147
Implement Pilot Projects __________________________________________________________________________________ 148
• The Transitions and MESA Projects_______________________________________________________________________ 148
Conduct Systematic Evaluations of Projects and Programs ____________________________________________________ 148
Promote Engagement from the Entire Community ___________________________________________________________ 149

The Price of Knowledge: Access And sTudenT finAnce in cAnAdAiv
Chapter 6 — Student Financial Assistance in Canada: Past, Present and Future ____ 151
I. Introduction __________________________________________________________________________153
II. Need-Based Student Aid in Canada _____________________________________________________155
• How Much Does a Student Loan Cost? ____________________________________________________________________ 156
• Myth: Most Low-Income Students Rely on Student Financial Aid ____________________________________________ 159
• Institutional Financial Aid in Canada _____________________________________________________________________ 161
Provincial Trends ________________________________________________________________________________________ 161
• How Many Student Aid Recipients Are There? _____________________________________________________________ 163
III. Non-Need-Based Student Aid in Canada ________________________________________________165
IV. The Future: Modernizing Student Financial Assistance in Canada ___________________________167
• Principles for Reforming Student Aid _____________________________________________________________________ 168
• The Limits of What We Know ____________________________________________________________________________ 170
Reform the Form _________________________________________________________________________________________ 171
Start Early _______________________________________________________________________________________________ 172
Decouple Loans and Grants _______________________________________________________________________________ 173
Fully Fund Assessed Need _________________________________________________________________________________ 175
Don’t Ignore Student Debt ________________________________________________________________________________ 177
V. Conclusion ___________________________________________________________________________179
Chapter 7 — Student Debt in Canada _______________________________________ 181
I. Introduction __________________________________________________________________________183
II. University Student Debt in Canada ______________________________________________________185
Student Financial Aid Policy from 2000 to 2005: Controlling Student Debt ______________________________________ 186
Student Financial Aid Policy from 2005 to 2009: Expanding Need-Based Aid ____________________________________ 187
• Unmet Need in Canada _________________________________________________________________________________ 188
III. University Student Debt by Region ______________________________________________________191
Atlantic Canada __________________________________________________________________________________________ 191
Quebec _________________________________________________________________________________________________ 191
Ontario _________________________________________________________________________________________________ 192
The Prairies _____________________________________________________________________________________________ 192
British Columbia _________________________________________________________________________________________ 193
IV. College Student Debt in Canada ________________________________________________________195
Provincial Variation ______________________________________________________________________________________ 196
• Public and Private Debt in Canada _______________________________________________________________________ 197

vTable of ConTenTs
V. Life After School: Student Debt Beyond Post-Secondary Education _________________________199
Repayment ______________________________________________________________________________________________ 199
Student Debt in Context __________________________________________________________________________________ 200
Debt-to-Income Ratios and Repayment Assistance___________________________________________________________ 200
VI. Conclusion ___________________________________________________________________________203
After Millennium? ________________________________________________________________________________________ 204
Conclusion: From Research to Action ________________________________________ 207
Bibliography ______________________________________________________________ 213

The Price of Knowledge: Access And sTudenT finAnce in cAnAdAvi

vii
TablesTable 1.II.1 Unemployment Rate (2006) by Educational Attainment _______________________________________________ 9
Table 1.II.2 Earnings Premium Relative to a High School Graduate over 40 Years, by Province _______________________ 11
Table 2.IV.1 Educational Attainment in 2006, Age 25–64, by Province ______________________________________________ 38
Table 2.IV.2 Highest Level of Education Attained among 25- to 34-Year-Olds in 2006 and 26- to 28-Year-Olds in 2008 _____ 38
Table 2.IV.3 Educational Attainment in Select OECD Countries in 2006, by Age Group _______________________________ 40
Table 2.VI.1 Proportion of Non-Students Aged 22 to 24 Who Pursued Post-Secondary Education Immediately after
High School, by Parental Education and Aboriginal Status, in 2004 _____________________________________ 51
Table 2.VI.2 Educational Attainment of Aboriginal and Non-Aboriginal Peoples Aged 25–64 (2006) ___________________ 52
Table 2.VI.3 Post-Secondary Participation in Nova Scotia ________________________________________________________ 57
Table 2.VI.4 Quebec University Stream Participation among 18- to 24-Year-Olds in 2004 (2005 for CEGEP Students) ____ 59
Table 3.II.1 Change in Post-Secondary Education Status over Time _______________________________________________ 68
Table 3.II.2 Overall Persistence Rates of Young Adults in Post-Secondary Education in Canada ______________________ 70
Table 3.II.3 Cumulative Transition Rates After Two Years for Students Entering Atlantic PSE Institutions
(17- to 20-Year-Olds) _____________________________________________________________________________ 71
Table 3.II.4 First-Year Transition Rates in the Atlantic Region in YITS and PSIS _____________________________________ 72
Table 4.II.1 Consumer Price Index, 2002–2007, by Province ______________________________________________________ 89
Table 4.II.2 Breakdown of Student Costs, 2003–04 ______________________________________________________________ 90
Table 4.II.3 Sources of Financing for University Students, 2007 and 2009 __________________________________________ 90
Table 4.II.4 Sources of Financing for College Students, 2009 _____________________________________________________ 91
Table 4.III.1 Average Undergraduate University Tuition in Canada in Nominal Dollars by Province, 1997–98 to 2008–09 _____ 94
Table 4.III.2 Average Undergraduate University Tuition in Canada in 2008 Dollars by Province, 1997–98 to 2008–09 ________ 94
Table 4.III.3 Average College Tuition in Canada in Nominal Dollars by Province, 1997–98 to 2006–07 __________________ 95
Table 4.III.4 Average College Tuition in Canada in 2008 Dollars by Province, 1997–98 to 2006–07 _____________________ 95
Table 4.III.5 Percentage of Households Reporting Post-Secondary Tuition Expenditures, 2007 ________________________ 98
Table 4.III.6 Minimum, Maximum and Average Prices of First-Year University Compulsory Course Textbooks
by Discipline in 2008______________________________________________________________________________ 99
Table 4.III.7 Median Amount Spent on Materials and Textbooks at the Post-Secondary Level, Canada,
1997–2007 (Current Dollars) ______________________________________________________________________ 100
Table 4.III.8 Cost of Renting a One-Bedroom Apartment in Major Canadian Cities _________________________________ 101
Table 4.III.9 Cost of Monthly Public Transportation Passes for Full-Time Students in Major Canadian Cities
(2003–04 and 2008–09) ___________________________________________________________________________ 102
Table 4.IV.1 Minimum Wage by Province, 1997 to 2008 _________________________________________________________ 106
Table 4.IV.2 Percentage of University and College Tuition Earned by Students Working at Minimum Wage for the
Average Number of Hours During a Typical Academic Year __________________________________________ 107
Table 4.V.1 Proportion of Post-Secondary Students Who Had Received a Government Student Loan by Age 19 (2004) ___ 117
Table 4.V.2 Income Sources for Second-Year Students Who Received an Access Bursary in the Previous Year _________ 118
Table 4.V.3 Information on Borrowing among Graduates (by Gender and Marital Status) __________________________ 118
Tables and Figures

The Price of Knowledge: Access And sTudenT finAnce in cAnAdAviii
Table 4.V.4 Income Sources for Second-Year Students Who Received an Access Bursary in the Previous Year,
by Aboriginal Status _____________________________________________________________________________ 119
Table 4.V.5 Main Sources of Funding for LE,NONET Project Participants _________________________________________ 120
Table 4.V.6 Sources of Annual Income for Students with Disabilities (Mean Amounts) _____________________________ 122
Table 5.II.1 High School Dropout Rate among Youth Aged 20 to 24 in 2004–05 by Gender and Province of Residence ____ 130
Table 5.II.2 Distribution of High School Grades by Gender ______________________________________________________ 131
Table 5.II.3 Characteristics of Canadian Youth by Parental Income Quartile, at Age 15 _____________________________ 133
Table 5.II.4 Rates of Participation in Post-Secondary Studies by Urban/Rural Status _______________________________ 137
Table 5.II.5 Proportion of High School Completion and University Attainment Gaps Explained by Select Factors _____ 141
Table 5.II.6 Likelihood of Pursuing Post-Secondary Education in French _________________________________________ 142
Table 5.II.7 Perception of the Significance of Barriers to Pursuing Post-Secondary Education in French ______________ 143
Table 6.II.1 Change in Student Aid per Recipient Between the Periods 2001–02 to 2004–05 and 2005–06 to
2007–08 by Type of Aid and Province ______________________________________________________________ 162
Table 6.II.2 Average Student Aid per Recipient in 2007–08 by Type of Aid and Province ____________________________ 162
Table 6.IV.1 Incidence in Average Amount of Unmet Need in Select Provinces in 2006–07 __________________________ 176
Table 6.V.1 Vision of Student Aid in Canada After Suggested Changes Have Been Adopted _________________________ 180
Table 7.II.1 Undergraduate Student Debt at Graduation in Canada in 2000, 2003, 2005, 2006 and 2009 _______________ 185
Table 7.II.2 Undergraduate Student Debt at Graduation in Canada in 2000, 2003 and 2005 _________________________ 187
Table 7.II.3 Undergraduate Student Debt at Graduation in Canada in 2000, 2003, 2005 and 2006 ____________________ 187
Table 7.II.4 Undergraduate Student Debt at Graduation in Canada in 2000, 2003, 2005, 2006 and 2009 _______________ 189
FiguresFigure 1.I.1 Growth in Unemployment Rates of 25- to 34-Year-Olds, by Education, 1971–2005 (in Percentage Points) __ 7
Figure 1.II.1 Median 2005 Earnings for Full-Year, Full-Time Earners Age 25–64, by Education and by Region __________ 10
Figure 1.II.2 Earnings Premium Relative to a High School Graduate over 40 Years, by Region ________________________ 10
Figure 1.II.3 Median Earnings among Post-Secondary Graduates in Canada, by Level of Study and Year of
Graduation, 1995–2005 in Real 2007 Dollars ________________________________________________________ 12
Figure 1.II.4 Relative Change in College and University Attainment and in the Earnings Premium of College and
University Graduates in Canada, 1980–2000 ________________________________________________________ 13
Figure 1.II.5a Relative Change in University Attainment among Males and in the Earnings Premium of Male University
Graduates in Canada, 1980–2000 __________________________________________________________________ 14
Figure 1.II.5b Relative Change in University Attainment among Females and in the Earnings Premium of Female
University Graduates in Canada, 1980–2000 ________________________________________________________ 14
Figure 1.II.6a Relative Change in College Attainment among Males and in the Earnings Premium of Male College
Graduates in Canada, 1980–2000 __________________________________________________________________ 15
Figure 1.II.6b Relative Change in College Attainment among Females and in the Earnings Premium of Female
College Graduates in Canada, 1980–2000 __________________________________________________________ 15
Figure 1.II.7 Median Income among Aboriginal and Non-Aboriginal Individuals in 2005, by Level of Education _______ 16
Figure 1.III.1 Percentage of the Population and Share of Income Tax Paid and of Government Transfers Received
by Level of Education among Canadians Aged 25 to 64 in 2006 _______________________________________ 18
Figure 2.III.1 University and College Enrolment in Canada, 1992 to 2005 __________________________________________ 32
Figure 2.III.2 Percentage Change in Full-Time University Enrolment ______________________________________________ 33

ix
Figure 2.III.3 Annual Change in Undergraduate University Enrolment among 18- to 24-Year-Olds in Canada,
Ontario and Canada Outside Ontario, 1992–2005 ___________________________________________________ 34
Figure 2.III.4 College Enrolment in Canada, by Region, 1992–93 to 2005–06 ________________________________________ 34
Figure 2.III.5 Annual Change in Undergraduate University Enrolment among 18- to 24-Year-Olds in Canada,
Ontario and Canada Outside Ontario, and Annual Change in the Population of 18- to 24-Year-Olds
in Canada, 1992–2005 ___________________________________________________________________________ 35
Figure 2.III.6 Annual Change in University and College Enrolment and the 18- to 24-Year-Old Population, 1992–2005 ____ 36
Figure 2.V.1 Post-Secondary Participation Rate among 18- to 24-Year-Olds in Canada by Province, 1993–2006 ________ 43
Figure 2.V.2 University Participation Rate among 18- to 24-Year-Olds in Canada by Province, 1993–2006 _____________ 43
Figure 2.V.3 College Participation Rate among 18- to 24-Year-Olds in Canada by Province, 1993–2006 _______________ 44
Figure 2.VI.1 Post-Secondary Status of Canadian 19-Year-Olds in 2003, by Family Income Quartile Measured at Age 15 ____ 45
Figure 2.VI.2 University, College and Post-Secondary Participation Rate among 18- to 24-Year-Olds in Canada,
1993 to 2006 ____________________________________________________________________________________ 46
Figure 2.VI.3 Post-Secondary Participation Rate by Select Family Income Levels among 18- to 24-Year-Olds, 1993–2006 ____ 47
Figure 2.VI.4 Post-Secondary Participation Rate by Parental Education among 18- to 24-Year-Olds, 1993–2006 __________ 47
Figure 2.VI.5 University Participation Rate by Family Income among 18- to 24-Year-Olds, 1993–2006 _________________ 48
Figure 2.VI.6 Ratio of University Participation among 18- to 24-Year-Olds from Families Earning More than $100,000
per Year to University Participation among Those from Families Earning Less Than $25,000 per Year,
1993–2006 ______________________________________________________________________________________ 48
Figure 2.VI.7 College Participation Rate by Family Income among 18- to 24-Year-Olds, 1993–2006 ___________________ 49
Figure 2.VI.8 Conditional College Participation Rate by Family Income among 18- to 24-Year-Olds, 1993–2006 ________ 49
Figure 2.VI.9 Proportion of Population with a University Degree, by Age Group ____________________________________ 53
Figure 2.VI.10 Proportion of Population with a Post-Secondary Credential, by Age Group ____________________________ 53
Figure 2.VI.11 Proportion of Population without a High School Degree, by Age Group _______________________________ 54
Figure 2.VI.12 Post-Secondary Participation by Urban/Rural Status at Age 21 _______________________________________ 54
Figure 2.VI.13 Post-Secondary Participation among Non-Immigrants and Second-Generation Immigrants to
Canada by Age 21, by Region of Origin _____________________________________________________________ 56
Figure 3.III.1 Percentage of Post-Secondary Students Aged 24 to 26 Who Discontinued Their Original Post-Secondary
Stream by Grade Average in High School __________________________________________________________ 73
Figure 3.III.2 Percentage of Post-Secondary Students Who Have Discontinued Their Studies (by Age Group
and Aboriginal Status) ___________________________________________________________________________ 75
Figure 3.III.3 Proportion of Students Who Enter a Tertiary Program and Leave Without at Least a First Tertiary
Degree (2005) ___________________________________________________________________________________ 77
Figure 3.IV.1 Foundations for Success: Grade Point Average By Program Group ____________________________________ 82
Figure 3.IV.2 Foundations for Success: Year 1 to Year 2 Retention Rates By Program Group __________________________ 82
Figure 4.III.1 College and University Tuition, 2006–07 ___________________________________________________________ 93
Figure 4.III.2 Average Amount Spent on Tuition by Households Incurring Post-Secondary Tuition Expenditures, 2007 _____ 98
Figure 4.IV.1 Average Employment Rate among 20- to 24-Year-Old Full-Time Students, September–April and
May–August, 1997–98 to 2008–09 ________________________________________________________________ 103
Figure 4.IV.2 Average Employment Rate among 20- to 24-Year-Old Full-Time Students, September–April,
1997–98 to 2008–09 _____________________________________________________________________________ 104
Figure 4.IV.3 Average Employment Rate among 20- to 24-Year-Old Full-Time Students, May–August, 1997–98
to 2008–09 _____________________________________________________________________________________ 104
Figure 4.IV.4 Employment Rate for the Month of June among 20- to 24-Year-Old Full-Time Students,
15- to 16-Year-Olds and 17- to 19-Year-Olds, 1997–98 to 2008–09 ____________________________________ 105
Tables and figures

The Price of Knowledge: Access And sTudenT finAnce in cAnAdAx
Figure 4.IV.5 Number of Hours Worked at Minimum Wage and Number of 18-Hour Work-Weeks Required to Pay
One Year’s University Tuition in Canada in 2008–09, by Province _____________________________________ 107
Figure 4.IV.6 Average Undergraduate University Tuition as a Proportion of Median After-Tax Income
(Non-Elderly Families) ___________________________________________________________________________ 110
Figure 4.IV.7 Undergraduate University Tuition as a Proportion of Average After-Tax Income (Economic Families),
by Income Quintile ______________________________________________________________________________ 111
Figure 4.IV.8 Allocation by Household of Each Dollar of Personal Income Received _________________________________ 111
Figure 4.IV.9 Change in University Tuition, Education Tax Credits, Need-Based Student Financial Aid per
Recipient and Consumer Price Index in Canada, 1997–98 to 2006–07 (1997–98 = 100) ___________________ 113
Figure 4.IV.10 Change in College Tuition, Educational Tax Credits, Need-Based Student Financial Aid per
Recipient and Consumer Price Index in Canada, 1997–98 to 2006–07 (1997–98 = 100) ___________________ 114
Figure 4.IV.11 University and College Tuition as a Share of Need-Based Student Financial Aid per Recipient in
Canada, 1997–98 to 2006–07 ______________________________________________________________________ 114
Figure 4.V.1 Types of Aids and Services Used by Students with Disabilities ________________________________________ 120
Figure 4.V.2 Reasons for Not Accessing Aids and Services _______________________________________________________ 121
Figure 4.V.3 Sources of Income for Students with Disabilities ____________________________________________________ 121
Figure 5.II.1 Post-Secondary Participation Rate among Those Aged 18 to 24 by Gender, 1993–2006 ___________________ 130
Figure 5.II.2 Trend in Family Income According to the Child’s Eventual Education Status in 2004–05 (at age 18–21) ____ 132
Figure 5.II.3 Participation Rate among Youth in the Lowest PISA Score Quartile by Family Income ___________________ 134
Figure 5.II.4 Participation Rate among Youth in the Highest PISA Score Quartile by Family Income __________________ 135
Figure 5.II.5 Participation in Post-Secondary Education by PISA Score and Family Income __________________________ 135
Figure 5.II.6 Predicted Probability of University Participation by Overall High School Grade in Nova Scotia and Ontario ____ 136
Figure 5.II.7 Predicted Probability of University Participation by Overall High School Grade in Quebec and Ontario _______ 136
Figure 5.II.8 Predicted Probability of University Participation by Family Income in Nova Scotia and Ontario ______________ 137
Figure 5.II.9 Predicted Probability of University Participation by Family Income in Quebec and Ontario _________________ 137
Figure 5.II.10 Rates of Post-Secondary Participation by Region and Urban/Rural Status ______________________________ 138
Figure 5.II.11 University Attainment by Region and Urban/Rural Status ____________________________________________ 138
Figure 5.II.12 Educational Status at Age 21 by Aboriginal Status ___________________________________________________ 140
Figure 6.II.1 Total Student Financial Aid in Canada by Type of Aid, 1993–94 to 2007–08 _____________________________ 157
Figure 6.II.2 Total Need-Based Student Financial Aid per Recipient in Canada by Type of Aid, 1993–94 to 2007–08 _____ 157
Figure 6.II.3 Aggregate and Per-Recipient Need-Based Student Financial Aid in Canada by Type of Aid,
1993–94 to 2007–08 ______________________________________________________________________________ 158
Figure 6.II.4 Proportion of Need-Based Aid That Is Non-Repayable in Canada, 1993–94 to 2007–08 __________________ 158
Figure 6.II.5 Student Loan Take-Up among College and University Students by Parental Income ____________________ 159
Figure 6.II.6 Student Loan Take-Up among College and University Students by Parental Income ____________________ 160
Figure 7.II.1 University Student Debt in Canada from 1990 to 2009 in Nominal and Real 2009 Dollars ________________ 190
Figure 7.III.1 Incidence and Amount of Student Debt in Canada among Bachelor’s Degree Graduates with Debt
from 2000 to 2005 in Real 2005 Dollars, by Province _________________________________________________ 193
Figure 7.III.2 Incidence of Student Debt in Canada among Bachelor’s Degree Graduates from 2000 to 2009, by Province ____ 194
Figure 7.III.3 Average Amount of Student Debt in Canada among Bachelor’s Degree Graduates with Debt from
2000 to 2009, by Province ________________________________________________________________________ 194
Figure 7.IV.1 College Student Debt in Canada in 2009 ___________________________________________________________ 195
Figure 7.IV.2 College Student Debt in Canada in 2003–2006 and 2009 _____________________________________________ 196
Figure 7.V.1 Student Debt Repayment among the Class of 2005 __________________________________________________ 199

This volume would not have been possible without
the assistance of many important individuals across
Canada. We would like to acknowledge the people
mentioned below for their contribution both to this
book and to research on access to post-secondary
education in Canada.
Thanks to Dawn Gordon at the Maritime Provinces
Higher Education Commission, whose presentation
on measures of participation rate trends at the 2008
Canadian Institutional Research and Planning Asso-
ciation Conference (and subsequent report) helped
inform our approach to Chapter 2. Similarly, we are
grateful to Kathryn McMullen at Statistics Canada for
organizing the preparation of custom participation
rate tabulations. Thanks also to Herb O’Heron at the
Association of Universities and Colleges of Canada for
helping to put this and other data in perspective.
We would like to acknowledge the assistance and
support of our colleagues Marc Frenette and Klarka
Zeman at Statistics Canada and Tomasz Gluszynski at
Human Resources and Skills Development Canada.
Thanks to Ross Finnie of the University of Ottawa
and Hanqing Theresa Qiu of Statistics Canada, with
whom we have had the good fortune to collaborate,
principally through the Measuring the Effectiveness
of Student Aid (MESA) project. The research conducted
by these individuals, chiefly through the examination
of data from the Youth in Transition Survey, has pro-
vided considerable and badly needed empirical data to
those who seek to make policy decisions on the basis of
rigorous, reliable information.
We would like to thank Anna Toneguzzo and Anne
Brazeau-Monnet at the Association of Canadian
Community Colleges and Dan Pletzer and the mem-
bers of the Canadian University Survey Consortium
for their commitment to student data collection.
Without their efforts, Canadians would not have
access to timely and reliable data on patterns of
student finance and debt.
When confronted with circles we cannot square,
we are fortunate to be able to turn to Saul Schwartz
of Carleton University, Torben Drewes of Trent Uni-
versity and Fiona Deller of the Higher Education
Quality Council of Ontario. We are grateful for their
breadth of knowledge, precise insights, genuine
enthusiasm and good-humoured nature.
Thanks to Alex Usher and Ryan Dunn at the
Higher Education Strategy Associates for their help.
Ryan was instrumental in collecting and compiling
the most recent data on government support for stu-
dents. Alex, along with our former colleague Sean
Junor, provided the initial vision for a Canadian
research project on access to post-secondary edu-
cation in Canada. We are pleased to have had the
opportunity to continue the series they founded.
We are grateful to our colleagues in Canada’s pro-
vincial and federal governments working on access to
post-secondary education and student financial aid. In
particular, we would like to acknowledge the support
and insight of Tom Glenwright of Manitoba Student
Aid. We also thank the Government of Canada for
imposing a deadline that, this time, we could not miss.
We offer a heartfelt note of appreciation to our
fellow travellers at the Canada Millennium Scholar-
ship Foundation. Thanks, first, to the members of our
research team: Noel Baldwin, Jocelyn Charron, Yves
Pelletier and David Simmonds. Their support,
through critical feedback and leadership by example,
has proven invaluable. Thanks especially to Noel
Baldwin for joining the team of chapter authors. Anne
Blain’s contribution in keeping us all on track with
consistent good humour is also very much appre-
ciated. Thanks to Diana Wickham and Andrew
Woodall for their feedback throughout our writing
process. We could not have produced this report or
any other without the dedication, talent and patience
of our English and French communications advisors,
xi
Acknowledgements

Jaime Frederick and Laurent Joyal. Thanks to our
English-language editor David Dalgleish and our
design and layout team at Charlton and Company. We
would also like to emphasize how much we had
looked forward to but missed the contribution of our
friend and other editor, Peter Cowan. Peter became
too ill to work as we began production of the book
and sadly passed away just as we were completing
it. We hope that he would have liked what we ended
up writing, even if he would surely have found it
too wordy. We are grateful for our two research
assistants Christine Baillargeon and Patrick Nolin.
We would like to acknowledge the support provided
to the Foundation’s research program by its board
of directors and board of members, who embraced
our work as a core expression of the Foundation’s
mandate to improve access to post-secondary edu-
cation in Canada.
Finally, our sincere thanks to Norman Riddell, the
Foundation’s executive director and CEO. Norman
undertook the challenge of coupling the Foundation’s
financial aid programs with a research agenda that
could improve the design and implementation of
public policies on access to higher education in
Canada. As colleagues, friends and members of the
post-secondary access community in Canada, we
are deeply grateful to Norman for enabling and
supporting this work.
While these individuals (along with some of the
finest coffee beans in Montreal) have contributed
immensely to our work, any and all errors belong to
the authors.
JB, AM, AP
Montreal, October 2009
The Price of Knowledge : Access And sTudenT finAnce in cAnAdAxii

There is currently no shortage of debate about post-
secondary education policy in Canada. This reflects
widespread agreement regarding the importance
of skills, knowledge and innovation in a modern
economy and society. As the respective heads of two of
the country’s leading academic and business organi-
zations have put it: “Ensuring our country’s long-term
economic growth and continued prosperity—and
realizing this country’s promise—will depend heavily
on the education and skill levels of Canadians and
their success in creating and applying ideas and
knowledge” (Beatty and Morris, 2008).
Many of those involved in this debate have drawn
attention to what they call the “innovation deficit”
stemming from a lack of adequate investment in both
business and higher education research and develop-
ment (Munroe-Blum and MacKinnon, 2009). This
has led Canada’s universities to call for the federal
government to “significantly increase investments in
university research through key granting agencies’
programs” (Association of Universities and Colleges
of Canada, 2009), while Canada’s colleges and insti-
tutes of technology have called for more investment
in applied research in order to assist with the final
stages of commercialization of new ideas, techno-
logies and processes (Polytechnics Canada, 2009).
As everyone knows, however, research requires
people to produce and make use of it—people with
skills, education and aspirations. Innovation requires
innovators. This means we need to consider whether
we can become better at providing higher education
opportunities that will allow Canadians to acquire
the education and training they need to succeed in
our modern economy and society.
The issue of access and student success is the
central concern of this, the fourth edition of The Price
of Knowledge. As we argued in the previous edition
(Berger, Motte and Parkin, 2007), Canada is a society
in which every year a growing share of the popu-
lation—children and seniors—must be supported by
a shrinking proportion of workers. This is occurring
at a time when the requirements of both employees
and citizens continue to evolve: work and civic
life are becoming more complex, more driven by
technology and more focused on the manipulation
of information.
Under these circumstances, the way forward is
clear: in order for Canada to maintain its prosperity
and quality of life, more and more Canadians need to
benefit from opportunities in higher education.
Since many of those from relatively advantaged
backgrounds already attend college and university,
this means that we must raise the participation rates
of those currently least likely to attend. Given the
multiple and inter-connected obstacles to educational
success that such students (or prospective students)
typically face, this is no easy task. It requires a compre-
hensive and well thought out set of policy interventions
delivered by actors and agencies working in all sectors
of society.
With this as our starting point, we have structured
the book as follows:
In Chapter 1, we review the data on the benefits of
post-secondary education, particularly in terms of
employment and earnings. While many economists
are familiar with the data we present, too many
public commentators choose to overlook them as
they express skepticism about whether we really
need more post-secondary graduates. We urge those
who worry that bringing more students into our
colleges and universities will diminish the quality of
education these institutions provide to reconsider
the notion that opportunity and excellence must lie
at opposite ends of the spectrum. By reaching out to
under-represented groups of students before and
during their post-secondary studies, we can ensure
that they are prepared and motivated to achieve
success.
Having established the benefits of post-secondary
education, in Chapter 2 we move on to explore trends
in post-secondary participation. Many of the indi-
cators are encouraging; for instance, four out of five
young Canadians access some form of education or
training after high school by the time they reach their
1
Introduction

The Price of Knowledge: Access And sTudenT finAnce in cAnAdA2
late 20s. Yet there are still areas of concern, the main
one being the continued prevalence of gaps between
the participation and attainment rates of different
groups of students. Stubbornly persistent gaps remain
between high- and low-income youth, urban and
rural youth, Aboriginal and non-Aboriginal youth
and youth whose parents obtained a post-secondary
credential and those whose parents did not. These
access gaps point to the complexity of the different
obstacles to educational success faced by under-
represented groups of students.
Chapter 3 presents the latest research on persis-
tence in post-secondary education in Canada. We are
now able to explore this topic in detail as a result of
new longitudinal survey data and the focused efforts of
researchers to exploit them. The picture that emerges
is mixed: persistence rates are perhaps better than had
been assumed, but at the same time, a significant
minority of students discontinue their studies, while
many of those who remain enrolled do not graduate
on time. Fortunately, more evidence is becoming
available about the types of strategies that might be
effective in ensuring that students at risk of dropping
out of college or university are in fact able to achieve
success.
Students who participate in post-secondary edu-
cation must of course find some way to pay for it.
Chapter 4 reviews the changes that have occurred
in the costs faced by students and the financial
resources available to them. The evidence shows
that on the whole, costs have been increasing at a
faster rate than inflation and, at least in the case of
those from lower-income families, at a rate that has
outpaced changes in available resources. Students
can choose to make up funding shortfalls by working
more while in school, but there is evidence that this
may negatively affect their academic performance.
The fact that the evidence presented in this chapter
predates the 2008–09 recession adds to our concern
and underlines the importance of modernizing stu-
dent financial assistance programs along the lines
suggested in later chapters.
Financial obstacles represent only one of the
challenges students face. The findings presented in
Chapter 5 clearly show that no single factor explains
why certain students are able to access post-secondary
education while others are not. We explore the rea-
sons why particular groups of interest, be they those
from low-income families, those from rural areas of
the country, those who are Aboriginal, those from
francophone minority communities, etc., must all be
taken into account in the formation and delivery
of educational policies. Moreover, we outline why
factors that are highly relevant for some groups of
students are less relevant for others.
As always, one of the principal areas of interest
in the context of this volume is student financial
assistance policy. Chapter 6 first updates the data on
trends in government spending on financial support
for students, showing how in recent years both the
total amount of need-based aid and the proportion
of this aid that is non-repayable have been increasing.
These are positive developments, but it is possible to
go much further by modernizing the overall system
of financial aid in Canada. In the second part of
the chapter, we put forward several proposals for
modernization, with the goal being to arrive at a
system that: puts the interests of students first; sends
an early message to students that there will be
financial support available to help them meet their
educational goals; targets those who need student
aid the most with the right kinds and amounts of aid;
acknowledges that financial aid alone is not enough
to enable some students to reach their goals; and is
flexible, accountable and transparent.
Finally, we revisit the issue of student debt in
Chapter 7. We chart how federal and provincial ini-
tiatives in this decade have succeeded in moderating
the increase of student debt; in fact, in the period
following 2000, student debt levels declined. In the
most recent period, however, student debt has edged
upwards, a trend which needs to be monitored
closely as the effects of the significant program
changes that are now occurring—not to mention the
recent economic downturn—begin to be felt.
This book ends with the inevitable plea for more
research, but with an even stronger plea that the
research conducted to date guide actions taken to
improve student access and success. Our under-
standing of the factors affecting the pathways that
students do or do not take has increased steadily
over the last decade. This understanding underpins

3inTroduCTion
our conclusion that the time has never been better
for partners in all sectors—inside and outside gov-
ernments, inside and outside schools, on and off
campuses—to work together to implement a com-
prehensive strategy that will better prepare and
motivate students before they reach post-secondary
education, provide more effective student financial
assistance programs for those who need them and
make improved support programs available to stu-
dents once they have enrolled in post-secondary
education.
In 2000, the year in which the Canada Millennium
Scholarship Foundation began distributing awards,
policy-makers had relatively little Canadian research
on access to guide their thinking. Now, almost ten
years later, we believe that everyone associated with
the Foundation, including its partners in both
research projects and program delivery, can take
some pride in the knowledge that, as well as pro-
viding students with $3.2 billion in financial support,
we are leaving behind a wealth of knowledge that we
hope will inform policy for years to come.

The Price of Knowledge: Access And sTudenT finAnce in cAnAdA4

The Value of a Degree: Education, Employment and Earnings in CanadaJoseph Berger and Andrew Parkin
The Price of KnowledgeAccess and Student Finance in Canada
1

7
Access to post-secondary education matters.
This chapter presents data that underpin the
importance of widening access to post-secondary
education in Canada.
It demonstrates that the relationship between em-
ployment, earnings and higher education remains
clear: post-secondary graduates are more likely to be
employed, and they earn more than those who did
not continue their studies past high school.
For this reason, they are the strongest contributors
to the tax revenues that sustain the key programs and
services provided by governments.
This information needs to be highlighted in
order to challenge assertions that there is already
too much pressure on young Canadians to pursue
post-secondary education and that access should be
restricted so as not to dilute the market value of a
degree. These assertions notwithstanding, the data
show that while the number of post-secondary
graduates has grown in recent years, the benefits of
a degree in terms of more stable employment
and higher earnings have not diminished.
To take but one initial example, the gap between
the unemployment rates of young Canadians with
higher and lower levels of education has widened
over the past 35 years. The unemployment rates of
young men without a high school education grew by
seven percentage points between 1971 and 2005,
compared with an increase of less than one point for
those with a university degree. The unemployment
rate for young women without a high school diploma
grew three times as much over the same period
as that of young university-educated women (see
Figure 1.I.1). As we will see below, a similar trend is
evident in the case of earnings.
The benefits of a post-secondary education in
terms of the labour market outcomes of indivi-
duals are only one reason why access matters. In the
previous edition of The Price of Knowledge (Berger,
Motte and Parkin, 2007) we featured another reason,
arguing that Canada’s changing demography means
that the number of young adults within the popu-
lation as a whole will soon begin to decline.
Consequently, if participation in post-secondary
education is not widened, the number of college
and university graduates in Canada will decline too.
Finishing the next decade with fewer post-secondary
graduates is not an encouraging prospect for a
country as dependent on human capital as Canada.
Chapter 1
I. Introduction
Figure 1.I.1 — Growth in Unemployment Rates of 25- to 34-Year-Olds, by Education, 1971–2005 (in Percentage Points)
Figure 1.II.3 — Median Earnings among Post-Secondary Graduates in Canada, by Level of Study and Year of Graduation, 1995–2005 in Real 2007 Dollars
Figure 1.II.7 — Median Income among Aboriginal and Non-Aboriginal Individuals in 2005, by Level of Education
Figure 1.II.1 — Median 2005 Earnings for Full-Year, Full-Time Earners Age 25–64, by Education and by Region
Figure 1.II.2 — Earnings Premium Relative to a High School Graduate over 40 Years, by Region
Figure 1.II.4 — Relative Change in College and University Attainment and in the Earnings Premium of College andUniversity Graduates in Canada, 1980–2000
Figure 1.II.6a — Relative Change in College Attainment among Males and in the Earnings Premium of Male College Graduates in Canada, 1980–2000
Figure 1.II.6b — Relative Change in College Attainment among Females and in the Earnings Premium of FemaleCollege Graduates in Canada, 1980–2000
Figure 1.II.5b — Relative Change in University Attainment among Females and in the Earnings Premium of FemaleUniversity Graduates in Canada, 1980–2000
Figure 1.II.5a — Relative Change in University Attainment among Males and in the Earnings Premium of MaleUniversity Graduates in Canada, 1980–2000
0%
1%
2%
3%
4%
5%
6%
7%
8%
Less than high schoolHigh school / trades certificate or diplomaSome post-secondaryUniversity degree
7.0%
3.1%
1.8%0.8%
Men
5.8%
2.2%1.8% 1.9%
Women
$0
$10,000
$20,000
$30,000
$40,000
$50,000
$60,000
$70,000
199520002005
$32,
554
$35,
013
$35,
000
College
$40,
534
$43,
766
$45,
000
Bachelor
$59,
535
$58,
354
$60,
000
Master
$59,
535
$62,
955
$65,
000
Doctorate
$0
$10,000
$20,000
$30,000
$40,000
$50,000
$60,000
$70,000
$80,000
WestOntarioQuebecEastCanadian Average
Less thanhigh school
Highschool
Trades orapprenticeship
College Universitybelow bachelor
Bachelor Post-bachelor
$32,029 $37,403$39,996
$42,937 $47,253
$56,048
$66,535
$0
$200,000
$400,000
$600,000
$800,000
$1,000,000
$1,200,000
$1,400,000WestOntarioQuebecEastCanadian Average
Trades orapprenticeship
College Universitybelow bachelor
Bachelor Post-bachelor
$103,720
$394,000
$745,800
$1,165,280
$221,360
90
95
100
105
110
115
120
125
130
135
140
Earnings Premium of College Diploma and University Degree RecipientsCollege Diploma and University Degree Attainment
1980 1985 1990 1995 2000
$0
$10,000
$20,000
$30,000
$40,000
$50,000
$60,000
AboriginalNon-Aboriginal
Certificate ordiploma belowbachelor level
Bachelor’sdegree
University certificate,diploma or degree
above bachelor level
90
100
110
120
130
140
150
160
170
180
1980 1985 1990 1995 2000
College Premium — MalesCollege Attainment Rate — Males
College Premium — FemalesCollege Attainment Rate — Females
Bachelor's Degree Premium — FemalesUniversity Attainment Rate — Females
90
100
110
120
130
140
150
160Bachelor’s Degree Premium — MalesUniversity Attainment Rate — Males
1980 1985 1990 1995 2000
90
100
110
120
130
140
150
160
1980 1985 1990 1995 2000
90
100
110
120
130
140
150
160
1980 1985 1990 1995 2000
$16,
025
$38,
260
$44,
801
$23,
161 $4
0,39
5
$51,
301
Figure 1.III.1 — Percentage of the Population and Share of Income Tax Paid and of Government Transfers Received by Level of Education among Canadians Aged 25 to 64 in 2006
0%
5%
10%
15%
20%
25%
30%
35%
40%
45%
Percentage of the populationShare of government transfers receivedShare of income tax paid
Less ThanHigh School
Diploma
ObtainedHigh School
Diploma
SomePost-Secondary(No Certificate)
Non-UniversityPost-Secondary
Certificate
UniversityCertificate
23%
14%
6%
15% 15%
11% 11%10%8%
31% 31%28%
22%
41%
14%
Source: Morissette and Hou, 2006.

Not everyone welcomed our argument: some
preferred to talk about the “myth” of declining enrol-
ment (Charbonneau, 2007; cf. Berger, 2008a). Yet the
most recent figures1 confirm that full-time university
enrolment is already declining in four provinces and
is growing noticeably in only two. At the college level,
enrolment growth levelled off in the early years of this
decade before experiencing its first decline in over
10 years between 2004 and 2005. If anything, then, our
demographic argument is more pertinent than ever.
In this chapter, however, we shift focus somewhat
to examine how widening access to higher education
pays dividends through greater opportunities for
those joining the workforce.
As many before us have emphasized, few if any
investments an individual makes will produce as
much of a return as higher education. The evidence
about the positive returns to post-secondary edu-
cation is so well-known that it seems unnecessary
to review it again.
Unfortunately, not all commentators with access
to the media are inclined to base their arguments on
evidence. There have been a series of recent sugges-
tions that somehow we have too many students in
Canada, not too few. Some wonder whether a higher
education is really worth what people think it is, given
that it has become so commonplace. Sociologists
James Côté and Anton Allahar, for example, speak of
an “oversupply of higher degrees” that has resulted in
“lost market value” for credentials (Côté and Allahar,
2007, 177). Others lament the fact that many students,
at least at the university level, are woefully under-
prepared or unmotivated and so really shouldn’t be
there at all. Taken together, these reflections lead
some to wonder whether we are doing young people
a disservice by suggesting that a post-secondary edu-
cation is more important to their future than ever
before. As The Globe and Mail’s Margaret Wente puts
it, “Everybody knows that these days, you are doomed
unless you go to university. Otherwise, you won’t cut
it in the knowledge economy… But maybe the real
problem is something else entirely. Maybe it’s not that
too few kids go to university, but too many” (Wente,
2008, A23).
To counter this recurring myth—that post-
secondary education is overvalued—we provide an
update on the data on the benefits of a college diploma
or university degree, showing that the earnings of
post-secondary graduates increased above the rate of
inflation between 2000 and 2007. We demonstrate
that the earnings premium, which captures the
relative difference between individuals with higher
and lower levels of education, has continued to
increase since 1980. This has occurred during a
time of significant growth in the population of post-
secondary graduates in Canada. The value of a
post-secondary credential has increased at a faster
pace than the share of the population completing
some form of higher education; in other words,
degrees have grown more valuable even as they have
become less scarce. Finally, we demonstrate that the
benefits of post-secondary education accrue both to
the individual and to Canadian society at large.
None of this means any concern about falling
standards within universities and colleges in the age
of “mass” post-secondary education is misplaced.
The remedy for what may ail the ivory tower, however,
should not be to once again restrict access to the elite,
as some have suggested (Malick, 2009; Dehaas, 2009).
If we want to ensure that standards are maintained
(or, better, raised), then we should be thinking about
how access to higher education in Canada can be
combined with excellence within the sector. This
will require changes in how faculty and staff at
post-secondary institutions relate to both current
and prospective students.
In the end, our argument is this: it is not the
widening of access itself that threatens the quality of
post-secondary education, but rather the question-
able thinking that leads some to believe that our
society must choose between these two goals—
that we can pursue either access or excellence but
not both.
The Price of Knowledge: Access And sTudenT finAnce in cAnAdA8
1. These figures are presented in Chapter 2.

The latest census data illustrate the link between
post-secondary education and more stable employ-
ment. Canadian workers without a high school
diploma are two and a half times more likely to be
unemployed than are those with a bachelor’s degree
(see Table 1.II.1). In the case of Aboriginal Peoples,
the ratio rises to three and a half times. Moreover
those with lower levels of education are more
likely to be among the chronically unemployed
(Brooks, 2005). The 2006 census also confirmed that
“higher education is a gateway to higher earnings”
(Statistics Canada, 2008a, 17).
In terms of earnings, the benefits of higher edu-
cation are often expressed in two ways. The first
calculates the earnings premium, or the difference
in median earnings among groups of individuals
with different levels of education. The university
earnings premium, for example, is often expressed
as the average difference in earnings between uni-
versity and high school graduates. The second
calculates a rate of return on an investment. This
takes into account the costs of post-secondary edu-
cation and is expressed as the earnings premium
divided by the actual and opportunity costs of post-
secondary education (including, for example, tuition,
fees, books and forgone income while in school).
First, we will consider the earnings premium.
According to the 2006 census, while the median
annual earnings of a high school dropout are 15 per-
cent lower than those of a high school graduate,
those with a college diploma earn almost 15 percent
more and those with a bachelor’s degree earn almost
50 percent more. In 2005, a bachelor’s degree holder
earned $18,000 more per year than a high school
graduate; a university graduate with a post-bachelor’s
degree earned $29,000 more than a high school gradu-
ate. As Figure 1.II.1 demonstrates, median earnings
increase with education in all parts of the country.
Even recent demand for low-skill jobs in Western
Canada underlines the benefits of higher education.
According to Chung (2006), young men with rela-
tively low levels of education experienced an increase
in earnings during the beginning of this decade,
owing to the strong resource-based economy in
Western Canada. That said, their earnings were
lower than those of young men with low levels of
education in 1980, and the earnings gap between
them and more highly educated men remains.
The premium associated with a post-secondary edu-
cation thus reflects both its own value in the labour
market and the declining value of a high school
diploma (even once the effects of regional resource
booms are taken into account).
9
Chapter 1
II. The Earnings Premium
Table 1.II.1 — Unemployment Rate (2006) by Educational Attainment
Total Male Female Aboriginal
No high school certificate
11.1 10.8 11.5 22.5
High school certificate of equivalent
7.3 7.2 7.3 12.8
Apprenticeship or trades certificate or diploma
6.2 6.1 6.3 13.9
College / CEGEP certificate or diploma
5.0 4.9 5.0 9.9
University certificate or diploma at bachelor’s level or above
4.5 4.1 5.0 6.4
Source: Statistics Canada, 2006 census.

While the difference in income by level of
education is substantial for any one given year,
the effect over the course of a lifetime is remarkable
(see Figure 1.II.2 and Table 1.II.2) As Figure 1.II.2
demonstrates, over the course of 40 years, a college
graduate will earn $394,000 more than a high school
graduate. A bachelor’s degree holder will earn a pre-
mium of $745,800 over the course of 40 years.
Statistics Canada points out that figures such as
these underestimate the real earnings differences
between workers with higher and lower levels of
education because they compare only those employed
on a full-time basis. As we have seen, those with less
education are more likely to be unemployed and
therefore to have no earnings at all, something which
the earnings amounts reported here do not take into
account (Statistics Canada, 2008a, 18).
The Price of Knowledge: Access And sTudenT finAnce in cAnAdA10
2. Note: This figure multiplies the average annual earnings premium among 25- to 64-year-olds in 2006 by 40, approximating an individual’s life in the labour force. As a result, it does not take into account the expectation that individuals with lower levels of education will work more years (because a high school graduate will enter the labour force at an earlier age than a post-secondary graduate, perhaps 10 or more years earlier than a Ph.D holder, and also because individuals with higher annual earnings may be able to retire earlier and live off savings growing from the annual earnings premium).
Figure 1.I.1 — Growth in Unemployment Rates of 25- to 34-Year-Olds, by Education, 1971–2005 (in Percentage Points)
Figure 1.II.3 — Median Earnings among Post-Secondary Graduates in Canada, by Level of Study and Year of Graduation, 1995–2005 in Real 2007 Dollars
Figure 1.II.7 — Median Income among Aboriginal and Non-Aboriginal Individuals in 2005, by Level of Education
Figure 1.II.1 — Median 2005 Earnings for Full-Year, Full-Time Earners Age 25–64, by Education and by Region
Figure 1.II.2 — Earnings Premium Relative to a High School Graduate over 40 Years, by Region
Figure 1.II.4 — Relative Change in College and University Attainment and in the Earnings Premium of College andUniversity Graduates in Canada, 1980–2000
Figure 1.II.6a — Relative Change in College Attainment among Males and in the Earnings Premium of Male College Graduates in Canada, 1980–2000
Figure 1.II.6b — Relative Change in College Attainment among Females and in the Earnings Premium of FemaleCollege Graduates in Canada, 1980–2000
Figure 1.II.5b — Relative Change in University Attainment among Females and in the Earnings Premium of FemaleUniversity Graduates in Canada, 1980–2000
Figure 1.II.5a — Relative Change in University Attainment among Males and in the Earnings Premium of MaleUniversity Graduates in Canada, 1980–2000
0%
1%
2%
3%
4%
5%
6%
7%
8%
Less than high schoolHigh school / trades certificate or diplomaSome post-secondaryUniversity degree
7.0%
3.1%
1.8%0.8%
Men
5.8%
2.2%1.8% 1.9%
Women
$0
$10,000
$20,000
$30,000
$40,000
$50,000
$60,000
$70,000
199520002005
$32,
554
$35,
013
$35,
000
College
$40,
534
$43,
766
$45,
000
Bachelor
$59,
535
$58,
354
$60,
000
Master
$59,
535
$62,
955
$65,
000
Doctorate
$0
$10,000
$20,000
$30,000
$40,000
$50,000
$60,000
$70,000
$80,000
WestOntarioQuebecEastCanadian Average
Less thanhigh school
Highschool
Trades orapprenticeship
College Universitybelow bachelor
Bachelor Post-bachelor
$32,029 $37,403$39,996
$42,937 $47,253
$56,048
$66,535
$0
$200,000
$400,000
$600,000
$800,000
$1,000,000
$1,200,000
$1,400,000WestOntarioQuebecEastCanadian Average
Trades orapprenticeship
College Universitybelow bachelor
Bachelor Post-bachelor
$103,720
$394,000
$745,800
$1,165,280
$221,360
90
95
100
105
110
115
120
125
130
135
140
Earnings Premium of College Diploma and University Degree RecipientsCollege Diploma and University Degree Attainment
1980 1985 1990 1995 2000
$0
$10,000
$20,000
$30,000
$40,000
$50,000
$60,000
AboriginalNon-Aboriginal
Certificate ordiploma belowbachelor level
Bachelor’sdegree
University certificate,diploma or degree
above bachelor level
90
100
110
120
130
140
150
160
170
180
1980 1985 1990 1995 2000
College Premium — MalesCollege Attainment Rate — Males
College Premium — FemalesCollege Attainment Rate — Females
Bachelor's Degree Premium — FemalesUniversity Attainment Rate — Females
90
100
110
120
130
140
150
160Bachelor’s Degree Premium — MalesUniversity Attainment Rate — Males
1980 1985 1990 1995 2000
90
100
110
120
130
140
150
160
1980 1985 1990 1995 2000
90
100
110
120
130
140
150
160
1980 1985 1990 1995 2000
$16,
025
$38,
260
$44,
801
$23,
161 $4
0,39
5
$51,
301
Figure 1.III.1 — Percentage of the Population and Share of Income Tax Paid and of Government Transfers Received by Level of Education among Canadians Aged 25 to 64 in 2006
0%
5%
10%
15%
20%
25%
30%
35%
40%
45%
Percentage of the populationShare of government transfers receivedShare of income tax paid
Less ThanHigh School
Diploma
ObtainedHigh School
Diploma
SomePost-Secondary(No Certificate)
Non-UniversityPost-Secondary
Certificate
UniversityCertificate
23%
14%
6%
15% 15%
11% 11%10%8%
31% 31%28%
22%
41%
14%
Source: Statistics Canada, Income and Earnings Highlight Tables, 2006 census. Ottawa. Released May 1, 2008.
Source: Statistics Canada, Income and Earnings Highlight Tables, 2006 census. Author’s calculations.2

CHaPTer 1 — THe Value of a degree: eduCaTion, emPloymenT and earnings in Canada 11
Table 1.II.2 — Earnings Premium Relative to a High School Graduate over 40 Years, by Province
LocationLess Than
High SchoolTrades or
Apprenticeship CollegeUniversity
Below BachelorBachelor’s
DegreeUniversity
Post-Bachelor
Canada -$214,960 $103,720 $221,360 $394,000 $745,800 $1,165,280
Newfoundland and Labrador
-$191,600 $243,520 $339,480 $866,520 $997,560 $1,527,640
Prince Edward Island
-$91,640 $171,320 $233,120 $580,000 $748,520 $1,157,440
Nova Scotia -$147,600 $164,040 $197,360 $509,040 $765,600 $1,289,960
New Brunswick -$128,080 $155,600 $196,160 $567,320 $884,480 $1,272,640
Quebec -$215,080 $4,760 $247,760 $504,880 $753,400 $1,189,600
Ontario -$181,800 $204,880 $220,640 $343,600 $769,720 $1,188,480
Manitoba -$155,400 $127,680 $215,040 $454,200 $728,480 $1,210,080
Saskatchewan -$175,680 $166,640 $244,240 $503,800 $898,840 $1,309,840
Alberta -$150,160 $452,520 $274,720 $522,280 $891,960 $1,376,440
British Columbia -$197,800 $230,760 $169,760 $226,080 $536,760 $956,760
Yukon Territory -$145,480 $190,480 $197,360 $235,840 $791,000 $980,080
Northwest Territories
-$392,200 $395,120 $313,840 $342,400 $840,120 $1,372,360
Nunavut -$891,040 -$4,000 $192,640 * $998,520 $1,192,520
* Too unreliable to be published.
Source: Statistics Canada, Income and Earnings Highlight Tables, 2006 census. Authors’ calculations.
Provincial Variations
As Table 1.II.2 demonstrates, the earnings premium
associated with post-secondary education varies
considerably from province to province. The pre-
mium for a bachelor’s degree is highest in
Newfoundland and Labrador, where an individual
who completes a first degree is likely to earn just
under $1 million more than a high school gradu-
ate. At nearly $900,000, the college diploma
premium is also highest in Newfoundland and
Labrador. The lowest post-secondary premiums
are reported in British Columbia, where a college
graduate can expect to earn about $225,000 more
than a high school graduate and a bachelor’s
degree holder might earn a premium of about half
a million dollars over the course of a professional
lifetime. These variations, however, may reveal
more about the earnings of high school graduates
than post-secondary graduates. Because a high
school graduate’s wages in Atlantic Canada are
lower than in the rest of the country, the post-
secondary premium (which simply measures
the earnings of a college or university graduate
compared to a high school graduate) may appear
to be larger. Similarly, because high school gradu-
ates in Western Canada are relatively better
paid, the post-secondary premium may appear
somewhat more moderate. The fact that the
average high school graduate in B.C. earns more
than a typical college graduate in the Maritimes is
more an indication of the different economies in
these two parts of the country than it is of the value
of higher education. More to the point: even in
Canadian provinces where high school graduates
do reasonably well in the labour market, post-
secondary graduates do considerably better.

The Price of Knowledge: Access And sTudenT finAnce in cAnAdA12
The most recent findings from the National
Graduates Survey provide additional information
about the earnings of Canadian graduates. As
Figure 1.II.3 reveals, the earnings of post-secondary
graduates have increased since the mid-1990s. After
adjusting for inflation, college graduates from the
class of 2005 reported the same earnings as those who
had graduated five years earlier (both cohorts were
surveyed two years after they had graduated). Uni-
versity graduates were earning about three percent
more than their colleagues in the class of 2000.
The class of 2005 was also doing better earlier in their
working lives than were those who graduated in 1995.
At the same point after graduation, college graduates
from the class of 2005 were earning 7.5 percent more
than those who graduated in 1995. Bachelor’s degree
and Ph.D. recipients were earning about 10 percent
more than their peers from 10 years earlier. (Master’s
degree recipients were earning less than one percent
more, as the earnings of master’s degree holders
atypically declined between 1995 and 2000.)
The Impact of the Economic Downturn
The growth of earnings noted in Figure 1.II.3
occurred during a period of economic growth.
It remains to be seen how earnings of college and
university graduates will be affected by current
economic circumstances. There is good reason,
however, to expect that even if earnings of graduates
are adversely affected by the current downturn,
they will fare better than those without a post-
secondary degree. As noted above, for instance, a
review of long-term trends in unemployment shows
that while unemployment rates between 1971
and 2005 grew for all workers, they grew faster for
those with lower levels of education (Morissette
and Hou, 2006). More recently, while overall
employment in Canada between October 2008
and April 2009 declined by 1.9 percent, the decline
was especially sharp in industries that traditionally
employ workers with lower levels of education,
such as construction (decline of 8.5 percent),
manufacturing (6.5 percent) and natural resources
(5.9 percent) (Statistics Canada, 2009b).
Figure 1.I.1 — Growth in Unemployment Rates of 25- to 34-Year-Olds, by Education, 1971–2005 (in Percentage Points)
Figure 1.II.3 — Median Earnings among Post-Secondary Graduates in Canada, by Level of Study and Year of Graduation, 1995–2005 in Real 2007 Dollars
Figure 1.II.7 — Median Income among Aboriginal and Non-Aboriginal Individuals in 2005, by Level of Education
Figure 1.II.1 — Median 2005 Earnings for Full-Year, Full-Time Earners Age 25–64, by Education and by Region
Figure 1.II.2 — Earnings Premium Relative to a High School Graduate over 40 Years, by Region
Figure 1.II.4 — Relative Change in College and University Attainment and in the Earnings Premium of College andUniversity Graduates in Canada, 1980–2000
Figure 1.II.6a — Relative Change in College Attainment among Males and in the Earnings Premium of Male College Graduates in Canada, 1980–2000
Figure 1.II.6b — Relative Change in College Attainment among Females and in the Earnings Premium of FemaleCollege Graduates in Canada, 1980–2000
Figure 1.II.5b — Relative Change in University Attainment among Females and in the Earnings Premium of FemaleUniversity Graduates in Canada, 1980–2000
Figure 1.II.5a — Relative Change in University Attainment among Males and in the Earnings Premium of MaleUniversity Graduates in Canada, 1980–2000
0%
1%
2%
3%
4%
5%
6%
7%
8%
Less than high schoolHigh school / trades certificate or diplomaSome post-secondaryUniversity degree
7.0%
3.1%
1.8%0.8%
Men
5.8%
2.2%1.8% 1.9%
Women
$0
$10,000
$20,000
$30,000
$40,000
$50,000
$60,000
$70,000
199520002005
$32,
554
$35,
013
$35,
000
College
$40,
534
$43,
766
$45,
000
Bachelor
$59,
535
$58,
354
$60,
000
Master
$59,
535
$62,
955
$65,
000
Doctorate
$0
$10,000
$20,000
$30,000
$40,000
$50,000
$60,000
$70,000
$80,000
WestOntarioQuebecEastCanadian Average
Less thanhigh school
Highschool
Trades orapprenticeship
College Universitybelow bachelor
Bachelor Post-bachelor
$32,029 $37,403$39,996
$42,937 $47,253
$56,048
$66,535
$0
$200,000
$400,000
$600,000
$800,000
$1,000,000
$1,200,000
$1,400,000WestOntarioQuebecEastCanadian Average
Trades orapprenticeship
College Universitybelow bachelor
Bachelor Post-bachelor
$103,720
$394,000
$745,800
$1,165,280
$221,360
90
95
100
105
110
115
120
125
130
135
140
Earnings Premium of College Diploma and University Degree RecipientsCollege Diploma and University Degree Attainment
1980 1985 1990 1995 2000
$0
$10,000
$20,000
$30,000
$40,000
$50,000
$60,000
AboriginalNon-Aboriginal
Certificate ordiploma belowbachelor level
Bachelor’sdegree
University certificate,diploma or degree
above bachelor level
90
100
110
120
130
140
150
160
170
180
1980 1985 1990 1995 2000
College Premium — MalesCollege Attainment Rate — Males
College Premium — FemalesCollege Attainment Rate — Females
Bachelor's Degree Premium — FemalesUniversity Attainment Rate — Females
90
100
110
120
130
140
150
160Bachelor’s Degree Premium — MalesUniversity Attainment Rate — Males
1980 1985 1990 1995 2000
90
100
110
120
130
140
150
160
1980 1985 1990 1995 2000
90
100
110
120
130
140
150
160
1980 1985 1990 1995 2000
$16,
025
$38,
260
$44,
801
$23,
161 $4
0,39
5
$51,
301
Figure 1.III.1 — Percentage of the Population and Share of Income Tax Paid and of Government Transfers Received by Level of Education among Canadians Aged 25 to 64 in 2006
0%
5%
10%
15%
20%
25%
30%
35%
40%
45%
Percentage of the populationShare of government transfers receivedShare of income tax paid
Less ThanHigh School
Diploma
ObtainedHigh School
Diploma
SomePost-Secondary(No Certificate)
Non-UniversityPost-Secondary
Certificate
UniversityCertificate
23%
14%
6%
15% 15%
11% 11%10%8%
31% 31%28%
22%
41%
14%
Note: Earnings were measured two years after graduation (1997, 2002, 2007).
Source: Statistics Canada, National Graduates Survey.

CHaPTer 1 — THe Value of a degree: eduCaTion, emPloymenT and earnings in Canada 13
3. It should be noted that while these figures are taken from Boothby and Drewes’s paper, those authors do not claim that increases in educational attainment must necessarily produce concomitant increases in the earnings premium. Our argument is simply that those who wonder if the increase in educational attainment has not eroded the relative value of a degree should look more closely at the type of evidence produced by Boothby and Drewes.
Boothby and Drewes (2006), who use census data
to analyze nationwide trends in education outcomes
since 1980, provide a much more careful examination
of this issue. As Figure 1.II.4 demonstrates, the
earnings premium associated with a post-secondary
education has continued to increase since 1980,
despite the simultaneous increase in the proportion
of the population with a post-secondary credential.
Generally speaking, since 1980, the post-secondary
education premium—the gap between the earnings
of a post-secondary graduate and a high school
graduate—has grown even faster than the rate of
educational attainment in Canada.3 Between 1980
and 2000, college and university degree attainment
increased by 23 percent while the post-secondary
earnings premium increased by 37 percent. Although
higher education is less scarce than it was 25 years
ago, it appears to have more relative value.
Figure 1.I.1 — Growth in Unemployment Rates of 25- to 34-Year-Olds, by Education, 1971–2005 (in Percentage Points)
Figure 1.II.3 — Median Earnings among Post-Secondary Graduates in Canada, by Level of Study and Year of Graduation, 1995–2005 in Real 2007 Dollars
Figure 1.II.7 — Median Income among Aboriginal and Non-Aboriginal Individuals in 2005, by Level of Education
Figure 1.II.1 — Median 2005 Earnings for Full-Year, Full-Time Earners Age 25–64, by Education and by Region
Figure 1.II.2 — Earnings Premium Relative to a High School Graduate over 40 Years, by Region
Figure 1.II.4 — Relative Change in College and University Attainment and in the Earnings Premium of College andUniversity Graduates in Canada, 1980–2000
Figure 1.II.6a — Relative Change in College Attainment among Males and in the Earnings Premium of Male College Graduates in Canada, 1980–2000
Figure 1.II.6b — Relative Change in College Attainment among Females and in the Earnings Premium of FemaleCollege Graduates in Canada, 1980–2000
Figure 1.II.5b — Relative Change in University Attainment among Females and in the Earnings Premium of FemaleUniversity Graduates in Canada, 1980–2000
Figure 1.II.5a — Relative Change in University Attainment among Males and in the Earnings Premium of MaleUniversity Graduates in Canada, 1980–2000
0%
1%
2%
3%
4%
5%
6%
7%
8%
Less than high schoolHigh school / trades certificate or diplomaSome post-secondaryUniversity degree
7.0%
3.1%
1.8%0.8%
Men
5.8%
2.2%1.8% 1.9%
Women
$0
$10,000
$20,000
$30,000
$40,000
$50,000
$60,000
$70,000
199520002005
$32,
554
$35,
013
$35,
000
College
$40,
534
$43,
766
$45,
000
Bachelor
$59,
535
$58,
354
$60,
000
Master
$59,
535
$62,
955
$65,
000
Doctorate
$0
$10,000
$20,000
$30,000
$40,000
$50,000
$60,000
$70,000
$80,000
WestOntarioQuebecEastCanadian Average
Less thanhigh school
Highschool
Trades orapprenticeship
College Universitybelow bachelor
Bachelor Post-bachelor
$32,029 $37,403$39,996
$42,937 $47,253
$56,048
$66,535
$0
$200,000
$400,000
$600,000
$800,000
$1,000,000
$1,200,000
$1,400,000WestOntarioQuebecEastCanadian Average
Trades orapprenticeship
College Universitybelow bachelor
Bachelor Post-bachelor
$103,720
$394,000
$745,800
$1,165,280
$221,360
90
95
100
105
110
115
120
125
130
135
140
Earnings Premium of College Diploma and University Degree RecipientsCollege Diploma and University Degree Attainment
1980 1985 1990 1995 2000
$0
$10,000
$20,000
$30,000
$40,000
$50,000
$60,000
AboriginalNon-Aboriginal
Certificate ordiploma belowbachelor level
Bachelor’sdegree
University certificate,diploma or degree
above bachelor level
90
100
110
120
130
140
150
160
170
180
1980 1985 1990 1995 2000
College Premium — MalesCollege Attainment Rate — Males
College Premium — FemalesCollege Attainment Rate — Females
Bachelor's Degree Premium — FemalesUniversity Attainment Rate — Females
90
100
110
120
130
140
150
160Bachelor’s Degree Premium — MalesUniversity Attainment Rate — Males
1980 1985 1990 1995 2000
90
100
110
120
130
140
150
160
1980 1985 1990 1995 2000
90
100
110
120
130
140
150
160
1980 1985 1990 1995 2000
$16,
025
$38,
260
$44,
801
$23,
161 $4
0,39
5
$51,
301
Figure 1.III.1 — Percentage of the Population and Share of Income Tax Paid and of Government Transfers Received by Level of Education among Canadians Aged 25 to 64 in 2006
0%
5%
10%
15%
20%
25%
30%
35%
40%
45%
Percentage of the populationShare of government transfers receivedShare of income tax paid
Less ThanHigh School
Diploma
ObtainedHigh School
Diploma
SomePost-Secondary(No Certificate)
Non-UniversityPost-Secondary
Certificate
UniversityCertificate
23%
14%
6%
15% 15%
11% 11%10%8%
31% 31%28%
22%
41%
14%
Note: Sample is restricted to high school graduates who have completed either a college program or a bachelor’s degree-level programs, but not both.
Source: Census data from Boothby and Drewes, 2006; authors’ calculations.

The Price of Knowledge: Access And sTudenT finAnce in cAnAdA14
Figure 1.I.1 — Growth in Unemployment Rates of 25- to 34-Year-Olds, by Education, 1971–2005 (in Percentage Points)
Figure 1.II.3 — Median Earnings among Post-Secondary Graduates in Canada, by Level of Study and Year of Graduation, 1995–2005 in Real 2007 Dollars
Figure 1.II.7 — Median Income among Aboriginal and Non-Aboriginal Individuals in 2005, by Level of Education
Figure 1.II.1 — Median 2005 Earnings for Full-Year, Full-Time Earners Age 25–64, by Education and by Region
Figure 1.II.2 — Earnings Premium Relative to a High School Graduate over 40 Years, by Region
Figure 1.II.4 — Relative Change in College and University Attainment and in the Earnings Premium of College andUniversity Graduates in Canada, 1980–2000
Figure 1.II.6a — Relative Change in College Attainment among Males and in the Earnings Premium of Male College Graduates in Canada, 1980–2000
Figure 1.II.6b — Relative Change in College Attainment among Females and in the Earnings Premium of FemaleCollege Graduates in Canada, 1980–2000
Figure 1.II.5b — Relative Change in University Attainment among Females and in the Earnings Premium of FemaleUniversity Graduates in Canada, 1980–2000
Figure 1.II.5a — Relative Change in University Attainment among Males and in the Earnings Premium of MaleUniversity Graduates in Canada, 1980–2000
0%
1%
2%
3%
4%
5%
6%
7%
8%
Less than high schoolHigh school / trades certificate or diplomaSome post-secondaryUniversity degree
7.0%
3.1%
1.8%0.8%
Men
5.8%
2.2%1.8% 1.9%
Women
$0
$10,000
$20,000
$30,000
$40,000
$50,000
$60,000
$70,000
199520002005
$32,
554
$35,
013
$35,
000
College
$40,
534
$43,
766
$45,
000
Bachelor
$59,
535
$58,
354
$60,
000
Master
$59,
535
$62,
955
$65,
000
Doctorate
$0
$10,000
$20,000
$30,000
$40,000
$50,000
$60,000
$70,000
$80,000
WestOntarioQuebecEastCanadian Average
Less thanhigh school
Highschool
Trades orapprenticeship
College Universitybelow bachelor
Bachelor Post-bachelor
$32,029 $37,403$39,996
$42,937 $47,253
$56,048
$66,535
$0
$200,000
$400,000
$600,000
$800,000
$1,000,000
$1,200,000
$1,400,000WestOntarioQuebecEastCanadian Average
Trades orapprenticeship
College Universitybelow bachelor
Bachelor Post-bachelor
$103,720
$394,000
$745,800
$1,165,280
$221,360
90
95
100
105
110
115
120
125
130
135
140
Earnings Premium of College Diploma and University Degree RecipientsCollege Diploma and University Degree Attainment
1980 1985 1990 1995 2000
$0
$10,000
$20,000
$30,000
$40,000
$50,000
$60,000
AboriginalNon-Aboriginal
Certificate ordiploma belowbachelor level
Bachelor’sdegree
University certificate,diploma or degree
above bachelor level
90
100
110
120
130
140
150
160
170
180
1980 1985 1990 1995 2000
College Premium — MalesCollege Attainment Rate — Males
College Premium — FemalesCollege Attainment Rate — Females
Bachelor's Degree Premium — FemalesUniversity Attainment Rate — Females
90
100
110
120
130
140
150
160Bachelor’s Degree Premium — MalesUniversity Attainment Rate — Males
1980 1985 1990 1995 2000
90
100
110
120
130
140
150
160
1980 1985 1990 1995 2000
90
100
110
120
130
140
150
160
1980 1985 1990 1995 2000
$16,
025
$38,
260
$44,
801
$23,
161 $4
0,39
5
$51,
301
Figure 1.III.1 — Percentage of the Population and Share of Income Tax Paid and of Government Transfers Received by Level of Education among Canadians Aged 25 to 64 in 2006
0%
5%
10%
15%
20%
25%
30%
35%
40%
45%
Percentage of the populationShare of government transfers receivedShare of income tax paid
Less ThanHigh School
Diploma
ObtainedHigh School
Diploma
SomePost-Secondary(No Certificate)
Non-UniversityPost-Secondary
Certificate
UniversityCertificate
23%
14%
6%
15% 15%
11% 11%10%8%
31% 31%28%
22%
41%
14%
Source: Census data from Boothby and Drewes, 2006; authors’ calculations.
While the general trend is positive, certain kinds
of post-secondary graduates do better than others.
For instance, while the earnings premium associated
with an undergraduate degree has increased at a
faster rate than university attainment among men,
the opposite has occurred among women, as
Figures 1.II.5a and 1.II.5b demonstrate. At the
college level, while the earnings premium among
males nearly doubled between 1980 and 2000, that of
women has experienced slower growth which tapered
off in the late 1990s (see Figures 1.II.6a and 1.II.6b).
These data prompt three observations. First, the
general trend holds across post-secondary level and
gender. For instance, although female college gradu-
ates do not enjoy the same earnings premium as
their male counterparts—perhaps because the kinds
of fields men and women typically study are
rewarded differently in the labour market—women
still benefit from higher education. The second
observation concerns what is not shown by these
data, namely the socio-economic situation of gradu-
ates before they begin their studies. We do not know

CHaPTer 1 — THe Value of a degree: eduCaTion, emPloymenT and earnings in Canada 15
Figure 1.I.1 — Growth in Unemployment Rates of 25- to 34-Year-Olds, by Education, 1971–2005 (in Percentage Points)
Figure 1.II.3 — Median Earnings among Post-Secondary Graduates in Canada, by Level of Study and Year of Graduation, 1995–2005 in Real 2007 Dollars
Figure 1.II.7 — Median Income among Aboriginal and Non-Aboriginal Individuals in 2005, by Level of Education
Figure 1.II.1 — Median 2005 Earnings for Full-Year, Full-Time Earners Age 25–64, by Education and by Region
Figure 1.II.2 — Earnings Premium Relative to a High School Graduate over 40 Years, by Region
Figure 1.II.4 — Relative Change in College and University Attainment and in the Earnings Premium of College andUniversity Graduates in Canada, 1980–2000
Figure 1.II.6a — Relative Change in College Attainment among Males and in the Earnings Premium of Male College Graduates in Canada, 1980–2000
Figure 1.II.6b — Relative Change in College Attainment among Females and in the Earnings Premium of FemaleCollege Graduates in Canada, 1980–2000
Figure 1.II.5b — Relative Change in University Attainment among Females and in the Earnings Premium of FemaleUniversity Graduates in Canada, 1980–2000
Figure 1.II.5a — Relative Change in University Attainment among Males and in the Earnings Premium of MaleUniversity Graduates in Canada, 1980–2000
0%
1%
2%
3%
4%
5%
6%
7%
8%
Less than high schoolHigh school / trades certificate or diplomaSome post-secondaryUniversity degree
7.0%
3.1%
1.8%0.8%
Men
5.8%
2.2%1.8% 1.9%
Women
$0
$10,000
$20,000
$30,000
$40,000
$50,000
$60,000
$70,000
199520002005
$32,
554
$35,
013
$35,
000
College
$40,
534
$43,
766
$45,
000
Bachelor
$59,
535
$58,
354
$60,
000
Master
$59,
535
$62,
955
$65,
000
Doctorate
$0
$10,000
$20,000
$30,000
$40,000
$50,000
$60,000
$70,000
$80,000
WestOntarioQuebecEastCanadian Average
Less thanhigh school
Highschool
Trades orapprenticeship
College Universitybelow bachelor
Bachelor Post-bachelor
$32,029 $37,403$39,996
$42,937 $47,253
$56,048
$66,535
$0
$200,000
$400,000
$600,000
$800,000
$1,000,000
$1,200,000
$1,400,000WestOntarioQuebecEastCanadian Average
Trades orapprenticeship
College Universitybelow bachelor
Bachelor Post-bachelor
$103,720
$394,000
$745,800
$1,165,280
$221,360
90
95
100
105
110
115
120
125
130
135
140
Earnings Premium of College Diploma and University Degree RecipientsCollege Diploma and University Degree Attainment
1980 1985 1990 1995 2000
$0
$10,000
$20,000
$30,000
$40,000
$50,000
$60,000
AboriginalNon-Aboriginal
Certificate ordiploma belowbachelor level
Bachelor’sdegree
University certificate,diploma or degree
above bachelor level
90
100
110
120
130
140
150
160
170
180
1980 1985 1990 1995 2000
College Premium — MalesCollege Attainment Rate — Males
College Premium — FemalesCollege Attainment Rate — Females
Bachelor's Degree Premium — FemalesUniversity Attainment Rate — Females
90
100
110
120
130
140
150
160Bachelor’s Degree Premium — MalesUniversity Attainment Rate — Males
1980 1985 1990 1995 2000
90
100
110
120
130
140
150
160
1980 1985 1990 1995 2000
90
100
110
120
130
140
150
160
1980 1985 1990 1995 2000
$16,
025
$38,
260
$44,
801
$23,
161 $4
0,39
5
$51,
301
Figure 1.III.1 — Percentage of the Population and Share of Income Tax Paid and of Government Transfers Received by Level of Education among Canadians Aged 25 to 64 in 2006
0%
5%
10%
15%
20%
25%
30%
35%
40%
45%
Percentage of the populationShare of government transfers receivedShare of income tax paid
Less ThanHigh School
Diploma
ObtainedHigh School
Diploma
SomePost-Secondary(No Certificate)
Non-UniversityPost-Secondary
Certificate
UniversityCertificate
23%
14%
6%
15% 15%
11% 11%10%8%
31% 31%28%
22%
41%
14%
Source: Census data from Boothby and Drewes, 2006; authors’ calculations.
how the earnings premium differs between those
who come from lower- and higher-income family
backgrounds. Third, it is worth keeping in mind that
the earnings premium is a two-sided coin: a post-
secondary graduate in 2000 is better off than one
20 years earlier, and a high school graduate is worse
off. While graduating high school is better than
dropping out, a high school diploma is worth less
than ever before.
To sum up, the most recent evidence suggests
two things:
• The earnings of post-secondary graduates continue
to improve.
• The earnings premium associated with a higher
education credential when compared with the
earnings of a high school graduate also continues
to grow.
Of course, the picture is incomplete without taking into
account the costs of post-secondary education. These
are covered in the following section on rates of return.

The Price of Knowledge: Access And sTudenT finAnce in cAnAdA16
Post-Secondary Education, Earnings and Aboriginal People in Canada
According to census data from Statistics Canada,
Aboriginal post-secondary graduates report
earnings that approach those of non-Aboriginal
Canadians. As demonstrated in Figure 1.II.7 below,
the earnings gap between Aboriginal and non-
Aboriginal Canadians is smallest among those who
have completed a bachelor’s degree. (The pattern is
similar to that shown for unemployment rates in
Table 1.II.1, above.)
The largest gap exists among those who com-
pleted a certificate or diploma below the bachelor’s
level (Statistics Canada includes those with only a
high school diploma or certificate in this group as
well); the gap between those with a degree above the
bachelor’s level, including graduate studies, medi-
cine, law, etc., is also significant. To put it bluntly,
the median income of Aboriginal individuals with
a certificate is 70 percent that of a non-Aboriginal
with the same qualification. In the case of a bache-
lor’s degree, it is 86 percent.
Figure 1.I.1 — Growth in Unemployment Rates of 25- to 34-Year-Olds, by Education, 1971–2005 (in Percentage Points)
Figure 1.II.3 — Median Earnings among Post-Secondary Graduates in Canada, by Level of Study and Year of Graduation, 1995–2005 in Real 2007 Dollars
Figure 1.II.7 — Median Income among Aboriginal and Non-Aboriginal Individuals in 2005, by Level of Education
Figure 1.II.1 — Median 2005 Earnings for Full-Year, Full-Time Earners Age 25–64, by Education and by Region
Figure 1.II.2 — Earnings Premium Relative to a High School Graduate over 40 Years, by Region
Figure 1.II.4 — Relative Change in College and University Attainment and in the Earnings Premium of College andUniversity Graduates in Canada, 1980–2000
Figure 1.II.6a — Relative Change in College Attainment among Males and in the Earnings Premium of Male College Graduates in Canada, 1980–2000
Figure 1.II.6b — Relative Change in College Attainment among Females and in the Earnings Premium of FemaleCollege Graduates in Canada, 1980–2000
Figure 1.II.5b — Relative Change in University Attainment among Females and in the Earnings Premium of FemaleUniversity Graduates in Canada, 1980–2000
Figure 1.II.5a — Relative Change in University Attainment among Males and in the Earnings Premium of MaleUniversity Graduates in Canada, 1980–2000
0%
1%
2%
3%
4%
5%
6%
7%
8%
Less than high schoolHigh school / trades certificate or diplomaSome post-secondaryUniversity degree
7.0%
3.1%
1.8%0.8%
Men
5.8%
2.2%1.8% 1.9%
Women
$0
$10,000
$20,000
$30,000
$40,000
$50,000
$60,000
$70,000
199520002005
$32,
554
$35,
013
$35,
000
College
$40,
534
$43,
766
$45,
000
Bachelor
$59,
535
$58,
354
$60,
000
Master
$59,
535
$62,
955
$65,
000
Doctorate
$0
$10,000
$20,000
$30,000
$40,000
$50,000
$60,000
$70,000
$80,000
WestOntarioQuebecEastCanadian Average
Less thanhigh school
Highschool
Trades orapprenticeship
College Universitybelow bachelor
Bachelor Post-bachelor
$32,029 $37,403$39,996
$42,937 $47,253
$56,048
$66,535
$0
$200,000
$400,000
$600,000
$800,000
$1,000,000
$1,200,000
$1,400,000WestOntarioQuebecEastCanadian Average
Trades orapprenticeship
College Universitybelow bachelor
Bachelor Post-bachelor
$103,720
$394,000
$745,800
$1,165,280
$221,360
90
95
100
105
110
115
120
125
130
135
140
Earnings Premium of College Diploma and University Degree RecipientsCollege Diploma and University Degree Attainment
1980 1985 1990 1995 2000
$0
$10,000
$20,000
$30,000
$40,000
$50,000
$60,000
AboriginalNon-Aboriginal
Certificate ordiploma belowbachelor level
Bachelor’sdegree
University certificate,diploma or degree
above bachelor level
90
100
110
120
130
140
150
160
170
180
1980 1985 1990 1995 2000
College Premium — MalesCollege Attainment Rate — Males
College Premium — FemalesCollege Attainment Rate — Females
Bachelor's Degree Premium — FemalesUniversity Attainment Rate — Females
90
100
110
120
130
140
150
160Bachelor’s Degree Premium — MalesUniversity Attainment Rate — Males
1980 1985 1990 1995 2000
90
100
110
120
130
140
150
160
1980 1985 1990 1995 2000
90
100
110
120
130
140
150
160
1980 1985 1990 1995 2000
$16,
025
$38,
260
$44,
801
$23,
161 $4
0,39
5
$51,
301
Figure 1.III.1 — Percentage of the Population and Share of Income Tax Paid and of Government Transfers Received by Level of Education among Canadians Aged 25 to 64 in 2006
0%
5%
10%
15%
20%
25%
30%
35%
40%
45%
Percentage of the populationShare of government transfers receivedShare of income tax paid
Less ThanHigh School
Diploma
ObtainedHigh School
Diploma
SomePost-Secondary(No Certificate)
Non-UniversityPost-Secondary
Certificate
UniversityCertificate
23%
14%
6%
15% 15%
11% 11%10%8%
31% 31%28%
22%
41%
14%
Source: Statistics Canada, 2006 census.

Higher education has not only become increasingly
central to individual and societal wealth and quality
of life, it has also become more expensive. Since the
1990s, there has been a significant increase in tuition
and the additional costs almost all students face,
including ancillary fees, accommodation, books and
equipment, food and transit.4 An understanding of
the benefits of a post-secondary degree must take
both these trends into account. The rate of return
allows for the assessment of the value of education as
if it were an investment. It represents the net worth
of education once costs are considered, including
upfront costs like tuition and books as well as costs
such as forgone income. The rate of return acts as
a de facto interest rate that is equivalent to the pro-
portion of the total cost returned to the individual as
a benefit, in the form of earnings. Expressed as a per-
centage, the rate of return allows for the comparison
of investments in education to financial products.
Canadian researchers have confirmed that the
returns to post-secondary education have risen over
the past decades:
• According to Emery’s survey of the literature in
Canada (2005), rates of return increased steadily
from the 1960s to the early 1990s, where they
peaked at 16 percent (women) and 12 percent
(men) before dropping off only slightly.
• Belzil and Hansen (2006) examined rates of return
using census data, finding an increase during the
1990s, from 9 percent in 1991 to 11 percent in 2001,
although they tend to vary by discipline, gender
and region. Notably, the authors demonstrated
that the rate of return to post-secondary edu-
cation increased significantly despite the large
tuition increases of the 1990s.
• Similarly, Jorgen Hansen (2007), using census
data from 1991, 1996 and 2001, finds that the rate
of return increased during the 1990s for most
fields of study. Hansen reports increases in the
rates of return for females in the humanities, social
sciences, business and commerce, agricultural/
biological/nutritional/food sciences, health and
mathematics/computer/physical sciences. He
found no change in educational/recreational/
counselling services and engineering and a small
decline in the fine and applied arts. Rates of return
for males increased in every field except educational/
recreational/counselling services (which did not
change) and fine and applied arts (which declined).
• Demers (2008) uses 2006 census data to examine
the returns to education in Quebec. He finds that
the amount of taxes paid increases with edu-
cational attainment in the province. Additionally,
he identifies a rate of return to individuals who
receive a bachelor’s degree of 10.6 percent, as well
as a public rate of return of 8.5 percent. Demers
also describes how unemployment levels decrease
with educational attainment.
While much of the literature is focused on the bene-
fits of a university education, there is some evidence
that similar trends occur at the college level. As
mentioned above, Boothby and Drewes (2006) report
that the college earnings premium increased
between 1980 and 2000. Ferrer and Riddell (2002)
also identify a small earnings premium to non-
university post-secondary education (compared to
those with a high school education). While college
graduates enjoy a more modest earnings premium
than university graduates, they still benefit from
a substantial rate of return for two reasons. First,
college is typically cheaper than university in
Canada. Also, college programs tend to be shorter,
17
4. These figures will be presented in Chapter 4.
Chapter 1
III. Rates of Return

The Price of Knowledge: Access And sTudenT finAnce in cAnAdA18
reducing the opportunity cost (the forgone income
the individual would otherwise earn).
This analysis of the benefits of post-secondary
education focusing on the returns to individuals is
inevitably incomplete. There are significant societal
benefits that underpin the argument for increased
educational attainment. As Figure 1.III.1 demonstrates,
post-secondary graduates pay the lion’s share of taxes
in Canada and receive a relatively small portion of
government transfers.
Beyond government revenues and expenditure,
educational attainment is associated with a number
of positive characteristics. Riddell (2006) offers a
summary of the four areas that are discussed in the
literature on returns to schooling. The first concerns
intergenerational effects. Higher levels of parental
education are associated with lower levels of teenage
pregnancy, child abuse and neglect and reduced
crime in children. The second area is health. Riddell
points to a pair of studies that find a causal relation-
ship—not mere correlation—between education and
health. In particular, there is evidence to suggest that
even when controlling for levels of health knowledge,
individuals with higher levels of education use that
knowledge more efficiently. Studies by Lleras-Muney
(2005) and Lleras-Muney and Lichtenberg (2002)
reveal strong correlations between levels of education
and mortality, as well as the use of more recently
approved prescription drugs. Third, evidence from
the United States suggests that increasing educational
attainment can reduce arrests, incarcerations and self-
reported crime. Fourth, higher levels of educational
attainment are associated with greater civic parti-
cipation, particularly voting. As the U.S.-based Institute
for Higher Education Policy (1998) has noted, greater
levels of post-secondary education within the popu-
lation lead to increased productivity, consumption
and charitable giving.
Of course, by definition, examining earnings pre-
miums and rates of return focuses on the average
experience of post-secondary graduates. A recent
Statistics Canada project commissioned by the
Canada Millennium Scholarship Foundation and the
Higher Education Quality Council of Ontario examines
the situation of highly educated young Canadian work-
ers with below-average earnings. Specifically, the study
examines the characteristics of these graduates and
then explores their shifting experience within the
labour market.
Compared to other OECD countries, Canada has the
highest proportion of post-secondary graduates earning
less than half the median income. Among those aged
25 to 64, almost 18 percent of university graduates and
23 percent of college graduates earned less than half the
median income ($16,917) in 2006. On the surface, this
suggests that the earnings benefits of post-secondary
Figure 1.I.1 — Growth in Unemployment Rates of 25- to 34-Year-Olds, by Education, 1971–2005 (in Percentage Points)
Figure 1.II.3 — Median Earnings among Post-Secondary Graduates in Canada, by Level of Study and Year of Graduation, 1995–2005 in Real 2007 Dollars
Figure 1.II.7 — Median Income among Aboriginal and Non-Aboriginal Individuals in 2005, by Level of Education
Figure 1.II.1 — Median 2005 Earnings for Full-Year, Full-Time Earners Age 25–64, by Education and by Region
Figure 1.II.2 — Earnings Premium Relative to a High School Graduate over 40 Years, by Region
Figure 1.II.4 — Relative Change in College and University Attainment and in the Earnings Premium of College andUniversity Graduates in Canada, 1980–2000
Figure 1.II.6a — Relative Change in College Attainment among Males and in the Earnings Premium of Male College Graduates in Canada, 1980–2000
Figure 1.II.6b — Relative Change in College Attainment among Females and in the Earnings Premium of FemaleCollege Graduates in Canada, 1980–2000
Figure 1.II.5b — Relative Change in University Attainment among Females and in the Earnings Premium of FemaleUniversity Graduates in Canada, 1980–2000
Figure 1.II.5a — Relative Change in University Attainment among Males and in the Earnings Premium of MaleUniversity Graduates in Canada, 1980–2000
0%
1%
2%
3%
4%
5%
6%
7%
8%
Less than high schoolHigh school / trades certificate or diplomaSome post-secondaryUniversity degree
7.0%
3.1%
1.8%0.8%
Men
5.8%
2.2%1.8% 1.9%
Women
$0
$10,000
$20,000
$30,000
$40,000
$50,000
$60,000
$70,000
199520002005
$32,
554
$35,
013
$35,
000
College
$40,
534
$43,
766
$45,
000
Bachelor
$59,
535
$58,
354
$60,
000
Master
$59,
535
$62,
955
$65,
000
Doctorate
$0
$10,000
$20,000
$30,000
$40,000
$50,000
$60,000
$70,000
$80,000
WestOntarioQuebecEastCanadian Average
Less thanhigh school
Highschool
Trades orapprenticeship
College Universitybelow bachelor
Bachelor Post-bachelor
$32,029 $37,403$39,996
$42,937 $47,253
$56,048
$66,535
$0
$200,000
$400,000
$600,000
$800,000
$1,000,000
$1,200,000
$1,400,000WestOntarioQuebecEastCanadian Average
Trades orapprenticeship
College Universitybelow bachelor
Bachelor Post-bachelor
$103,720
$394,000
$745,800
$1,165,280
$221,360
90
95
100
105
110
115
120
125
130
135
140
Earnings Premium of College Diploma and University Degree RecipientsCollege Diploma and University Degree Attainment
1980 1985 1990 1995 2000
$0
$10,000
$20,000
$30,000
$40,000
$50,000
$60,000
AboriginalNon-Aboriginal
Certificate ordiploma belowbachelor level
Bachelor’sdegree
University certificate,diploma or degree
above bachelor level
90
100
110
120
130
140
150
160
170
180
1980 1985 1990 1995 2000
College Premium — MalesCollege Attainment Rate — Males
College Premium — FemalesCollege Attainment Rate — Females
Bachelor's Degree Premium — FemalesUniversity Attainment Rate — Females
90
100
110
120
130
140
150
160Bachelor’s Degree Premium — MalesUniversity Attainment Rate — Males
1980 1985 1990 1995 2000
90
100
110
120
130
140
150
160
1980 1985 1990 1995 2000
90
100
110
120
130
140
150
160
1980 1985 1990 1995 2000
$16,
025
$38,
260
$44,
801
$23,
161 $4
0,39
5
$51,
301
Figure 1.III.1 — Percentage of the Population and Share of Income Tax Paid and of Government Transfers Received by Level of Education among Canadians Aged 25 to 64 in 2006
0%
5%
10%
15%
20%
25%
30%
35%
40%
45%
Percentage of the populationShare of government transfers receivedShare of income tax paid
Less ThanHigh School
Diploma
ObtainedHigh School
Diploma
SomePost-Secondary(No Certificate)
Non-UniversityPost-Secondary
Certificate
UniversityCertificate
23%
14%
6%
15% 15%
11% 11%10%8%
31% 31%28%
22%
41%
14%
Source: Statistics Canada, Survey of Labour and Income Dynamics, custom tabulation.

CHaPTer 1 — THe Value of a degree: eduCaTion, emPloymenT and earnings in Canada 19
education are not as robust as the literature claims.
In fact, as the Statistics Canada report explains, few
Canadians with a post-secondary education who fully
participate in the labour market find themselves with
relatively low wages. Among university graduates with
very low earnings, 43 percent reported doing something
other than working as their main activity for the year
in question; 24 per cent reported being self-employed
(and therefore had an incentive to report low earnings
in the tax files that form the basis for the SLID data)
and five percent reported both. On the college side,
one-third reported something other than working as
their main activity; 27 percent were self-employed;
and five percent reported both. Leaving aside those who
were self-employed or were not working as their major
activity in 2006, only five percent of Canada’s university-
educated population and eight percent of its college-
educated population earned less than half the median.
The Statistics Canada report ex plains how this phe-
nomenon is more common among women and among
those who studied arts and communications tech-
nologies or parks, recreation and fitness. Further more,
post-secondary-educated individuals in Newfoundland
and Labrador, Prince Edward Island and New Bruns-
wick were more likely than those in other provinces
to earn less than half the national median.
In short, though a small minority of Canadians
who have completed university or college studies
earn relatively low wages, their situation is more
easily explained by the nature of their participation
in the labour market and by the regional variations
in the Canadian economy than by the outcomes of
their post-secondary studies. For the vast majority
of Canadians, higher education pays.
Myth: More Access Erodes Quality
Not everyone agrees that both the number and the
value of post-secondary degrees can grow at the
same time. Most famously in recent years, James
Côté and Anton Allahar (2007) have argued that we
have pushed too many unmotivated and unprepared
young people to continue their studies and that,
in response, universities have had to adapt by
lowering their standards. The result is not simply
more degrees but more degrees than necessary
and so ultimately degrees whose real value is
questionable. As they explain, “over-educated taxi
drivers are commonplace... [T]he production of uni-
versity degrees has outstripped the need for them
in the workplace...[W]e have produced more than
the demand required, and these credentials are now
worth less” (Côté and Allahar, 2007, 152–53).
There are a number of problems with this argu-
ment, not least of which is the fact that the decline
in standards that they lament has taken place at a
time when the proportion and the socio-economic
mix of the youth population enrolling in university
have both remained essentially unchanged (these
data will be presented in Chapter 2). While Côté
and Allahar worry about the “bulk of the popu-
lation” being pushed toward university, the
university degree attainment rate among 25- to
34-year-olds in Canada is 23 percent. Quality may
be eroding at some Canadian universities, but it is
not because they have suddenly become open-
access institutions.
The real problem with Côté and Allahar’s
approach, however, is their policy prescription:
having concluded that too many unqualified
students are attending university, their solution is
to lower young people’s aspirations (Côté and
Allahar, 2007, 181). If more students could be
streamed away from the country’s universities
and directly into the labour market or trades
training, then universities could expect more from
the remaining students and the real value of the
resulting degrees could rise again. In other words,
their solution is to ration the opportunity to
benefit from higher education to those who finish
high school at or near the top of their class.
This is based on both a limited appreciation of
human potential and a restricted appreciation of

The Price of Knowledge: Access And sTudenT finAnce in cAnAdA20
Myth: More Access Erodes Quality (continued)
what post-secondary educators should be striving
to accomplish. To illustrate, consider first the
contrasting vision of how we should approach
the question put forward by Ben Levin in his
recent report to the Government of Manitoba.
Levin argues:
“ One of the real barriers to improvement
is the perceived limits to people’s ability.
There remains a widely stated view that
too many students may already be taking
part in post-secondary education. We hear
frequent statements from various places,
including in the mass media, that too many
students are not capable, that they do not
have the necessary skills, and that standards
are therefore falling. Many people believe
that postsecondary education should re-
main a somewhat elite activity.
The Commission unconditionally rejects
that proposition because there is such
compelling evidence that it is a wrong
view, contradicted by everything we know.
The stance in this report is that research
and experience both tell us that people are
capable of more than we think; that when-
ever we stretch our sense of what people
can do, many will rise to the new level...
In short, history tells us that we have under-
estimated how many people can reach
high levels of education” (Levin, 2009, 4).
The second weakness is that the authors assume
that the only response that post-secondary institu-
tions and teaching faculty can have in the face
of the challenge posed by students who, perhaps
for reasons relating to their family background,
are initially less prepared for the rigours of the uni-
versity curriculum is to throw up their hands in
despair and lower their standards. This, of course,
is far from the case. Many post-secondary institu-
tions in Canada, the United States, Europe and
beyond are developing programs designed to help
students of different types—including students
who are initially academically weaker—succeed
in their studies. Two such programs in Canada—
the Foundations for Success pilot project at
three Ontario colleges and the LE,NONET pilot
project for Aboriginal students at the University of
Victoria—are currently the subject of research
evaluations (University of Victoria, 2008; Malatest,
2009a, b and c). These are but two examples, but
they are sufficient to show that waxing nostalgic
for an era when students were more engaged is
not the only response available to post-secondary
educators.
Perhaps the idea that widening access necessarily
erodes quality within post-secondary institutions
is not so much a myth as a self-fulfilling prophecy.
If educators assume that no other outcome is
possible, they will not take the steps necessary to
ensure that students from all backgrounds have
the opportunity to succeed in their studies. There
is no reason why access and excellence cannot be
managed as two sides of the same coin so that our
efforts to promote excellence lead us to open up
higher education to students from a wider range
of backgrounds, and our policies to promote
access include measures designed to promote
academic achievement. This is a theme we will
return to in subsequent chapters.

CHaPTer 1 — THe Value of a degree: eduCaTion, emPloymenT and earnings in Canada 21
An International Perspective
International comparisons demonstrate that the
rates of return to higher education are positive
across a variety of countries. Boarini and Strauss
(2007) report that the returns to an additional year
of average post-secondary education in 21 countries
range from four percent to 15 percent.
According to the OECD’s latest report (2008),
the rate of return to post-secondary education in
Canada is slightly below the OECD average. The pri-
vate rate of return (i.e., the return to the individual)
in 2004 was 9.4 percent for males and 9.1 percent for
females, below the OECD averages of 12.2 percent
and 11.4 percent, respectively. The OECD also
examined public rates of return (i.e., returns to
society), finding that Canada had below-average
results, at 7.9 percent for males and 7.3 percent
for females (the respective OECD averages were
11.1 percent and 9.1 percent).
The fact that the rates of return in Canada are
lower than average do not, however, take away
from the conclusion that post-secondary edu-
cation remains a worthwhile investment both for
individual Canadians and for the country.
Other Economic Indicators
Not surprisingly, the advantages that post-secondary
graduates have in terms of employment and income
translate into advantages in other areas. For instance:
• While the median wealth of families in Canada
rose between 1984 and 2005, the wealth of fami-
lies headed by a university graduate rose twice
as much as that of families headed by someone
without a university degree (Morissette and
Zhang, 2006, 9).
• The poverty rate—or percentage of families
with low income—is twice as high for families
headed by someone without a university degree
as it is for those headed by a university graduate
(Morissette and Zhang, 2006, 11).
• The proportion of families in 2005 with no private
savings for retirement is more than twice as
high for families headed by someone who did
not finish high school as it is for those headed by
a university graduate (35 percent compared with
15 percent) (Statistics Canada, 2006a, 23).

The Price of Knowledge: Access And sTudenT finAnce in cAnAdA22

23
Higher education is a positive-sum game. The
benefits of post-secondary studies that accrue to
individuals who undertake them have been growing
in recent decades. Although a post-secondary
credential is currently less scarce in Canada than
at any time in its history, individual degree- and
diploma-holders are financially better off now rela-
tive to non-graduates than they were 25 years ago.
As we mentioned at the outset, this is just one more
reason why access to post-secondary education
matters. Access is one of the most important ways in
which individuals can improve their circumstances
and ensure a high quality of life for themselves, their
families and their communities.
The question that remains to be examined, then,
is how well Canada has been doing in widening
participation in higher education. It is to this
question that we will turn next.
Chapter 1
IV. Conclusion

The Price of Knowledge : Access And sTudenT finAnce in cAnAdA24

Participation in Post-Secondary Education: Recent TrendsJoseph Berger
The Price of KnowledgeAccess and Student Finance in Canada
2

27
Canada has the highest level of educational attainment
among OECD countries. A majority of Canadian youth
report attending some form of higher education by
age 24, whether it be a university, college or appren-
ticeship program. This fact should be celebrated,
but it should not deflect us from examining the
question of participation in post-secondary edu-
cation more closely.
Post-secondary participation rates have been
falling, not rising, in recent years. At the same time,
the gap in the participation rates between wealthier
and poorer Canadians has not narrowed. The task
of ensuring that Canada is well positioned, in terms
of the development of its human capital, to meet the
economic and social challenges of the 21st century is
far from complete.
Nationally, post-secondary participation peaked
in 1997 when 71 percent of the 18- to 24-year-old
population either was enrolled or had graduated.
The rate has declined fairly steadily ever since,
reaching a low of 57 percent in 2006. This drop in parti-
cipation has been masked, however, by an increase
in enrolment driven by demographics: as the size of
the youth population has grown, enrolment numbers
have increased even though the proportion of youth
opting for post-secondary studies has declined. The
size of the youth population, however, will also soon
begin to fall.
Equally concerning is the fact that the country has
made little progress on narrowing the access gaps
that affect young people from different backgrounds.
Wealthier Canadians are twice as likely to go to uni-
versity as poorer ones—this was true 15 years ago,
and it is no less true today. Other gaps, such as those
separating the educational outcomes of Aboriginal
and non-Aboriginal Canadians, have remained stub-
bornly persistent. As a result, youth from low-income
families, children of parents with little or no post-
secondary education and Aboriginal peoples remain
considerably underrepresented in higher education.
Developing appropriate policy responses to these
trends compels us to get the facts straight. Accordingly,
in this chapter we will present the most recent figures
available regarding participation in post-secondary
education in Canada. Along the way, we will also
challenge a number of myths that often arise in dis-
cussions of this subject. These myths (some of which
we have already mentioned) include the following:
• Recent increases in the number of students
enrolled in college or university is evidence that
post-secondary participation is rising every year.
According to the evidence presented here, parti-
cipation rates have been falling.
• Participation in post-secondary education—parti-
cularly university—is gradually becoming more
equitable with the passage of time. In fact, access
gaps have not been narrowing.
• Canada leads the OECD in educational attainment.
This is true, but it is primarily due to Canada’s
relatively large college sector. Canada’s college
attainment rate is highest, but its university
attainment rate is closer to the middle of the pack.
Meanwhile, the educational attainment of many of
Canada’s OECD peers is growing at a quicker pace.
• The typical student moves directly from high
school into college or university and on to the
labour market armed with a diploma or
degree. In fact, this “typical” educational pathway
is only a reality for about one-third of Canadian
youth.
• The correlation (or the lack of correlation) between
tuition fee levels and enrolment rates in Canada is
easy to observe. As we will demonstrate, assertions
about the link between tuition and enrolment
are often based on an inaccurate or incomplete
reading of the data.
Chapter 2
I. Introduction

The Price of Knowledge : Access And sTudenT finAnce in cAnAdA28
Our purpose in challenging these myths is not
to call Canada’s good performance in education
into question. Rather, it is first to insist that good
policy stems from good information and second to
demonstrate that progress in important areas, such
as making participation more equitable, still needs
to be made. Furthermore, past performance is no
guarantee of future success. As we will discuss in
more detail below, data from recent years suggest
that the post-secondary enrolment boom that we
have experienced since the beginning of this decade
may be tapering off. Future enrolment increases,
therefore, will depend more and more on the success
of policy initiatives designed to improve the access
and success of traditionally underrepresented stu-
dents, including low-income youth, first-generation
learners and Aboriginal people.
28

29
Proper assessments of post-secondary public policy
are predicated upon an accurate portrait of the stu-
dent population: How many individuals actually
attend a post-secondary institution? What propor-
tion of the population is enrolled in higher education?
What is the composition of the post-secondary popu-
lation? Policy discussions would be much easier if
there were simple answers to all these questions.
Unfortunately, there are several ways to measure
post-secondary participation.
Enrolment offers the simplest measure: enrolment
represents a count of the number of individuals
attending a university, community college, private
career college or institute. That enrolment is a fairly
straightforward measure does not necessarily make
it an easy one to obtain, particularly in a timely
fashion. The most reliable data on post-secondary
enrolment come from Statistics Canada’s Postsec-
ondary Student Information System (PSIS), a survey of
post-secondary institutions. Unfortunately, published
enrolment figures are often a couple of years out
of date. The latest university data come from the
2006–07 academic year, and the two most recent
years exclude data from the University of Regina.
Until spring 2009, college data were only available
until 1999–2000. The latest release includes data up
to the 2005–06 academic year.
Attainment measures the proportion of the popu-
lation that has obtained a post-secondary credential.
Attainment rates can be provided for the population
as a whole or for different age groups—the latter
gives a sense of increases in participation over time.
Unfortunately, there is a lack of longitudinal socio-
economic data in Canada that can be tapped to
determine the extent to which educational attainment
varies by parental income. Attainment figures are
often used to measure how Canada performs within
a global context.
Lastly, the participation rate represents the pro-
portion of the population that is currently enrolled
in or has already completed post-secondary edu-
cation. Typically, it is expressed as the proportion of
the youth population (often those aged 18 to 24) that
reported being a student at the moment they were
surveyed (or had already completed a post-secondary
education). Given that enrolment in post-secondary
education changes in part on the basis of the size
of the typical post-secondary age population, partici-
pation rates provide a valuable measure, controlling
for population growth (or decline). Participation
rates are also often measured among those with
certain socio-economic characteristics. Below, we
compare the rate of participation in different forms
of post-secondary education among individuals
from families with different income levels and among
those whose parents have different levels of education
themselves. Participation rates, therefore, are a key
measure of both overall access and equitable access
to post-secondary studies.
Using the PSIS enrolment figures and census
population estimates, it is possible to determine the
proportion of the total Canadian population enrolled
in post-secondary education, although enrolment data
on specific subgroups (those in a particular age cat-
egory) are not as easily available. Other data sources,
including the Youth in Transition Survey (YITS) and
the Survey of Labour and Income Dynamics (SLID),
provide a reliable portrait of the youth population
that is enrolled in post-secondary education. That said,
participation rates are rarely calculated the same way
twice. Some surveys will cover the proportion of the
population enrolled in higher education at the moment
the survey is being conducted (or at a specific reference
point identified by the interviewer). Others will
consider anyone who has ever participated in post-
secondary education (even if they were not doing so
at the time of the interview).
Chapter 2
II. Measuring Post-Secondary Participation in Canada

The Price of Knowledge: Access And sTudenT finAnce in cAnAdA30

31
In 2005, the most recent year for which complete
figures are available, there were about 1.66 million
students in public post-secondary institutions in Can-
ada. This figure includes approximately 613,000 college
students and 1.04 million university students. Of these,
roughly 1.25 million were full time students. Seventy-five
percent of all university and college students were
enrolled full time in 2005.
Undergraduates have consistently made up approx-
imately 80 percent of all university students since 1992;
in 2006–2007, there were 803,000 undergraduate
university students. Undergraduates are more likely
than graduates to study full time (77 percent vs. 70 per-
cent in 2005), although the proportion studying full
time has increased steadily among both groups since
the early 1990s.
In addition to these 1.66 million students, there
are also an estimated 156,000 students enrolled in
private career colleges (excluding those enrolled in
language training programs and distance edu-
cation). This represents about nine percent of the
total post-secondary population.
Chapter 2
III. Enrolment
Canada’s Private Career College Students
Until recently, little was known about students
who enrol in private career colleges. As a result of the
Survey of Canadian Career College Students, however,
new information is now available (Malatest, 2008).
Career college students are overwhelmingly
female (72 percent) and are typically older and
more likely to have children than public college
students. One-quarter are immigrants to Canada.
Students at career colleges report low levels of
household income, with four in ten reporting less
than $20,000 annually.
Sixty percent of career college students took a
break between high school and post-secondary
education. Among them, 62 percent reported career
indecision or a lack of interest as a reason for the
delay; 27 percent cited financial barriers, while
20 percent cited personal or family issues.
One-third of career college students are inter-
ested in post-secondary education as a means
to a career or job, while one-quarter cite general
interest or personal development. Career college
students generally fit into one of a number of cate-
gories: older workers seeking retraining; younger
students seeking programs not available else-
where; individuals seeking very short-term,
skills-oriented education; individuals considering
career college as a springboard to public college
or university studies; and immigrants seeking new
skills acquisition since their education or credentials
are not recognized in Canada.
The vast majority of students reported that the
college where they were studying was their first
choice (72 percent). Another eight percent identified
a different career college, while 12 percent reported
preferring to study at a public college. Only eight per-
cent reported a preference for a university program.
In short, career colleges tend to serve students
with a different profile and personal history than
those enrolled in public colleges or universities.
Students opt for career colleges not as a second
choice after having failed to gain access to a public
institution, but because these colleges provide

The Price of Knowledge: Access And sTudenT finAnce in cAnAdA32
Total enrolment in the country’s universities and
public colleges declined slightly in the mid-1990s but
has grown in this decade, driven by significant in-
creases in university enrolment.
• As Figure 2.III.1 demonstrates, university enrolment
declined during the 1990s, returned to 1992 levels
around 2001 and has increased by 18 percent since
then, to more than one million students in 2005.
• On the college side, enrolment has increased slowly
but steadily since the early 1990s. In 2005 there were
more than 600,000 Canadian college students,
30 percent more than in 1992.
• In total, post-secondary enrolment has grown
by 24 percent since 1999, to nearly 1.7 million
students.
Figure 2.III.1 — University and College Enrolment in Canada, 1992 to 2005
Total EnrolmentUniversity EnrolmentCollege Enrolment
1,800,000
0
200,000
400,000
600,000
800,000
1,000,000
1,200,000
1,400,000
1,600,000
1992 1993 1994 1995 1996 1997 1998 1999 2000 2001 2002 2003 2004 2005
Source: Statistics Canada, PSIS.
Canada’s Private Career College Students (continued)
an opportunity for them to acquire job-related
training through comparatively short courses
which, while costly (average annual tuition is
$14,364), can be completed without having to
leave work for two or more years.
Data regarding the outcomes of career college
students are available from the report on the follow-
up Survey of Canadian Career College Students,
Phase III: Graduate Survey (Malatest, 2009d).

CHaPTer 2 — ParTiCiPaTion in PosT-seCondary eduCaTion: reCenT Trends 33
1. Excluding Saskatchewan, for which complete figures are not available.
In the most recent period, however, enrolment growth
has slowed. Since 2005–06, university enrolment has
risen by less than one percent per year. Enrolment
declined in the Atlantic provinces and increased by
less than half a percentage point in Quebec. In fact,
only Ontario has seen steady and significant growth
in university enrolment over the last several years:
in all provinces other than Ontario1 taken together,
enrolment actually fell between 2005–06 and 2006–07
(see Figure 2.III.2). Even in Ontario, undergraduate
enrolment declined by 0.2 percent between 2006–07
and 2007–08, although graduate enrolment increased
by 11.5 percent (similarly, at the national level,
undergraduate enrolment fell by 0.1 percent between
2006-07 and 2007-08 while graduate enrolment grew
by five percent). College enrolment figures from
these same years have not yet been made available.
College enrolment, however, did experience its first
decline in 12 years between 2004–05 and 2005–06,
the most recent years for which figures are available.
Figure 2.III.2 — Percentage Change in Full-Time University Enrolment
2002/03–2003/04 2003/04–2004/05 2004/05–2005/06 2005/06–2006/07 2006/07–2007/08
0%
-2%
2%
4%
6%
8%
10%
12%
14%
16%
Canada*OntarioOther Provinces*
9.24%
3.34%4.11%
0.85%
13.92%
5.43%4.51%
2.66%
5.77%
1.67%
3.77%
0.79% 0.72% 0.85%-0.65%
* Excluding Saskatchewan.
Source: Statistics Canada; author’s calculations.
Regional Trends in Enrolment
with the exception of P.E.I. In New Brunswick, Nova
Scotia and Newfoundland and Labrador, enrolment
has declined by six percent since peaking in 2003–04.
Only Ontario and B.C. posted above-average enrol-
ment increases between 2006–07 and 2007–08, each
growing by 1.1 percent.
At the college level, enrolment has increased
since 1992 in some regions, while remaining fairly
constant in others. In the Atlantic, the expansion
of the college systems in New Brunswick and Nova
Scotia coincided with a tripling of enrolment
between 1992–93 and 2005–06. That said, the
Changes in enrolment in Canada’s post-secondary
institutions are rarely distributed evenly across
the country. For instance, while university enrol-
ment in Canada increased by 20 percent (full-time
enrolment increased by 25 percent) between
2001–02 and 2007–08, this was driven largely by
above average increases in B.C. and Ontario, where
enrolment increased by 34 percent. Similarly, while
enrolment in Canada increased by 0.6 percent
between 2006–07 and 2007–08, enrolment actually
decreased in a number of provinces. Enrolment has
also declined considerably in the Atlantic region,

The Price of Knowledge: Access And sTudenT finAnce in cAnAdA34
Regional Trends in Enrolment (continued)
1992–93, or 42 percent. In Ontario, it has increased
by 68 percent, growing from 130,000 students
in the early 1990s to 219,000 in 2005–06. While
college enrolment grew by 28 percent in B.C. since
the early 1990s, it did not change much in Quebec.
col lege sector remains relatively small in the region.
The 28,293 Atlantic college students represented
slightly more than one-fifth of the region’s total
student population in 2005–06. In the Prairie prov-
inces of Manitoba, Saskatchewan and Alberta, college
enrolment has increased by 23,000 students since
Figure 2.III.3 — Annual Change in Undergraduate University Enrolment among 18- to 24-Year-Olds in Canada, Ontario and Canada Outside Ontario, 1992–2005
-5%
0%
5%
10%
15%
20%
1992 1993 1994 1995 1996 1997 1998 1999 2000 2001 2002 2003 2004 2005
CanadaOntarioCanada without Ontario
Source: Statistics Canada, PSIS, Population Projections, CANSIM Table 051-0001.
Figure 2.III.4 — College Enrolment in Canada, by Region, 1992–93 to 2005–06
0
50,000
100,000
150,000
200,000
250,000
1992 1993 1994 1995 1996 1997 1998 1999 2000 2001 2002 2003 2004 2005
AtlanticQuebecOntarioPrairiesB.C.
Source: Statistics Canada, PSIS, CANSIM Table 051-0001.

CHaPTer 2 — ParTiCiPaTion in PosT-seCondary eduCaTion: reCenT Trends 35
As we discussed in the previous edition of The Price
of Knowledge, the ups and downs in enrolment tend
to follow similar trends in the size of Canada’s young
adult population. The increase in post-secondary
enrolment since 2000 is due in part to the effect of
the “echo boom,” the children of the baby boomers.
The pool of traditional-age post-secondary students
has increased significantly in recent years, leading to
increased enrolment. As Figure 2.III.5 demonstrates,
the size of the 18- to 24-year-old population has
increased every year since 1996, although the rate of
growth has tapered off in recent years.
This is not to say that all enrolment changes
are due to demographic changes—far from it. For
instance, the spike in Ontario around 2003 coincided
with the “double cohort”; the province eliminated
Grade 13, meaning students in both Grade 12
and 13 graduated at the same time. Between 2002 and
2003, full-time university enrolment in Ontario grew
by 11 percent (Figure 2.III.5). As we will discuss below,
underlying economic conditions also play an important
role in determining whether and how people choose
to pursue studies rather than enter the labour market.
Also important is the growth in the number of students
studying at the graduate level.
The link between enrolment and population
growth is nonetheless important to acknowledge for
two related reasons. First, it serves to underline the
point that increases in enrolment do not necessarily
reflect proportionate increases in the rate at which
young people opt for post-secondary education.
Second, it serves to focus our attention on the poten-
tial implications of the decline in the size of the youth
cohort that will occur in Canada in the coming
years. As we noted in the previous edition of The
Price of Knowledge¸ by 2021 there will be 285,000
fewer Canadians between the ages of 18 and 24.
If enrolment growth since 1999 is in part the result of
a baby-boom echo, then it stands to reason that
the pending post-echo bust will dampen enrolment
figures in the years to come unless the rate of
post-secondary participation increases. We will
discuss the question of participation rates later in
this chapter.
Figure 2.III.5 — Annual Change in Undergraduate University Enrolment among 18- to 24-Year-Olds in Canada, Ontario and Canada Outside Ontario, and Annual Change in the Population of 18- to 24-Year-Olds in Canada, 1992–2005
-5%
0%
5%
10%
15%
20%
1992 1993 1994 1995 1996 1997 1998 1999 2000 2001 2002 2003 2004 2005
CanadaOntarioCanada without Ontario18- to 24-Year-Old Population
Source: Statistics Canada, PSIS, Population Projections, CANSIM Table 051-0001.

The Price of Knowledge : Access And sTudenT finAnce in cAnAdA36
1992 1993 1994 1995 1996 1997 1998 1999 2000 2001 2002 2003 2004 2005
UniversityCollege18- to 24-Year-Old Population
-2%
0%
2%
4%
6%
8%
10%
Figure 2.III.6 — Annual Change in University and College Enrolment and the 18- to 24-Year-Old Population, 1992–2005
Source: Statistics Canada, PSIS; Population Data.

37
The next measure we consider is attainment, by
which we mean the proportion of the population
that has completed a course of post-secondary study.
In Canada in 2006, 61 percent of the working-age
population (individuals aged 25 to 64) had completed
some form of post-secondary education. A little less
than half of them (28 percent) had completed a uni-
versity program, while about one-third (20 percent)
had studied at a college and one-fifth (12 percent)
had completed a trade certificate.2
Due to a change in the wording of the census
questions on education,3 comparisons to previous
census years cannot be reliably made. However, it is
possible to measure the attainment rate of individuals
of different ages. The fact that attainment is higher
for younger age cohorts reflects the tendency of a
greater proportion of young people to enrol in college
or university today than ten, 20 or 30 years ago.
Individuals aged 25 to 34 thus have the highest post-
secondary attainment rate, 67 percent, while those aged
35 to 44 followed at 65 percent. The cohort gap
between those aged 35 to 44 and those aged 45 to 54
is considerably larger than the gap between the two
youngest cohorts, however. This suggests that the
greatest jump in post-secondary participation took
place in the late 1970s and early 1980s. Those between
the ages of 45 and 54 had an attainment rate of 57
percent, while those aged 55 to 64 had the lowest rate,
53 percent.
While college and university attainment rates
were highest among the youngest cohort, the pro-
portion of 25- to 34-year-olds with a trade certificate
was lowest, at ten percent (13 percent of all other age
groups reported a trade certificate).
As Table 2.IV.1 demonstrates, educational attain-
ment varies considerably from province to province,
both in terms of the proportion of individuals
with a post-secondary education and the type of
education. Atlantic Canadians are more likely than
the average Canadian to have high school or less or
college-level studies. Quebecers are more likely to
have pursued college studies, while Ontarians have
above-average university attainment. The Prairie
provinces of Manitoba and Saskatchewan report
below-average levels of post-secondary education,
while educational attainment in Alberta and B.C.
is close to the national average. While college attain-
ment is above average in the three territories,
university attainment is 25 percent lower, and the
proportion with a high school degree or lower is well
above average.
The latest data from the Youth in Transition
Survey (Shaienks and Gluszynski, 2009) provide a
snapshot of educational attainment among indi-
viduals aged 26 to 28 in 2008. The data reveal that
64 percent of youth had completed some form of
post-secondary education: 24 percent had earned
a Bachelor’s level degree, 24 percent had earned a
college diploma, 10 percent had earned another
post-secondary credential and six percent had com-
pleted a university graduate degree. Twenty-eight
percent of youth had completed no more than a high
school diploma, while eight percent had not finished
high school.4
The numbers derived from the YITS data are similar
to census figures, as demonstrated in Table 2.IV.2.
2. Statistics Canada classifies individuals according to the “highest level of education,” such that university is higher than college, which is higher than trade/certificate, which is higher than high school.
3. In particular, these changes include different ways of capturing non-university post-secondary certification than in previous censuses. For more information, see www12.statcan.gc.ca/english/census06/analysis/education/changes.cfm.
4. Four percent of the total sample were enrolled in post-secondary education but had not yet completed a course of study. They are considered in this attainment portrait to be high school graduates. Similarly, 11 percent of youth had pursued and then abandoned post-secondary education and are considered here as high school graduates. Another 11 percent had completed one post-secondary credential but were enrolled in another post-secondary program, and are considered to have attained post-secondary education.
Chapter 2
IV. Attainment

The Price of Knowledge: Access And sTudenT finAnce in cAnAdA38
Table 2.IV.1 — Educational Attainment in 2006, Age 25–64, by Province
No PSE Non-University PSE University
No certificate, diploma or
degree
High school certificate or
equivalent Total
Apprenticeship/ trades certificate
or diplomaCollege/ CEGEP Total
University below the bachelor’s
level
University— Bachelor’s
level or above Total
Canada 15% 24% 39% 12% 20% 32% 5% 23% 28%
NL 26% 20% 46% 15% 22% 37% 4% 14% 18%
PE 19% 24% 43% 12% 24% 36% 4% 18% 22%
NS 19% 21% 40% 14% 22% 36% 4% 20% 24%
NB 21% 26% 47% 12% 21% 33% 4% 16% 20%
Atlantic 21% 23% 44% 13% 22% 36% 4% 17% 21%
QC 17% 21% 38% 18% 18% 36% 5% 21% 26%
ON 14% 25% 39% 9% 22% 31% 5% 26% 31%
Central 16% 23% 39% 14% 20% 34% 5% 24% 29%
MB 20% 25% 45% 11% 19% 30% 5% 19% 24%
SK 19% 27% 46% 14% 18% 32% 5% 17% 22%
AB 15% 24% 39% 12% 22% 34% 5% 22% 27%
Prairies 18% 25% 43% 12% 20% 32% 5% 19% 24%
BC 12% 26% 38% 12% 20% 32% 6% 24% 30%
YT 15% 21% 36% 13% 24% 37% 4% 22% 26%
NT 23% 19% 42% 12% 24% 36% 3% 20% 23%
NU 46% 10% 56% 9% 19% 28% 2% 13% 15%
North 28% 17% 45% 11% 22% 34% 3% 18% 21%
Source: Statistics Canada, 2006 Census of Population.
Table 2.IV.2 — Highest Level of Education Attained among 25- to 34-Year-Olds in 2006 and 26- to 28-Year-Olds in 2008
25- to 34-Year-Olds in 2006 (Census)
26- to 28-Year-Olds in 2008 (YITS)
Less than high school 11% 8%
High school diploma 23% 28%
Post-secondary Qualification 67% 64%
Other post-secondary/University certificate or diploma below bachelor level
15% 10%
College diploma 23% 24%
University degree or higher 29% 30%
Source: Statistics Canada, 2008b; Shaienks and Gluszynski, 2009.

CHaPTer 2 — ParTiCiPaTion in PosT-seCondary eduCaTion: reCenT Trends 39
5. As reported earlier, data from the 2006 census reveal that a higher proportion of Canadians have completed some form of post-secondary education. The difference between the census figure (61 percent) and the OECD figure (47 percent) represents the proportion of Canadians whose highest reported level of education in 2006 was an apprenticeship/trades certificate or diploma, which is excluded from the OECD type-A and type-B tertiary education classification.
Myth?: Canada’s High Educational Attainment
wish. What is clear, however, is that Canada is
unique in that it has a network of CEGEPs and
community colleges that offer skilled trades and
vocational education and that this network is
responsible for the country’s top ranking within
the OECD. This does not mean that Canada is
not doing as well as we think we are in edu-
cational attainment, or that its top ranking is
a “myth.” Rather, Canada’s level of educational
attainment represents the unique nature of its
post-secondary education system, one that offers
a wide range of options from work-based appren-
ticeship to university-housed advanced research.
As discussed in a previous section, just as the
nature of Canadian higher education is diverse, so
are the outcomes. The returns to study at the
post-secondary level vary considerably. And while
individuals who complete a university education
report the highest earnings premium relative
to high school graduates, community college
graduates still earn significantly more money than
those who do not pursue education beyond the
high school level. Some argue, however, that
international comparisons do not stand up to
close scrutiny and that, as a result, Canada may be
too complacent about its level of educational
attainment. As the Association of Universities
and Colleges of Canada put it, “According to the
OECD, Canada has about three times more
post-secondary non-university graduates than is
typical for other OECD countries. The OECD also
reports that Canada has four times more trade
and vocational graduates—12 percent in Canada
versus an average of three percent for the small
number of countries that report on this dimension.
The scale of these differences raises serious
concerns regarding the comparability of post-
secondary attainment rates” (AUCC, 2007, 22).
Canada has the highest level of educational attain-
ment among OECD countries (see Table 2.IV.3). In
2006, 47 percent of Canadians between the ages
of 25 and 64 had completed some form of post-
secondary education.5 Younger Canadians have
higher attainment rates than older Canadians. The
attainment rate of Canadian youth between the
ages of 25 and 34, at 55 percent, is 18 percentage
points higher than that of Canadians aged 55 to 64.
Among Canadians who have completed post-
secondary education, half completed studies at the
college or trade vocational level (referred to by the
OECD as “tertiary-type-B education”) and half
studied at the university level (“tertiary-type-A” or
“advanced research programs”). On the college
side, Canada has the highest level of attainment, at
23 percent, followed by Belgium and Japan
(18 percent), Finland (16 percent) and New Zealand
(15 percent). On the university side, Canada is
closer to the middle of the pack. The U.S., with
39 percent of its population having completed
university education, leads the OECD, followed
by Norway (31 percent), the Netherlands (28 per-
cent), Denmark (27 percent), Iceland (26 percent)
and, tied for sixth place, Australia and Canada
(24 percent) (OECD, 2008).
Some observers have suggested that Canada’s
level of educational attainment relative to its
OECD peers may be overstated, primarily because
of the difficulty of comparing tertiary-type-B edu-
cational systems (programs that offer practical,
technical and occupational skills) across countries.
Some countries, like Germany, concentrate voca-
tional education at the upper secondary level,
meaning that graduates may have acquired the
same rough level of skills as Canadian college grad-
uates without earning a post-secondary credential.
For these reasons, comparing Canada with other
countries is not as straightforward as we might

The Price of Knowledge: Access And sTudenT finAnce in cAnAdA40
Table 2.IV.3 — Educational Attainment in Select OECD Countries in 2006, by Age Group
Tertiary-Type-B EducationTertiary-Type-A and
Advanced Research Programs Total Tertiary Education
Age Group
25 to 64
25 to 34
35 to 44
45 to 54
55 to 64
25 to 64
25 to 34
35 to 44
45 to 54
55 to 64
25 to 64
25 to 34
35 to 44
45 to 54
55 to 64
Canada 23% 26% 25% 22% 18% 24% 29% 26% 21% 19% 47% 55% 51% 43% 37%
United States
10% 9% 10% 10% 9% 30% 30% 31% 29% 29% 39% 39% 41% 40% 38%
OECD Average
9% 10% 9% 8% 6% 19% 25% 20% 17% 14% 27% 33% 28% 24% 19%
Source: OECD, Education at a Glance 2008.

41
6. Many respondents pursued more than one kind of post-secondary education.
7. The YITS-B sample consists of individuals aged 18 to 20 in December 1999. These individuals were surveyed in 2000, 2002, 2004, 2006 and 2008.
The Survey of Labour and Income Dynamics (SLID)
can be used to offer a snapshot of post-secondary
participation in Canada. According to custom tabula-
tions conducted for this report using the SLID,
57 percent of Canadians aged 18 to 24 were enrolled
in or had completed some form of post-secondary
education in 2006:
• 28 percent were enrolled in or had completed uni-
versity studies (including some who had also
studied at the college level)
• 28 percent were enrolled in or had completed
community college/CEGEP/trade studies.
The Youth in Transition Survey (YITS) offers a some-
what different look at participation in post-secondary
education, by tracking two cohorts of young people
over the course of six years. Analysis of the YITS
by Shaienks and Gluszynski (2009) reveals that, by
the age of 26 to 28, 81 percent of respondents had
attended post-secondary education:
• 42 percent had attended a university (including
some who had also studied at the college level)
• 43 percent had studied at a community college/
CEGEP
• 29 percent had enrolled in another form of post-
secondary education.6
Among the 81 percent of youth who had enrolled in
some form of post-secondary education, not all had
graduated by age 26 to 28:
• 68 percent had graduated
• 13 percent had graduated and were enrolled in a
different post-secondary program
• 5 percent had not graduated but were still enrolled
in post-secondary studies
• 14 percent had dropped out.
The post-secondary attainment rate—the proportion
of the YITS-B sample that had completed at least one
course of post-secondary study—was 64 percent.7
If the five percent of youth still enrolled in higher
education at age 26 to 28 eventually graduates,
the attainment rate would reach 69 percent. By com-
parison, 67 percent of the 25- to 34-year-old cohort
measured using census data had completed some
post-secondary education. Of course, one-third of the
YITS-B sample either never enrolled in post-secondary
education or dropped out before completing, meaning
that there remains a substantial pool of young
Canadians who might yet attain a post-secondary
credential.
Chapter 2
V. Participation
Fact Check: Why Don’t the Numbers Agree?
report having pursued some form of post-
secondary education by the time they had reached
26 to 28 years of age.
With numbers all over the place, it is no
surprise that discussion of post-secondary
participation can generate some confusion. It is
important, however, to remember that the sur-
veys do not all measure the same thing: each one
According to the census, 61 percent of working-age
Canadians have completed post-secondary edu-
cation. According to the OECD, only 47 percent
have done so. The Survey of Labour and Income
Dynamics reveals that 57 percent of young Canadi-
ans were enrolled or had already completed some
higher education in 2006. More than 80 percent
of participants in the Youth in Transition Survey

The Price of Knowledge: Access And sTudenT finAnce in cAnAdA42
Fact Check: Why Don’t the Numbers Agree? (continued)
Myth: Participation in Post-Secondary Education in Canada is Continually Rising
in-depth analysis of post-secondary pathways of a
single cohort over a longer period of time.
Thanks to census data on educational attain-
ment, SLID data on annual trends in participation
and YITS data on different kinds of post-secondary
pathways, Canadian researchers are able to explore
the issue of participation in post-secondary edu-
cation more deeply than ever before. While at first
blush the statistics do not appear to agree, they
do not in fact contradict one another. The lessons
learned from each source of information contri-
bute to our understanding of higher education in
the 21st century.
asks different populations different questions
about different activities. The census, for example,
offers a good snapshot of current levels of post-
secondary educational attainment within the entire
adult population. The SLID allows us to focus on
the activities of a particular cohort—those aged
18 to 24—on an annual basis, to better understand
trends in post-secondary participation. Other
sources of Statistics Canada data, such as the
Labour Force Survey and the Post-secondary Stu-
dent Information System, may provide different
trends and different definitions of participation.
The YITS, a longitudinal survey, allows for a more
in the mid-1990s, the labour market became a more
attractive option for young adults, leading more to
opt for work over post-secondary studies. Nowhere
has the labour market more appeal than in the West
(see also Berger, Motte and Parkin, 2007, 36–37).
• In B.C., post-secondary participation has de-
clined from a peak of 67 percent of the 18- to
24-year-old population in 1993 to 60 percent
in 2001 to a low of 46 percent in 2006.
• In the Prairie region, comprising Alberta,
Saskatchewan and Manitoba, participation has
declined from a peak of 57 percent in 1999 to a
low of 45 percent in 2006.
• Ontario’s participation rate peaked in 1997, at
64 percent, and subsequently declined to
55 percent in 2006, although it increased in
2003 following the elimination of Grade 12 and
the “double cohort” of high school graduates. It
should be noted that, despite a decline in the
participation rate, Ontario has experienced a signi-
ficant increase in enrolment in post-secondary
education, due largely to considerable growth
in the size of the 18- to 24-year-old population,
which has grown by 144,000 (13 percent) between
1999 and 2007.
It is sometimes assumed that the rate of parti-
cipation in post-secondary education in Canada
is continually increasing—that each year, a greater
proportion of Canadians, realizing the importance
of a diploma or degree, decide to enrol in college
or university. Certain enrolment projections pre-
pared both by Statistics Canada and by the AUCC
(Hango and de Broucker, 2007a; AUCC, 2007) have,
for instance, been based in part on the assumption
of a growing rate of participation. Unfortunately,
this assumption cannot safely be made.
According to the custom SLID tabulations pre-
sented here, the rate of post-secondary participation
is declining in Canada, although not uniformly
across the country. Nationally, post-secondary parti-
cipation peaked at 71 percent of the 18- to 24-year-
old population in 1997 and has been declining
fairly steadily ever since, reaching a low of 57 per-
cent in 2006. This decline is being driven by the
Western provinces. Participation in the three Prairie
provinces declined by ten percentage points be-
tween 2004 and 2006; in B.C., participation rates
declined by 14 percentage points between 2001
and 2006. We can assume that this trend is linked
to the national economic cycle and regional eco-
nomic booms: as Canada moved out of recession

CHaPTer 2 — ParTiCiPaTion in PosT-seCondary eduCaTion: reCenT Trends 43
Myth: Participation in Post-Secondary Education in Canada is Continually Rising (continued)
dropped to 28 percent, before jumping to 30 per-
cent in 2003, where it stayed until 2006, when it
returned to 28 percent. Regionally, however, we see
that in the Prairies, university participation rates
declined from 30 percent to 22 percent between
2004 and 2006, while in B.C. the university rate
went from 25 percent in 2004 to 30 percent in 2005
and then down to 21 percent in 2006. In Ontario and
the Atlantic provinces, university participation rates
are generally higher now than at the start of the
decade, although they have tapered off in the most
recent years. After a decade of university parti-
cipation rates of around 24 percent, Quebec’s rates
have returned to the 1997 low of 21 percent.
• Participation in Quebec has been declining fairly
steadily since the late 1990s, when it peaked at
73 percent; it stood at 64 percent in 2006.
• In the Atlantic region, participation peaked at
65 percent in 1997, declined to 59 percent in
the early years of the current decade, rose to
63 percent in 2003 and settled at 59 percent in
2005 and 2006.
Looking specifically at the rate of participation in
university, different regional patterns are clearly
apparent. Nationally, university participation rates
are somewhat lower today than in the mid-1990s,
when they were close to 33 percent. In 2002 the rate
Figure 2.V.1 — Post-Secondary Participation Rate among 18- to 24-Year-Olds in Canada by Province, 1993–2006
40%
50%
60%
70%
80%
20061993 1994 1995 1996 1997 1998 1999 2000 2001 2002 2003 2004 2005
CanadaOntarioAtlantic ProvincesPrairie ProvincesQuebecB.C.
Source: Statistics Canada, Survey of Labour and Income Dynamics, custom tabulation.
20061993 1994 1995 1996 1997 1998 1999 2000 2001 2002 2003 2004 2005
Figure 2.V.2 — University Participation Rate among 18- to 24-Year-Olds in Canada by Province, 1993–2006
0%
10%
20%
30%
40%
50%CanadaOntarioAtlantic ProvincesPrairie ProvincesQuebecB.C.
Source: Statistics Canada, Survey of Labour and Income Dynamics, custom tabulation .

The Price of Knowledge: Access And sTudenT finAnce in cAnAdA44
Myth: Participation in Post-Secondary Education in Canada is Continually Rising (continued)
This review of post-secondary participation
rates shows that participation does not increase in
a clear, steady fashion. The decision to enrol
in higher education, as we discussed in previous
editions of The Price of Knowledge, is based on a
number of important factors, including individual
and family aspirations, academic ability, career
planning, financial preparation, the nature of
provincial post-secondary systems, the capacity
of post-secondary institutions to accept new
students and the effect of strong or weak labour
markets. The data, however, reveal that since the
end of the last recession, the proportion of 18- to
24-year-olds enrolled in or having graduated from
college or university has been decreasing. It is
reasonable to assume, of course, that this trend
will soon reverse: that given the worsening eco-
nomic conditions, participation rates will once
again go up. It is important, however, that we do
not simply sit back and let the economic cycle do
the work of encouraging more young people to
seek a post-secondary degree. In the long run,
Canada’s strategy to maintain post-secondary
participation levels should be based on something
more than economic pessimism.
At the college level, overall participation rates
are down from their mid-1990s peak. In 1997,
38 percent of all Canadian 18- to 24-year-olds
participated in college studies. That rate declined
to 31 percent in 2001 and again to 29 percent in
2006. Quebec’s unique CEGEP system (which is a
mandatory precursor to university for provincial
residents) means that its participation rate is
substantially higher than in the rest of the country.
That said, college participation rates in Quebec
have declined steadily from a peak of 51 percent
in 1997, reaching a low of 41 percent in 2005 before
increasing to 43 percent in 2006. Since 2000, when
its college participation rate peaked at 31 percent,
Ontario has seen a steady decline, to 24 percent
in 2006. While B.C.’s rate reveals an up and down
pattern, year-over-year, the general trend is
downward. It has declined from 35 percent in 1997
to 25 percent in 2006. Despite a small increase in
2005, the college participation rate in the prairies
has declined steadily from its peak of 32 percent
in 1998 and 1999 to a low of 23 percent in 2006.
In the Atlantic, college participation peaked at
32 percent in 1998 and has wavered since then,
dropping to 25 percent in 2006.
20061993 1994 1995 1996 1997 1998 1999 2000 2001 2002 2003 2004 2005
CanadaOntarioAtlantic ProvincesPrairie ProvincesQuebecB.C.
0%
10%
20%
30%
40%
50%
60%
Figure 2.V.3 — College Participation Rate among 18- to 24-Year-Olds in Canada by Province, 1993–2006
Source: Statistics Canada, Survey of Labour and Income Dynamics, custom tabulation.

45
The question of whether youth from different
backgrounds are equally likely to participate in post-
secondary education in Canada is of central concern
to policy-makers. Given the important role that
education plays in opening doors to full participation
in our economy and society, the restriction of edu-
cational opportunities for certain groups has serious
consequences both for their own well-being and for
the country as a whole. Unfortunately, many of the
gaps that separate the post-secondary participation
rates of key segments of Canadian society—gaps that
have been familiar to us for many years—have
proven to be stubbornly persistent.
Parental Income and Education The inequality in access among Canadians from
different socio-economic backgrounds is well known.
Consider the following figures, produced by
Zeman (2008), which relate to the YITS-A cohort
of youth who were 15 years old in 1999 and who
were surveyed again at age 19.8
• For every 100 low-income Canadian 19-year-olds,
25 attend university. For every 100 high-income
Canadians of the same age, 46 are enrolled in
university studies.
• Low-income youth are 40 percent more likely to
enrol in college studies as in university studies
by age 19.
• As Figure 2.VI.1 demonstrates, for low-income
Canadians, the odds of graduating from high
school and pursuing post-secondary studies
without taking a long break are equivalent to a
coin toss. For the children of wealthy families, the
element of chance is vastly diminished. Fully
77 percent of youth from high-income families
have enrolled in post-secondary education.
Chapter 2
VI. Access Gaps
8. These figures are restricted to the YITS-A sample of individuals enrolled in high school at age 15 in 1999. Since low-income youth are more likely to drop out of high school than high-income students, the figures here somewhat overestimate the participation of low-income youth in post-secondary education.
0 2010 30 5040
Figure 2.VI.1 — Post-Secondary Status of Canadian 19-Year-Olds in 2003, by Family Income Quartile Measured at Age 15
No PSECollege StudentsUniversity Students
39
36
25
22
31
46
Youth from the Highest Income Quartile
Youth from the Lowest Income Quartile
Source: Zeman, 2008.

The Price of Knowledge: Access And sTudenT finAnce in cAnAdA46
While the YITS-A survey offers a longitudinal portrait
of the educational pathways of a single cohort of
Canadian youth, data from the Survey of Labour and
Income Dynamics (SLID) allow for a longer-term
view. The SLID data also allow researchers to focus
on the influence of parental income and education
on the post-secondary decisions of Canadian youth.
The Canada Millennium Scholarship Foundation
commissioned a series of SLID tables from Statistics
Canada to update the data discussed by Drolet (2005),
which examined the post-secondary participation of
Canadian 18- to 24-year-olds throughout the 1990s.9
Drolet had concluded that “the correlation between
university participation and family income changed
very little between 1993 and 2001” (Drolet, 2005, 26).
While the data did not lead her to a similar conclu-
sion about college enrolment (college participation
rates remained close to 35 percent of youth from
all income groups during the 1990s), they clearly
demonstrated that post-secondary participation was
no more equitable at the start of the 2000s than a
decade earlier.
Looking at the updated data, we see first that,
as discussed above, the overall proportion of the
Canadian 18- to 24-year-old population pursuing
post-secondary education declined between 1993
and 2006. Figure 2.VI.2 demonstrates this again,
showing the trends for college and university parti-
cipation separately and combined. The next step
is to examine trends for students from different
socio-economic backgrounds. Participation in post-
secondary education in Canada is no more or less
equitable in 2006 than it was in 2001. Whether
measuring participation rates by family income
(adjusted for inflation) or level of parental edu-
cation, Canadian youth from high socio-economic
situations remain significantly more likely than
those from low socio-economic situations to pursue
post-secondary studies.
9. All dollar figures in this section have been adjusted for inflation.
Figure 2.VI.2 — University, College and Post-Secondary Participation Rate among 18- to 24-Year-Olds in Canada, 1993 to 2006
0%
20%
40%
60%
80%
100%
1993 1994 1995 1996 1997 1998 1999 2000 2001 2002 2003 2004 2005 2006
Any PSEUniversityCollege
Note: In the figures in this section, “participation” represents respondents who have either completed or were pursuing studies at the stated level in the year in question.
Source: Statistics Canada, Survey of Labour and Income Dynamics, custom tabulation.

CHaPTer 2 — ParTiCiPaTion in PosT-seCondary eduCaTion: reCenT Trends 47
As Figure 2.VI.3 demonstrates, the proportion of
individuals from families reporting more than $100,000
per year in income participating in post-secondary
studies has remained close to three-quarters, while
the proportion of individuals from families earning
less than $25,000 has hovered around one-half. The
gap between the two groups has remained around
25 percentage points since the late 1990s.
Nor has participation by level of parental
education changed dramatically since the early
1990s, as Figure 2.VI.4 demonstrates. Among 18- to
24-year-olds whose parents completed a university
education, about 80 percent consistently enrol in
post-secondary studies. Among those whose parents
completed a post-secondary certificate or diploma,
about two-thirds pursue higher education. Only about
Figure 2.VI.3 — Post-Secondary Participation Rate by Select Family Income Levels among 18- to 24-Year-Olds, 1993–2006
0%
20%
40%
60%
80%
100%
1993 1994 1995 1996 1997 1998 1999 2000 2001 2002 2003 2004 2005 2006
Gap Between the Highest and Lowest Income Groups (percentage points)Over $100,000Less Than $25,000
23%30%
16%
28%
18%
26% 25% 24% 26% 25%31%
20%
31%29%
Figure 2.VI.4 — Post-Secondary Participation Rate by Parental Education among 18- to 24-Year-Olds, 1993–2006
0%
20%
40%
60%
80%
100%
1993 1994 1995 1996 1997 1998 1999 2000 2001 2002 2003 2004 2005 2006
UniversityPost-Secondary Certificate or DiplomaHigh School or Less
Note: Sample is restricted to individuals residing with at least one parent when surveyed; Statistics Canada used an augmented sample, exploiting the longitudinal nature of the dataset, to verify the reliability of the data. The method used replicates Drolet’s approach, described in Drolet (2005, 14–15).
Source: Statistics Canada, Survey of Labour and Income Dynamics, custom tabulation.
Source: Statistics Canada, Survey of Labour and Income Dynamics, custom tabulation.

The Price of Knowledge: Access And sTudenT finAnce in cAnAdA48
half of individuals whose parents did not study beyond
high school enrolled in post-secondary education.
The gap between participation in post-secondary
education for individuals of high and low socio-
economic status is most strongly evident on the
university side. As Figures 2.VI.5 and 2.VI.6 make
clear, individuals from families earning more than
$100,000 per year are more than twice as likely as
those from families earning less than $25,000 per
year to go to university. Youth from families earning
less than $75,000 have relatively low university
participation rates, as approximately one-quarter
pursue university studies. Comparatively, more than
one-third of youth from families in the second-
highest category ($75,000 to $100,000) and one-half of
those in the highest category enrolled in university
studies. The challenge of improving equitable access
to university study, therefore, involves increasing
opportunities to study at university for lower- and
middle-income families.
Figure 2.VI.5 — University Participation Rate by Family Income among 18- to 24-Year-Olds, 1993–2006
0%
10%
20%
30%
40%
50%
60%
70%
1993 1994 1995 1996 1997 1998 1999 2000 2001 2002 2003 2004 2005 2006
Less Than $25,000$25,000–$50,000$50,000–$75,000$75,000–$100,000Over $100,000
Figure 2.VI.6 — Ratio of University Participation among 18- to 24-Year-Olds from Families Earning More than $100,000per Year to University Participation among Those from Families Earning Less Than $25,000 per Year, 1993–2006
0.0
0.5
1.0
1.5
2.0
2.5
3.0
3.5
1993 1994 1995 1996 1997 1998 1999 2000 2001 2002 2003 2004 2005 2006
2.542.69
1.56
2.63 2.52
3.08
2.302.10
2.282.40
2.22 2.16
1.88
2.32
Source: Statistics Canada, Survey of Labour and Income Dynamics, custom tabulation.
Source: Statistics Canada, Survey of Labour and Income Dynamics, custom tabulation.

CHaPTer 2 — ParTiCiPaTion in PosT-seCondary eduCaTion: reCenT Trends 49
Participation in college studies, by comparison, is
more evenly distributed. As Figure 2.VI.7 demon-
strates, the likelihood of participation in college
studies among Canadian youth is not greatly related
to family income, and has been even less so in recent
years than in the mid-1990s. It should be noted,
however, that the considerable family income-based
gap in university enrolment has an impact on
college participation rates. The conditional college
participation rate measures the share of youth not
enrolled in university who are enrolled in college.
As Figure 2.VI.8 demonstrates, among all youth not
enrolled in university studies, college participation
increases with family income. (Using parental edu-
cation instead of family income as a measure of
socio-economic status reveals a similar trend.)
Figure 2.VI.7 — College Participation Rate by Family Income among 18- to 24-Year-Olds, 1993–2006
0%
10%
20%
30%
40%
50%
60%
1993 1994 1995 1996 1997 1998 1999 2000 2001 2002 2003 2004 2005 2006
Less Than $25,000$25,000–$50,000$50,000–$75,000$75,000–$100,000Over $100,000
Figure 2.VI.8 — Conditional College Participation Rate by Family Income among 18- to 24-Year-Olds, 1993–2006
0%
20%
40%
60%
80%
100%
1993 1994 1995 1996 1997 1998 1999 2000 2001 2002 2003 2004 2005 2006
Less Than $25,000$25,000–$50,000$50,000–$75,000$75,000–$100,000Over $100,000
Source: Statistics Canada, Survey of Labour and Income Dynamics, custom tabulation.
Note: The conditional college participation rate calculates the proportion of the population of individuals who were not attending or had not completed university studies that enrolled in college studies in the year in question.
Source: Statistics Canada, Survey of Labour and Income Dynamics, custom tabulation.

The Price of Knowledge: Access And sTudenT finAnce in cAnAdA50
10. The YITS Cohort B consists of a sample of Canadians who were between the ages of 18 and 20 at the beginning of 2000. At the time of the third cycle of interviews, the respondents were aged 22 to 24. The sample of youth who pursued trade studies or other non-college/non-university post-secondary education was too small to distinguish between those who went directly to post-secondary education and those who took a gap between levels of study (a gap is defined as any period greater than four months). Students in the “trade/other” category represent three percent of the sample.
11. Once data become available in the coming years, similar analysis using the YITS-A cohort, which was recruited among 15-year-olds at the beginning of 2000, will include more information about socio-economic status, since parental income will be included in the data.
12. It is worth remembering that the YITS sample was not recruited on First Nations reserves. Therefore, it is only representative of Aboriginal youth who were living off reserve in 1999.
13. It is not clear that it is objectively better for individuals to complete their post-secondary education on time. Ferrer and Menendez (2009) find that “graduates that delayed their education receive a premium relative to graduates that did not, even after considering other factors such as experience or labour market connections” (3). That said, there are other costs associated with a delayed course of study to the individual, the institution and the public purse that cannot be ignored. Hango and de Broucker (2007b) find that “youth who delayed their postsecondary attendance following high school graduation did not earn more than youth who did not delay, suggesting that taking time off between high school and a postsecondary program does not translate into greater earnings between ages 22 and 24” (12).
Myth: The Continuous Post-Secondary Pathway
• Three percent of all youth went directly from
high school to university and were enrolled at
the graduate level by age 22 to 24 (Hango and
de Broucker, 2007b, 21–24).
The “typical” pathway, then, only applies to about
one-third of youth, almost half of whom have
not completed post-secondary education by the
time they reach age 22 to 24, approximately four to
six years after high school. Thus, if few students
begin post-secondary education “on time,” even
fewer complete it on schedule.
While the YITS dataset used to construct this
pathway analysis does not contain information
about family income, it does offer information
about respondents’ parental education, as well
as their Aboriginal status.11,12 Unsurprisingly, the
likelihood that an individual will enrol directly
in post-secondary education from high school
increases with parental education. Similarly,
Aboriginal youth were much less likely than non-
Aboriginal youth to pursue the “traditional” path-
way. Table 2.VI.1 describes the proportion of youth
who were not in school at age 22 to 24 who pur-
sued the “traditional” pathway to post-secondary
completion by parental education and Aboriginal
status (Hango and de Broucker, 2007b, 31–33).13
Statistics Canada’s Youth in Transition Survey
offers robust longitudinal data on the pathways of
youth beginning as early as age 15. It has allowed
Canadians to gain their best ever insight into the
dynamics of educational pathways. Analysts such
as Hango and de Broucker (2007b) have examined
the educational and labour market pathways of
youth beginning at ages 18 to 20 and ending at ages
22 to 24, only to find that much of what might have
been considered typical is far from it. As they note,
only one in three young Canadians went directly
from high school to post-secondary education and
were either enrolled or had graduated once they
reached age 22 to 24.10
• Nine percent of all youth went directly from
high school to college and graduated by age
22 to 24.
• Eight percent of all youth went directly from
high school to university and graduated by age
22 to 24.
• Two percent of all youth went directly from
high school to college and were still enrolled by
age 22 to 24.
• Twelve percent of all youth went directly from
high school to university and were still enrolled
at the undergraduate level by age 22 to 24.

CHaPTer 2 — ParTiCiPaTion in PosT-seCondary eduCaTion: reCenT Trends 51
Myth: The Continuous Post-Secondary Pathway (continued)
Table 2.VI.1 — Proportion of Non-Students Aged 22 to 24 Who Pursued Post-Secondary Education Immediately after High School, by Parental Education and Aboriginal Status, in 2004
Direct transition: high school to college;
graduation by age 22–24
Direct transition: high school to university; graduation by age 22–24 Total
Parental education: less than high school
9.6% 5.3% 14.9%
Parental education: high school
12.1% 5.7% 17.8%
Parental education: some post-secondary education
13.5% 9.6% 23.1%
Parental education: post-secondary graduate
14.5% 17.9% 32.4%
Aboriginal 6.5%* ** 6.5%*
Non-Aboriginal 12.9% 11.4% 34.3%
All youth 12.7% 11.1% 23.8%
* Should be used with caution.
** Too unreliable to be published.
Source: Hango and de Broucker, 2007b.

The Price of Knowledge: Access And sTudenT finAnce in cAnAdA52
Aboriginal PeoplesIt is well known that the educational attainment of
Aboriginal peoples in Canada is lower than that of
their non-Aboriginal counterparts. Compared with
other Canadians, Aboriginal peoples are twice as likely
to have stopped their education before completing
high school; they are three times less likely to have a
university degree (see Table 2.VI.2). Some Aboriginal
groups fare better than others: 50 percent of the Métis
population have a post-secondary degree, compared
with 36 percent of the Inuit population. One in two
Inuit and First Nations persons living on reserve have
not finished high school.
Aboriginal women have higher educational attain-
ment than Aboriginal men. Looking at Aboriginal
persons aged 25 to 44, the 2006 census reports
35 percent of men do not have a high school diploma,
compared with 29 percent of women. Only six per-
cent of men have a university degree, compared with
10 percent of women.
The key question, however, is whether the gap
between the educational attainment of Aboriginal
and non-Aboriginal Canadians is narrowing over
time. Unfortunately, because the questions about
non-university education asked in the 2006 census
were different from those asked in previous years,
comparisons over time are difficult to make.
Comparisons are possible in the case of university
graduates, however. The proportion of the Abori-
ginal population with a university degree has been
growing: the eight percent figure for 2006 is up from
six percent in 2001. In the case of the non-Aboriginal
population, however, the figure rose from 20 percent
to 23 percent (Statistics Canada, 2008b, 19). Thus, the
gap, in terms of percentage points, has grown from
14 to 15.
A more detailed analysis of the evolution of this
education gap over time—focusing in part on the
differences in education attainment by age group—
has been conducted by John Richards. Richards
notes that the difference in the educational attain-
ment between younger and older age groups within
the Aboriginal population is less pronounced than it
is among non-Aboriginals. More specifically, Abori-
ginal peoples between the ages of 25 and 34 are faring
little better in terms of post-secondary education than
their counterparts aged 35 to 44. This may indicate a
Table 2.VI.2 — Educational Attainment of Aboriginal and Non-Aboriginal Peoples Aged 25–64 (2006)
Non-AboriginalAboriginal
(All Groups)First Nations (All Groups)
First Nations, On-Reserve
First Nations, Off-Reserve Métis Inuit
Less than high school 15 34 38 50 30 26 51
High school diploma 24 21 20 15 24 24 13
Post-secondary qualification — all types
61 44 42 35 46 50 36
Trades certificate 12 14 13 13 14 16 13
College diploma 20 19 17 14 20 21 17
University below bachelor
5 3 5 4 3 4 2
University degree (bachelor or higher)
23 8 7 4 9 9 4
Source: 2006 census.

CHaPTer 2 — ParTiCiPaTion in PosT-seCondary eduCaTion: reCenT Trends 53
“disturbing…stagnation in intentions to undertake
post-secondary training among young Aboriginals”
(Richards, 2008, 6).
To be clear, the fact that educational attainment is
rising at a faster rate among young non-Aboriginal
Canadians does not mean that there has been no
improvement in the proportion of Aboriginal peoples
finishing high school and undertaking post-secondary
studies. It does mean, however, that the education
gap is widening rather than narrowing. Richards
concludes that “convergence across age groups at all
education levels is not taking place,” and in fact,
there is “a widening in Aboriginal/non-Aboriginal
gaps at all education levels” (Richards, 2008, 6; 9). This
is made evident in Figures 2.VI.9 to 2.VI.11.
Figure 2.VI.9 — Proportion of Population with a University Degree, by Age Group
0
5
10
15
20
25
30
Age 55–64 Age 45–54 Age 25–44
Non-AboriginalAboriginal
19
7
20
8
27
8
Source: 2006 census.
Figure 2.VI.10 — Proportion of Population with a Post-Secondary Credential, by Age Group
10
0
20
30
40
50
60
70
Age 55–64 Age 45–54 Age 25–44
Non-AboriginalAboriginal53
41
58
46
66
45
Source: 2006 census.

The Price of Knowledge: Access And sTudenT finAnce in cAnAdA54
The Urban/Rural DivideAccording to Shaienks and Gluszynski (2007), rural
youth are much less likely than urban youth to attempt
post-secondary studies (65 percent vs. 82 percent)
and, among those who do so, more likely to study at a
college or other non-university institution (60 percent
vs. 48 percent).
As part of the MESA project,14 Looker (2009) ex-
amines access to and persistence in post-secondary
education among rural and urban youth. Using
the younger YITS-A dataset, she offers an assessment
of participation and persistence rates in post-
secondary education at age 21, examining whether
rural/urban location plays a determining role in the
post-secondary decision-making process. Consistent
with Shaienks and Gluszynski, Looker finds that
urban youth are more likely to pursue post-secondary
education, noting that the gap exists principally at
the university level. As Figure 2.VI.12 demonstrates,
while 76 percent of urban youth had pursued higher
education at age 21 (58 percent went to university),
only 67 percent of rural youth had enrolled in post-
secondary education (46 percent in university) by the
Figure 2.VI.11 — Proportion of Population without a High School Degree, by Age Group
10
0
20
30
40
50
Age 55–64 Age 45–54 Age 25–44
Non-AboriginalAboriginal
43
22
16
32
11
34
Source: 2006 census.
13%
15%
Figure 2.VI.12 — Post-Secondary Participation by Urban/Rural Status at Age 21
UniversityNon-university PSEAbandoned
Urban youth
58%
18%
46%
21%
Rural youth
0%
20%
40%
60%
80%
100%
0%
4%
8%
12%
16%
Par
tici
pat
ion
Rat
e
Proportion of StudentsWho Abandoned Studies
Source: YITS-A from Looker, 2009.
14. Measuring the Effectiveness of Student Aid, or the MESA project, is a four-year research effort being conducted by the Educational Policy Institute and the School for Policy Studies at Queen’s University on behalf of the Canada Millennium Scholarship Foundation. Participating researchers were asked to write about issues of access and persistence in post-secondary education in Canada. Each of the papers commissioned during this project is available for downloading from the MESA project website at www.mesa-project.org.

CHaPTer 2 — ParTiCiPaTion in PosT-seCondary eduCaTion: reCenT Trends 55
same age. That said, the proportion of post-secondary
students who were still enrolled or had graduated
was virtually the same for the two groups (87 percent
for urban students; 85 percent for rural students).
Looker examines regional variation and suggests
that the nature of the post-secondary system (the
“articulated” systems in B.C. and Alberta allow stu-
dents to complete university credits at community
colleges; admission to a Quebec university for pro-
vincial residents is contingent on completion of a
CEGEP program) and the geographical distribution
of post-secondary institutions may play a role in
explaining why rural participation is higher in some
regions than others. However, her analysis con-
cludes that factors related to sex, minority status,
immigration, high school performance and parental
education and income account for much of the
rural/urban gap in post-secondary participation.
This suggests that the rural/urban difference can be
explained by differences in individual characteristics
not related to geography. However, when looking
exclusively at university participation, Looker finds
that rural/urban location remains a significant factor
even after controlling for the other characteristics.
This last finding echoes those of Frenette (2002,
2003; cf. Statistics Canada, 2004), who examined
how distance to a post-secondary institution affects
participation in college and university. He reports
that students who live more than 80 kilometres from
a university are less likely than those living close to one
to enrol in university studies. The effect of distance is
compounded for youth from low-income families.
Beyond 80 kilometres, high-income youth were
almost six times as likely as low-income youth to go
to university; within 40 kilometres, they were only
1.9 times as likely as low-income youth to enrol in
university studies. Frenette argues that the added
cost of moving to study, the emotional cost of leaving
one’s community and the lack of exposure to univer-
sities and university-educated adults might explain
the university distance gap.
On the community college side, Frenette points
out that Canada’s colleges are spread out much more
than its universities, such that 97 percent of high
school students live within 80 kilometres of a
community college. Students who live more than
40 kilometres away from a university are much more
likely than those living close by to study at a college.
The combined post-secondary participation rate
(university and college) for youth living more than
80 kilometres from a university is almost as high as the
rate for youth living close to a university. Frenette
concludes that the overall demand for higher edu-
cation is consistent regardless of distance, but the
choice of institution type is limited by geography.
ImmigrantsUntil recently, it has been very difficult to document
the different educational outcomes of second-
generation Canadians in any detail. The census tells
us that, as a group, immigrant Canadians have a
higher educational attainment than Canadians born
in Canada. Among the more than four million indi-
viduals born outside of Canada who were between
the ages of 25 and 64 in 2005, 32 percent had a uni-
versity degree. Fifty-one percent of immigrants who
arrived between 2001 and 2006 had a university
degree, compared to just 20 percent of the Canadian-
born population. Furthermore, this most recent wave
of immigrants has a higher level of educational
attainment than the population of immigrants that
preceded it. Among those who came to Canada
before 2001, 28 percent had a university degree.
While new immigrants are more likely to have com-
pleted a course of university study, they are less likely
than individuals born in Canada to have studied at
a college (11 percent vs. 22 percent) or to have com-
pleted a trades certificate (five percent vs. 14 percent).
Immigrants account for roughly one-quarter of
the working-age population (25 to 64), yet they hold
49 percent of Canada’s PhDs and 40 percent of
its master’s degrees.
The problem with these data is that they group all
immigrants together. Immigrants, however, are by no
means a homogeneous group, and while some types
may do exceptionally well in terms of accessing higher
education, others may not.
Fortunately, in the context of the MESA project,
Finnie and Mueller (2009) have used the YITS dataset
to get beyond this problem and examine the edu-
cational pathways of different groups of immigrants

The Price of Knowledge: Access And sTudenT finAnce in cAnAdA56
to Canada. They note that first- and second-generation
immigrants are more likely than non-immigrant
Canadian youth to pursue post-secondary education,
particularly at the university level. Careful not to
lump all immigrants to one group, they distinguish
among various regions of origin, including Africa, the
Americas (U.S. excluded), China, East and Southeast
Asia, “other” Asia, Western and Northern Europe,
Southern and Eastern Europe, the “Anglosphere”
(English-speaking Western countries) and others. As
Figure 2.VI.13 demonstrates, children of immigrants
from China, Asia and Africa, in particular, are more
likely than non-immigrant Canadians to pursue post-
secondary education, while those from the Americas
are less likely to enrol. Interestingly, Finnie and Mueller
are able to control for a number of important factors
that typically influence post-secondary participation,
including geography (province of residence, urban/
rural location), parental education levels, high school
grades, literacy scores and high school engagement.
While these factors explain a portion of the post-
secondary participation gap between immigrants
and non-immigrants, they do not explain all of it,
leading Finnie and Mueller to conclude that many
immigrant youth are more likely to enrol because of
“cultural factors, including a strong pro-PSE ethos.”
While it is tempting for policy-makers to target poli-
cies to all immigrants as if they were a homogeneous
group, the evidence reveals considerable variation in
the educational outcomes of first- and second-
generation immigrants, depending in large part on
their country of origin. While headlines about immi-
grants and education may generally be positive, many
immigrants to Canada slip through the cracks. Rather
than focus on immigrants as a whole, policy-makers
can benefit from turning their attention to those
groups who are at risk of falling behind.
0%
20%
40%
60%
80%
100%
ChinaOtherAsia
Africa Southernor Eastern
Europe
AllSecond
GenerationImmigrants
Non-Immigrants
East &Southeast
Asia
Western orNorthernEurope
Anglo-sphere
Americas(except
U.S.)
Trade or CollegeUniversityNo PSE
Figure 2.VI.13 — Post-Secondary Participation among Non-Immigrants and Second-Generation Immigrants to Canada by Age 21, by Region of Origin
88%
81%
5%
13%
7%
57%
36%
12%
57%
31%
18%
42%
40%
20%
36%
45%
24%
43%
33%
16%
54%
29%
28%
38%
34%
82%
2%
16%
68%
4%
28%
Note: The second-generation sample is restricted to children of parents who are both from the same region of origin.
Source: Finnie and Mueller, 2009.

CHaPTer 2 — ParTiCiPaTion in PosT-seCondary eduCaTion: reCenT Trends 57
Myth: Participation Rates Are Always What They Seem
perspective. Table 2.VI.3 explores the origin of Nova
Scotia’s high participation rate, which calculates
the share of a given population (in this case, 18- to
24-year-olds in the province) enrolled at a university
during the year in question. Nova Scotia’s high
participation rate, which hovers around 40 percent,
is consistently the highest in Canada. Yet it does not
accurately reflect the share of the province’s own
youth population pursuing university education.
Only 23 percent of those aged 18 to 24 were enrolled
at one of Nova Scotia’s ten public universities.
Another two percent studied at a university in the
other Maritime provinces, while a further two per-
cent enrolled outside the Maritimes.
Meanwhile, discussions of Quebec’s university
participation rates tend to obscure or overlook the
province’s unique post-secondary system, which
requires Quebec residents to complete a two-year
program at one of the province’s free CEGEPs
(general and technical instruction colleges) prior
One of the focal points of any discussion about
access to higher education in Canada concerns the
link between tuition and university enrolment. It
is often pointed out that Quebec, which has the
country’s lowest tuition, has the lowest university
participation rates, while Nova Scotia, which
features Canada’s highest tuition fees, leads the
country in participation rates. A 2005 editorial
in The Globe and Mail offers an example: “If low
university tuition fees were the enticement people
seem to think they are, Quebec would have the
highest per-capita enrolment in the country, and
Nova Scotia the lowest. But it’s the other way
around. Nova Scotia has the country’s highest
undergraduate tuition fees: nearly $6,000 a year.
It also has the highest participation rate: roughly
33 percent of young Nova Scotians” (Globe and
Mail, 2005).
A recent study by the Maritime Provinces Higher
Education Commission (2009) provides a useful
Table 2.VI.3 — Post-Secondary Participation in Nova Scotia
Number of students enrolled full-time in Nova Scotia, divided
by the provincial population aged 18–24
Number of students from Nova Scotia enrolled
full-time in Nova Scotia, divided by the provincial
population aged 18–24
Number of students from outside Nova Scotia enrolled
full-time in Nova Scotia, divided by the provincial
population aged 18–24
2002–03 38% 25% 13%
2003–04 40% 25% 15%
2004–05 40% 24% 16%
2005–06 40% 23% 17%
2006–07 39% 23% 16%
Source: Maritime Provinces Higher Education Commission, 2009.

The Price of Knowledge: Access And sTudenT finAnce in cAnAdA58
15. Of course, it may be that Quebec students are more or less likely to complete their studies within the prescribed timeframe (three years), although these data are not currently available.
16 Even after attempting to account for the pre-university CEGEP stream, it remains difficult to compare the situation in Quebec to that in other provinces, for two reasons. First, a CEGEP program is not necessarily a means to a university end; it is an end in itself. Students who complete a pre-university CEGEP program graduate with a college diploma, regardless of their particular course of study. Second, including university-bound CEGEP students in the university participation rate expands the number of years in which a student can be enrolled from four to five (two at CEGEP, three at university). Outside Quebec, most undergraduate university programs are four years in length.
Myth: Participation Rates Are Always What They Seem (continued)
that many of those who would abandon their
studies before completing a university program
may do so while still enrolled in CEGEP (or once
they have completed their CEGEP program).
Although it may seem absurd, it is reasonable to
conclude that a substantial number of university-
stream students in Quebec actually drop out before
taking a single university course (since, as we
describe in Chapter 3, most students who drop out
do so after their first year). Shaienks et al. (2008)
suggest that this explains Quebec’s having the
lowest university dropout rate in Canada (14, 25).
A true reflection of the province’s university
pathway would capture the population of a given
age group that is enrolled in either a pre-university
CEGEP program or a university program, in addition
to those who have attained a university degree. Such
a rate would provide a sense of the proportion of
the province’s youth who are seeking or have
acquired a university degree.16 Similar calculations
would be useful in other provinces, such as B.C.
and Alberta, where colleges offer university-
transfer programs, allowing students to apply
credits earned at the college level to a university
course of study. Table 2.VI.4 demonstrates
Quebec’s university-stream participation rate, using
data from 2004 and 2005. Counting only uni-
versity students, Quebec’s participation rate is
18 percent (19 percent if graduate students are
counted). However, once pre-university CEGEP
students are included, the university-stream
participation rate reaches 25 percent (27 percent
to enrolling in one of Quebec’s university pro-
grams (typically three years in length). This affects
the participation rates in the following way: A large
proportion of Quebec CEGEP students are in a pre-
university program, one designed specifically to
cover Grades 12 and 13. Unlike in other parts of
the country, what would be Grade 12 in Quebec is
not offered at the high school level and what would
be Grade 13 is not offered at universities. As a
result, the proportion of university-oriented post-
secondary students in Quebec is not reflected in the
participation rate, which omits those still in CEGEP.
Another way to think about this is as follows:
because university programs are typically shorter
in Quebec, there are fewer opportunities for
Quebecers to be enrolled. Essentially, there are
25 percent fewer university spaces, in the sense
that Quebec students typically enrol only three
times for one year each—as opposed to students
in the rest of the country who enrol four times.15
As a result, participation rates will skew lower in
Quebec, since students need to enrol for fewer
periods of study to complete their program. Need-
less to say, individual educational pathways are
more complicated than this thought experiment
suggests. However, it is clear that the unique post-
secondary system in Quebec has the unintended
effect of producing relatively low university parti-
cipation rates.
Futhermore, if we acknowledge that a signi-
ficant proportion of Quebec university-stream
students are enrolled at the CEGEP level, it follows

CHaPTer 2 — ParTiCiPaTion in PosT-seCondary eduCaTion: reCenT Trends 59
Myth: Participation Rates Are Always What They Seem (continued)
Table 2.VI.4 — Quebec University Stream Participation among 18- to 24-Year-Olds in 2004 (2005 for CEGEP Students)
StudentsParticipation
Rate
Undergraduate level 124,871 18%
Master’s level 10,027 1%
Ph.D. level 749 0%
Pre-university CEGEP 48,969 7%
Total 184,616 27%
18–24 Population 2004 697,823
18–24 Population 2005 685,005
Average 691,414
Note: Since university data are only available for 2004 and CEGEP data are only available for 2005, the combined participation rate uses the average population size of the two years as the denominator.
Source: MELS, 2008.
if graduate students are included). This is much
closer to the actual rate for Nova Scotian students,
as noted above.
Comparing participation rates across provinces,
which offer post-secondary systems that are if not
unique then certainly idiosyncratic, can be some-
thing of a fool’s errand. We have nevertheless
made an effort to craft a rate that better reflects
the true composition of the student population.
Drawing quick conclusions from a glance at the
headline figures, especially when the links between
tuition and participation are not as clear or as
evident as we may think,17 may serve to detract
from—and not contribute to—the discussion of
access to post-secondary education in Canada.
17. See Chapter 2 of the third edition of The Price of Knowledge for a longer discussion.

The Price of Knowledge: Access And sTudenT finAnce in cAnAdA60

61
This chapter has reviewed Canada’s achievements
both in terms of educational attainment and the
policy challenges that remain.
Despite our success at ensuring the majority of
youth access post-secondary education, according
to the data that we have presented post-secondary
participation rates have actually been declining in
recent years. This decline has been masked by the
growth in the size of the youth population—the
so-called “baby boom echo”—which meant that
enrolment kept growing even as participation rates
declined. What will happen next is difficult to predict
with certainty. On the one hand, the size of the youth
population will soon begin to decline, making growth
in enrolment much more difficult to sustain. Indeed,
the most recent data already show signs of enrolment
decline. On the other hand, the recent downturn in
the economy may make the labour market a much
less attractive option to young Canadians than it has
been in recent years. A greater proportion of high
school graduates may opt for post-secondary studies,
resulting in an increase in participation rates. While
this may counteract the effect of the demographic
shift in the short term, in the medium term it seems
unwise to base education policy on the hopes of a
delayed economic recovery. We need to find other
ways of encouraging post-secondary participation,
especially among those currently underrepresented
on college and university campuses.
The economic cycle notwithstanding, therefore,
we need to remain focused on the question of how to
increase post-secondary participation, which means
paying particular attention to the situation of those
groups that are least likely to enrol in college or uni-
versity. Unfortunately, this chapter also confirms
that little progress has been made in recent years
in making access to post-secondary education
more equitable. Youth from higher-income families
are still twice as likely to go to university as are
those from lower-income families. The gap that sep-
arates the educational outcomes of Aboriginal youth
from those of their non-Aboriginal counterparts is
not closing. New data also confirm what many in
Canada’s urban areas already know first-hand: that
not all immigrant groups have above-average edu-
cational outcomes.
Simply put, the job of ensuring that Canada is
prepared for the challenges that lie ahead is far from
complete. One key to doing so will be ensuring that
each member of each new generation, regardless
of family background, benefits from an equal
opportunity to participate in higher education.
One question that remains, however, is whether it
is reasonable to have expected that the access gaps
that are evident in Canada would have narrowed
since the early 1990s. Some might argue that given
the increase in the cost of post-secondary education
during that time (and especially during the 1990s),
access should have become less equitable. Others
might point to the reinvestments in student assistance
by both federal and provincial governments, begin-
ning in the late 1990s and continuing throughout
most of the current decade, as a reason to think that
the opposite should have occurred. Then there is the
pull of the labour market to consider. Those in com-
fortable economic circumstances can afford to delay
their entry into the labour market to allow time to
obtain a post-secondary credential. When times are
good and employees in demand, however, it is more
difficult for people from low-income families to turn
Chapter 2
VII. Conclusion

The Price of Knowledge: Access And sTudenT finAnce in cAnAdA62
down the opportunity to earn income as soon as they
can, even if this means forgoing further education.
Other things being equal, then, it may be more difficult
to improve the equity of access during periods of
economic growth, such as the one that Canada has
experienced until just recently. Finally, there is the
question of whether significant improvements in
access for underrepresented groups of students
simply depend on the existence of a range of policies
that go beyond those that are currently in place, such
as student financial assistance programs.
These are the types of difficult policy questions that
we will return to in the later chapters of this volume.

Persistence in Post-Secondary EducationAndrew Parkin and Noel Baldwin
The Price of KnowledgeAccess and Student Finance in Canada
3

65
The most important immediate outcome of entry into
post-secondary education is graduation. Colleges and
universities traditionally put considerable effort into
the recruitment of new students, while governments
have made facilitating access to higher education a
priority. If these efforts are to bring maximum bene-
fits in the long run, however, the students brought
into post-secondary education must be successful
in their studies. This success cannot be taken for
granted. Indeed, the question of how students fare
after initial entry into post-secondary studies has
become increasingly important as participation in
higher education has grown. As a recent OECD
report puts it, “the growing portion of disadvantaged
students enrolled in tertiary education makes the
ongoing issue of their retention and programme
completion an increasing[ly] important concern in
tertiary education” (Santiago et al., 2008, p. 50).
This chapter concerns itself with the issue of
persistence, defined here as the ability of students to
continue their post-secondary studies from one year
to the next and ultimately to proceed to the comple-
tion of their program. It should be recognized at the
outset that poor persistence is not always a bad out-
come. For a host of reasons, discontinuing studies
may be the most appropriate course of action for
certain individuals (Grayson & Grayson, 2003, p. 9).
Generally speaking, however, “although ‘dropping
out’ is not necessarily an indicator of failure from the
perspective of the individual student, high drop-out
rates may indicate that the education system is not
meeting students’ needs” (OECD, 2008, p. 92).
More specifically, low levels of persistence pose
a problem for students, institutions and societies.
For students, the failure to complete their program
of study leaves them without a credential that would
lead to greater earnings and opportunities. For insti-
tutions, low levels of persistence may signal the poor
use of resources (e.g., resources spent on recruitment
and admission are not matched by continuing income
in the form of tuition and per-student government
funding) or poor performance in terms of teaching
or administration. For societies, poor persistence
results in lower educational attainment at a time
when higher levels of education are important to
both prosperity and quality of life. To the extent that
specific groups have lower rates of success in post-
secondary education than others, poor persistence
can also exacerbate social inequities that are costly
to society.
For these reasons, persistence is an issue of
concern to policy-makers. Fortunately, as will be
discussed below, policy-makers in Canada can now
benefit from a significant amount of new research on
the persistence of Canadian post-secondary students.
Both the availability of new data (most notably from
Statistics Canada) and the considerable investment in
recent years in research on access and student success
by the Canada Millennium Scholarship Foundation
has allowed the issue to be explored in more depth
than ever before. The goal of this chapter is to review
the latest Canadian research on persistence rates and
determinants of student success and to offer some
reflections on the performance of Canada’s post-
secondary system.
The data presented here will show that between
one in five and one in ten students in Canada who
access post-secondary education leave without com-
pleting their program of study. Many more take longer
than expected to graduate. Of course, for certain
groups of students—that is to say, more marginal
students whose success must be ensured if we are
to improve educational outcomes in Canada—
persistence rates are lower. This is the challenge to
which educators must respond: to act to ensure that
all those who enter post-secondary education have
the opportunity to succeed. As we will demonstrate,
the efforts of post-secondary institutions to respond
to this challenge—by putting in place support services
for students at-risk of discontinuing their studies—
can be bolstered by the lessons learned through
demonstration projects already underway.
65
Chapter 3
I. Introduction

The Price of Knowledge: Access And sTudenT finAnce in cAnAdA66
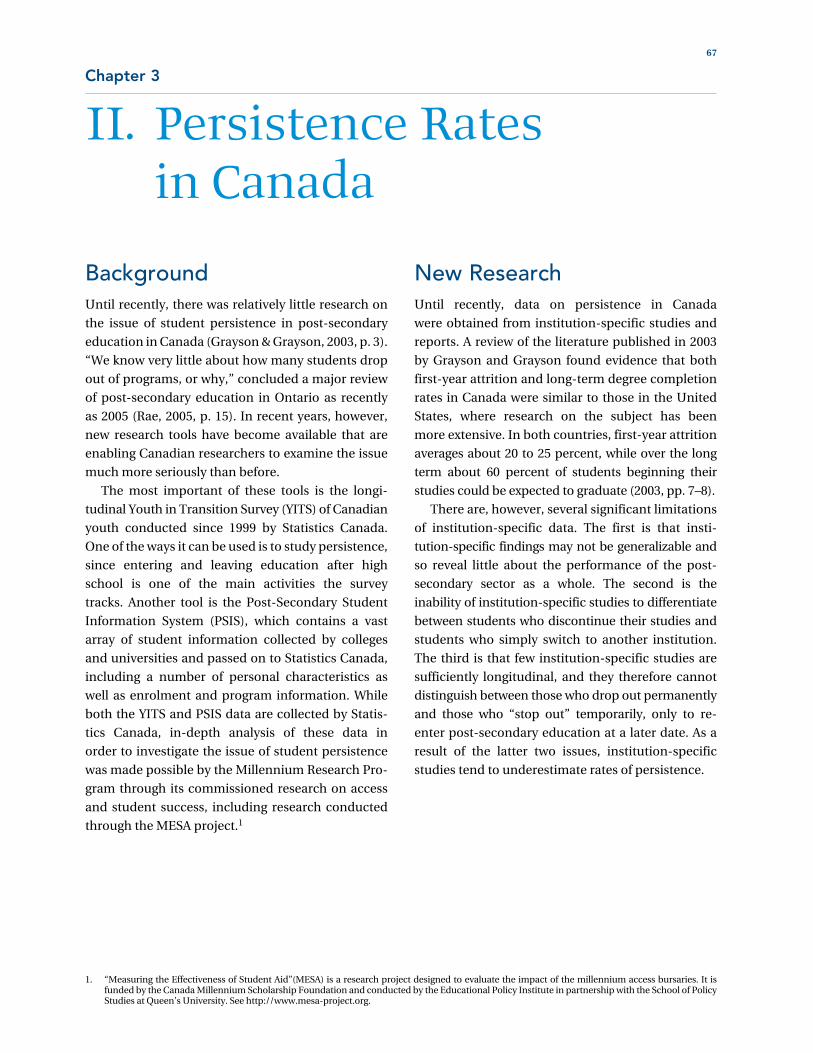
67
BackgroundUntil recently, there was relatively little research on
the issue of student persistence in post-secondary
education in Canada (Grayson & Grayson, 2003, p. 3).
“We know very little about how many students drop
out of programs, or why,” concluded a major review
of post-secondary education in Ontario as recently
as 2005 (Rae, 2005, p. 15). In recent years, however,
new research tools have become available that are
enabling Canadian researchers to examine the issue
much more seriously than before.
The most important of these tools is the longi-
tudinal Youth in Transition Survey (YITS) of Canadian
youth conducted since 1999 by Statistics Canada.
One of the ways it can be used is to study persistence,
since entering and leaving education after high
school is one of the main activities the survey
tracks. Another tool is the Post-Secondary Student
Information System (PSIS), which contains a vast
array of student information collected by colleges
and universities and passed on to Statistics Canada,
including a number of personal characteristics as
well as enrolment and program information. While
both the YITS and PSIS data are collected by Statis-
tics Canada, in-depth analysis of these data in
order to investigate the issue of student persistence
was made possible by the Millennium Research Pro-
gram through its commissioned research on access
and student success, including research conducted
through the MESA project.1
New ResearchUntil recently, data on persistence in Canada
were obtained from institution-specific studies and
reports. A review of the literature published in 2003
by Grayson and Grayson found evidence that both
first-year attrition and long-term degree completion
rates in Canada were similar to those in the United
States, where research on the subject has been
more extensive. In both countries, first-year attrition
averages about 20 to 25 percent, while over the long
term about 60 percent of students beginning their
studies could be expected to graduate (2003, pp. 7–8).
There are, however, several significant limitations
of institution-specific data. The first is that insti-
tution-specific findings may not be generalizable and
so reveal little about the performance of the post-
secondary sector as a whole. The second is the
inability of institution-specific studies to differentiate
between students who discontinue their studies and
students who simply switch to another institution.
The third is that few institution-specific studies are
sufficiently longitudinal, and they therefore cannot
distinguish between those who drop out permanently
and those who “stop out” temporarily, only to re-
enter post-secondary education at a later date. As a
result of the latter two issues, institution-specific
studies tend to underestimate rates of persistence.
1. “Measuring the Effectiveness of Student Aid”(MESA) is a research project designed to evaluate the impact of the millennium access bursaries. It is funded by the Canada Millennium Scholarship Foundation and conducted by the Educational Policy Institute in partnership with the School of Policy Studies at Queen’s University. See http://www.mesa-project.org.
Chapter 3
II. Persistence Rates in Canada

The Price of Knowledge: Access And sTudenT finAnce in cAnAdA68
Information on persistence in Canada has greatly
improved as a result of the availability of the
aforementioned YITS data, which has tracked the
behaviour of a cohort of youth over time at two-year
intervals since 1999. Data obtained from a longitudi-
nal study of a national sample of youth overcome
all three limitations of institution-specific data
mentioned above (see Finnie & Qiu, 2008, p. 181 ff.).
The data from the so-called “YITS-B” cohort of
youth aged 18 to 20 in 1999 provide five separate
“snapshots” of their status at successive two-year
intervals. The results show increases over time in
the proportion participating in post-secondary edu-
cation, as well as the proportion discontinuing their
studies (see Table 3.II.1). The post-secondary drop-
out rate rises significantly between the ages of 18 to
20 and 20 to 22 before stabilizing at 11 to 12 percent
of all youth or about 15 percent of those who begin
post-secondary studies.
The 15 percent figure represents the proportion of
post-secondary students who had discontinued their
studies and not returned at the time of the fifth wave
of the survey. The proportion of students who had
ever dropped out of a program of study would, of
course, be higher. As the YITS survey makes clear,
many of those who discontinue their post-secondary
studies do so only temporarily. For example:
• Shaienks, Eisl-Culkin and Bussière report that of
those who had dropped out relatively early in their
studies (i.e., by the time they were 18 to 20 years
old), 35 percent returned within two years and
46 percent returned within four years. One in
four graduated within four years of their initial
decision to discontinue (2006, p. 15, 38, Table C5).
• Similarly, Finnie and Qiu find that “by one year
after first having left school, 22.3 percent of college
leavers and 35.6 percent of university leavers have
returned. By three years later… the returns stand
at 40.3 percent and 54.0 percent, respectively, for
college and university leavers. These are substan-
tial numbers” (2008, p. 193).
Table 3.II.1 — Change in Post-Secondary Education Status over Time
Age of Youth
% of All Youth* Discontinued Post-Secondary Studies
(% of Youth Having Participated in
Post-Secondary Studies)
Graduated from Post-Secondary
Studies
Continuing Post-Secondary
Studies
Never Enrolled in
Post-Secondary Studies
Discontinued Post-Secondary
Studies (% of all Youth)
18–20 7% 43% 45% 5% 9%
20–22 23% 38% 28% 11% 15%
22–24 45% 19% 23% 12% 16%
24–26 60% 7% 21% 12% 15%
26–28 66% 4% 19% 11% 14%
*NB: Rows may not total 100% due to rounding.
Source: Shaienks and Gluszynski, 2009; authors’ calculations.

CHaPTer 3 — PersisTenCe in PosT-seCondary eduCaTion 69
• Finally, Martinello’s analysis of the same data
shows that of the 40 percent of university under-
graduates who did not complete their initial
program of study within the YITS survey tracking
period, 78 percent entered a second program;
for college students, the figures are 47 percent and
65 percent respectively (2008, Figures 1 and 3,
pp. 219–221). Thus only about one in five students
who did not complete their first university program
ended their post-secondary education at that point;
the equivalent figure for college students is roughly
one in three. The remainder either transferred
directly to another program or institution or re-
enrolled, after a period away from studies, within
the tracking period covered by the survey.
It is thus possible to calculate different rates of
persistence and discontinuation depending on how
this movement of students into, out of and around
the post-secondary system is treated. For example, a
separate analysis of the same YITS-B data examines
the proportion of students who by the time they had
reached the age of 24 to 26 (i.e., the fourth wave of the
YITS study) had dropped out of either the college or
university “stream” of post-secondary education and
not returned to that stream. This approach yields a
drop-out figure of 21 percent, including 16 percent
of those who had started at university and 25 percent
of those who had started at college (Shaienks,
Gluszynski & Baynard, 2008). The difference between
this figure of 21 percent and the previously noted
figure of 15 percent is explained by the fact that a
number of students who discontinue a university
program go on to enrol in college, or vice versa. These
students therefore are not “true” dropouts, in that
they return to post-secondary education (albeit in
another stream).
Any attempt to calculate “true” rates of persistence
and discontinuation has to go beyond the “snap-
shot” approach that simply reports students’ status
at a given moment in time, while at the same time
fully taking into account both the switching of pro-
grams, institutions and post-secondary education
streams and the tendency of many students to “stop
out” and subsequently return to their studies. Such an
endeavour has recently been completed by Finnie
and Qiu (2008). Using the YITS-B data, they calculate
the likelihood of students graduating within a specific
time period, regardless of whether or not they
switched or stopped out at some point along the way.
Finnie and Qiu’s findings show that 82 percent of
university students continue with their original pro-
gram of study (or, in a very small number of cases,
graduate) after the first year, as do 74 percent of col-
lege students (2008, p. 191, Table 2). Of the remaining
18 and 26 percent respectively, a relatively small
number switch programs within the same institution.
Excluding these “within institution” switchers, this
means that universities lose about 14 percent of their
students and colleges about 20 percent after the first
year of study. Yet about half of these university stu-
dents and a third of these college students in
fact continue their studies elsewhere—they simply
switch institutions. The real proportion of those who
leave post-secondary education after their initial
year of studies is 7.9 percent for university students
and 12.9 percent for colleges.
Taking their analysis further, Finnie and Qiu
calculate that while only 54 percent of university stu-
dents and 58 percent of college students graduate
from their original program within five years, many
of the remaining students either continue in that
program or, if they discontinue it, switch programs
within the same institution or switch institutions.
Some of these continuers and switchers stop out
for a period of time before returning. Relatively few
non-graduates can therefore be accurately classified
as “dropouts.”
From an institutional perspective (counting stu-
dents who have switched programs within the same
institution as continuers rather than leavers), the
five-year drop-out rate is 26 percent for university
students and 32 percent for college students
(2008, p. 191, Table 2). The remainder (i.e. 74 percent
and 68 percent of university and college students
respectively) have either graduated or are continuing
in their original program or another program within

The Price of Knowledge: Access And sTudenT finAnce in cAnAdA70
the same institution. These drop-out rates, however,
still do not take into account those who switch insti-
tutions or who stop out and subsequently re-enrol
in another program or institution at a later date and
who thus are not true dropouts. Once all these
“switchers” and “stop-outs” are taken into account
and reclassified as either graduates or continuers,
the five-year drop-out rate falls to 10 percent for uni-
versity students and 18 percent for college students
(see Table 3.II.2). This represents by far the best esti-
mate of overall persistence rates currently available
in Canada, at least for young adults.
Note that drop-out rates change relatively little
after the second year. This does not mean that virtu-
ally no one drops out after year two. It means rather
that after year two, the system has reached a kind of
“steady state” in which the number of new drop-outs
is roughly equally to the number of previous drop-
outs who have come back to school. The data do
confirm, however, that most discontinuation occurs
in the early years of study.
It should also be noted that these data pertain
only to the “YITS-B” cohort of youth who were 18 to
20 years old in 1999 and who were tracked until they
were 24 to 26. The sample therefore is not represen-
tative of the general post-secondary population,
which includes students who enrol for the first time
in their late twenties or even later. It can be assumed
therefore that the results presented here are some-
what more positive than what could be expected
for the general post-secondary population, since,
as will be discussed below, older students tend to
have more trouble persisting. In this context, it is
interesting to note that Finnie and Qiu have recently
made a first attempt to conduct the same analysis
using the data from the “YITS-A” cohort of youth
who were 15 years old in 1999. Their analysis shows
that, on the whole, three-year graduation rates and
drop-outs rates from college and university are
remarkably similar to those reported for the slightly
older “YITS-B” cohort, although some specific results
are slightly more positive, as could be expected for
students of a younger age. For instance, the three-
year graduation rate for the younger YITS-A college
studentsis 62 percent, compared with 57 percent for
the YITS-B students (Finnie and Qiu, forthcoming).
In a separate study of the persistence and mobility
of students in Atlantic Canada, using data from
the Post-Secondary Student Information System
(PSIS), Finnie and Qiu are once again able to confirm
Table 3.II.2 — Overall Persistence Rates of Young Adults in Post-Secondary Education in Canada*
GraduatedStill in Post-Secondary
EducationDiscontinued
Post-Secondary Education
College
Year 1 12.0% 75.2% 12.9%
Year 2 36.9% 45.8% 17.3%
Year 3 57.0% 25.1% 17.9%
Year 4 66.2% 14.8% 19.0%
Year 5 73.1% 8.8% 18.0%
University
Year 1 1.1% 91.0% 7.9%
Year 2 3.6% 86.7% 9.6%
Year 3 11.2% 78.8% 9.9%
Year 4 45.0% 45.2% 9.8%
Year 5 69.4% 20.4% 10.2%
*Note: Columns may not total 100% due to rounding.
Source: Finnie & Qiu, 2008, p. 197, Table 6.

CHaPTer 3 — PersisTenCe in PosT-seCondary eduCaTion 71
2. The PSIS data set consists of administrative data collected from all of Canada’s public post-secondary colleges and universities. Each student who registers at a public post-secondary institution has a data record in PSIS for each year. More information on PSIS can be found at: http://www.statcan.gc.ca/concepts/psis-siep/index-eng.htm.
the same general pattern.2 They analyze the patterns
of students enrolled in the twenty-two public post-
secondary institutions in Atlantic Canada over a
period covering the academic years 2001–02 to
2004–05. The nature of the PSIS data (individual
records for each student in each year of study) allows
longitudinal student records to be created by linking
each student file across the years of the dataset. The
PSIS data project was initially piloted in the four
Atlantic provinces; thus, the most extensive and
robust data were available for that region. Statistics
Canada also prioritized the processing of the Atlantic
college PSIS data for this project, which allowed PSIS
university and college data to be linked together for the
first time.
Looking at first-year transition rates using a
restricted sample of first-time entrants to post-
secondary education aged 17 to 20, Finnie and Qiu
find that 79.8 percent of university undergraduate
students continued their studies at the same institu-
tion into second year. In the college sector, 23.5 percent
of students graduated after one year while 52.6 per-
cent continued their studies at the same institution
into second year. Only 5.1 percent of university
undergrads and 1.3 percent of college students
switched institutions after their first year. Finally, the
PSIS first-year university leaving rate is 15.1 percent,
and the first-year college leaving rate is 22.6 percent
(see Table 3.II.3). (Note that by accounting for
“switchers” the institutional drop-out rate of 20.2 per-
cent for university students falls significantly to the
“true” drop-out rate of 15.1 percent.)
The data also show that an additional group of
students who made it past first year drop-out in the
second year of study and that the cumulative drop-out
rate after two years of study is 24.5 percent and 33 per-
cent for university and college students respectively
(Finnie and Qiu, 2009, Table 3). Two years after
enrolling, 66.4 percent of university students were still
studying at the same institution, as were 13.1 percent
of college students; a little over half of college students
have graduated (see Table 3.II.3).
These drop-out rates are higher than those
derived from the YITS sample as reported above.
This difference is explained by differences between
the two datasets and by limits that apply to the PSIS-
based study but do not apply to the YITS-based one.
First, the PSIS-based data does not take account of
those who “stop out” of their studies or return after
having discontinued. This results in higher leaving
rates. Secondly, in the nationwide YITS study, students
can be tracked across provincial boundaries as long
as they continue to respond to the surveys being
applied. However, while PSIS itself is a national
Table 3.II.3 — Cumulative Transition Rates After Two Years for Students Entering Atlantic PSE Institutions (17- to 20-Year-Olds)
Continuers Graduates Switchers Leavers
University
Year 1 79.8% 0.1% 5.1% 15.1%
Year 2 66.4% 0.7% 8.4% 24.5%
College
Year 1 52.6% 23.5% 1.3% 22.6%
Year 2 13.1% 52.2% 1.7% 33.0%
Note: Unlike the figures in Table 3.II.2, these figures do not account for students who return to studies after leaving.
Source: Finnie & Qiu, 2009, Table 5.

The Price of Knowledge: Access And sTudenT finAnce in cAnAdA72
database, Finnie and Qiu did not have access to
student records west of New Brunswick for their
analysis. Any student who left the four Atlantic pro-
vinces was lost to the study and would appear in this
study as a “leaver.”
In order to check the validity of the PSIS-based
results, Finnie and Qiu re-ran their YITS-based results
but with a restricted YITS sample that would more
closely resemble the PSIS one. Once this is done,
the results appear more similar (see Table 3.II.4).
The similarity between the rates observed in the two
data sets is a positive confirmation of each study’s
findings.
The study of the Atlantic region confirms again
that somewhere between one in ten (university)
and one in five (college) post-secondary students
are not persisting past the early years of study. These
figures—which take into account the effect of
switching institutions and, in the case of the original,
larger YITS study, “stopping out” (or leaving and
returning)—are perhaps not as high as previous
institution-based studies had indicated. Nonethe-
less, it represents significant lost opportunities for
individuals, for institutions, and for society. In the
next section, we take up the questions of who is
discontinuing their studies, and why.
Table 3.II.4 — First-Year Transition Rates in the Atlantic Region in YITS and PSIS
Continuers Graduates Switchers Leavers
University
PSIS 79.8% 0.1% 5.1% 15.1%
YITS 81.2% 0.4% 7.8% 10.5%
College
PSIS 52.6% 23.5% 1.3% 22.6%
YITS 50.4% 27.1% 2.1% 20.4%
Note: The YITS sample here is restricted to more closely match the PSIS population and therefore differs from the one used to produce Table 2, above. Note also that, unlike in Table 3.II.2, these figures do not account for students who return to studies after leaving.
Source: Finnie & Qiu, 2009, Table A.4.1.

73
3. One source included in the research summarized in this section is not in fact Canadian. A review of the link between persistence and student finan-cial aid published recently by Don Hossler and his colleagues focuses almost exclusively on the American experience. However, as it summarizes the conclusions of a wide range of studies, we have decided to include it in our discussion where relevant.
Different studies tend to offer somewhat different
portraits of the attributes and factors associated with
dropping out. Conclusions reached by one study are
not always replicated in others (Grayson & Grayson,
2003, p. 31). Moreover, studies often lack the instru-
ments or the sample to allow them to assess with
precision the importance of certain key factors, such as
the type or amounts of student financial aid received
by students or students’ ethno-cultural or socio-
economic backgrounds. While these points and the
need to avoid what Grayson and Grayson call the
attempt to “fabricate” generalizations should be kept
in mind, several patterns can nonetheless be derived
from the Canadian literature on persistence reviewed
for this chapter.3
Gender, age and dependants: Men are more likely
to drop out than women, and older students and stu-
dents with dependent children or who become
parents during their studies have greater difficulty
persisting.
Academics: Academic performance and engage-
ment at both the high school and post-secondary
level are associated with persistence (see for example
Ma and Frempong, 2008). Simply put, grades are a
very strong predictor of who is likely to succeed in
their post-secondary studies and who is likely to dis-
continue. As Shaienks, Gluszynski and Bayard (2008,
p. 20) report with respect to high school grades and
studying habits, “learning habits are developed early
and often persist with progressive levels of education”
(see Figure 3.III.1). While weaker and less engaged
0
5
10
15
20
25
30
35
40
59% and less 60%–69% 70%–79% 80%–89% 90%–100%
38
27
18
11
22
14
7
34
Figure 3.III.1 — Percentage of Post-Secondary Students Aged 24 to 26 Who Discontinued Their Original Post-Secondary Stream* by Grade Average in High School
College StreamUniversity Stream
30
* Note: While some of these students discontinued their studies, others switched streams.
Source: Shaienks, Gluszynski & Bayard, 2008.
Chapter 3
III. Who Leaves Post-Secondary Education and Why?

The Price of Knowledge: Access And sTudenT finAnce in cAnAdA74
students are less likely to persist, however, Shaienks
and Gluszynski emphasize that a significant portion
of capable students nonetheless drop out (2007).
Parental income: The Canadian literature offers
little insight into whether parental income is corre-
lated with persistence. The YITS data analyzed to date
are of little help in this regard because they contain
no information on parental income. Parental income
data is collected for a younger cohort of youth
(YITS-A), but their progress through post-secondary
education has yet to be fully tracked. (An early
attempt to analyze persistence using the YITS-A data
by Finnie and Qiu suggests that youth from higher
income families are less likely to drop out of college
programs (Finnie and Qiu, forthcoming).)
Financial aid: It appears that receiving need-
based student assistance in the form of loans or
grants can improve persistence. At the same time,
students whose financial aid package is not adequate
to cover the actual cost of studying or who accumu-
late high levels of debt are less likely to complete
their studies (Grayson & Grayson, 2003, p. 34.;
Hossler et al., 2008; McElroy, 2004, 2005a, 2005b,
2008a). This suggests that within a financial aid
package, the non-repayable grant component, which
can limit the accumulation of debt by substituting
for loans or alternatively provide extra funds not
provided through loans, is the key component in
encouraging persistence. As Hossler et al. put it,
“loans are not as effective as grants in enhancing
persistence” (2008, p. 102). This conclusion is
consistent with those reached by Lori McElroy in
the context of her studies of the impact of the intro-
duction of millennium bursaries in Canada in 2000
(for a summary of McElroy’s studies, see Canada
Millennium Scholarship Foundation, 2006). It is
interesting to note, however, that according to
Hossler and his colleagues, the real effect of financial
aid (especially grants) on persistence is an “indirect”
one, in that it allows students to work less, worry less
and focus more on the various components of stu-
dent life. They explain: “the most beneficial effect
of financial aid may be that it increases students’
freedom to become more engaged in the academic
and social environments of the institutions they
attend. This may in turn lead to increased student per-
sistence” (Hossler et al., 2008, p. 111; see also p. 103).4
Parental education: The relationship between
persistence and parental education is unclear. An
analysis of YITS data prepared for this chapter shows
that the proportion of students who drop out of
college or university five years after beginning their
studies decreases as parental education increases.
Specifically, 21 percent of those whose parents did
not complete high school dropped out, compared
with 12 percent of those whose parents completed
university. As Finnie and Qiu point out, however, the
relationship holds more strongly for college students
and is not so evident in the case of university stu-
dents (2008, p. 201).5 Other studies offer a slightly
different view. Given the important influence of
parental education in the initial decision of youth
to pursue a post-secondary education, Shaienks and
Gluszynski find it interesting that in their analysis
“drop-out rates did not differ significantly between
students whose parents held various educational
attainments” (2007, p. 18). This is confirmed through
further analysis of the YITS data conducted by
Martinello, who notes that “surprisingly, parents’
education and the importance of PSE to parents
were unrelated to students’ success in their first pro-
gram” (2008, p. 230; 235). According to Martinello,
however, parental education is related to the decision
of students to re-enrol after initially discontinuing
their studies, a point that is discussed further below.
Career guidance: There is some evidence that
certainty about career goals positively affects persis-
tence. In other words, students are more likely to
stay in school when there is a clear connection in
their minds between their studies and their intended
career path (Berger, Motte & Parkin, 2007, p. 40;
Canadian Career Development Foundation, 2007,
p. 21; Grayson & Grayson, 2003, p. 28).
Aboriginal status: Until recently, there has been
little solid quantitative evidence available about the
persistence of Aboriginal students. This has been
the case despite the fact that the lower educational
participation and attainment rates of Aboriginal
4. Note that these hypotheses will be explored further in the final report from the MESA project, which will be published in 2010.
5. Finnie and Qiu speculate that the weaker effect of parental education on university persistence compared with access could be the result of a “selection effect”: “once students are selected into the university system, further background effects are nullified because they are an especially talented, accomplished group who have overcome the barriers that often prevent others of their type from making this start, and are therefore able to overcome any additional challenges they may face as they advance through their studies” (2008, p. 201).

CHaPTer 3 — PersisTenCe in PosT-seCondary eduCaTion 75
students are well documented (see, for example,
Berger, Motte & Parkin, 2007, pp. 20–22), as is the
scale of the obstacles facing Aboriginal students
(Malatest & Associates Ltd., 2004, p. 1). Analysis pre-
pared for this chapter confirms that the persistence
rates of those Aboriginal students who do embark on
post-secondary studies are lower than those of their
non-Aboriginal counterparts (see Figure 3.III.2). The
drop-out rate of Aboriginal post-secondary students
is between 33 and 56 percent higher (depending on
the age of students) than the rate for non-Aboriginals.
Higher drop-out rates for Aboriginal students are
also reported by Shaienks, Gluszynski and Bayard
(2008). It should be noted, however, that the YITS
sample excludes First Nations youth living on
reserve. Since these students tend to face the
greatest obstacles in moving through the education
system, the figures presented here, if anything, can
be said to overestimate the persistence rates of
Aboriginal students as a whole.
In addition to studying the demographic, be-
havioural and attitudinal factors associated with
persistence, researchers in Canada have also reported
students’ own explanations. One study of students
two years after their final year of secondary school
found that among those who had already dis-
continued post-secondary studies, lack of interest
in their studies (29 percent) or the program not
meeting expectations (27 percent) were the reasons
most likely to be cited for dropping out. An addi-
tional 14 percent said they were undecided about
their career. Taken together, reasons related to a lack
of interest or satisfaction with their program or a lack
of direction in their career were cited as the reason
for discontinuing studies by 52 percent of dropouts.
Financial reasons were cited by one in five (22 per-
cent) of those who discontinued studies, while
academic difficulties were cited by 12 percent
(Berger, Motte & Parkin, 2007).
These findings are in line with those derived from
the first two waves of the YITS study, which suggest
that “among youth who had left post-secondary
education without completing their program, the
major reason cited related to a lack of program fit…
Ultimately, a notable proportion of post-secondary
leavers stated that they had done so either because
they didn’t like their program or their program
wasn’t ‘for them’ or because they were going to
change programs or schools” (Lambert et al., 2004,
p. 19). Specifically, one-third of those who left their
studies did so because they did not like their pro-
gram or did not feel it fit with their interests. Another
nine percent left to change schools or programs.
Financial reasons were the next most important
reason: 11 percent of those who discontinued their
studies did so because they did not have enough
money. These results are echoed by those produced
by Finnie and Qiu, who find that “students leave
school mostly because the schooling is judged not to
be the right thing for them or they want to do other
things such as work, make a change or take a break”
(2008, p. 193).
Some refinement of these findings is provided by
Shaienks and Gluszynski, who examine those who had
dropped out by age 24 to 26 according to whether or
not they had to borrow to finance their post-secondary
0
5
10
15
20
25
18–20 20–22 22–24 24–26
9
21
16
23
15
20
14 14
Figure 3.III.2 — Percentage of Post-Secondary Students Who Have Discontinued Their Studies (by Age Group and Aboriginal Status)
Non-Aboriginal StudentsAboriginal Students
Note: The YITS sample excludes First Nations youth living on reserve.
Source: YITS (Cohort B)—special calculation.

The Price of Knowledge: Access And sTudenT finAnce in cAnAdA76
education. They find that for students who did not bor-
row, the most likely reason offered for discontinuing
their studies remains that they did not like their pro-
gram. For those who borrowed, on the other hand,
dissatisfaction with the program and not having
enough money were equally likely to be mentioned
(2007, pp. 21–22). This difference between the reasons
offered by different groups of students again points to
the difficulties associated with trying to develop
general explanations that apply to all students who
leave post-secondary education.
Finally, there is new evidence that even institutions’
own administrative procedures, such as the timing of
course withdrawal dates and tuition refund policies,
can affect persistence (Martinello, 2009).
We can summarize this review of the research on
who drops out and why by noting that, while different
studies of persistence may stress different individual
factors that affect student outcomes, they all agree
that a variety of factors are at play. This observation
leads to the conclusion that policy responses should
be comprehensive in scope. Thus Grayson and
Grayson argue that “attrition should be addressed
systematically throughout the university rather than
through isolated policies implemented by various
departments of a college or university” (2003, 39),
while Berger, Motte and Parkin maintain that:
Specific interventions designed to alleviate a
narrow set of barriers—by targeting one kind
of barrier, such as academic ability—will
be limited in their effectiveness because
they leave the other sources of the problem
untouched. Interconnected barriers need
solutions that are wide in scope and that
include elements of academic support,
financial assistance, and the provision of
information and encouragement. (2007, 34)
Similarly, with specific reference to Aboriginal stu-
dents, Malatest writes that “no program or initiative
will be effective unless it factors in the entire scope
of barriers.” (Malatest, 2004, 11).
Myth: PSE Continuers “Get it Right” on Their First Try
therefore, is not that those who persist achieved
optimal “program fit” on their first try but that
they were able to make an adjustment that led
them to stay enrolled.
It is in this context that Martinello’s findings on
the influence of parental education become espe-
cially important. As noted above, Martinello finds
that parents’ education was unrelated to students’
success in their first program. He finds, however,
that “for students who stopped their first pro-
gram…Parents’ education was positively and
significantly correlated with the decision to re-
enrol in another PSE program.” On this basis, he
argues that parents’ education “appears to be
related to students’ ability to adjust to adversity in
their first program by finding and undertaking
alternative programs” (2008, p. 230).
In light of this, one difference between those
who persist and those who drop out can best be
viewed in terms of resilience, a concept that
In assessing why some students drop out and oth-
ers persist, it is important to avoid drawing an
over-simplistic contrast between those who enrol
in a program of studies and stick with it and those
who leave. As we have seen above, many of those
who discontinue their studies subsequently re-
enrol. In other words, many students make a
“second attempt” at post-secondary education,
and this is an important element in contributing to
overall persistence rates. This point is emphasized
by Shaienks and Gluszynski, who show that less
than 40 percent of those who persist only attempt
one program, compared to 64 percent of dropouts
(2007, p. 21). As one journalist reviewing the latest
data on persistence put it, “today’s students are a
mobile bunch, just about as likely to take a zigzag
course through college and university as they are
to follow a straight line” (Church, 2008; see also
Finnie & Qiu, 2008, p. 202). The difference between
many of those who persist and those who drop out,

CHaPTer 3 — PersisTenCe in PosT-seCondary eduCaTion 77
Myth: PSE Continuers “Get it Right” on Their First Try (continued)
resilience in youth include supportive relationships
with adults and parental expectations (Canadian
Career Development Foundation, 2007, pp. 3–4).
Thus, family background is correlated with
resilience, which in turn is an essential tool that
students need to persist in their studies, especially
when setbacks are encountered and changes of
plan required.
features in health and social work literature
but which has lately been the focus of career
development theory and curriculum development
(Canadian Career Development Foundation, 2007).
In general, resilience in this context refers to “the
capacity to overcome obstacles, adapt to change,
recover from trauma or to survive and thrive
despite adversity.” Notably, factors contributing to
International Data
from the OECD can provide some additional con-
text for the Canadian data presented here,
especially the results of the two studies by Finnie
and Qiu.
The international comparison seems to pro-
vide a basis for feeling positive about the Canadian
situation. The OECD average drop-out rate is
31 percent (Figure 3.III.3); the Canadian result
presented here (for Quebec only) is below that
In view of this emerging data about persistence of
Canadian post-secondary students, a reasonable
question for discussion arises: are Canada’s persis-
tence, completion and drop-out rates good or bad?
Certainly drop-out rates on the whole appear bet-
ter than previously reported, although this is likely
because, as was always suspected, previous insti-
tution-based studies tended to overestimate them.
Looking outward, international data available
Figure 3.III.3 — Proportion of Students Who Enter a Tertiary Program and Leave Without at Least a First Tertiary Degree (2005)
0
10
20
30
40
50
60
9
Ital
y
Un
ited
Sta
tes
New
Zea
lan
d
Hu
nga
ry
Mex
ico
Est
on
ia
Un
ited
Kin
gdo
m
Pola
nd
Slov
enia
No
rway
Cze
ch R
epu
blic
Port
uga
l
Swed
en
Icel
and
Slov
ak R
epu
blic
Swit
zerl
and
Au
stri
a
Net
her
lan
ds
Au
stra
lia
Fin
lan
d
Can
ada
(Qu
ebec
)
Ger
man
y
Ru
ssia
n F
eder
atio
n
Fran
ce
Bel
giu
m (
Fl.)
Den
mar
k
Jap
an
OECD average
Source: OECD, 2008. Table A4.1.

The Price of Knowledge: Access And sTudenT finAnce in cAnAdA7878
International Data (continued)
by Finnie and Qiu, Martinello and others showing
the rates at which students who leave their first
program of study return to some form of post-
secondary education cannot be understated.
Looking at the issue of persistence from a per-
spective that is wider than that of an individual
institution provides a better sense of what is
happening in the post-secondary system as a
whole. This brings the discussion back to the issue
of the degree of movement into, out of and
through the Canadian post-secondary system. In
comparison to students abandoning their studies
permanently, it is clearly preferable for students
to stop out and return to studies later or switch
from a program in which they do not enjoy
success into one in which they do. It is far from
clear, however, whether this amount of switching
and pausing is optimal, either from the perspec-
tive of the individual student, or from that of the
system as a whole. For this reason, the paths taken
by these “switchers” and “pausers” are in fact of
equal if not greater interest to policy-makers than
those of the “graduates” and “continuers.”
and among the best. Unfortunately, these inter-
national comparisons are less than perfect due to
differences in methodology used to calculate drop-
out rates across countries as well as differences
in the structure of each nation’s post-secondary
education system. Indeed, these differences are
significant enough to render the comparisons not
entirely useful. The OECD figures also do not fully
account for those students who switch institutions
mid-stream in a period of study or those who
stop out for one or more academic years before
taking up their studies again, whether at the same
institution and level or at a different institution or
level. The fact that the Canadian entry in the OECD
figure only reflects Quebec is also, of course, less
than ideal.
Given the difficulty in comparing the new data
on persistence in Canada either with previous
studies or with international data, it is perhaps
more productive to leave aside the question of
whether our results are good or bad and focus
instead in what has been learned. In this regard,
the importance to policy-makers of the work done

79
While the bottom-line completion rates may be
more encouraging than expected, it remains clear
that for many young people the route through the
post-secondary education system is hardly straight-
forward. Between one in five and one in ten students
are discontinuing their college or university pro-
grams and not returning, and many more are taking
longer than expected to graduate. Clearly, many
students would benefit from additional support—
both before and after arriving on a post-secondary
campus, and in both financial and non-financial
forms. As Santiago and his colleagues argue, “greater
emphasis needs to be placed on equity of outcomes
with policies more targeted at ensuring the success
of students from under-represented groups. This
would translate into more emphasis being placed on
student progression throughout studies with special
support and follow-up measures to assist those stu-
dents at risk of failure” (Santiago et al., 2008, p. 66).
Universities and colleges must be able to identify their
students from backgrounds that might lead them to
experience challenges along the route to graduation
and provide them with support programs created
for and tailored to them so that they can make the
necessary adjustments over time in order to succeed.
Thus while the findings discussed in this chapter can
allow governments and other policy-makers to look
at persistence at the system-wide or “macro” level,
institutions will increasingly need to focus on the
“micro” level of subsets of their student populations.
Their actions regarding these groups will help deter-
mine the success of the Canadian post-secondary
system as a whole.
In this regard, the ongoing research by the Canada
Millennium Scholarship Foundation on practices
that might improve outcomes for selected groups of
students is particularly relevant. The OECD’s recent
overview of tertiary education lamented that “pres-
ently…there is little evidence about the effects of
institutional support programmes on student out-
comes” (Santiago et al., 2008, p. 50). This observation
has been echoed in Canada. A recent independent
review of post-secondary education commissioned
by the Government of Ontario concluded specifically
that more research was needed in the area of
retention, noting that “it is ironic that institutions
that spend so much time and money insisting on
evidence-based decisions, spend so little time on
research that evaluates higher education itself” (Rae,
2005, 15). Similarly, a separate survey of literature in
the subject of Aboriginal peoples in post-secondary
education in Canada found that there is “virtually no
worthwhile empirical or quantitative evidence on the
subject” of interventions believed to help increase
enrolment and completion rates of Aboriginal stu-
dents. The authors underlined “the need for more
comprehensive studies that would include a larger
statistical tracking element” (Malatest, 2004, 10). The
Foundation, however, is currently completing a
select number of research experiments designed to
provide exactly this type of information. These
experiments include Foundations for Success, a pilot
project currently underway at three Ontario commu-
nity colleges, that is designed to respond to the
concern that too few Ontario college students
complete the program they initiate. Foundations for
Chapter 3
IV. Conclusion: The Need for Intervention and Evaluation

The Price of Knowledge: Access And sTudenT finAnce in cAnAdA80
Success directs students who are deemed to be at
risk of dropping out to case managers who in turn
direct them to the specific support services they
need most. They also include LE,NONET, a research
project designed to test the effectiveness of ini-
tiatives to improve the retention and success of
Aboriginal students at the University of Victoria
in British Columbia. Early results of these projects
have started to become available (see University of
Victoria, 2008, and Malatest, 2009a, 2009b, and 2009c).
The completion of these and similar projects will
hopefully make it easier for colleges and universities
to initiate and shape support programs so as to
improve their performance as institutions and the
success of their students.
Millennium Pilot Projects
Students who consented to participate and who
were deemed at risk for at least one of the three
attrition factors were randomly assigned into one
of three groups:
• a “services” group that would be assigned case
managers to direct them to services in accor-
dance with the needs identified through the test;
• a “services plus” group that would be assigned
case managers and also offered a financial
incentive in the form of a bursary of $750 (rep-
resenting approximately 50 percent of tuition
per term) in the following term of study should
they participate in at least 12 hours of approved
support programming or campus engagement
activities; and
• a comparison group that would be offered
neither of these things.
Approximately 3,100 participants were recruited
in three cohorts across the three colleges between
the autumn of 2007 and the autumn of 2008.
The case-managers were in place throughout the
2007–08 and 2008–09 academic years, and the stu-
dents are being tracked until the autumn of 2009
to determine persistence and graduation rates.
Foundations for Success
Foundations for Success is a pilot project currently
underway at three Ontario community colleges:
Seneca College in Toronto, Mohawk College in
Hamilton, and Confederation College in Thunder
Bay. It is designed to respond to concern about com-
pletion rates by directing students who are deemed
to be at risk of dropping out to case managers who in
turn direct them to the specific support services they
need most (see Malatest, 2009a).
The selection of participants began in the spring
of 2007 at the time when entering college students
are required to undergo post-admission exami-
nation. For the purpose of this project, the tests
were also used to determine whether students
could be deemed to be at-risk of dropping-out for
at least one of three reasons: English placement
results below college-level requirements; self-
reported uncertainty regarding program selection
and career direction; or self-reported difficulty in
adapting to new environments.
At the end of the tests all students entering two-
year programs were informed of the project and
asked to sign an informed consent form that would
make them eligible to participate in the project if
their test results identified them as being at risk.

CHaPTer 3 — PersisTenCe in PosT-seCondary eduCaTion 81
Millennium Pilot Projects (continued)
an array of services available at the colleges, but
rather in the provision of a trained case manager
who can direct them to specific services and
encourage their participation in those service in
the context of their post-admission test results.
The secondary research question is whether the
payment of a bursary as an incentive for participa-
tion will improve persistence either by successfully
inciting students to participate in other support
programming or by providing students with addi-
tional funds to pay for their studies.
The interim results from the project show first
that services and services plus group students
were more likely to make use of relevant support
services than those in the control group (see
Malatest, 2009c). Overall, 50 percent of the students
in the services groups, and 72 percent of those in
the services plus group, participated in relevant
support activities, compared with 14 percent of
those in the control group. Older students, low-
income students, students with less confidence in
their ability to succeed and students with English
as a second language were all among those most
likely to participate. Note that these results show
that, in the absence of the case manager approach,
only 14 percent of college students at risk of drop-
ping out avail themselves of the campus services
that are intended to help them succeed. They also
show that financial incentives can be effective at
influencing the behaviour of at-risk students.
More importantly, it seems that participation
in the support services leads to better academic
performance and persistence. The interim results
show that students in the two program groups
had higher grade point averages than those in the
Perhaps the most unique feature of the
Foundations for Success project is the use of the
case management approach to advise students
identified as being at risk of dropping out. Case
managers’ initial interactions with students are
informed by the results of the post-admission
test. In addition, however, case managers follow
students’ progress during the two years of the
project, responding to their needs and directing
them to appropriate services available at the
college. The main types of services to which case
managers direct students are:
• tutoring and related academic support, both in
program-specific subjects and in English for
those with low English proficiency and who are
required on the basis of their post-admission
test score to take remedial English courses;
• peer mentoring, in which students are assigned
to a trained student mentor who serves to answer
questions about adapting to college life;
• career clarification workshops, followed by a
group debriefing and an individual follow-up
with a career counsellor, to confirm or help revise
students’ program choices.
The primary research question is whether a
case-manager system in which students are
matched with college advisors who guide and
facilitate their access to support services will
increase the likelihood that students at risk of
dropping out will persist in their studies and
graduate. It should be noted that the difference
between the services and the comparison group
lies not so much in their access to services, since
students in the comparison group have access to

The Price of Knowledge: Access And sTudenT finAnce in cAnAdA82
Millennium Pilot Projects (continued)
to confirm whether or not the benefits of any
increase in persistence and ultimately graduation
rates outweigh the costs of delivering the program.
The interim results, however, are encouraging and,
if nothing else, demonstrate clearly the advantage
of introducing interventions in the context of a
research experiment designed to empirically mea-
sure their effect.
control group (see Figure 3.IV.1). They also had a sta-
tistically significantly greater likelihood of returning
for their second year of study (Figure 3.IV.2).
In the absence of the final results based on the
full tracking of all the project cohorts, it is too
early to conclude definitely that Foundations for
Success has been effective at improving persis-
tence. Further research will also be conducted
Figure 3.IV.1 — Foundations for Success: Grade Point Average By Program Group
0
0.5
1.0
1.5
2.0
2.5
3.0
ControlServicesServices Plus
Semester 1 Semester 2
1
1.961.821.79
2.132.062.01
Figure 3.IV.2 — Foundations for Success: Year 1 to Year 2 Retention Rates By Program Group
10%
20%
30%
40%
50%
60%
70%
80%
0%Control Group Service Group Service Plus Group*
67.2%62.6%
65.8%
Source: Malatest, 2009c, Figures 4 and 5.
Source: Malatest, 2009c, Figure 6.

CHaPTer 3 — PersisTenCe in PosT-seCondary eduCaTion 83
Millennium Pilot Projects (continued)
• A research apprenticeship program provides
an opportunity for students to work with a uni-
versity faculty member on a research project;
• A community internship program provides an
opportunity for students to gain experience
and understanding by working in an Aboriginal
community or organization;
• A preparation seminar prepares students for
the apprenticeships and internships;
• A staff and faculty cultural training seminar in-
creases awareness of Aboriginal culture and the
needs of Aboriginal students among university
personnel.
The primary research question in this case is as
follows: will a series of interventions involving
financial, academic, peer and cultural support
have a demonstrable effect on the performance of
Aboriginal students in post-secondary education
and specifically on their persistence year-to-year
and on their likelihood of completing their pro-
gram of studies? To answer this question, the
persistence of Aboriginal students during the
period in which the program is in place will be
compared to the persistence of Aboriginal students
registered at the university in the five-year period
before the program was introduced (2000–2005).
Researchers will establish probabilities of students
in the different cohorts completing courses, pro-
gressing from one year of study to the next, and
graduating. This quantitative research will be
complemented by qualitative research that will
help to establish whether any changes in persis-
tence rates can be attributed to the program and,
if so, why.
Between the start of the program, in September
2005, and January 2008, 145 students participated in
one or more elements of the program. Preliminary
observations from qualitative research suggest
LE,NONET
“LE,NONET” is a word meaning “success after
enduring many hardships”, in SENCOTEN, the
language of the Straits Salish people of Vancouver
Island. It is the title given to a research project
designed to test the effectiveness of initiatives
designed to improve the retention and success of
Aboriginal students at the University of Victoria in
British Columbia. As noted throughout this book,
the educational outcomes of Aboriginal peoples in
Canada are well below average. The University of
Victoria is concerned in particular that it become
an attractive option for Aboriginal students and
that those Aboriginal students that it is able to
attract are able to succeed once enrolled.
In conceiving the project, the university recog-
nized that improved outcomes for Aboriginal
students necessitate change not only in Aboriginal
students but perhaps first and foremost in the
institutional culture and practices of the university
itself. Accordingly, while many of the interventions
put in place by the project are directed towards
students, others are directed towards faculty and
staff so that they might “increase faculty and staff
awareness of Aboriginal historical and contempo-
rary realities in order to create a more respectful
and culturally safe environment for students”
(University of Victoria, 2008, 52).
The program is directed to all Aboriginal under-
graduate students on campus enrolled in degree
programs who participate voluntarily. The program
itself supports students through a suite of services,
each designed to address particular obstacles that
Aboriginal students are likely to encounter, as follows:
• A bursary program provides financial aid to
qualifying students;
• A peer mentoring program links new students
with those already familiar with the university
and its Aboriginal community and services;
–´

The Price of Knowledge: Access And sTudenT finAnce in cAnAdA84
Millennium Pilot Projects (continued)
of the project on persistence, with a withdrawal
rate for participants of less than half that of the
historical cohort used for comparison (University
of Victoria, 2008, 62).
The researchers note, however, that for many
participants the program has enhanced their
educational experience and therefore contributed
to their sense of success as Aboriginal students
without necessarily being a determinant in their
decision to continue their studies at the uni-
versity. It could be that for Aboriginal students
this improved educational experience is no less
important than improved persistence. Further
qualitative and quantitative research will outline
more conclusively the way in which the program
impacts participants and the connections between
enhanced educational experience and retention.
that the program appears to have had a positive
effect on most participating students including:
• contributing to students’ sense of connection to
the on-campus Aboriginal community;
• contributing to students’ sense of connection to
the general university community;
• contributing to their success as students;
• strengthening their own Aboriginal identity and
understanding of Aboriginal culture.
At this stage, just over half of students interviewed
stated that the program had influenced their deci-
sion to continue with their studies. Certainly some
individuals who had received financial support
through the program stated that this support was a
critical factor in enabling them to persist. Preli-
minary quantitative results also suggest an impact

Paying for Post-Secondary EducationAnne Motte, Joseph Berger and Andrew Parkin
The Price of KnowledgeAccess and Student Finance in Canada
4

87
It is often remarked that post-secondary education
has become more expensive in recent years. To un-
derstand more concretely what this means for
Canadian families, however, we need to examine the
issue more closely.
• First, we need to determine what is driving the
changes in cost. Most discussions of post-secondary
education costs focus on tuition. While this is
important, tuition policy varies significantly by
province, making generalizations difficult. In
addition, room and board typically cost students
almost as much, so these must be taken into
account as well.
• Second, we need to explore whether higher edu-
cation has become more expensive relative to
other things. Over time, the cost of most things
rises—that is the nature of inflation. But if the cost
of going to college or university is rising at a faster
pace than inflation, then higher education will
put greater pressure on family budgets.
• Third, we need to ask whether costs are rising at a
faster rate than are the financial resources students
and their families have at their disposal. If they are,
then post-secondary education can legitimately be
said to have become less affordable.
In this chapter, we will examine how the cost of
a post-secondary education has been changing
throughout this decade. We will look at how the
prices of the major items that students need to pay
for have been changing—including tuition, food and
housing, books and materials, and transportation,
which together account for almost 80 percent of stu-
dent expenses—and how these changes compare to
the inflation rate. Then we will examine the question
of whether changes in student resources have kept
pace with the changes in their expenses.
This review of costs and resources will show that
costs have been rising and that, in many cases, they
have been rising faster than inflation. As important
as this general rise in costs, however, is the fact
that certain costs often undergo sudden, significant
increases, making financial planning more difficult
for students and their families. Such unpredictable
cost increases are not limited to changes in tuition.
In addition, for some types of student—parti-
cularly those from lower-income backgrounds or
those who rely on need-based student financial
aid—the availability of resources has not increased
to the same extent as costs. One important resource,
income from student employment, has increased;
however, this is not a result of rising wages but rather
of the fact that students are working more hours.
While this helps students make ends meet, it may
adversely affect their academic success.
Taken together, the evidence suggests that the
financial pressures on those students most likely
to be concerned about their ability to pay for post-
secondary education have continued to increase in
recent years. Put simply, while recent cost increases
are not as significant as those witnessed in the
1990s, there are good reasons to suggest that post-
secondary education is still becoming less affordable.
What is most worrying is that the developments
reported on in this chapter took place prior to the
economic downturn at the end of 2008. It would
thus seem reasonable to expect that the financial
challenges faced by many students will appear even
more serious once the data for 2008 and 2009
become available.
Evidence of increasing financial pressures on
some students and families does not mean that
the positive returns to post-secondary education
discussed in Chapter 1 do not apply. Post-secondary
education is not merely something that a student
purchases—it is an investment in his or her future.
Even as costs rise, the investment remains sound
(see Baum and Schwartz, forthcoming). This chapter,
however, focuses on the issues of the costs that
students face and the financial resources available
to them at the time they enrol.
Chapter 4
I. Introduction

The Price of Knowledge: Access And sTudenT finAnce in cAnAdA88

89
To cover the cost of a year of post-secondary
education, whether college or university, students
typically need between $10,000 and $15,000 (Berger,
Motte and Parkin, 2007).
In our discussion of these costs and how they
have been changing, we need to keep in mind a few
things. The first is changes in the rate of inflation.
As shown in Table 4.II.1, for the country as a whole,
between 2002 and 2007, the annual inflation rate as
measured by the Consumer Price Index (CPI) fluctu-
ated between 1.8 and 2.8 percent. During that period,
prices cumulatively rose by 11.5 percent. Generally
speaking, if the price of a good has risen by less than
the rate of inflation over the same period, the good
has in effect become cheaper; conversely, if the price
has risen by more than the inflation rate, it has
become more expensive. The inflation rate varies
by province, however, and it can be calculated at
the level of a city or region as well. This is part of
the differing economic landscape that must be taken
into account when assessing the circumstances of
students in different parts of the country.
Chapter 4
II. Costs and Resources: An Overview
Table 4.II.1 — Consumer Price Index, 2002–2007, by Province
2002 2003 2004 2005 2006 2007
Canada 100 102.8 104.7 107.0 109.1 111.5
NL 100 102.9 104.8 107.6 109.5 111.1
PE 100 103.5 105.8 109.1 111.6 113.6
NS 100 103.4 105.3 108.2 110.4 112.5
NB 100 103.4 104.9 107.4 109.2 111.3
QC 100 102.5 104.5 106.9 108.7 110.4
ON 100 102.7 104.6 106.9 108.8 110.8
MB 100 101.8 103.8 106.6 108.7 110.9
SK 100 102.3 104.6 106.9 109.1 112.2
AB 100 104.4 105.9 108.1 112.3 117.9
BC 100 102.2 104.2 106.3 108.1 110.0
Source: Statistics Canada, CANSIM Table 326-0021.

The Price of Knowledge: Access And sTudenT finAnce in cAnAdA90
1. These figures exclude debt payments.
2. It is important to keep in mind that, for any given source, a high incidence does not mean that the amounts received are also high.
Another factor that needs to be taken into con-
sideration is the composition of students’ expenses.
According to the 2003–04 Canadian Post-Secondary
Student Financial Survey, tuition is the largest cost
that students face, representing 34 percent of their
expenditures, while accommodation and food is
the second highest (30 percent). Transportation and
books each account for between eight and 13 percent
of expenditures (see Table 4.II.2).
Students also rely on a number of different income
sources (see Tables 4.II.3 and 4.II.4). Many rely on
contributions from their parents or family to help
finance their studies. Specifically, 69 percent of first-
year university students and 50 percent of graduating
students did so; for college students, the figure was
58 percent. Employment, whether in the form of
summer earnings or work during the school year, is
also an important source of financing, notably in
college, where two out of three college students
rely on work income to help pay for their studies.
Government loans also play an important role, with
about three post-secondary students in ten relying
on such programs.
Table 4.II.2 — Breakdown of Student Costs, 2003–041
All Students University Students College Students
Tuition 34% 36% 23%
Books/computers 13% 13% 16%
Accommodation/food 30% 29% 32%
Transportation 8% 8% 11%
Other (e.g., personal, leisure, child care)
15% 14% 18%
Source: Berger, Motte and Parkin, 2007.
Table 4.II.3 — Sources of Financing for University Students, 2007 and 20092
First-Year University Students Graduating Students
Parents/family/spouse 69% 50%
Personal savings 53% 30%
University scholarship/financial award/bursary 51% 37%
Earnings from summer work 50% 41%
Government loan or bursary 31% 36%
Earnings from current employment 26% 35%
RESP 14% 7%
Loan from a financial institution 7% 12%
Investment income 6% 3%
Co-op program/work term <1% 5%
Work-study program <1% 3%
Other 4% 3%
Source: CUSC survey, 2007 and 2009.

CHaPTer 4 — Paying for PosT-seCondary eduCaTion 91
Students and their families must successfully
juggle the costs of post-secondary education and
their available resources. The equilibrium can be
precarious, however, especially for students from
low-income families. As will be discussed below,
costs such as tuition often rise significantly in a
short period of time. If that happens, resources can
be adjusted, but only to a certain extent: the number
of hours a student can work is limited, financial aid
programs have a cap on the loan and grant amounts
available, savings can fluctuate with economic con-
ditions, and so on. For these reasons, changes
in either the economy or in government policies
can have real effects on the ability of some groups of
students to make ends meet.
Table 4.II.4 — Sources of Financing for College Students, 2009
Proportion of Students
Personal Sources
Work income 68%
Personal savings 48%
Academic scholarship 27%
Bank loan/line of credit 20%
Family
Money from family 58%
Government
Government student loan 29%
Government student grant/bursary 16%
Employment insurance (EI) 10%
Training grant 8%
Aboriginal/native ancestry funding 5%
Social/income assistance 4%
Government disability benefits 4%
Source: College Student Survey, 2009.

The Price of Knowledge: Access And sTudenT finAnce in cAnAdA92

93
TuitionIt is well known that post-secondary tuition in
Canada has increased considerably during the past
two decades. Between 1997–98 and 2008–09, average
Canadian university tuition fees increased by 65 per-
cent; this represents an increase of 37 percent after
controlling for inflation (Tables 4.III.1 and 4.III.2).
While college tuition fees typically are lower than
university fees, they have increased at a similar pace
in recent years. Specifically, between 1997–98 and
2006–07, college fees increased by 62 percent, or
35 percent after adjusting for inflation (Tables 4.III.3
and 4.III.4).
In 2008–09, university students in Canada paid
an average of $4,724 in tuition for an undergraduate
program. In 2006–07, the most recent year for which
college data are available, the average college tuition in
Canada was $1,481, compared to $4,400 for university
(Figure 4.III.1). Excluding Quebec, where 40 percent
of Canada’s college students study but where there
is no college tuition due to the CEGEP system, the
average tuition totalled $2,354 (Table 4.III.3).
Chapter 4
III. Update on Costs
Figure 4.III.1 — College and University Tuition, 2006–07
$0
$1,000
$2,000
$3,000
$4,000
$5,000
$6,000
$7,000
CollegeUniversity
CANADA BC AB SK MB ON QC NB NS PE NL
$2,7
40 $3,1
99
$2,9
10
$1,2
92 $1,9
20
$0
$2,6
00
$2,6
00 $3,2
50
$1,4
52
$2,6
33
$4,9
20
$6,4
22
$5,4
70
$1,9
32
$5,1
55
$3,3
19
$4,7
74
$4,7
63
$4,7
40
$4,4
00
$1,4
81
Note: 2006–07 figures are used because that is the most recent year for which college tuition data are available.
Source: Statistics Canada, Tuition and Living Accommodation Costs Survey; Manitoba Council on Post-Secondary Education, 2007.

The Price of Knowledge: Access And sTudenT finAnce in cAnAdA94
Table 4.III.1 — Average Undergraduate University Tuition in Canada in Nominal Dollars by Province, 1997–98 to 2008–09
97–98 98–99 99–00 00–01 01–02 02–03 03–04 04–05 05–06 06–07 07–08 08–09
Canada $2,869 $3,064 $3,328 $3,447 $3,585 $3,749 $4,018 $4,140 $4,211 $4,400 $4,558 $4,724
BC $2,518 $2,525 $2,568 $2,592 $2,527 $3,176 $4,098 $4,735 $4,867 $4,740 $4,922 $5,040
AB $3,241 $3,519 $3,723 $3,907 $4,030 $4,165 $4,511 $4,940 $4,838 $4,763 $5,122 $5,361
SK $3,074 $3,279 $3,367 $3,668 $4,142 $4,286 $4,644 $5,062 $5,063 $4,774 $5,015 $5,015
MB $2,921 $3,149 $3,488 $3,219 $3,243 $3,144 $3,155 $3,236 $3,333 $3,319 $3,271 $3,276
ON $3,293 $3,640 $4,084 $4,256 $4,492 $4,665 $4,911 $4,831 $4,933 $5,155 $5,388 $5,643
QC $1,803 $1,803 $1,813 $1,819 $1,842 $1,851 $1,865 $1,888 $1,900 $1,932 $2,056 $2,167
NB $3,026 $3,225 $3,350 $3,585 $3,863 $4,186 $4,457 $4,719 $5,037 $5,470 $5,590 $5,590
NS $3,892 $4,074 $4,262 $4,631 $4,855 $5,214 $5,556 $6,003 $6,323 $6,422 $6,110 $5,932
PE $3,162 $3,327 $3,499 $3,499 $3,710 $3,891 $4,133 $4,374 $4,645 $4,920 $4,440 $4,530
NL $3,211 $3,216 $3,373 $3,373 $3,036 $2,729 $2,606 $2,606 $2,606 $2,633 $2,632 $2,632
Source: Statistics Canada, Tuition and Living Accommodation Costs Survey.
Table 4.III.2 — Average Undergraduate University Tuition in Canada in 2008 Dollars by Province, 1997–98 to 2008–09
97–98 98–99 99–00 00–01 01–02 02–03 03–04 04–05 05–06 06–07 07–08 08–09
Canada $3,658 $3,869 $4,134 $4,165 $4,192 $4,331 $4,524 $4,546 $4,546 $4,637 $4,701 $4,724
BC $3,211 $3,188 $3,190 $3,132 $2,955 $3,669 $4,614 $5,199 $5,254 $4,995 $5,076 $5,040
AB $4,133 $4,443 $4,625 $4,721 $4,712 $4,811 $5,079 $5,424 $5,223 $5,020 $5,282 $5,361
SK $3,920 $4,140 $4,182 $4,432 $4,843 $4,951 $5,229 $5,558 $5,466 $5,031 $5,172 $5,015
MB $3,725 $3,976 $4,333 $3,890 $3,792 $3,632 $3,552 $3,553 $3,598 $3,498 $3,373 $3,276
ON $4,199 $4,596 $5,073 $5,143 $5,252 $5,389 $5,529 $5,304 $5,325 $5,433 $5,557 $5,643
QC $2,299 $2,276 $2,252 $2,198 $2,154 $2,138 $2,100 $2,073 $2,051 $2,036 $2,120 $2,167
NB $3,858 $4,072 $4,161 $4,332 $4,517 $4,836 $5,018 $5,181 $5,437 $5,765 $5,765 $5,590
NS $4,963 $5,144 $5,294 $5,596 $5,676 $6,023 $6,256 $6,591 $6,826 $6,768 $6,301 $5,932
PE $4,032 $4,201 $4,346 $4,228 $4,338 $4,495 $4,653 $4,803 $5,014 $5,185 $4,579 $4,530
NL $4,094 $4,061 $4,190 $4,076 $3,550 $3,153 $2,934 $2,861 $2,813 $2,775 $2,714 $2,632
Source: Statistics Canada, Tuition and Living Accommodation Costs Survey.

CHaPTer 4 — Paying for PosT-seCondary eduCaTion 95
Table 4.III.3 — Average College Tuition in Canada in Nominal Dollars by Province, 1997–98 to 2006–07
97–98 98–99 99–00 00–01 01–02 02–03 03–04 04–05 05–06 06–07
Canada $915 $1,002 $1,073 $1,048 $1,196 $1,238 $1,396 $1,448 $1,477 $1,481
Canada (excluding Quebec)
$1,420 $1,545 $1,657 $1,723 $1,934 $1,965 $2,187 $2,254 $2,298 $2,354
BC $1,340 $1,340 $1,340 $1,340 $1,791 $1,914 $2,586 $2,638 $2,674 $2,740
AB $1,668 $1,923 $2,130 $2,339 $2,653 $2,653 $2,840 $3,089 $3,199 $3,199
SK $1,727 $1,885 $2,055 $2,240 $2,657 $2,190 $2,400 $2,640 $2,772 $2,910
MB $1,224 $1,322 $1,435 $1,292 $1,292 $1,292 $1,292 $1,292 $1,292 $1,292
ON $1,403 $1,543 $1,684 $1,718 $1,786 $1,786 $1,820 $1,820 $1,820 $1,920
QC $0 $0 $0 $0 $0 $0 $0 $0 $0 $0
NB $1,600 $2,000 $2,400 $2,400 $2,400 $2,400 $2,400 $2,500 $2,600 $2,600
NS $1,000 $1,150 $1,500 $1,750 $1,950 $2,150 $2,250 $2,400 $2,500 $2,600
PE $2,000 $2,000 $2,000 $2,000 $3,250 $3,250 $3,250 $3,250 $3,250 $3,250
NL $1,320 $1,452 $1,452 $1,452 $1,452 $1,452 $1,452 $1,452 $1,452 $1,452
Source: Statistics Canada, PSIS; Statistics Canada; Manitoba Council on Post-Secondary Education, 2003, 2004 and 2007.
Table 4.III.4 — Average College Tuition in Canada in 2008 Dollars by Province, 1997–98 to 2006–07
97–98 98–99 99–00 00–01 01–02 02–03 03–04 04–05 05–06 06–07
Canada $1,166 $1,265 $1,333 $1,266 $1,399 $1,431 $1,572 $1,590 $1,594 $1,561
Canada (excluding Quebec)
$1,810 $1,951 $2,058 $2,082 $2,262 $2,271 $2,462 $2,475 $2,481 $2,481
BC $1,709 $1,692 $1,665 $1,619 $2,094 $2,211 $2,912 $2,897 $2,887 $2,888
AB $2,127 $2,428 $2,646 $2,826 $3,102 $3,065 $3,198 $3,392 $3,453 $3,371
SK $2,202 $2,380 $2,553 $2,707 $3,107 $2,530 $2,702 $2,899 $2,992 $3,067
MB $1,561 $1,669 $1,783 $1,561 $1,511 $1,493 $1,455 $1,419 $1,395 $1,362
ON $1,789 $1,948 $2,092 $2,076 $2,088 $2,063 $2,049 $1,998 $1,965 $2,023
QC $0 $0 $0 $0 $0 $0 $0 $0 $0 $0
NB $2,040 $2,525 $2,981 $2,900 $2,806 $2,772 $2,702 $2,745 $2,807 $2,740
NS $1,275 $1,452 $1,863 $2,115 $2,280 $2,484 $2,533 $2,635 $2,699 $2,740
PE $2,550 $2,525 $2,484 $2,417 $3,800 $3,754 $3,659 $3,569 $3,508 $3,425
NL $1,683 $1,833 $1,804 $1,755 $1,698 $1,677 $1,635 $1,594 $1,567 $1,530
Source: Statistics Canada, PSIS; Statistics Canada; Manitoba Council on Post-Secondary Education, 2003, 2004 and 2007.

The Price of Knowledge: Access And sTudenT finAnce in cAnAdA96
3. The amounts in this section have not been adjusted for inflation.
The national portrait of post-secondary costs and
student financial aid can obscure as much as it reveals,
since tuition policy and practice vary considerably
from one jurisdiction to the next. As Tables 4.III.1 to
4.III.4 demonstrate, tuition increases have occurred
at a much faster place in some provinces than others.
For instance:
• Tuition increased substantially and quickly in
British Columbia during the early part of this
decade. A student who began a four-year uni-
versity program in 2001–02, when tuition fees
were frozen in B.C., would have wound up paying
88 percent more in his or her last year of studies.
During the same time, inflation increased by only
seven percent. College tuition in B.C. more than
doubled between 2000–01 and 2006–07, while
inflation increased by only 14 percent.3
• In Alberta, Saskatchewan and New Brunswick,
university tuition increased at a faster pace than
in the rest of the country between 1997–98 and
2006–07. The increase in Alberta occurred fairly
quickly. Tuition rose from $4,165 to $4,940 (a jump
of 19 percent) between 2002–03 and 2004–05.
During those same two years, university tuition
increased by nearly $800 in Saskatchewan. Simi-
larly, tuition increased by more than $700 in New
Brunswick between 2004–05 and 2006–07.
• College tuition also increased faster in B.C.,
Alberta, Saskatchewan and Nova Scotia than in the
rest of the country between 1997–98 and 2006–07.
College tuition in Nova Scotia increased by at least
$100 during each of the years between 1997–98
and 2006–07. College tuition is highest in P.E.I.,
followed by Alberta and Saskatchewan.
• University tuition increased at a slower pace in
Manitoba, Quebec, Nova Scotia and Prince Edward
Island. In some instances, tuition decreased.
Manitoba decreased tuition fees by $270 between
1999–2000 and 2000–01; they remained frozen
until 2008–09, and were scheduled to increase by
4.5 percent for the 2009–10 academic year. Tuition
decreased by 18 percent in Newfoundland and
Labrador between 1997–98 and 2008–09; tuition in
this province was nearly $750 cheaper in 2008–09
than in 2000–01.
• College tuition in New Brunswick and P.E.I. in-
creased at the median (63 percent), while in
Manitoba, Ontario and Newfoundland and Labra-
dor it increased at a slower pace. In P.E.I., tuition
was frozen at $2,000 until 2001–02, when it
increased to $3,250, where it has remained since.
In Quebec, college (CEGEP) studies remain free.
To summarize, with rare exceptions (university
tuition in Newfoundland and Labrador; college
tuition in Quebec), college and university tuition in
Canada has continued to rise. Beyond the fact of
this increase, two points are important. First, outside
of Manitoba, Newfoundland and Labrador and
Quebec, tuition increased faster than the rate of
inflation—often, it rose at three or four times the
pace of the Consumer Price Index. This means that
we can confidently state that most post-secondary
programs have become more expensive relative to
other things. Second, tuition does not necessarily
increase in a steady, predictable manner. Much—if
not all—of a political party’s post-secondary platform
tends to be devoted to tuition, meaning it can shift
dramatically upon the election of a new government.
Parents saving to buy a car have a reasonable idea of
how much money they will need to put aside each
year to afford the model they like in five years’ time;
parents saving for their children’s higher education
are not always so lucky.

CHaPTer 4 — Paying for PosT-seCondary eduCaTion 97
Is Net Tuition What Counts?
sophisticated tax filers will make budgets that take
the eventual receipt of these credits into account;
for most people, including parents from low-
income families and students who may not have
filed income taxes before, the effect of education
tax credits is unknown. Furthermore, because the
tax credits are not refundable, many low-income
students cannot actually use them until well after
they have graduated and start to have taxable
income against which to claim them.
The concept of net tuition is a clever way to
think of the full subsidy governments provide for
post-secondary education. From this perspective,
as Usher and Duncan write, “in a strict accounting
sense, the timing of the payment is irrelevant”(12).
It is a little less useful to families thinking about the
issue of affordability. In September of each school
year, students need to pay the tuition charged by
their institution; they cannot ask to pay net tuition
and let their school collect the balance from the
Canada Revenue Agency. And bills are due when
they are due, regardless of any possible future
tax credits.
There is clearly a difference between net tuition
and the amount students must come up with at the
start of the year. Ideally, the two amounts would
correspond, so that the net price individuals take
into account when determining whether to invest
in post-secondary education would resemble the
price they have to pay up front. Policy efforts that,
by intention or effect, reduce net price are under-
mined if they do not also affect the perception of
post-secondary costs.
As indicated earlier, tuition typically is a student’s
single largest expenditure. In recognition of this,
and of the financial barriers that many students
face, governments provide tax credits and grants
that, technically speaking, defray the price of tuition.
The concept of “net tuition” has been developed
to capture the effect of these programs; it measures
the costs to students and their families once these
subsidies have been taken into account. Some com-
mentators argue that this is what matters most in
discussions of affordability: assessments of the real
burden of financing post-secondary studies should
take into account the very real rebates that are
delivered in the form of tax credits and student aid
(Usher, 2006; Usher and Duncan, 2008).
The concept of net tuition captures more
fully the division of the aggregate burden of paying
for post-secondary education between private
sources (students and their families) and public
ones (governments). Unfortunately, for students
and families thinking about whether they can
afford higher education (especially low-income
families), it is not clear that the concept is all that
useful. Discussions of net tuition do not focus on
when and how tuition is paid.
Being able to figure out how education tax
credits will offset tuition bills requires knowing
how much one is going to receive in the form of
such credits when they are claimed at least eight
months down the road. It also requires knowing if
one will have taxable income and, if not, how the
rules surrounding the carrying forward or transfer-
ring of credits come into play. Only the most

The Price of Knowledge: Access And sTudenT finAnce in cAnAdA98
Canadian Household Spending on Post-Secondary Tuition
1997 and 2007, the average household expenditure
on post-secondary tuition fees more than doubled
in real terms, increasing from $1,925 to $4,017 in
constant 2007 dollars (Statistics Canada, 2009d).
The data available from Statistics Canada do not
allow us to control for the number of household
members that attend post-secondary education.
Nevertheless, it is worth noting that the average
amounts reported in each province are very close
to the average amounts of undergraduate uni-
versity tuition discussed above, suggesting that on
average households with tuition expenses spend
roughly the equivalent of average provincial under-
graduate university tuition each year.
Data from Statistics Canada’s Survey of Household
Spending reveal that in 2007 about 15 percent of
Canadian households had spent part of their annual
budget on tuition for post-secondary education,
whether university or college (see Table 4.III.5).
For the country as a whole, households declared
spending about $4,000 on average. While the per-
centage of households declaring that they spent
money on post-secondary tuition did not vary
much by province, the average amount spent
did (see Figure 4.III.2). Predictably, given current
tuition levels, households in New Brunswick and
Nova Scotia reported the highest average amounts,
while those in Quebec reported the lowest. Between
Table 4.III.5 — Percentage of Households Reporting Post-Secondary Tuition Expenditures, 2007
Canada NL PE NS NB QC ON MB SK AB BC
Percentage 15.4% 12.2% 12.6% 13.9% 12.5% 14.1% 16% 16.2% 13.1% 16.8% 16.6%
Source: Statistics Canada, 2009d, Table B.2.7.
Figure 4.III.2 — Average Amount Spent on Tuition by Households Incurring Post-Secondary TuitionExpenditures, 2007
$0
$1,000
$2,000
$3,000
$4,000
$5,000
$6,000
$7,000
CANADA NL PEI NS NB QC ON MB SK AB BC
$4,0
98
$4,3
97
$3,8
46
$3,4
80
$5,0
57
$1,8
32
$6,2
23
$5,7
25
$4,4
93
$3,1
50
$4,0
17
Source: Statistics Canada, 2009d, Table B.2.7.

CHaPTer 4 — Paying for PosT-seCondary eduCaTion 99
4. We have, for example, noted certain instances where professors teaching the same course assigned different textbooks.
TextbooksIn focus groups and other forums, students often
complain about the high cost of textbooks (and to a
lesser extent, that some of the textbooks they are
required to purchase are rarely used by the professor
or instructor). Students also report having been sur-
prised by the cost of textbooks. Since the number
and nature of required textbooks vary considerably
across disciplines and courses,4 it is difficult for stu-
dents to estimate how much they should expect to
spend on them. It also appears equally difficult for
institutions to present students with a clear idea of
how much their books will cost.
Table 4.III.6 offers an idea of the textbook costs
faced by first-year university students in different
disciplines enrolled in compulsory courses. Within a
single discipline, the range of prices can be quite
wide; in a number of cases, the difference between
the minimum and maximum price is over $400. Arts
students tend to have lower overall costs.
In the absence of a comprehensive, regular survey
of student costs and resources, we cannot monitor the
evolution of textbook costs. However the Survey of
Table 4.III.6 — Minimum, Maximum and Average Prices of First-Year University Compulsory Course Textbooks by Discipline in 2008
Minimum Maximum Average
Commerce
Finance $495 $790 $608
Business administration $398 $695 $550
Marketing $378 $753 $554
International business $436 $622 $529
Human resources management $274 $729 $570
Engineering
Mechanical engineering $400 $777 $617
Chemical engineering $330 $747 $605
Civil engineering $348 $764 $573
Computer engineering $360 $814 $575
Electrical engineering $406 $791 $661
Arts
Economics $490 $738 $616
Literature $180 $832 $436
History $163 $751 $441
Politics $188 $745 $448
Sociology $179 $612 $451
Science
Biology $405 $912 $651
Chemistry $301 $942 $656
Computer science $285 $787 $593
Geography $214 $1,013 $585
Mathematics $195 $800 $595
Source: Data collected by the Canada Millennium Scholarship Foundation, 2008.

The Price of Knowledge: Access And sTudenT finAnce in cAnAdA100
RentIn addition to educational costs like tuition, fees
and textbooks, students also need somewhere to live.
According to the CUSC survey, 54 percent of first-
year university students (in 2007) and 65 percent of
graduating university students (in 2009) were not
living with their parents. The 2009 College Student
Survey indicates that 64 percent of college students
did not live with their parents. Again, however, in the
absence of a regular survey of students’ living costs, it
is not easy to determine how much students spend on
rent. Table 4.III.8 offers a portrait of the cost of renting
a one-bedroom apartment in different Canadian cities
in 2007. Of course, as mentioned, many students
live at home, either during the school year, the summer
or both. Others live on campus in residence, and many
students find it cheaper to share accommodations
than to live alone. The figures in the table also mask
geographical variation in price within cities; apart-
ments near colleges and universities may cluster at
the higher or lower end of the price scale, depending
on the city. Nevertheless, while the amounts shown
in the table might not correspond to the actual rent
students pay, they are instructive for two reasons.
First, they give a general sense of what apartments
cost in different parts of the country, although they
perhaps represent the upper range of what students
pay. Second, they offer a portrait of how fast rent has
been increasing.
In 2007, Toronto was the most expensive city to
live in, while Trois-Rivières was the cheapest. Over
the course of an eight-month academic year, stu-
dents renting a one-bedroom apartment would
have spent on average between $3,200 and $7,200,
depending on where they lived.
Household Spending offers information on household
spending on post-secondary education related to post-
secondary course materials and books. Table 4.III.7
shows that between 1997 and 2007, there was very
little change in the amount spent. Over the past five
years, median household spending on books and
materials has stayed at $600 (this includes all levels
of post-secondary education, including both college
and university courses). This is not to say that there
are no programs and courses where the costs of
required materials have risen; there are also courses
that require particularly expensive books or equip-
ment. Overall, however, it appears that the variation
and unpredictability of the cost of books is probably
more of a problem for students than the escalation of
costs over time.
Table 4.III.7 — Median Amount Spent on Materials and Textbooks at the Post-Secondary Level, Canada, 1997–2007 (Current Dollars)
1997 1999 2001 2003 2005 2007
Materials $100 $100 $100 $100 $100 $100
Textbooks $400 $430 $500 $500 $500 $500
Source: Statistics Canada, Survey of Household Spending, CANSIM Table 203-0012.

CHaPTer 4 — Paying for PosT-seCondary eduCaTion 101
5. Data for 2003 are taken from Junor and Usher, 2004.
Rent has increased considerably in many cities
between 2003 and 2007; in most cases, the increases
were greater than the rate of inflation (see Table 4.III.8).
In Calgary, Edmonton, Saskatoon, Victoria, Sudbury,
Peterborough, Toronto and Kingston, rent grew
more than twice as quickly as the rate of provincial
inflation. In some cities, on the other hand, inclu-
ding Windsor, Ottawa, Guelph, Hamilton, St. John’s
and Kitchener, rent increased at a slower pace than
inflation. It is also interesting to note that in several
cases rent has risen faster than undergraduate uni-
versity tuition. In cities in the Prairies, for instance,
rent has increased at a pace two to four times greater
than the pace of tuition increases. This is not to
minimize the importance of changes in tuition; it is
simply to note that the factors that put pressure on
student budgets vary from place to place and that
discussions of affordability must take the full range
of students’ costs and resources into account.
Table 4.III.8 — Cost of Renting a One-Bedroom Apartment in Major Canadian Cities
City
Average Monthly
Rent in 2007
Cost of Rent for
8 Months
Percentage Difference from 20035
Inflation Rate Between 2003
and 2007 in the Province
Change in University Tuition in the Province
over the Same Period
St. John’s, NL $545 $4,360 6.9% 8.2% 1.0%
Charlottetown, PE $524 $4,192 13.2% 10.1% 7.4%
Halifax, NS $659 $5,272 15.2% 9.1% 10.0%
Moncton, NB $532 $4,256 14.9% 7.9% 25.4%
Montreal, QC $581 $4,648 15.1% 7.9% 10.2%
Quebec, QC $547 $4,376 11.9% 7.9% 10.2%
Sherbrooke, QC $424 $3,392 14.9% 7.9% 10.2%
Trois-Rivières, QC $406 $3,248 9.7% 7.9% 10.2%
Guelph, ON $743 $5,944 5.1% 8.1% 9.7%
Hamilton, ON $666 $5,328 6.2% 8.1% 9.7%
Kingston, ON $701 $5,608 17.2% 8.1% 9.7%
Kitchener, ON $690 $5,520 8.2% 8.1% 9.7%
London, ON $652 $5,216 15.2% 8.1% 9.7%
Ottawa, ON $798 $6,384 4.0% 8.1% 9.7%
Peterborough, ON $709 $5,672 18.2% 8.1% 9.7%
St. Catharines- Niagara, ON
$648 $5,184 11.3% 8.1% 9.7%
Sudbury, ON $609 $4,872 18.7% 8.1% 9.7%
Thunder Bay, ON $584 $4,672 9.8% 8.1% 9.7%
Toronto (Central), ON $1,052 $8,416 18.1% 8.1% 9.7%
Windsor, ON $641 $5,128 0.6% 8.1% 9.7%
Winnipeg, MB $578 $4,624 18.0% 9.1% 3.7%
Regina, SK $554 $4,432 15.4% 9.9% 8.0%
Saskatoon, SK $564 $4,512 22.3% 9.9% 8.0%
Calgary, AB $897 $7,176 36.7% 13.5% 13.5%
Edmonton, AB $784 $6,272 36.4% 13.5% 13.5%
Vancouver, BC $846 $6,768 13.9% 7.8% 20.1%
Victoria, BC $716 $5,728 18.4% 7.8% 20.1%
Source: Canada Mortgage and Housing Corporation.

The Price of Knowledge: Access And sTudenT finAnce in cAnAdA102
TransportationStudents who do not live on or close to campus
must pay for public or private transportation. Those
driving their own vehicles have been hit with rising
gas prices, which over the past five years (2002–2007)
have increased by 46 percent. In the case of public
transportation, both the amounts students have to
pay and the rate of change vary considerably by city.
As Table 4.III.9 shows, the monthly cost of a student
transit pass varies from a low of $18.50 in Calgary to a
high of $89 in Toronto. And while some cities have
seen a reduction in prices in recent years, others
have seen price increases of over 20 percent.
Table 4.III.9 — Cost of Monthly Public Transportation Passes for Full-Time Students in Major Canadian Cities (2003–04 and 2008–09)
CityCost of Student Transit
Pass in 2003–04Cost of Student Transit
Pass in 2008–09Increase
Since 2003
St. John’s, NL $50.00 $49.00 -2.00%
Halifax, NS $51.00 $54.00 5.88%
Fredericton, NB $38.00 $38.00 0.00%
Moncton, NB $36.50 $44.00 20.55%
Quebec, QC $42.60 $45.80 7.51%
Sherbrooke, QC $42.00 $46.00 9.52%
Montreal, QC $31.00 $36.00 16.13%
Trois-Rivières, QC $43.00 $48.00 11.63%
Guelph, ON $55.00 $58.00 5.45%
Hamilton, ON $65.00 $79.00 21.54%
Kingston, ON $46.25 $48.00 3.78%
Kitchener, ON $45.33 $47.25–$50.35 N/A
London, ON $64.00 $64.00 0.00%
North Bay, ON $60.00 $65.00 8.33%
Ottawa, ON $50.25 $59.75 18.91%
Peterborough, ON $64.00 $45.00 -29.69%
St. Catharines, ON $67.50 $72.50 7.41%
Sudbury, ON $63.00 $62.00 -1.59%
Thunder Bay, ON $48.75 $48.75 0.00%
Toronto, ON $87.00 $89.00 2.30%
Windsor, ON $50.00 $54.50 9.00%
Brandon, MB $42.00 $40.00 -4.76%
Winnipeg, MB $53.90 $57.00 5.75%
Regina, SK $45.50 $48.00 5.49%
Saskatoon, SK $42.00 $55.00 30.95%
Calgary, AB $65.00 $18.75 -71.15%
Edmonton, AB $54.00 $60.00 11.11%
Lethbridge, AB $45.50 $55.00 20.88%
Prince George, BC $32.00 $32.00 0.00%
Vancouver, BC (3 zones) $36/$87/$120 $73/$99/$136 102%/14%/13%
Victoria, BC $55.00 $65.25 18.64%
Source: For 2008–09, information was retrieved from the Internet in June and July 2008; for 2003–04, the source is Junor and Usher, 2004.

103
EmploymentBeing employed during the school year is common
among students. Data from Statistics Canada’s
Labour Force Survey show that since the early 1990s,
the proportion of full-time university and college
students that has chosen to combine work with stu-
dies has increased slightly. As Figure 4.IV.1 indicates,
the employment rate between September and April
among 20- to 24-year-old full-time students grew
from 42 percent in 1994–95 to 48 percent in 2007–08,
before dropping to 46 percent in 2008–09.
Data from other surveys tend to show slightly
higher employment rates compared with the Labour
Force Survey. These data allow us to explore differ-
ences among specific groups of students:
• A 2009 survey of university students in the last year
of their undergraduate program (Prairie Research
Associates, 2009a) revealed that 62 percent were
working during the academic year. These students
worked an average of 18 hours per week, with two-
thirds reporting working more than ten hours
per week. More than two-thirds of these students
were working off campus.
• First-year university students appear to work
somewhat less: 45 percent of first-year students
were working in 2007 for an average of 15 hours
per week. Sixty-five percent of those employed
reported working more than ten hours per week
(Prairie Research Associates, 2007a).
• At the college level, 52 percent of students in 2009
reported working while in school (Prairie Research
Associates, 2009b). About two-thirds of employed
college students reported working more than ten
hours per week.
Students also rely on work during the summer to
cover their education costs. Since 2000, Labour Force
Survey data show that between 67 and 70 percent of
full-time students aged 20 to 24 have worked during
the summer months. Some groups of students may
be more likely to work than others. For example,
80 percent of college students surveyed in 2009
reported working during the previous summer
(Prairie Research Associates, 2009b).
For a number of students, earnings from summer
months are stretched to cover costs for the school year.
Forty-one percent of university students graduating in
the spring of 2009 reported using income earned in the
Chapter 4
IV. Update on Resources
1997–1998
1998–1999
1999–2000
2000–2001
2001–2002
2002–2003
2003–2004
2004–2005
2005–2006
2006–2007
2007–2008
2008–2009
Summer BeforeSchool Year
0%
10%
20%
30%
40%
50%
60%
70%
80%
Figure 4.IV.1 — Average Employment Rate among 20- to 24-Year-Old Full-Time Students, September–April and May–August, 1997–98 to 2008–09
Source: Statistics Canada, Labour Force Survey, CANSIM Table 282-0005 and 282-0006.

The Price of Knowledge: Access And sTudenT finAnce in cAnAdA104
summer of 2008 to help pay for their studies (Prairie
Research Associates, 2009a). Half of first-year students
were relying on summer earnings in their first year of
study (Prairie Research Associates, 2007a).
The national averages presented above hide
important regional differences. Indeed, there is a
sizable gap in the employment rate from region to
region. During the 2008–09 academic year, nearly
54 percent of full-time students in Quebec were
employed, compared to only 39 percent of full-time
students in the Atlantic provinces. Students in the
Prairies were also more likely to work than were
those in Ontario or B.C. (see Figure 4.IV.2).
Slightly different patterns emerge during the
summer. While student employment increases in
every part of the country in this season, there are
still variations by region. Students in the Atlantic
provinces had the lowest school-year employment
rate, but their incidence of summer work trails only
that of students in the Prairies. Students in B.C.,
meanwhile, have relatively low levels of employment
throughout the calendar year, while Quebec students,
who work the most during the academic year, are
less likely than those in the Atlantic and Prairie prov-
inces to work during the summer (see Figure 4.IV.3).
1997–1998
1998–1999
1999–2000
2000–2001
2001–2002
2002–2003
2003–2004
2004–2005
2005–2006
2006–2007
2007–2008
2008–2009
BCPrairiesONQCAtlantic
Figure 4.IV.2 — Average Employment Rate among 20- to 24-Year-Old Full-Time Students, September–April, 1997–98 to 2008–09
0%
10%
20%
30%
40%
50%
60%
Source: Statistics Canada, Labour Force Survey, CANSIM Table 282-0005.
1997–1998
1998–1999
1999–2000
2000–2001
2001–2002
2002–2003
2003–2004
2004–2005
2005–2006
2006–2007
2007–2008
2008–2009
BCPrairiesONQCAtlantic
0%
10%
20%
30%
40%
50%
60%
70%
80%
Figure 4.IV.3 — Average Employment Rate among 20- to 24-Year-Old Full-Time Students, May–August, 1997–98 to 2008–09
Source: Statistics Canada, Labour Force Survey, CANSIM Table 282-0006.
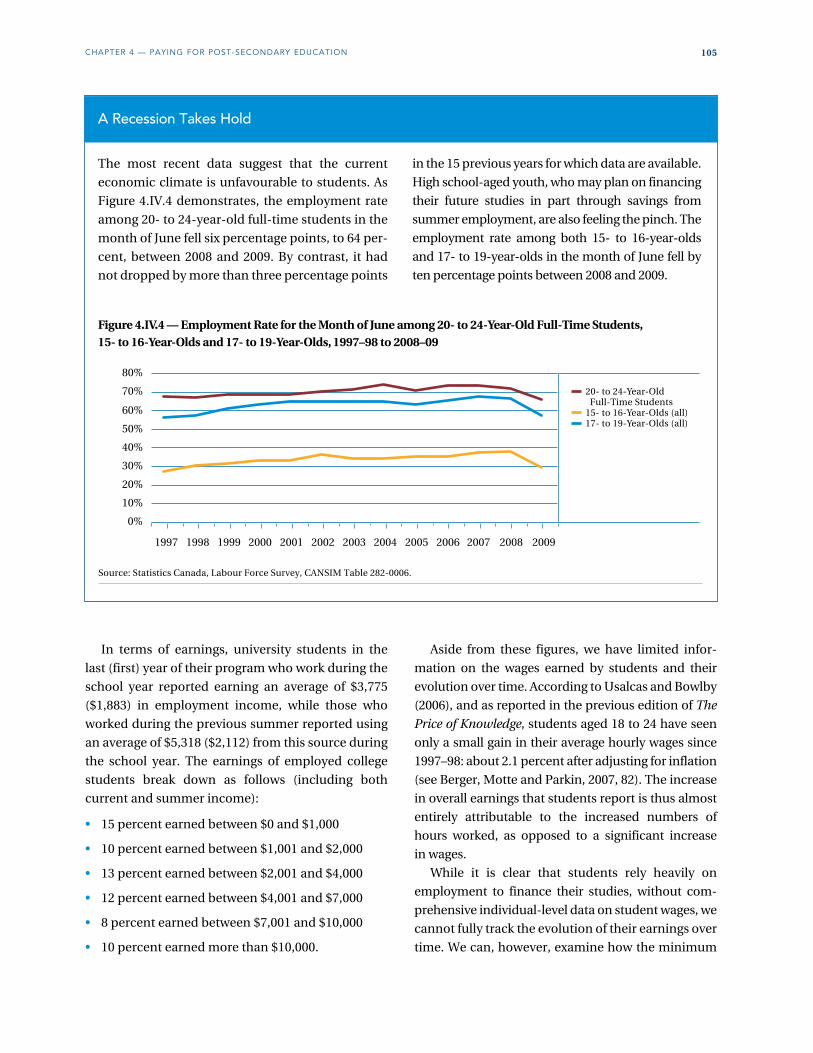
CHaPTer 4 — Paying for PosT-seCondary eduCaTion 105
In terms of earnings, university students in the
last (first) year of their program who work during the
school year reported earning an average of $3,775
($1,883) in employment income, while those who
worked during the previous summer reported using
an average of $5,318 ($2,112) from this source during
the school year. The earnings of employed college
students break down as follows (including both
current and summer income):
• 15 percent earned between $0 and $1,000
• 10 percent earned between $1,001 and $2,000
• 13 percent earned between $2,001 and $4,000
• 12 percent earned between $4,001 and $7,000
• 8 percent earned between $7,001 and $10,000
• 10 percent earned more than $10,000.
Aside from these figures, we have limited infor-
mation on the wages earned by students and their
evolution over time. According to Usalcas and Bowlby
(2006), and as reported in the previous edition of The
Price of Knowledge, students aged 18 to 24 have seen
only a small gain in their average hourly wages since
1997–98: about 2.1 percent after adjusting for inflation
(see Berger, Motte and Parkin, 2007, 82). The increase
in overall earnings that students report is thus almost
entirely attributable to the increased numbers of
hours worked, as opposed to a significant increase
in wages.
While it is clear that students rely heavily on
employment to finance their studies, without com-
prehensive individual-level data on student wages, we
cannot fully track the evolution of their earnings over
time. We can, however, examine how the minimum
A Recession Takes Hold
in the 15 previous years for which data are available.
High school-aged youth, who may plan on financing
their future studies in part through savings from
summer employment, are also feeling the pinch. The
employment rate among both 15- to 16-year-olds
and 17- to 19-year-olds in the month of June fell by
ten percentage points between 2008 and 2009.
The most recent data suggest that the current
economic climate is unfavourable to students. As
Figure 4.IV.4 demonstrates, the employment rate
among 20- to 24-year-old full-time students in the
month of June fell six percentage points, to 64 per-
cent, between 2008 and 2009. By contrast, it had
not dropped by more than three percentage points
1997 1998 1999 2000 2001 2002 2003 2004 2005 2006 2007 2008 2009
0%
10%
20%
30%
40%
50%
60%
70%
80%
Figure 4.IV.4 — Employment Rate for the Month of June among 20- to 24-Year-Old Full-Time Students, 15- to 16-Year-Olds and 17- to 19-Year-Olds, 1997–98 to 2008–09
20- to 24-Year-Old Full-Time Students15- to 16-Year-Olds (all)17- to 19-Year-Olds (all)
Source: Statistics Canada, Labour Force Survey, CANSIM Table 282-0006.

The Price of Knowledge: Access And sTudenT finAnce in cAnAdA106
6. None of the minimum wages reported here have been adjusted for inflation. Between 1997 and 2008, inflation in Canada was 27.51 percent, meaning that any growth in the minimum wage below that amount would constitute a decline in the actual value of the wage over the same period.
7. Inflation in Quebec grew by 24.12 percent between 1997 and 2008, slightly below the national average of 27.51 percent.
wage in Canada has evolved, since it may represent
the hourly pay for students in typical entry-level,
part-time or summer jobs. The minimum wage
varies substantially from region to region.6
• British Columbia had the highest minimum wage
in Canada until 2007, when a number of provinces
caught up to it. Frozen at $8.00 per hour in 2000,
the relative value of the B.C. minimum wage has
been decreasing ever since.
• In the three Prairie provinces, the minimum wage
has increased by 60 percent since 1997. It has
grown particularly quickly since 2004, from just
over $6.50 per hour to $8.50 per hour, likely due to
the strong economy in Western Canada.
• In Ontario the minimum wage did not increase
between 1997 and 2004, although recent annual
increases since then have allowed it to catch up
to the 1997 level after adjusting for inflation. At
$8.75 per hour, Ontario’s minimum wage is the
highest in the country, having grown by 28 per-
cent since 2003.
• Minimum wage increases in Quebec have kept up
with provincial inflation,7 with the wage rising
from $6.80 to $8.50 between 1997 and 2008.
• In the Atlantic provinces, the minimum wage grew
by an average of 49 percent during the years in
question, increasing from an average of $5.35 in
1997 to $7.96 in 2008.
It is interesting to note that the gap in minimum
wages across provinces has been narrowing. In 2001,
the gap between the highest minimum wage ($8.00
in B.C.) and the lowest ($5.50 in Newfoundland and
Labrador) was $2.50. It had shrunk to $1.00 in 2008,
with Ontario’s wage of $8.75 being one dollar higher
than New Brunswick’s.
Combining what we know about both minimum
wage rates and tuition costs, it is possible to show
how income from work might contribute to paying
for post-secondary education in each province. As
reported earlier, the 62 percent of students working
while in their last year of undergraduate studies in
2009 worked an average of 18 hours per week.
Assuming that a typical academic year lasts 34 weeks,
then the average student who is working while in
school works a total of 612 hours. In Quebec and
Manitoba, students working for this number of hours
could earn well over the amount needed to pay for
university undergraduate tuition. In P.E.I., Ontario,
Alberta and B.C., they could almost cover their
Table 4.IV.1 — Minimum Wage by Province, 1997 to 2008
97 98 99 00 01 02 03 04 05 06 07 08
BC $7.15 $7.15 $7.60 $8.00 $8.00 $8.00 $8.00 $8.00 $8.00 $8.00 $8.00 $8.00
AB $5.00 $5.40 $5.90 $5.90 $5.90 $5.90 $5.90 $5.90 $7.00 $7.00 $8.00 $8.40
SK $5.60 $5.60 $6.00 $6.00 $6.00 $6.65 $6.65 $6.65 $7.05 $7.55 $7.95 $8.60
MB $5.40 $5.40 $6.00 $6.00 $6.25 $6.50 $6.75 $7.00 $7.25 $7.60 $8.00 $8.50
ON $6.85 $6.85 $6.85 $6.85 $6.85 $6.85 $6.85 $7.15 $7.45 $7.75 $8.00 $8.75
QC $6.80 $6.90 $6.90 $6.90 $7.00 $7.20 $7.30 $7.45 $7.60 $7.75 $8.00 $8.50
NB $5.25 $5.25 $5.25 $5.75 $5.90 $6.00 $6.00 $6.20 $6.30 $6.70 $7.25 $7.75
NS $5.50 $5.50 $5.60 $5.70 $5.80 $6.00 $6.25 $6.50 $6.80 $7.15 $7.60 $8.10
PE $5.40 $5.40 $5.40 $5.60 $5.80 $6.00 $6.25 $6.50 $6.80 $7.15 $7.50 $8.00
NL $5.25 $5.25 $5.50 $5.50 $5.50 $5.75 $6.00 $6.00 $6.25 $6.75 $7.50 $8.00
Note: Figures have not been adjusted for inflation. Figures represent the minimum wage in effect on December 31 of the year in question.
Source: Human Resources and Skills Development Canada, Hourly Minimum Wages in Canada for Adult Workers

CHaPTer 4 — Paying for PosT-seCondary eduCaTion 107
8. Moreover, these calculations do not factor in taxes and other payroll deductions.
tuition bill. In Nova Scotia and New Brunswick, how-
ever, they would be left well short. College students
are better positioned, but there are still considerable
differences by province (see Table 4.IV.2).
Another way of looking at this is shown in
Figure 4.IV.5. In Nova Scotia and New Brunswick, a
student would need to work more than 720 hours
to come up with one year’s university tuition, or
40 weeks at 18 hours per week (in comparison, a
typical academic year lasts 34 weeks).8 Students in
Manitoba, on the other hand, would only have to
work 21 weeks, and students in Quebec 14.
Table 4.IV.2 — Percentage of University and College Tuition Earned by Students Working at Minimum Wage for the Average Number of Hours During a Typical Academic Year
Province
Percentage of University
Tuition Earned
Percentage of College Tuition
Earned
Employment Rate (Annual, Full-Time
Students Aged 20–24)
Unemployment Rate (Annual, Full-Time
Students Aged 20–24)
BC 97% 179% 40.4% 5.1%
AB 96% 161% 47.1% x
SK 105% 181% 45.5% x
MB 159% 403% 60.0% 3.6%
ON 95% 279% 42.4% 7.1%
QC 240% N/A 53.6% 4.9%
NB 85% 182% 37.4% 11.7%
NS 84% 191% 44.5% 5.6%
PE 108% 151% 40.5% 11.1%
NL 186% 337% 34.6% x
Note: x = Suppressed to meet the confidentiality requirements of the Statistics Act.
Source: Authors’ calculations; Statistics Canada’s Labour Force Survey, CANSIM Table 282-0006 and 282-0095.
Figure 4.IV.5 — Number of Hours Worked at Minimum Wage and Number of 18-Hour Work-Weeks Required to Pay One Year’s University Tuition in Canada in 2008–09, by Province
0
200
400
600
800
1,000
BC$5,040
AB$5,361
SK$5,015
MB$3,276
ON$5,643
QC$2,167
NB$5,590
NS$5,932
PE$4,530
NL$2,632
Number of Hours Worked at Minimum Wage Needed to Pay University TuitionNumber of 18-Hour Weeks630 638
583
385
645
255
721 732
566
329
35 3532
21
36
14
40 41
31
18
Average Tuition in 2008–09, by Province
Source: Authors’ calculations based on Statistics Canada, Tuition and Living Accommodation Costs Survey; Human Resources and Skills Development Canada, Hourly Minimum Wages in Canada for Adult Workers.

The Price of Knowledge: Access And sTudenT finAnce in cAnAdA108
Should Students Work?
particularly difficult issue from a methodological
perspective. That is, it is hard to say whether stu-
dents perform worse in school because they work,
or whether students are drawn to work because
they do poorly in school.
Recent data from Statistics Canada’s Youth in
Transition Survey have shed some light on this
question. In their attempt to get at the relationship
between work and persistence using YITS data,
Motte and Schwartz (2009) observe that students
who did not re-enroll in second year after the first
year of their first post-secondary program were
more likely to have worked a greater number of
hours during that first year. They also find that
work is negatively correlated with persistence: the
more hours students work during the first year of
study, the less likely they are to come back in the
second year.
While we are far from having a definite
answer on the effect of work on post-secondary
performance, this research suggests that students
should be challenged on their need for work: if
there is any doubt that it may affect their school
performance, are they in a position to reduce
the number of hours they work? A more difficult
question is whether students who lack resources
would be better off requesting student financial
aid, as opposed to working.
More students than ever before combine work and
attending post-secondary education (see Usalcas
and Bowlby, 2006; Motte and Schwartz, 2009). In
recent years, at least prior to the economic down-
turn of 2008–09, it was relatively easy for students
to find work.
The impressive increase in the proportion of
students who work during the school year typically
triggers two types of question. The first is: “Why are
students working?” When asked such a question
directly, students’ answers will vary from reporting
a need for money to cover the basics (education,
food and rent) to saying they need money for
leisure or to maintain a certain lifestyle.
The second type of question is: “What is the
effect of work on students’ persistence and perfor-
mance?” When asked directly, students will admit
that the number of hours they work may be detri-
mental to their performance. In fact, recent data
show that the more hours university students
work, the more likely they are to say that it affects
their academic performance. Specifically, “about
35% of those who work over 30 hours a week report
that employment has a negative impact on their
academic performance. This compares to about
17% of those who work 10 hours a week or less”
(Prairie Research Associates, 2009a).
Establishing a clear causality between employ-
ment and academic performance, however, is a

CHaPTer 4 — Paying for PosT-seCondary eduCaTion 109
9. Unless otherwise noted, the income figures referred to in this section are taken from Statistics Canada’s CANSIM tables. The consumer price index and recent tuition figures used in the authors’ own calculations are also from Statistics Canada. The historic tuition figures were provided by the AUCC.
Family Income and SavingsAs mentioned above, the financial contributions
that students receive from their families—typically
parents—is one of the most important sources of
post-secondary education funding. Unfortunately,
there is no easy way to tell whether students have
been getting more or less financial support from
their parents over time. Unlike employment earnings
or student loan payments, transfers of funds within
families are not reported to or tracked by the govern-
ment. They may also be accounted for less accurately
by respondents to student surveys.
Even if we knew how family contributions were
changing over time, however, we would still be
missing an important part of the picture. In terms
of assessing the affordability of post-secondary edu-
cation, what counts is not only what parents give to
their student children, but how affordable parents
feel these contributions to be. If family income is
declining over time, for instance, then a family com-
mitted to providing their children with a certain
amount of money each year will find it harder and
harder to do so. For this reason, in this section we
will examine how the financial circumstances of
Canadian families have been changing in recent
years and consider how this may be affecting their
ability to contribute financially to their children’s
post-secondary education.
Family Income9
The earnings of individual Canadians have not
changed in real terms over the past 25 years, which
means that earnings have increased at the exact
same rate as inflation. The earnings of families, how-
ever, have increased in real terms by just over nine
percent (family earnings have increased despite the
stagnation in individual earnings because there are
now more dual-earner families). Median family
income, which includes income from investments
and government transfers as well as employment,
increased by 11 percent above inflation between 1980
and 2005 (Statistics Canada, 2008a). The increase has
been especially pronounced in the recent period
of economic growth prior to the 2008 economic
crisis: from 2000 to 2005, there was a real increase in
median family income of 3.7 percent and a further
4.7 percent increase between 2005 and 2007 (Statistics
Canada, 2009c).
Perhaps the best measure of family income in the
context of the affordability of post-secondary educa-
tion is the after-tax income of non-elderly families.
After-tax income reflects what families have available
to spend; by excluding elderly families, we can focus
on the families most likely to have dependent
children. Non-elderly families gained little ground
between 1980 and 2000—in real terms, their median
after-tax income grew by only 0.3 percent. Since
then, however, their income has been growing
(although the available figures do not take into
account the 2008 economic downturn): between
2000 and 2007, the real median after-tax income of
these families increased by 13.3 percent.
The fact that families are better off now than they
used to be is no doubt good news when considering
how students pay for post-secondary education. At
the same time, however, the stagnation in after-tax
income between 1980 and 2000 was overshadowed
by the doubling (in real terms) in undergraduate uni-
versity tuition over the same period, and the more
recent real growth in family income (13.3 percent)
between 2000 and 2007 has simply allowed families
to keep pace with rising costs, at least as measured
by the increase in tuition levels (13.1 percent over
the same period). Seen in these terms, university edu-
cation became much less affordable prior to 2000,
and has not become any more or less affordable
since then.

The Price of Knowledge: Access And sTudenT finAnce in cAnAdA110
The longer-term trend just described is repre-
sented in Figure 4.IV.6. Twenty-five years ago, average
undergraduate university tuition represented just
over three percent of the annual income that non-
elderly families had to spend. That proportion more
than doubled in the decade between 1989 and 1999.
The situation has stabilized again in the last five
years or so, with tuition hovering at around seven
percent of the median after-tax income of non-
elderly families.
An equally important point to consider is the fact
that income has not been increasing at the same rate
for all types of families. The distribution of income
in Canada has become more unequal over the past
decades, meaning that richer families have seen more
income growth than poorer ones. This trend was
particularly apparent in the 1990s, when lower-income
families actually lost ground, while higher-income
families continued to gain (Heisz, 2007).
To illustrate, consider the average after-tax income
of families10 in each of five equal-sized quintiles. In
the 15 years between 1989 and 2004, the after-tax
income of families in the lowest income quintile
barely changed in real terms, increasing by 2.2 per-
cent. By comparison, the income of those in the
highest income quintile grew by almost ten times
as much (20.2 percent). In recent years, however,
the trend has reversed: between 2004 and 2007, the
real incomes of those in the lowest quintile grew by
11.9 percent compared to 7.1 percent for those in the
highest quintile.11
In terms of paying for post-secondary education,
this means that for those in the lowest income quin-
tile, average university tuition grew from about eight
1980 1982 1984 1986 1988 1990 1992 1994 1996 1998 2000 2002 2004 2006
Tuition as of a % of median after-tax income (non-elderly families)
0%
1%
2%
3%
4%
5%
6%
7%
8%
Figure 4.IV.6 — Average Undergraduate University Tuition as a Proportion of Median After-Tax Income (Non-Elderly Families)
Source: See Note 9.
10. In this case, we are considering all economic families (families of two or more persons) and not exclusively non-elderly families, due to restrictions in the availability of data.
11. Source: Statistics Canada CANSIM Table 202-0701.

CHaPTer 4 — Paying for PosT-seCondary eduCaTion 111
12. Technically, the fraction of income needed to cover average undergraduate university tuition grew by a similar degree for both high- and low-income families, roughly doubling in each case. Our argument, however, is that the change from 1.6 to 3.2 percent experienced by high-income families does not affect the affordability of higher education nearly as much as the change from 8.2 to 17.3 percent witnessed by low-income families.
percent of average after-tax income to about 18 per-
cent between 1980 and 2007; for those in the highest
income group, the figure grew from just under two
percent to just over three percent (see Figure 4.IV.7).
Higher-income families today must devote about
1/25th of their average after-tax income to paying
their child’s university tuition in Canada; lower-
income families must pay almost a fifth of theirs.
The key point, however, is that over the past two
decades—and particularly during the 1990s—post-
secondary education became much less affordable
for lower-income families in comparison to higher-
income families, although the situation has stabilized
since 2000.12
Family Savings
Another dimension of family finances to consider is
savings. It is arguably easier for parents to contribute
financially to their children’s post-secondary edu-
cation if that contribution can come from savings
rather than current income—especially given the
rise in the cost-to-income ratio just discussed. The
amount of their income that Canadians families are
saving, however, has declined significantly over the
past 25 years. Whereas in 1982 they saved 17 cents of
every dollar of income, in 2005 they saved only one
cent (Chawla and Wannell, 2005; Statistics Canada,
2006a) (see Figure 4.IV.8).
Lowest quintileMiddle quintileHighest quintile
0%
2%
4%
6%
8%
10%
12%
14%
16%
Figure 4.IV.7 — Undergraduate University Tuition as a Proportion of Average After-Tax Income (Economic Families), by Income Quintile
18%
20%
1980 1982 1984 1986 1988 1990 1992 1994 1996 1998 2000 2002 2004 2006
Source: See Note 9.
Figure 4.IV.8 — Allocation by Household of Each Dollar of Personal Income Received
0
10
20
30
40
50
60
70
80
198220012005
Consumption Taxes Savings
173 1
20
63
71 74
25 25
Source: Chawla and Wannell, 2005; Statistics Canada, 2007.

The Price of Knowledge: Access And sTudenT finAnce in cAnAdA112
13. These programs will be discussed in more detail in Chapter 6.
As average savings have declined, the proportion
of households that have “negative savings”—that is,
who spend more than their income—has increased.
In 1982, for instance, two in five (36 percent) house-
holds spent more than their income; 20 years later,
the figure was almost one in two (47 percent) (Chawla
and Wannell, 2005, 8).
Thus, as Chawla and Wannell (2005, 5-6) write,
“the broad trends are clear: Canadians are now spend-
ing more on taxes and personal consumption than a
generation ago and, as a result, are saving less of their
income…Many households do save, but increasing
numbers are slipping into the red and spending more
than they earn in a year.”
Once again, however, the situations of lower- and
higher-income households are significantly different.
Lower-income households are three times more likely
to be in the red than higher-income households: in
2001, for instance, 66 percent of households with
income below $20,000 spent more than they earned,
compared with 23 percent of households above
$100,000. Four in five low-income households whose
main income recipient was under 45 years of age—
and thus more likely to have children old enough to
attend post-secondary education—had negative
savings in 2001 (Chawla and Wannell, 2005, 8).
This trend is important given the emphasis that
has been placed by public policy-makers in recent
years on education savings programs. The federal
government, for instance, has introduced various
savings incentives,13 including Registered Education
Savings Plans (introduced in the early 1970s), the
Canada Education Savings Grant (introduced in
1998) and the Canada Learning Bond (introduced in
2004). While these programs clearly benefit many—
and take-up has been rising over time—the fact is
that over time fewer families have found themselves
with money to save. Lower-income families with
the greatest need to save money to pay for their
children’s post-secondary education are of course
the ones least likely to be able to do so.
If spending outstrips income, then families must
finance their spending either by depleting what
reserves they have or by borrowing. With regard to
the latter scenario, both the proportion of families
with debt and the amounts owed have been rising. In
the short time between 1999 and 2005, the propor-
tion of families with debt grew from 67.3 percent to
69.4 percent, while the median amount they owed
grew by 38 percent (from $32,300 to $44,500 per
family) and the total value of the debt they held grew
by 47 percent (Statistics Canada, 2006b).
The return to income growth, even for lower-
income families, in the period between 2000 and
2007 allowed many to manage their declining
savings and escalating debt levels. Analysts assessing
these trends have nonetheless argued that an
increasing number of Canadian families are in a
precarious financial situation. In particular, they are
said to be poorly prepared to handle either unex-
pected costs or a general worsening of economic
conditions. For example, it has been noted that
“even with the temporary relief of a credit card or
line of credit, 1 in 5 Canadians would not be able to
handle an unforeseen expenditure of $5,000 and 1 in
10 would face difficulty in dealing with a $500 un-
foreseen expense” (Certified General Accountants
Association of Canada, 2007, 22). In this chapter,
however, we have seen that, historically, tuition and
accommodation costs for students have undergone
sudden, significant fluctuations; other costs—such
as books—are hard for students to predict since they
vary so much from one situation to another. Mean-
while, Canada’s accountants have warned that “the
steadily increasing indebtedness of households
does heighten vulnerability to different types and
intensities of shock” (Certified General Accountants
Association of Canada, 2007, 11–12), such as the
shock associated with a recession of the type that
took hold at the end of 2008. As always, lower-income
families are in the worst position: “The growing
wealth dispersion since the mid-1980s suggests that
Canadian families are becoming increasingly un-
equal in their capacity to mitigate negative income
shocks or to initiate forward-looking strategies in
good times” (Morissette and Zhang, 2006, 14). For
these reasons, the affordability of post-secondary
education remains a concern as Canadian families
navigate the current change in economic conditions.

CHaPTer 4 — Paying for PosT-seCondary eduCaTion 113
Student Financial AssistanceThere are two distinct types of government financial
support for post-secondary students (see Chapter 6
and Berger and Parkin, 2008). Need-based aid consists
of direct support to students in the form of student
loans, grants and loan reduction programs. Non-
need-based or universal aid involves the provision
of support, either directly (merit scholarships) or indi-
rectly (tax credits, matching grants for education
savings plans), to current and future students and
their families regardless of their level of financial need.
Among students who completed undergraduate
studies in 2009, 40 percent reported receiving govern-
ment student aid at some point in their studies (Prairie
Research Associates, 2009a). Meanwhile, 31 percent of
college students in 2009 reported receiving a govern-
ment loan or bursary during the current academic year
(Prairie Research Associates, 2009b).
Education tax credits are of course available to all
students, but their value in any given year is relatively
modest. According to Usher and Duncan’s analysis of
2005 data from Finance Canada (2008), 45 percent
of all tax credits are used by the student in the year
they are earned, 35 percent are transferred to family
members and 20 percent are carried forward for
future use. To put it another way, of the $1.9 billion
in tax credit expenditures issued by the federal
and provincial governments in 2006–07, $1.52 billion
would have been used that year, with the remainder
carried over to future years. Fewer students benefit
from the tax-free earnings or matching grants
available through RESPs, because not all parents
choose or are able to save in this way. In 2008, just
over 225,000 students benefitted from withdrawals
from an RESP account, which represents approxi-
mately 14 per-cent of the post-secondary student
popu-lation. The average withdrawal amount of
$6,600, however, is relatively substantial (HRSDC,
2008, 17).
While the cost of post-secondary education has
increased over and above the rate of inflation in
recent years, increases in certain kinds of student
financial support have kept pace. As Figures 4.IV.9
1997–1998
1998–1999
1999–2000
2000–2001
2001–2002
2002–2003
2003–2004
2004–2005
2005–2006
2006–2007
University TuitionTax CreditsNeed-Based Aid per RecipientCPI
80
100
120
140
160
180
200
220
Figure 4.IV.9 — Change in University Tuition, Education Tax Credits, Need-Based Student Financial Aid per Recipient and Consumer Price Index in Canada, 1997–98 to 2006–07 (1997–98 = 100)
240
Note: “Need-based student financial aid” includes only loans, grants and loan remission.
Source: Statistics Canada, Tuition and Living Accommodation Costs Survey; Statistics Canada, PSIS; Statistics Canada, Consumer Price Index; Berger and Parkin, 2008.

The Price of Knowledge: Access And sTudenT finAnce in cAnAdA114
14. Changes in government spending in support of students will be discussed in more detail in Chapter 6.
and 4.IV.10 demonstrate, non-need-based aid (in the
form of tax credits for students and their families)
actually grew at a faster pace than both inflation and
increases in university and college tuition for much
of the last ten years.
In recent years, however, spending on need-based
aid only (measured on a per-recipient basis to
account for changes in enrolment) has not kept pace
with increases in tuition, although it has increased at
roughly the same rate as inflation. As Figure 4.IV.11
makes clear, the result is that tuition costs have
increased as a share of need-based financial aid,
leaving students who rely on student loans and grants
with less to cover other costs such as accommodation.
University tuition increased from 42 percent to
51 percent of need-based financial aid per recipient,
while college tuition increased from 21 percent to
28 percent. The situation has improved slightly in
recent years, however.14
1997–1998
1998–1999
1999–2000
2000–2001
2001–2002
2002–2003
2003–2004
2004–2005
2005–2006
2006–2007
College TuitionTax CreditsNeed-Based Aid per RecipientCPI
80
Figure 4.IV.10 — Change in College Tuition, Educational Tax Credits, Need-Based Student Financial Aid perRecipient and Consumer Price Index in Canada, 1997–98 to 2006–07 (1997–98 = 100)
100
120
140
160
180
200
220
240
Note: “Need-based student financial aid” includes only loans, grants and loan remission. The college tuition amount excludes Quebec, which does not charge tuition fees.
Source: Statistics Canada, PSIS; Statistics Canada, Consumer Price Index; Manitoba Council on Post-Secondary Education, 2003, 2004 and 2007; Berger and Parkin, 2008.
Figure 4.IV.11 — University and College Tuition as a Share of Need-Based Student Financial Aid per Recipient inCanada, 1997–98 to 2006–07
0%
20%
40%
60%
10%
30%
50%University tuition as a share of Need-Based Aid per RecipientCollege tuition as a share of Need-Based Aid per Recipient
1997–1998
1998–1999
1999–2000
2000–2001
2001–2002
2002–2003
2003–2004
2004–2005
2005–2006
2006–2007
Note: “Need-based student financial aid” includes only loans, grants and loan remission.
Source: Statistics Canada, Tuition and Living Accommodation Costs Survey; Manitoba Council on Post-Secondary Education, 2003, 2004 and 2007; Berger and Parkin, 2008

CHaPTer 4 — Paying for PosT-seCondary eduCaTion 115
15. See Neill (2007) for an authoritative assessment.
16. These figures have been adjusted to 2005 dollars. Furthermore, the NGS data are restricted to individuals who only had non-government debt. An additional nine percent of college graduates and 15 percent of university graduates owed debt both to government and non-government sources, although the amounts are not broken down by source. These percentages are up since 2000, from eight and 11 percent, respectively.
These figures show why it is important to distin-
guish between need-based and non-need-based aid
when examining government-supported student
financial resources. While tax credits, the principal
form of non-need-based aid, are available to all
students, they cannot be used by all students. The
credits, which are non-refundable, can only be used
to reduce a student’s income tax; students with
little or no income tax to pay can either transfer the
credits to a family member or carry them forward for
future use (and they are not indexed to inflation).
Wealthy families, then, can derive an immediate
benefit from the tax credits, while low-income fami-
lies might have to wait—often until several years
after the study period—to use them. That tax credits
are used disproportionately by the families of wealthy
students is well known among post-secondary
policy-makers.15 That they alone have allowed student
financial aid to keep up with rising tuition costs is
not as well understood.
As we have demonstrated, need-based financial
aid, measured on a per-recipient basis, increased
by 44 percent between 1997–98 and 2006–07, some-
what above the measure of inflation but lower than
tuition increases. Meanwhile, tax expenditures on
support for post-secondary education increased by
224 percent. Wealthy families that rely on tax credits
to pay for post-secondary education have thus
benefitted from a large expansion of government-
funded financial support. But low-income families,
who often cannot use their tax credits, have seen
tuition increases far outstrip growth in the kind of
government support for which they qualify. As a
result of this major trend in government spending
on student financial support, higher education is
now more affordable for wealthy families and less
affordable for low-income Canadians.
Private BorrowingFor a number of reasons, students may need to rely
on private loans from banks or credit cards to make
ends meet. The reliance on private sources of lending
raises a number of interesting questions. Why are
students using bank loans or credit lines? Did these
students apply for a government loan? What is the
trend in credit use among students? Unfortunately,
we have very limited information with which to shed
light on these issues.
According to Statistics Canada’s National Gradu-
ates Survey (NGS), 20 percent of college students who
graduated in 2005 owed money to non-government
sources, with the average amount owed being $9,000.
The incidence and amount of private debt both went
up since 2000, when 16 percent of college graduates
owed an average of $7,611 to non-government sources.
Twenty-six percent of bachelor’s degree graduates
owed an average of $14,600 to non-government
sources in 2005. These figures are up from 2000,
when 19 percent owed an average of $12,089 to non-
government sources.16
More recently, in 2009, 20 percent of graduating
university students reported having a loan from a
financial institution to pay for their studies (Prairie
Research Associates, 2009a). Among these students,
the average loan was $14,862. A survey of college
students in all years of study in 2009 revealed that
26 percent had accumulated an average of $3,052 in
debt from financial institutions (Prairie Research
Associates, 2009b).
Credit cards are commonly used by students. In
2009, nine in ten graduating university students
reported having at least one credit card, and 24 per-
cent reported carrying an average balance of $3,440
from month to month (Prairie Research Associates,
2009a).

The Price of Knowledge: Access And sTudenT finAnce in cAnAdA116
The use of credit cards and lines of credit is not
necessarily a bad thing. However, as pointed out in
research undertaken by Lachance et al. (2005, 2006)
on young adults in Quebec, it becomes a problem
when there is a clear lack of knowledge of how credit
works. Indeed, there is no direct link between the
amount young adults owe on their credit cards and
the extent of their knowledge about credit. This is
particularly troubling given the high interest rate
charged on outstanding credit card balances.
The challenge of improving financial literacy is
not small. In Budget 2009, the federal government
highlighted the importance of financial literacy and
announced the creation of an independent task
force on the topic.18 “Financial literacy,” the budget
documents noted, “is the ability to understand
personal and broader financial matters, apply that
knowledge and assume responsibility for one’s
financial decisions. Financial literacy is an important
life skill that empowers consumers to make the
best financial decisions in their particular circum-
stances.” The composition of the task force was
announced in June 2009 and will focus in particular
on youth. Recommendations are expected in the fall
of 2010.19
Myth: Private Borrowing Costs Less
Students often emphasize the relative ease with
which they can obtain credit cards, lines of credit
or bank loans. During focus groups conducted
for the MESA project,17 some recipients of non-
repayable millennium access bursaries suggested
that the government was making money on their
student loans and that they preferred borrowing
from their bank (despite the fact that financial
institutions will of course only issue loans under
terms that are profitable to them). While it may
not be a widespread view, such statements sug-
gest that student financial aid has an image
problem. Moreover, it suggests that improving the
financial literacy of youth is essential.
That work should start at an early stage: before
students begin post-secondary education. As
noted in Closing the Access Gap: Does Information
Matter?, high school seniors surveyed in 2005 were
more likely to cite credit cards as a way of paying
for their post-secondary education than scholar-
ships, loans and bursaries (Canada Millennium
Scholarship Foundation, 2006b).
Financial institutions specifically target students by
offering a full-range of student-tailored products:
“student” banking accounts, “student” credit cards
and “student” lines of credit. A quick scan of major
financial institutions’ websites highlights the rela-
tively aggressive marketing strategies they put forth.
Promotional statements such as “lower borrowing
costs than a student loan—pay interest only on the
amount you actually use” to describe the advan-
tages of a student line of credit are misleading:
students do not pay any interest on government
student loans as long as they are in school, nor does
any interest accumulate. This is not the case for a
line of credit: interest is owed immediately on the
amount that has been borrowed. Moreover, at the
end of their studies, students with government
loans will only pay interest on the portion of the
loan they owe, i.e., the amount they “actually” use,
which is no different from the advertised advantage
of a private line of credit. A few institutions offer a
slightly more nuanced pitch by pointing out that
lines of credits are a good instrument for students
who are not eligible for government financial aid.
17. The Measuring the Effectiveness of Student Aid (MESA) project is a four-year research effort being conducted by the Educational Policy Institute and the School of Policy Studies at Queen’s University on behalf of the Canada Millennium Scholarship Foundation. Participating researchers were asked to write about issues of access and persistence in post-secondary education in Canada. Each of the papers commissioned during this project is available for downloading at www.mesa-project.org.
18. Finance Canada (2009), Canada’s Economic Action Plan: Budget 2009, Chapter 3, p. 89 (available online at www.budget.gc.ca/2009/pdf/budget-planbugetaire-eng.pdf).
19. For more details, see the Action Plan website: www.actionplan.gc.ca/initiatives/eng/.

117
20. Slightly different figures are derived from the Post-Secondary Education Participation Survey (PEPS). These findings are discussed in Chapter 6 and in the MESA 2008 annual report (Educational Policy Institute, forthcoming).
21. In most provinces, eligibility to receive the millennium access bursary is based on: 1) applying for and receiving student financial aid, and 2) meeting a low-income threshold that varies from province to province.
In this section, we will discuss how specific groups of
students make ends meet while in post-secondary
education: low-income students, student parents,
Aboriginal students and students with disabilities.
For these students, who tend to be under-represented
in higher education, the data clearly establish the
importance that loans, whether from the govern-
ment or private sources, play in helping making ends
meet. Simply put, these students rely on student
support policies to meet their needs.
Low-Income Students While low-income students face a number of com-
plex barriers to post-secondary education, it is clear
that they must overcome financial obstacles to get
a higher education. As described earlier, in recent
years, undergraduate university tuition alone could
represent more than 15 percent of the after-tax
income of families in the lowest income quintile.
Many low-income students adopt different strate-
gies to minimize their costs while in school, such
as choosing lower-cost programs (see Ouellette,
2006) or living with their parents. While we have yet
to fully understand how these choices are made,
there is one important observation we can make: not
all low-income students rely on student financial
aid. According to the Youth in Transition Survey
(Cohort A), by age 19, no more than half of students
whose family income was below $50,000 when they
were aged 15 relied on student loans.20
Policy-makers interested in easing the financial
burden of low-income students (through programs
such as the new Canada Student Grant Program)
must be aware that not all students entitled to finan-
cial aid—including grants—will apply for it.
The evaluation of the Millennium Access Bursary
Program offers a unique opportunity to gather infor-
mation on low-income students who applied for
student financial aid and received a bursary. A sample
of bursary recipients was surveyed over the course of
three years.
Table 4.V.2 presents the incidence and mean
amount of income from different sources for low-
income millennium access bursary recipients in
their second year of study. While all of these students
received a loan in their first year of post-secondary
education, the proportion relying on student loans
in the second year was only 85 percent.21 Work
during school plays an important role: 50 percent
of students worked at some point or another during
the year. College students were more likely to work
than university students, and the same was true for
women compared with men. It should be noted that,
on average, these students need roughly $10,000 in
income to fund a year of post-secondary studies.
Table 4.V.1 — Proportion of Post-Secondary Students Who Had Received a Government Student Loan by Age 19 (2004)
Parental Income Level at Age 15 College University
Less than $25,000 49.8% 52.9%
$25,000 to $50,000 40.6% 49.8%
$50,000 to $75,000 20.0% 30.3%
$75,000 to $100,000 8.5% 11.6%
$100,000 and up 4.2% 7.9%
Source: Educational Policy Institute, forthcoming; Youth in Transition Survey.
Chapter 4
V. How Under-Represented Students Make Ends Meet

The Price of Knowledge: Access And sTudenT finAnce in cAnAdA118
Student ParentsAside from other constraints faced by a “typical”
student, student parents also need to factor taking
care of their child(ren) into the equation. A thorough
report by Lero, et al. (2008) on student parents sub-
mitted to HRSDC provides unique information on
this group of students.
Based on the National Graduates Survey, the
authors compare the reliance on borrowing of parent
and non-parent graduates. Table 4.V.3 shows that
female parents were more likely to rely on govern-
ment loans while in school. This is particularly true
of single female parents: 80 percent of these graduates
had received a government loan.
Differences between young parents and their
colleagues of the same age are equally pronounced.
Using the Youth in Transition Survey (Cohort B),
Lero et al. show that 73 percent of student parents
aged 22 to 24 rely on student loans, compared with
53 percent of non-parents.
Aboriginal Students A commonly held view regarding Aboriginal students
is that their post-secondary education costs are
entirely covered by band funding. While we do not
have data on the proportion of potentially eligible stu-
dents supported through such funding, it is clear that:
Table 4.V.3 — Information on Borrowing among Graduates (by Gender and Marital Status)
Parent Non-Parent
Single Female
Married Female
Divorced Female
Total Females Males
Single Female
Married Female
Divorced Female
Total Females Males
Received Government Loan
80% 45% 64% 54% 46% 50% 51% 33% 50% 48%
Borrowed from Other Sources
16% 16% 26% 18% 20% 22% 19% 15% 21% 24%
Bursaries/Grants 48% 24% 40% 31% 21% 22% 18% 21% 21% 18%
Scholarships 21% 20% 22% 20% 17% 32% 27% 18% 30% 28%
Note: The sample size for males is too small to be decomposed in the same way as for females.
Source: Lero et al. (2008); NGS data (2002).
Table 4.V.2 — Income Sources for Second-Year Students Who Received an Access Bursary in the Previous Year
Loans BursariesSummer Savings
Work Income While in School
Family Contributions
Incidence Mean Incidence Mean Incidence Mean Incidence
Mean (per
Month) Incidence Mean Total
All 84.6% $6,319 42.5% $1,953 63.3% $2,475 50% $579 46.8% $1,083 $10,929
Female 84.7% $6,458 43.9% $1,975 61.3% $2,251 53.4% $533 44.5% $997 $10,786
Male 84.4% $6,096 40.2% $1,914 66.4% $2,807 44.5% $665 50.4% $1,222 $11,159
College 81.1% $5,939 39.2% $1,669 60.7% $2,273 54.4% $616 42% $815 $10,096
University 86.7% $6,401 44.7% $2,095 65.7% $2,584 47.6% $551 49.8% $1,230 $11,340
Source: Educational Policy Institute, forthcoming.

CHaPTer 4 — Paying for PosT-seCondary eduCaTion 119
22. Preliminary unpublished results of this study were made available by the Environics Institute to the authors.
23. It is important to remember that Aboriginal students in Manitoba and Saskatchewan qualified for a bursary independently of family income. This caveat should be borne in mind when considering the comparison with non-Aboriginal access bursary recipients (strictly speaking, we are not comparing equivalent groups of students).
1) not all Aboriginal or even First Nations students
receive band funding; and
2) when they do receive band funding, it does not
cover all their costs (see Berger and Parkin, 2008,
for more details).
Preliminary results from a recent survey of Aboriginal
peoples living in Canada’s main urban centres pro-
vide some insight into the financial issues facing
Aboriginal students. The Urban Aboriginal Peoples
Study (UAPS)22 found that, among those surveyed
who were attending post-secondary education, only
40 percent received funding from a band. This number
was naturally higher among those who identified as
First Nations—67 percent. Still, it remains clear that
band funding is far from universally available for
these students.
The survey further shows that only 26 percent of
urban Aboriginal post-secondary students rely on
personal or family savings or income from employ-
ment as their primary source of funding for their
studies. Among those identifying themselves as First
Nations, the figure is 15 percent. By comparison, two-
thirds of the post-secondary students surveyed in
the Class of 2003 study, the vast majority of whom
were not Aboriginal, relied primarily on these
sources of funding (Malatest, 2007).
The difference in access to family savings is hardly
surprising given that the UAPS also shows that only
34 percent of the urban Aboriginal respondents
with children are currently saving money to pay
for their children’s education after high school. This
compares to 75 percent of a general population
sample also surveyed by the UAPS.
Given the lack of personal and family savings,
many Aboriginal students rely on government stu-
dent loans and bursaries. Data from the MESA
project allow a breakdown of the means of financing
post-secondary education used by Aboriginal stu-
dents who received a millennium access bursary.23
As shown in Table 4.V.4, 80 percent of Aboriginal
students who received an access bursary in their first
year of study received financial aid in their second
year. While the percentage relying on loans was
lower than the same figure for non-Aboriginal stu-
dents, the mean amount borrowed was much higher:
about $10,000 compared with a little more than
$6,400.
The LE,NONET project, based at the University of
Victoria and funded by the Canada Millennium
Scholarship Foundation, offers slightly different
information (in large part because LE,NONET par-
ticipants did not have to apply for student financial
Table 4.V.4 — Income Sources for Second-Year Students Who Received an Access Bursary in the Previous Year, by Aboriginal Status
Loans BursariesSummer Savings
Work Income While in School
Family Contributions
Incidence Mean Incidence Mean Incidence Mean Incidence
Mean (per
Month) Incidence Mean Total
Non- Aboriginal
84.7% $6,481 42.1% $2,032 70.3% $2,678 51% $586 46.2% $973 $11,384
Aboriginal 79.5% $10,040 31% $2,097 35.4% $1,779 40.5% $736 37% $715 $12,051
Source: Educational Policy Institute, forthcoming.

The Price of Knowledge: Access And sTudenT finAnce in cAnAdA120
aid to receive a bursary). Table 4.V.5 shows the six
main sources of funding for Aboriginal students
participating in the project.
Table 4.V.5 — Main Sources of Funding for LE,NONET Project Participants
Source Proportion
Band sponsorship 33%
Work 39%
Bursaries 39%
Scholarships (merit-based) 29%
Student loans 39%
Savings 28%
Source: University of Victoria, 2008.
Students with DisabilitiesStudents with disabilities often face extra costs
associated with the different kinds of aids they need
to pursue their studies. According to a recent survey
of 1,026 Canadian students with disabilities, only five
percent did not require a specific aid or service on a
daily basis.
Figure 4.V.1 shows the reliance on different kinds
of aids by students with disabilities. While there
is often no cost related to receiving academic
accommodation or extra extended testing time, drugs
and medical supplies or specialized technology are
certainly more expensive.
About one-third of the survey respondents men-
tioned that there were types of aid they would use
Figure 4.V.1 — Types of Aids and Services Used by Students with Disabilities
0% 20% 40% 60% 80%
Extended testing time
Drugs and medical supplies
Specialized or adaptive technology
Alternative formats (e.g. Braille, audio tape)
Hearing aid
Academic accommodations
11%
7%
37%
39%
63%
75%
Wheelchair/scooter
Specialized transportation systems
Attendant care services
Sign language interpreters
White cane
Crutches or other walking aids
2%
2%
4%
4%
Guide dog
Communication board such as Bliss
Other
No aids or services used
6%
5%
1%
<1%
5%
6%
Note: n=1,026
Source: Chambers et al., forthcoming.

CHaPTer 4 — Paying for PosT-seCondary eduCaTion 121
Figure 4.V.2 — Reasons for Not Accessing Aids and Services
0% 20% 40% 60% 80%
Unaware of available resources
No government program to fund access
Not eligible for bursary programs
Unable to secure awards/bursaries
Unavailable in the area where I live
Too costly for personal purchase
26%
15%
31%
32%
39%
63%
Other 14%
Source: Chambers et al., forthcoming.
Figure 4.V.3 — Sources of Income for Students with Disabilities
0% 20% 40% 60%
Personal Savings
Government Student Loan(Canada Student Loan)
Government Student Grant/Bursary
Government (federal or provincial) financialsupport for persons with disabilities
Money from parents in the form of a gift(that you do not need to pay back)
Work income
31%
29%
37%
45%
45%
45%
Money from parents that you need to pay back
Student line of credit/personal bank loan
Money from other family members in the formof a gift (that you do not need to pay back)
Academic Scholarship fromyour institution (merit based)
Training grant/scholarship
Scholarship or grant from yourinstitution based on need
Money from other family membersthat you need to pay back
Social/income assistance (welfare)
Money from spouse in the form of a gift(that you do not need to pay back)
Money from spouse that you need to pay back
Employment Insurance (EI)
Source of funding for people of Aboriginalor Native identitity (Band funding)
2%
2%
3%
7%
Other 7%
1%
19%
22%
13%
13%
18%
8%
9%
Source: Chambers et al., forthcoming.

The Price of Knowledge: Access And sTudenT finAnce in cAnAdA122
but did not have access to. When asked why they
were not accessing these services, cost was often
cited as the chief reason, whether because it was “too
costly for personal purchase, there was “no govern-
ment program to fund” it or the student was “not
eligible for bursary program” (Figure 4.V.2).
In terms of sources of income (see Figure 4.V.3),
students with disabilities rely mostly on government
loans, personal savings and work. About two in ten
students said they were getting money from their
institution.
While only 18 percent of survey respondents said
they had a line of credit or a bank loan, the amount
they relied on was on average the highest among
under-represented students (Table 4.V.6).
Table 4.V.6 — Sources of Annual Income for Students with Disabilities (Mean Amounts)
Source Mean Amount
Student line of credit/personal bank loan $9,071
Government student loan (Canada Student Loan) $7,864
Work income $7,241
Other $7,113
Training grant/scholarship $6,688
Money from spouse in the form of a gift (that does not need to be paid back) $6,544
Employment insurance (EI) $6,473
Money from parents in the form of a gift (that does not need to be paid back) $5,518
Academic scholarship from institution (merit-based) $5,269
Social/income assistance (welfare) $5,066
Source of funding for people of Aboriginal or Native identity (band funding) $4,319
Money from spouse that has to be paid back $4,009
Money from parents that has to be paid back $3,731
Government student grant/bursary $3,701
Personal savings $3,651
Government (federal or provincial) financial support for persons with disabilities $3,580
Money from other family members that has to be paid back $3,496
Scholarship or grant from institution (need-based) $2,285
Money from other family members in the form of a gift (that does not need to be paid back) $2,185
Source: Chambers et al., forthcoming.

123
Has post-secondary education become more or
less affordable over time? The costs students face,
including but not limited to tuition and fees, books,
accommodations and transit, have been increasing
at a faster pace than inflation. We cannot, however,
end the discussion there. After all, if student resources
have been growing as quickly as their costs, one
could argue that post-secondary education has
remained as affordable as ever. Our review of the
evolution of students’ resources, however, suggests
that particularly for low-income families, revenues
have not kept pace with rising post-secondary costs.
This observation should be a preoccupation for
policy-makers: if we want to increase the parti-
cipation of this under-represented group, at the very
least we should make sure that the costs of attending
post-secondary education do not represent a dispro-
portionate share of their income. This means making
sure that financial aid programs are well designed
and include an appropriate mix of grant and loans.
To a large extent, this is what we already have in
Canada—even more so as of the fall of 2009, with
the introduction of the new Canada Student Grants
Program. But the challenge does not end here, as not
all low-income students make use of financial aid.
Finding ways to reach out to these students and
provide them with the support they need will be one
of the challenges of the next decade.
The discussion of students’ costs and resources
is by no means limited to determining what students
need to have in hand to cover their costs over a year
of study. Indeed, what students need to pay feeds into
the bigger issue of the rate of return to education:
when everything else is held constant, the higher the
costs of education, the lower the returns. In order
to entice people to invest in education, we need to
find means to lower the costs of higher education to
a manageable level. For students who rely on gov-
ernment tax credits and family savings, the return to
higher education is a no-brainer—and affordability
a challenge that can be overcome. For individuals
relying on financial aid and employment income
that has been struggling to keep up with rapidly
increasing costs, the benefits of post-secondary edu-
cation are obscured by the immediate financial
obstacles in the way.
The next decade will require that post-secondary
education stakeholders and policy-makers find ways
to make sure that studying does not pose an in-
surmountable financial burden, seeing groups of
students already under-represented in higher edu-
cation increasingly left behind.
Chapter 4
VI. Conclusion

The Price of Knowledge: Access And sTudenT finAnce in cAnAdA124

Getting to Post-Secondary StudiesAnne Motte
The Price of KnowledgeAccess and Student Finance in Canada
5

127
In this chapter, we examine factors that promote par-
ticipation in post-secondary studies or, conversely, that
hinder it, with the objective of creating or improving
programs or policies to increase participation. We
work from the premise that it is desirable, from both
the individual and societal standpoint, for a signi-
ficant number of people to undertake post-secondary
studies, regardless of their origin, economic situation
or other factors. Thus, this chapter is motivated
mainly by an interest in making the composition of
the student and graduate populations more equi-
table. In other words, we believe that anyone who
has the ability should be able to pursue studies at the
post-secondary level.
As we saw in Chapter 2, significant gaps exist
between certain groups regarding post-secondary
participation, specifically at the university level. With
an eye to ensuring that the student population is
more representative of the overall population, we
must ask ourselves two questions. First, what are
the reasons for the discrepancies? Once those rea-
sons are understood, we can move to the second
question: What actions can we take?
Interest in these two questions is not new. Several
studies have explored predictors of greater or lesser
participation in post-secondary studies among specific
population groups. In addition, several programs and
projects have been implemented in an effort to reduce
educational gaps among certain groups.
In this chapter, we summarize the knowledge
gained both by the research community and as a
result of policies favouring access to post-secondary
studies. Specifically:
• We draw out key messages from various recently
published studies on the determinants of access,
focusing on what factors are important and to
whom they are important, and attempting to
establish which factors can be influenced.
• Given the importance of student financial aid, at
least from the standpoint of government budgets,
we more specifically examine the role it plays in
access to post-secondary studies.
• Lastly, once the state of knowledge has been de-
fined, and because much work remains to be
done, we propose five avenues for action in the
years to come: adopt flexible education systems;
use administrative and survey data in a sustained
manner; implement pilot projects; systematically
evaluate projects and programs; and promote
engagement by the entire community.
Chapter 5
I. Introduction

The Price of Knowledge: Access And sTudenT finAnce in cAnAdA128

129
1. This classification differs somewhat from previous editions of The Price of Knowledge: Junor and Usher (2004) and Berger, Motte and Parkin (2007) group barriers into categories related to information, motivation, academic performance and finance. These groupings were mainly based on answers provided by survey respondents to explain why they might not participate in post-secondary studies. All of these barriers are present in one form or another in the groups of factors listed here.
What factors explain whether an individual chooses to
pursue an education beyond high school? In recent
years, due in large part to the availability of new and
often complex data, we have seen a growing number of
studies that focus on, first, measuring the gaps in post-
secondary participation between certain groups and,
second, explaining the reasons why certain groups—
e.g., Aboriginal Peoples, boys, youth from low-income
families—are under-represented in post-secondary
institutions. The Youth in Transition Survey (YITS),
among others, contains a wealth of data enabling a
better understanding of young people’s transitions and
educational pathways.
We examine the issue of predictors of parti-
cipation by distinguishing between five major groups
of factors, which are inter-related to various degrees:1
1) Individual characteristics such as gender and age;
2) Familial socio-economic factors, including parental
level of education, family income, family structure,
parental employment, mother tongue and ethnic or
cultural origin;
3) Factors linked to academic performance: having a
high school diploma, having taken the prerequisite
courses for admission to a given program (e.g.,
advanced mathematics) or having a grade average
enabling individuals to be admitted to the program
of their choice;
4) Individual behavioural factors such as motivation,
aspirations, preferences and types of activities
engaged in;
5) Factors related to the environment in which youths
live: friends, distance from home to a post-secondary
institution, institutional accommodation capacities
and requirements, economic conditions in their
region, availability of information, availability of
guidance counsellors, tuition fees and student
aid policies.
Would addressing any one of these five major groups
of factors allow the issue of access to studies to be
resolved overnight? The answer, unfortunately, and
as one would expect, is no. As Berger, Motte and
Parkin (2007) point out, factors are often inter-related
and cumulative. For example, a youth with a poor
academic record may be less motivated to continue
studies, especially if he or she lives in a region with
low unemployment. In a similar vein, but using a
lightly different combination of factors, Thiessen
(2009) concludes that the participation gaps observed
for Aboriginal, immigrant and visible minority
groups cannot be attributed to a single set of factors.
In addition, depending on the group of individuals
studied, a given factor can play a more or less impor-
tant role. This is easy to comprehend intuitively: for
example, the reasons why a boy might not be moti-
vated to pursue post-secondary studies may well differ
from the reasons a girl is not motivated to do so. Below,
we examine more closely the actual participation gaps
between boys and girls, youth from lower- and higher-
income families, youth from different regions of
Canada and Aboriginal and non-Aboriginal youth.
Chapter 5
II. Factors Explaining Participation in Post-Secondary Studies

The Price of Knowledge: Access And sTudenT finAnce in cAnAdA130
Gaps Between Boys and GirlsUnequal rates of participation by men and women in
post-secondary studies have become a notable pre-
occupation in Canada and in several other OECD
countries as well—and they are a cause for concern.
Rates of participation are higher for women than
for men, and this gap results mainly from higher
participation in university studies (see Figure 5.II.1).
Given that the number of men pursuing studies has
not decreased, it is essential to investigate the rea-
sons for the surge in the number of women pursuing
studies and the more modest increase for men.
Before they even reach the age at which they
would enrol in college or university studies, boys are
more likely to drop out of high school. This is an area
of concern in many provinces, and Quebec, among
others, has placed it high on the agenda. Given
that obtaining a high school diploma is often a pre-
requisite for continuing studies, efforts to reduce
dropout rates are highly relevant to the goal of
improving access to post-secondary studies.
Table 5.II.1 presents the latest dropout rates
among youth from different provinces in Canada. It
is immediately apparent that the rates are not only
higher for boys, but are higher in certain provinces,
such as Quebec and Alberta.
Males—All PSEFemales—All PSEMales—CollegeFemales—CollegeMales—UniversityFemales—University
0%
10%
20%
30%
40%
50%
60%
70%
80%
Figure 5.II.1 — Post-Secondary Participation Rate among Those Aged 18 to 24 by Gender, 1993–2006
1993 1994 1995 1996 1997 1998 1999 2000 2001 2002 2003 2004 2005 2006
Source: Survey of Labour and Income Dynamics (SLID).
Table 5.II.1 — High School Dropout Rate among Youth Aged 20 to 24 in 2004–05 by Gender and Province of Residence
Boys Girls Difference (Percentage Points)
NL 9.8% 7.7% 2.1
PE 10.5% 8.3% 2.2
NS 11.9% 5.0% 6.9
NB 12.7% 8.0% 4.7
QC 14.4% 8.5% 5.9
ON 10.8% 6.4% 4.4
MB 13.6% 12.6% 1.0
SK 12.2% 9.8% 2.4
AB 13.8% 10.5% 3.3
BC 7.6% 6.6% 1.0
Source: Statistics Canada, Labour Force Survey.

CHaPTer 5 — geTTing To PosT-seCondary sTudies 131
Longitudinal data (that is, data that track the same
individuals over time) gives us a much clearer picture
of the possible reasons for these gaps. Lefebvre and
Merrigan (forthcoming) explore this issue using data
from the National Longitudinal Survey of Children
and Youth (NLSCY). In particular, the authors aim to
shed light on the reasons why boys and girls drop out
in Quebec and elsewhere in Canada.
For the 18- to 23-year-old age group, the NLSCY
data show a gap of 13 percentage points between
girls and boys in the rate of high school completion
in Quebec. Several factors come into play. The results
of the analyses, however, reveal that the weight of
these factors varies according to which groups are
considered. Among girls in Quebec, those who per-
ceive themselves to be in poor health, who come
from low-income families, who have poor grades in
mathematics or whose parents have low expecta-
tions are more likely to drop out. For boys in Quebec,
factors related to low socio-economic status seem to
play a major role. In the rest of Canada, it is above all
parental expectations and family structure that make
a difference for both girls and boys. However, among
boys outside Quebec, those who perceive themselves
to be in poor health, who have parents with a low
level of education or who are not doing homework
are more likely to drop out. To sum up, the situation
is complicated: things are different for, say, a boy in
Quebec compared to a girl in the same province or a
boy elsewhere in the country.
While college participation rates are similar for
men and women, the gap widens at the university
level. According to Frenette and Zeman (2008),
nearly 30 percent of the discrepancy between male
and female university participation rates is explained
by academic factors—more specifically, by grade
point average (GPA) in high school.
While he also focuses on factors related to academic
performance (i.e., the reasons why boys have lower
averages in high school than do girls), Drewes (2009)
examines the issue of the gender gap in university
attainment from the perspective of the role played
by admissions policies. Although admission to uni-
versity does not take into account the gender of the
applicant, the fact that it is based on one’s academic
record may result in a widening of the gap between
males and females: if, as we have seen, boys tend to
have lower averages than girls, they are less likely to
be admitted from the start.
To illustrate this point, let us look at Drewes’s argu-
ment using YITS data. Suppose that the minimum
average for admission to university is 70 percent, that
all young people want to enrol and that universities
are able to admit all students who achieve that average.
Table 5.II.2 reveals that 74 boys out of 100 and 86 girls
out of 100 would be admitted, given that girls are more
likely to have higher averages. If the grade threshold
for admission is increased, the gap widens even more.
Table 5.II.2 — Distribution of High School Grades by Gender
High School Average Boys
Boys (Cumulative Distribution) Girls
Girls (Cumulative Distribution)
90%+ 5.8% 5.8% 8.7% 8.7%
80%–89% 26.4% 32.2% 37.8% 46.5%
70%–79% 41.8% 74.0% 39.1% 85.6%
60%–69% 21.4% 95.4% 12.3% 97.9%
55%–59% 3.1% 97.5% 1.5% 99.4%
50%–54% 0.9% 99.4% 0.4% 99.8%
<50% 0.6% 100% 0.3% 100.1%
Sources: Drewes (2009), Youth in Transition Survey.

The Price of Knowledge: Access And sTudenT finAnce in cAnAdA132
Rather than suggesting that affirmative action mea-
sures be applied to ensure more boys are admitted
to university, Drewes concludes that if the parti-
cipation gap between the genders is cause for
concern, it is essential that measures be identified
for improving boys’ degree of motivation and ability
to achieve higher secondary school grades.
This observation represents quite a challenge, as it
involves other environmental factors. Among other
things, the financial benefits of a post-secondary
degree tend to be weaker for males than for females.
Thus, while obtaining a university degree will certainly
mean a higher income for both girls and boys, when
one considers the income that can potentially be
earned with a high school diploma and the costs of
investing in a higher education, continuing studies is
a somewhat less interesting proposition for boys
(Frenette and Zeman, 2008).
Another aspect of the participation gap that is rarely
mentioned, but which seems to us to be a contributing
factor, relates to the social prestige of different types
of employment. We must stress that this is merely a
hypothesis, but if the jobs that boys can find without
the benefit of a post-secondary degree are more valued
by society (in addition to being more lucrative),
it would not be surprising if boys were less motivated
to pursue post-secondary studies as a result. This
research avenue warrants further investigation.
Gaps Between Youth from Low- and High-Income FamiliesRates of participation in post-secondary studies are
lower among young people from low-income fami-
lies. As shown in several studies (see Chapter 2), this is
particularly true among young people at the uni-
versity level.
Much has been written over the past few decades
about the participation gap in post-secondary studies
between lower- and higher-income youth. The debate
centres on attempts to determine whether financial
constraints or family environment is at the root of
lower participation among youth from low-income
families. Answering this question would have signi-
ficant implications in terms of public policy
development: if financial constraints are predominant,
then funding policies would be the core of the
solution; if, on the other hand, family environment is
the key, then policies aimed at supporting youth from
a younger age would be needed.
Here, the existence of longitudinal data again
enables us to refine our knowledge of the subject. In
Canada, the YITS and the NLSCY are two sources of
data that can be used to produce a snapshot of a
youth’s family situation before beginning studies.
The NLSCY, among other things, provides measures
1994–1995
1996–1997
1998–1999
1995–1996
1997–1998
1999–2000
2001–2002
2000–2001
2002–2003
UniversityCollegeNo PSE
Figure 5.II.2 — Trend in Family Income According to the Child’s Eventual Education Status in 2004–05 (at age 18–21)
Rea
l 200
2 D
oll
ars
$0
$20,000
$40,000
$60,000
$80,000
$100,000
$120,000
$140,000
Source: Groux, 2007.

CHaPTer 5 — geTTing To PosT-seCondary sTudies 133
2. Participation in studies was measured among NLSCY respondents between the ages of 18 and 21 in 2004–05.
of family income at different times, whereas in the
YITS a single measure of family income is taken
when the youth is 15 years old.
On a strictly descriptive level, the NLSCY shows
that young people who reach university come from
families that, over time, have experienced significant
increases in income (see Figure 5.II.2).2 Between
1994–95 and 2002–03, the families of young people
who enrolled in university in 2004–05 (at age 18 to
21) saw their incomes rise by 42 percent; the rise in
income for families with young people who enrolled
in college was 34 percent; and it was 24 percent for
the families of those who did not pursue post-
secondary studies. Not only did family incomes show
differing rates of growth, but the starting points were
also widely divergent. Whatever the explanation
may be, it is clear that the financial circumstances of
families are very different.
Are the participation gaps entirely linked to family
income? Or are there other factors involved? For
example, it may be that the high school grades of
young people from low-income families are lower
and that this factor—rather than income level itself—
explains the gaps.
Frenette (2008) conducted an in-depth exploration
of possible reasons for the participation gaps between
different income quartiles. As Table 5.II.3 shows,
young people who at age 15 were living in families in
the lowest income quartile were more likely to :
• have a lower university participation rate;
• have parents who did not pursue post-secondary
studies;
• be living in a single-parent family at age 15;
• have parents whose expectations with regard to
higher education were lower;
• score lower on reading tests; and
• have friends who did not aspire to post-secondary
studies.
That being said, compared with youth from higher-
income families, those from families with lower
incomes attributed similar levels of economic benefit
to post-secondary studies. By and large, half of young
people perceived the benefits of higher education as
being high.
These descriptive data suggest that there are sev-
eral factors that may explain the gaps in university
participation across income quartiles. Frenette uses
regression models to isolate the contribution of each
of the factors to the 29 percentage point gap observed
Table 5.II.3 — Characteristics of Canadian Youth by Parental Income Quartile, at Age 15
First Quartile (Lowest Income Level)
Second Quartile
Third Quartile
Fourth Quartile (Highest Income Level)
Enrolled in university at age 19 31.0% 33.5% 43.4% 50.2%
Parents did not attain PSE 46.9% 35.0% 24.6% 17.5%
Living in a single-parent family at age 15 30.3% 14.8% 8.2% 5.0%
Parents expect child to obtain a university degree
62.0% 65.2% 72.9% 79.4%
Reading Test Score
Below 25th percentile 32.2% 25.9% 21.7% 18.8%
Between 25th and 50th percentile 26.6% 26.0% 24.4% 22.5%
Between 50th and 75th percentile 23.2% 25.0% 26.2% 25.8%
75th percentile or above 17.9% 23.0% 27.7% 32.8%
Few or no friends aspire to PSE 20.5% 19.4% 15.0% 14.0%
Perceive financial barriers to pursuit of university studies
13.4% 10.9% 7.9% 5.9%
Source: Frenette (2008).

The Price of Knowledge: Access And sTudenT finAnce in cAnAdA134
3. It should be kept in mind that the results take for granted the existing financial aid system. In no case should they be construed as suggesting that less generous financial aid programs or more expensive tuition would have no impact on access to studies.
in the rate of university participation between youth
in the first and fourth income quartiles. The three
key factors emerging from the analysis are: parental
education (responsible for 29.9 percent of the gap);
reading scores (responsible for 19.7 percent); and
GPA (responsible for 14.3 percent). Financial barri-
ers ranked fourth (responsible for 12 percent of the
gap), followed by parents’ expectations (responsible
for 11.6 percent).
It would seem, therefore, that financial barriers pro-
portionately play a lesser role than do youths’ family
background and academic performance.3 Financial
constraints may thus be less important determinants
than family context.
Does Money Matter More Than Ability?
income students are higher than for low-income
students, academic performance is still a factor.
Figure 5.II.3 presents the participation rates of
young people who, at age 15, scored in the lowest
quartile on PISA tests. A majority of young people
in the two lowest income quartiles did not parti-
cipate in post-secondary studies, while this was
true of a little more than a third of youth in the
upper income quartile.
Among youth whose PISA scores ranked in the
highest quartile, those who were in the lowest
American data suggest that access to education is
often easier for young people with poor grades who
come from wealthy families than for bright young
people who come from poor families. Among others,
Heller (2007) shows that the post-secondary parti-
cipation rate for students with high socio-economic
status and poor grades is the same as that for
students with low socio-economic status and high
grades. The YITS data allow us to explore the possi-
bility of this occurring in the Canadian context.
They show that, even if participation rates for high-
Figure 5.II.3 — Participation Rate among Youth in the Lowest PISA Score Quartile by Family Income
0
10
20
30
40
50
60
70
80
Parental Income Q1 (lowest)Parental Income Q2Parental Income Q3Parental Income Q4 (highest)
% No PSE % College % University
PISA score Q1 (lowest)
% Unknown

CHaPTer 5 — geTTing To PosT-seCondary sTudies 135
Does Money Matter More Than Ability? (continued)
This doesn’t mean that family income matters
more than ability. As seen in Figure 5.II.4, there is
a significant gap between the university participa-
tion rate of youth with high PISA scores and low
family income (54 percent) and those with low
PISA scores and high family income (15 percent).
income quartile were more likely than those in
the highest income quartile to either forgo post-
secondary studies or pursue college-level studies.
Regarding participation in university studies, there
was a gap of 20 percentage points between youth
from the lowest and highest income quartiles, even
among those with the same category of PISA scores
(Figure 5.II.4).
Figure 5.II.4 — Participation Rate among Youth in the Highest PISA Score Quartile by Family Income
0
10
20
30
40
50
60
70
80
Parental Income Q1 (lowest)Parental Income Q2Parental Income Q3Parental Income Q4 (highest)
% No PSE % College % University
PISA score Q4 (highest)
% Unknown
0%
20%
40%
60%
80%
100%
High Achievement,Low Income
High Achievement,High Income
Low Achievement,High Income
Low Achievement,Low Income
Attend UniversityAttend CollegeDrop Out of PSEDo Not Attend PSE
Figure 5.II.5 — Participation in Post-Secondary Education by PISA Score and Family Income
75
54
159
10
19
36
24
6
10
9
9
6 14 38 55

The Price of Knowledge: Access And sTudenT finAnce in cAnAdA136
Gaps Between Youth from Different Regions of CanadaOn the face of it, in terms of the likelihood of post-
secondary attainment, the impact of having a good
academic record or parents with high income should
not differ according to one’s province of residence.
But the data show otherwise. Rates of participation
in post-secondary studies do differ from one pro-
vince to another. Differences in population makeup,
the strength of local economies and provincial
education systems are all factors that need to be
considered as explanations for these geographic gaps
in participation.
Finnie and Mueller (forthcoming) show that the
determinants of participation in university studies
do not all have the same weight in all provinces.
Parental income can play a more or less important
role depending on the province, and the same is true
for grades. For example, while it is true all across
Canada that having good grades in high school
increases the likelihood of continuing studies, the
probability differs slightly by province.
By way of illustration, let us take two high school
students who each have an 80 percent average and
are identical in all ways except for their province of
residence. One lives in Ontario and the other in Nova
Scotia. In both cases, having a better high school
average improves the student’s odds of enrolling in
university. As Figure 5.II.6 shows, however, the stu-
dent from Nova Scotia is more likely to participate in
university studies. The result differs if we compare
our hypothetical Ontario resident to an otherwise
identical student living in Quebec: with equal grades,
the latter is less likely to participate in university
studies (see Figure 5.II.7).
Figure 5.II.7 — Predicted Probability of University Participation by Overall High School Grade in Quebec and Ontario
0%
20%
40%
60%
80%
100%
QCON
65 68 72 75 78 82 85 88 92 95
Pro
bab
ilit
y o
f go
ing
to u
niv
ersi
ty (%
)
HS overall grades
Figure 5.II.6 — Predicted Probability of University Participation by Overall High School Grade in Nova Scotia and Ontario
0%
20%
40%
60%
80%
100%
NSON
Pro
bab
ilit
y o
f go
ing
to u
niv
ersi
ty (%
)
HS overall grades
65 68 72 75 78 82 85 88 92 95

CHaPTer 5 — geTTing To PosT-seCondary sTudies 137
With regard to family income and university parti-
cipation, differences again emerge depending on
the province of residence. While higher income is a
predictor of greater participation in university studies
in both Ontario and Nova Scotia, the participation
gaps according to income level are more moderate
in Ontario (see Figure 5.II.8). Figure 5.II.9 compares
Quebec and Ontario. In Quebec, as in Ontario, the
relationship between family income and parti-
cipation is moderate, but at the same income level,
the likelihood of participation is lower in Quebec.
In addition to the gaps from province to province,
there are gaps between urban and rural regions within
provinces. As Table 5.II.4 shows, rates of participation
in post-secondary studies for youth in rural commu-
nities are typically lower.
Table 5.II.4 — Rates of Participation in Post-Secondary Studies by Urban/Rural Status
Post-Secondary Participation
University Participation
Urban 76% 58%
Rural 67% 46%
Total 74% 56%
Source: Looker (2009), Youth in Transition Survey.
Figure 5.II.8 — Predicted Probability of University Participation by Family Income in Nova Scotia and Ontario
0%
20%
40%
60%
80%
100%
NSON
5 21 37 53 69 86 102 118 134 150
Pro
bab
ilit
y o
f go
ing
to u
niv
ersi
ty (%
)
Family income (1000$)
Figure 5.II.9 — Predicted Probability of University Participation by Family Income in Quebec and Ontario
QCON
5 21 37 53 69 86 102 118 134 1500%
20%
40%
60%
80%
100%
Pro
bab
ilit
y o
f go
ing
to u
niv
ersi
ty (%
)
Family income (1000$)

The Price of Knowledge: Access And sTudenT finAnce in cAnAdA138
The situation appears slightly more complicated if
we focus on differences in participation by region.
Figure 5.II.10 reveals that, except in the Prairies
(Manitoba and Saskatchewan), where the difference
is minimal, the rate of participation in post-secondary
studies among rural and urban youth varies by four
to 11 percentage points within each region. The most
significant gaps are in Quebec and the West (Alberta
and B.C.).
If we focus on university participation only, the
picture is slightly different, as seen in Figure 5.II.11:
there are much wider gaps between regions when it
comes to participation by youth from rural communi-
ties. In Ontario, there is a gap of 22 percentage points in
university participation rates for urban and rural youth,
but the gap is only seven percentage points in Quebec.
To understand these differences, it is worth exa-
mining whether it is the fact of living in a rural
0%
10%
20%
30%
40%
Atlantic Quebec Ontario Manitoba/Saskatchewan
Alberta/B.C.
Figure 5.II.10 — Rates of Post-Secondary Participation by Region and Urban/Rural Status
50%
60%
70%
80%
90%
100%
Urban Rural
Source: Looker (2009).
Figure 5.II.11 — University Participation by Region and Urban/Rural Status
0%
10%
20%
30%
40%
Atlantic Quebec Ontario Manitoba/Saskatchewan
Alberta/B.C.
50%
60%
70%
80%
90%
100%
Urban Rural
Source: Looker (2009).

CHaPTer 5 — geTTing To PosT-seCondary sTudies 139
Post-Secondary “Intenders”: What Keeps Them Out of Higher Education?
information causes a lack of motivation or vice
versa is impossible to tell, but it is clear that the
two have a compounding effect.
Intenders were less likely than post-secondary
pursuers to have parents who had themselves
attained education beyond the high school level.
They also had lower grades than those who
pursued post-secondary education. Nearly half
of the intender group reported skipping class in
Grade 12 two or three times a month; only 26 per-
cent of students who went directly from high
school to post-secondary (referred to in the report
as “direct pursuers”) skipped class that often.
Additionally, intenders appear to have been
less engaged in high school life. Whereas about
two-thirds of direct pursuers participated in acti-
vities outside of school, such as music programs,
sports, clubs and drama, only half the intenders
did so. One-third of intenders reported that many
of the things they learned during their last year of
high school were not useful, compared to 23 per-
cent of direct pursuers. Forty-one percent of
intenders reported doing as little work as possible,
compared to 13 percent of direct pursuers.
It may come as little surprise that many high
school students drift through the educational
system with little in the way of motivation, earning
relatively weak grades and avoiding the concrete
steps that need to be taken to pursue post-
secondary education. Yet even at the age of 20,
many of these individuals want to attain some
form of higher education. While they may be more
likely to be undecided about the kind of post-
secondary education they want, virtually none are
satisfied with ending their educational careers
after high school.
A 2008 Canada Millennium Scholarship Foundation
study provides insight into the situation of indivi-
duals who reported a desire to pursue post-secondary
education but had not done so within two years of
completing high school. In Pursuit of PSE: Whether
and When to Go On, prepared by Dr. Lori McElroy
(2008b), offers the results of a survey of these youth
in addition to administrative data concerning their
high school graduating GPA, their performance in
Grade 12 English and math courses, their Abori-
ginal status and their location within the province.
The survey sample was designed to yield equal
size groups of post-secondary pursuers and non-
pursuers, in order to better enable comparisons
between the two.
The report reveals that post-secondary “in-
tenders,” who have not yet pursued higher edu-
cation but wish to do so, are more likely than
post-secondary pursuers to encounter financial
barriers to post-secondary education. Thirty-five
percent of them reported being averse to borrow-
ing to pay for their education; 35 percent also
reported a need to work to support themselves or
their families. While they may be deterred by the
growing cost of higher education, the intenders
were also likely to overestimate tuition costs by a
factor of nearly two to one.
Post-secondary intenders were more likely than
those who enrolled in post-secondary education
to report motivational barriers to higher studies.
These include indecision about educational or
career plans—often a sign of a lack of engagement
in their own future planning—or the desire to take
a break from schooling altogether. Many intenders
were also likely to be poorly informed about the
financial aspects and academic requirements of
post-secondary education. Whether their lack of

The Price of Knowledge: Access And sTudenT finAnce in cAnAdA140
4. We are mindful of the fact that situations vary for individuals from First Nations, Metis, Inuit and off-reserve Aboriginal populations in Canada, from east to west and north to south. However, the available data do not always allow us to conduct analyses at this level of detail.
community that has an impact on participation in
post-secondary studies or whether the gaps are
explained by other characteristics of youth. The study
reported in Looker (2009) reveals that after control-
ling for various factors, the fact of living in a rural
community does not have a significant impact in
terms of post-secondary (college or university) parti-
cipation. In other words, factors such as the education
or income of parents are more important than
residence in a rural area. The impact of living in a rural
area, however, is somewhat significant, when study-
ing the gap between rates of university attainment.
Gaps Between Aboriginal and Non-Aboriginal YouthEnsuring full participation in post-secondary studies
by Aboriginal peoples is a challenge incumbent upon
all of Canadian society. The gains, both economic and
social, are too important for us to stand by and do
nothing. Sharpe et al. (2007, 2009) have clearly dem-
onstrated that in the specific case of Aboriginal
populations, there is no equity versus effectiveness
debate: increasing Aboriginal peoples’ level of edu-
cation would result in net gains for all of Canada.
To increase participation in post-secondary studies
by Aboriginal peoples we must, once again, begin
by understanding the factors in play.4 There is con-
sensus on the initial step that needs to be achieved:
ensuring that Aboriginal youth complete high school
(see Mendelson, 2006; Berger, Motte and Parkin, 2007;
and Kroes, 2008). A qualitative study conducted by
Malatest and Stonechild (2008) reveals that sub-
sequent attainment of post-secondary studies is not
simply a matter of money. Aboriginal youth who
were interviewed emphasized that they lacked infor-
mation about the means available for funding their
studies. In addition, their relations with guidance
counsellors were tenuous, and they had few friends
or family members who had pursued post-secondary
studies.
Frenette (forthcoming) uses YITS data to shed
light on the participation gap between Aboriginal
youth living off reserve and non-Aboriginal youth.
Figure 5.II.12 demonstrates the systematic gap favour-
ing non-Aboriginal youth with respect to attainment
of a given level: while 93.7 percent of non-Aboriginal
youth aged 21 had completed high school, the same
was true of only 82.7 percent of Aboriginal youth.
With regard to university attainment, a gap of 17 per-
centage points was noted.
0%
10%
20%
30%
40%
High schoolcompleted
Participation inpost-secondary
studies (among highschool graduates)
Participation inuniversity studies
(among highschool graduates)
Figure 5.II.12 — Educational Status at Age 21 by Aboriginal Status
50%
60%
70%
80%
90%
100%
Non-AboriginalAboriginal
Source: Youth in Transition Survey Cohort A (YITS-A).

CHaPTer 5 — geTTing To PosT-seCondary sTudies 141
As we have mentioned, two questions are of
particular interest in the case of Aboriginal youth:
what are the main factors explaining the gap in high
school completion rates, and what factors explain
participation in post-secondary studies? A study
by Frenette (forthcoming) is able to explain 53 per-
cent of the gap in high school completion rates and
90 percent of the gap in university attainment rates
(see Table 5.II.5). In both cases, academic results are
a strong determinant, explaining 25.4 percent and
44.7 percent of the respective gaps. Family environ-
ment and income also play a role, although they are
less significant.
Table 5.II.5 — Proportion of High School Completion and University Attainment Gaps Explained by Select Factors
Gap in High School Completion Rate Between Non-Aboriginal
and Aboriginal Youth
Gap in University Attainment Rate Between Non-Aboriginal
and Aboriginal Youth
Gross variance 11 percentage points 17 percentage points
Proportion of gap explained by observable factors
53% 90%
Academic results 25.4% 44.7%
Family environment (mother’s schooling, family structure, mother’s age when youth born)
10.4% 19.9%
Parental income 3.6% 3.7%
Source: Frenette, forthcoming.
Minority Francophone Communities
while remaining in their province of residence or
closer to home. Access to higher education in French
and, more specifically, to a broad range of programs
taught in French is far from being a reality for many
of these young people.
Working from a survey of nearly 5,000 Grade 12
students enrolled in French-language schools in
minority settings, Allard, Landry and Deveau (2009)
present a unique portrait of their educational aspi-
rations. The vast majority of these young people
(87.9 percent), strongly intend to pursue a post-
secondary education, including three-quarters who
intend to pursue college or university studies in the
months after completing high school.
In Canada, youth in official language minority
communities (i.e., anglophones living in majority
francophone communities and francophones living
in majority anglophone communities) have access to
education in their mother tongue when numbers
warrant. This applies only at the elementary and high
school levels, however. Many observers maintain
that the policy should be extended to post-secondary
education.
A number of recent studies have specifically
examined the situation of minority francophone
communities. Besides having to deal with the bar-
riers described in this chapter, francophones in these
communities often have to choose between pur-
suing studies in French far from home or in English

The Price of Knowledge: Access And sTudenT finAnce in cAnAdA142
Minority Francophone Communities (continued)
groups of young people: 7.9 percent of those in
New Brunswick viewed distance as a major barrier,
while this was the case for more than 17 percent of
youth in the rest of Atlantic Canada and in the
West/North. It should also be noted that close to one
in five young people in New Brunswick and else-
where in the Atlantic provinces saw poor grades in
French as a major barrier. Meanwhile, preference
for English was viewed by the vast majority of stu-
dents as a minor or moderate barrier, suggesting an
overall willingness to pursue studies in French.
In the same vein, but focusing more specifically
on the situation of Ontario francophones, Labrie,
Lamoureux and Wilson (2009) also demonstrate
that distance from post-secondary institutions plays
a crucial role in young francophones’ education
choices. Franco-Ontarian youth who go directly
from secondary to post-secondary education and
pursue studies in French tend to enrol at the
college level and at an institution located within a
75-kilometre radius of their high school. For those
who choose to go to university, distance seems
to be less of a factor, as they will move more than
150 kilometres to pursue their studies. It would be
interesting to know to what extent students who
enrolled in college would have instead enrolled in
university if such an institution existed close by.
These strong intentions are certainly good news.
Moreover, in these terms, the behaviour of young
francophones in minority settings does not seem to
differ from their anglophone peers. One issue cannot
be ignored, however: there is not necessarily a link
between strong intention to continue studies and
intention to pursue such studies in French. Yet as the
authors point out, access to a French-language edu-
cation helps ensure linguistic vitality through the
passing on of language and culture from generation
to generation.
Table 5.II.6 shows that in the eyes of students
themselves, the likelihood of pursuing post-
secondary education in French varies greatly. While
in New Brunswick 71.4 percent of students believed
there was a strong likelihood that they would pursue
studies in French, this was the case for well below
half of young francophones living outside Ontario
and New Brunswick.
Student perceptions of the significance of barriers
to pursuing a post-secondary education in French
also vary by region. Among other things, since
French-language post-secondary teaching insti-
tutions are unequally distributed across Canada
(corresponding to the distribution of francophones
across the country), it is not surprising to note that
perceptions with regard to distance from a franco-
phone institution differed enormously among
Table 5.II.6 — Likelihood of Pursuing Post-Secondary Education in French
New Brunswick Rest of Atlantic Ontario West/North
Weak 13.4% 46.5% 23.4% 33.6%
Moderate 15.3% 18.1% 19.4% 23.8%
Strong 71.4% 35.6% 57.2% 42.7%
Source: Allard, Landry and Deveau (2009).

CHaPTer 5 — geTTing To PosT-seCondary sTudies 143
5. To achieve equity, one might be tempted to lower enrolment rates for the over-represented groups. We remind readers, however, that our objective is to increase levels of education.
SummaryFrom the studies reviewed above examining access
gaps, two principal conclusions may be drawn:
• There is no one factor, nor single group of factors,
that entirely determines participation in post-
secondary studies.
• The same factor can play a vastly different role
from one population group to the next.
These observations clearly make achieving our
objective of increasing access to post-secondary
studies more complicated: for a specific problem—
that is, reducing the gap in rates of participation in
post-secondary studies—it becomes necessary to
adopt an approach involving several different aspects.
The challenge for policy-makers is a daunting one,
because an environment that will promote more
equal representation of the under-represented groups
must be created.5
From the point of view of those tasked with making
policy or developing programs promoting better
access to post-secondary education, identifying
those factors that can be acted upon is essential. The
advantages and costs of program implementation
must also be weighed.
If we return to the five groups of factors listed at the
beginning of this section, it is immediately obvious
that there are some variables that can be acted upon
and others that cannot. It is difficult, for instance,
to imagine making changes to inherent individual
characteristics. Similarly, simply changing parental
levels of education or family income cannot really
Minority Francophone Communities (continued)
Table 5.II.7 — Perception of the Significance of Barriers to Pursuing Post-Secondary Education in French
New Brunswick Rest of Atlantic Ontario West/North
Preference for English
Minor barrier 60.6% 40.9% 51.1% 41.7%
Moderate barrier 31.2% 44.2% 37.7% 47.0%
Major barrier 8.1% 14.9% 11.2% 11.3%
Distance from francophone institution
Minor barrier 64.7% 47.5% 53.0% 42.2%
Moderate barrier 27.4% 35.4% 35.1% 39.9%
Major barrier 7.9% 17.1% 11.9% 17.9%
Number and funding of bursaries
Minor barrier 60.6% 58.6% 58.4% 44.4%
Moderate barrier 33.9% 28.2% 34.3% 45.6%
Major barrier 5.5% 13.3% 7.3% 10.0%
Poor grades in French / Weak interest
Minor barrier 50.0% 43.4% 53.2% 54.7%
Moderate barrier 31.4% 35.2% 31.7% 35.2%
Major barrier 18.6% 21.4% 15.1% 10.2%
Source: Allard, Landry and Deveau (2009).

The Price of Knowledge: Access And sTudenT finAnce in cAnAdA144
be envisioned as a solution. It should be possible,
however, to effect changes indirectly: for example, by
finding a way to equip parents who have lower levels
of education with the tools they need to help their
children make informed choices about their future.
Measures for effecting changes may vary widely
in terms of both costs and benefits. Choices must
therefore be made in the context of these constraints.
Moreover, it is important to always keep in mind
the interactions between the various factors: for
instance, a method of intervention that attempts to
improve youths’ academic performances may lead
to changes in behaviour.
The Importance of Employing Varied Methodologies
“Everything that can be counted does not necessarily count; everything that counts cannot necessarily be counted.”
— Albert Einstein
groups. A series of questions prompted students
to discuss their school experience, their future
and the reasons why they had deferred their
decision with regard to pursuing studies. The
discussions revealed a fairly high level of indeci-
siveness with respect to career choice, manifested
in a strong fear of making the wrong decision
about a program of study and of “wasting money”
on tuition fees. In addition, young people said
they worried about ending up stuck in a job that
wouldn’t correspond to their expectations.
In a research project by Malatest and Stonechild
(2008) on First Nations youth, it emerged from
many interviews that student loans represent a
risk that was not accounted for by quantitative
data. Some interview participants displayed a
reluctance to borrow for their studies. Among other
things, several of them said that they weren’t confi-
dent in their ability to succeed in their studies and
therefore felt that going into debt would be too
risky; for others, hesitation about taking on debt
was due to a fear that they would be less able to
provide for their children. In addition, the inter-
views highlighted the degree to which many First
Nations people view their education as a way to
improve their community. This vision contrasts
sharply with that expressed by non-Aboriginal
youth, who tend to focus on the individual
benefits of studies.
Quantitative studies are often popular because they
enable us to put a figure on a trend or a problem.
They can show to what extent two variables corre-
late or calculate the marginal effect of one variable
on another. For instance, we might be interested
in the link between family income and the fact of
pursuing a post-secondary education. While these
studies contain information that is important
for policy-making, it must be noted that other
approaches are needed to deepen our knowledge.
Among these other approaches, qualitative studies—
in the form of semi-structured one-on-one or group
interviews—provide us with individuals’ explana-
tions of why they find themselves in a particular
situation. Unlike survey questionnaires, which often
require the respondent to make a choice from a set
of possible answers, interviews allow participants to
express themselves freely and make connections
between different events. Used as a complement to
quantitative studies, they provide a more complete
picture of the phenomenon being studied and often
lay the groundwork for investigators to proceed
with data collection by means of surveys.
To take one example, EKOS (2009) summarizes
the findings of a series of semi-structured group
interviews with Grade 11 and 12 students who, at
the time, had not yet decided whether to pursue
post-secondary education. Parents of children in
the same situation were also invited to the focus

145
6. We wish to emphasize that we support this principle regardless of tuition fee levels: pursuing studies requires, at a minimum, the ability to have shelter and food without having to forgo income.
Every year, both federal and provincial governments
earmark considerable sums of money for student aid
(see Chapter 6). Educational institutions also grant
scholarships to their students. What is the impact of
such aid programs on access to post-secondary stud-
ies? At the conceptual level, the existence of student
financial aid programs addresses the issue of fairness:
an individual should not have to forgo pursuit of an
education due to a lack of funds. Accordingly, financial
aid reduces the costs that a youth from a low-income
family is required to bear.
It is extremely difficult, if not impossible, to
determine the overall impact of financial aid pro-
grams on post-secondary access. As is often the case
with social policies, we can’t know what the picture
would look like if the structure of financial aid were
different. Nor can we observe the behaviour of one
individual in an environment in which an aid pro-
gram exists and compare it to his or her behaviour
in one where it does not. Since it is not our intention
to question the principle of financial aid in itself, we
are taking it on faith here that such programs are
essential.6 We can, however, ask ourselves whether
modifications could be made to them—for example,
in terms of the composition of assistance provided to
students or the eligibility criteria. We might ask the
following questions, among others:
• Is the amount of aid sufficient to encourage access?
• Does awarding more grants make access to post-
secondary education easier?
• Is information on the various financial aid programs
easily accessible?
• To what extent should we be designing programs for
specific population groups?
Ten or so years ago, attempting to provide answers to
these questions would have been a challenge for the
simple reason that very few Canadian studies on the
subject existed. Specialists tended to look at U.S.
studies and try to map the results onto Canadian
realities. But it is difficult to make such extrapo-
lations—not least because financial aid programs in
the two countries are quite different.
In 2009, more substantial information on the sub-
ject is available. We are still a long way, however, from
definitive answers to all of these questions. While a
growing number of studies explore issues surrounding
modifications to financial aid programs, very few can
provide a clear and precise answer, because the data
often do not allow us to argue beyond mere correla-
tions. Although her article deals mainly with the impact
of financial aid on persistence, Day (2008) gives a good
explanation of why it is so hard to posit a cause-and-
effect relationship in this situation:
Chapter 5
III. The Role of Financial Assistance Policies in Access to Post-Secondary Studies

The Price of Knowledge: Access And sTudenT finAnce in cAnAdA146
7. At the time of writing, Frenette was conducting further analyses on subgroups of students. It is possible that for some subgroups the grant could have had an effect.
“ It is difficult, if not impossible, to disentangle
the effects of financial aid from ... other de-
terminants of persistence using existing data,
in large part because many of those other
determinants also influence the amount of
financial aid received. These interrelation-
ships no doubt explain why there are so many
conflicting results about the effects of financial
aid in the literature ” (p. 328).
All the same, we have a certain body of acquired
knowledge that can help guide our actions. Among
other things, studies tend to show that to promote
access, financial aid should consist of both loans
and grants. Both theoretical and empirical studies
suggest that such a combination helps increase
enrolment rates, in particular those of young people
from low-income families. Carmichael and Finnie
(2008), for instance, explain that grants play a crucial
role by ameliorating the difficulties faced by students
from low-income families:
“ [...] lower-income students will need to bor-
row more money and therefore have to pay
back more money in the future. There is as
well always the chance that students will not
succeed and not gain access to the higher
income stream of a university graduate. In
this event students from poorer families will
again experience a higher level of hardship
than will richer students, since the required
loan repayments are higher” (p. 354).
As part of a project commissioned by the Foundation,
researchers from the Social Research and Demonstra-
tion Corporation and CIRANO developed economic
experiments (also referred to as laboratory experi-
ments) in an attempt to gauge the importance of debt
aversion among youth. The ability to validate the
existence of debt aversion is important for financial
aid policy-making. If such a fear does exist and, more
importantly, if it exists among youth from groups that
are under-represented in higher education, then a
program geared mainly toward loans will doubtless
have limited impact on post-secondary enrolment.
Two principal conclusions emerge from the results
of this project:
1) A financial aid program that offered only grants
would not suffice to render post-secondary edu-
cation attractive to all young people, regardless of
their characteristics. For some youth, reluctance
to pursue a post-secondary education is both
independent of and as strong a determinant as
debt aversion.
2) Young people are not opposed to the idea of taking
on debt to pay for their studies. By and large, how-
ever, they will not borrow at any price. Thus, one
way to reduce the cost of borrowing is to introduce
a non-repayable program component (i.e., grants).
These results substantiate the importance of properly
choosing program parameters. In addition, they indi-
cate that to a certain extent, the structure of existing aid
programs, that consist of both loans and grants, is close
to optimal, which is a very positive sign.
Modifications to financial aid programs represent
unique opportunities for determining the impact of the
changes. Chemin (2009) and Frenette (forthcoming)
capitalize on changes to financial aid policies to explore
their effects. Chemin (2009) isolates the impact of
increases to amounts granted under the Quebec stu-
dent aid program in 2001–02. Through comparisons
with other provinces, he concludes that the improve-
ments led to a six percentage point increase in access.
Meanwhile, Frenette (forthcoming) focused on the
introduction of the Canada Student Grant for Persons
from Low-Income Families (which reduced student
debt). Comparing students who received the grant to
those who did not, he concludes that the grant had no
impact on access to studies overall.7
As the somewhat contradictory findings of these
two studies show, we are a long way from having a
simple, clear idea of the impact of aid programs on
post-secondary enrolment rates. It is important,
however, that we continue efforts to document and
study changes to programs. Assessing many studies
cumulatively is the only way to develop aid programs
that are both equitable and efficient.

147
8. Canadian Council on Learning. “Canada’s PSE performance: file under ‘m’ for missing.” (September 20, 2007). Accessed on August 21, 2009.
9. Considerable effort is being made to remedy the situation. The Council of Ministers of Education, Canada, in collaboration with Statistics Canada, has implemented a nationwide strategy on educational indicators.
The transition to post-secondary studies is often
concurrent with other transitions in an individual’s
life, in particular those undergone by young
people. For youth leaving high school, this transition
corresponds to the entry into adulthood, as Doray
et al. (2009) remind us. Such transitions, because
they involve changes both great and small, are often
periods of fragility for the individual. For some, the
transition to post-secondary education will be a
smooth one; for others, it will be more arduous or else
be rejected as a viable option.
Numerous studies have shed light on the com-
plexity of young people’s educational pathways and
the difficulty experienced by some in attaining
post-secondary studies. To the dismay of many, the
inescapable conclusion is that there is no magic
formula for improving rates of participation in post-
secondary studies.
As we have seen, surmounting or eliminating the
barriers to access is no simple matter. Some barriers
or factors impeding participation are deeply rooted,
and simple, one-dimensional action will not suffice
to overcome them. In addition, there are multiple
factors that combine and overlap when it comes to
explaining lower rates of participation among certain
groups. Focusing on one aspect can be useful, but,
given the complexity of the phenomenon, it is highly
likely that such a strategy will have to be used in combi-
nation with others if it is to bear fruit.
In our opinion, an approach that casts a wide net
will help improve rates of post-secondary parti-
cipation. We suggest five avenues for action:
1) Adopt a more flexible education system;
2) Make sustained use of data;
3) Implement pilot projects;
4) Conduct systematic evaluations of projects and
programs; and
5) Promote engagement from the entire community.
Adopt a More Flexible Education SystemA series of recent studies (Doray et al., 2009, Raymond,
2008; Dubois, 2008; Hango and de Broucker, 2007b;
Looker and Thiessen, 2008; Finnie and Johnson,
forthcoming) have highlighted the diverse nature of
young people’s educational pathways. The one often
described as the classic pathway (i.e., graduate from
high school, enrol in post-secondary studies, then
enter the job market) does not correspond to reality
for a majority of students (see also Chapter 2). Since
situations are far from permanent and transitions
take place at precise ages increasingly less often, it is
essential that education systems be flexible enough
to allow individuals to return to studies without
undue consequences.
Make Sustained Use of DataCanada’s track record is far from faultless when it
comes to providing data to certain international
organizations for the production of reports. According
to the Canadian Council on Learning (2007), the
country was unable to provide statistics for 60 percent
of the tables in a recent OECD report.8 This per-
formance is nothing to be proud of, and measures
should be taken to ensure that international-level
comparisons are possible.9
Is lack of data the problem? Perhaps, insofar as it
is difficult to get a picture of the situation all across
the country. There are, however, some sources of
data that are not exploited. In fact, under-use of data
is just as problematic as a lack of data.
Some Canadian provinces have introduced
unique information systems, which others may well
wish to adopt. Studying the data stored in them pro-
vides a great deal of insight into youths’ educational
Chapter 5
IV. Conclusion

The Price of Knowledge: Access And sTudenT finAnce in cAnAdA148
10. The MESA project revealed that between 20 and 40 percent of respondents did not recall receiving a Canada Millennium Scholarship Foundation bursary, even though all of them had in fact received one. This provides a good indication of the risk involved in relying solely on data gathered through surveys to develop a clear picture of the types and amounts of financial aid received by students.
pathways. Quebec publishes yearly Education Indi-
cators, a collection of statistics based on administrative
data provided by the Ministry of Education. Every
Quebecer who attends an educational institution
(elementary or high school, CEGEP or university) is
assigned a unique numerical identifier (“permanent
code”) enabling their educational pathway to be
tracked for as long as they reside in Quebec. Ontario
and British Columbia have similar databases. Use of
these data by researchers and dissemination of the
research results will enrich our knowledge.
Universities and colleges also possess admini-
strative data that, when used judiciously, can tell us a
great deal about students’ educational pathways,
where they come from and what services they use.
The coupling of administrative data with investi-
gative data is under-exploited in education research
—yet the economies of scale that can be achieved by
successfully combining these two sources of data
are obvious. Among other things, the number of
questions asked as part of a survey can be reduced,
and better quality information can be obtained.10 Of
course, ensuring that personal data are protected is
of paramount importance.
Implement Pilot ProjectsThe time eventually comes when action is required.
To develop new projects, it is crucial to have know-
ledge of what has been done before and the findings
of research work. There are no guaranteed results,
however. We must accept that there will be some risks
involved: it is possible that the chosen action will not
work (which leads us to the next point).
Conduct Systematic Evaluations of Projects and ProgramsThere should be a requirement to evaluate all new
pilot projects or programs. Evaluation is not limited
to measuring the outcomes of a program; it enables
documentation of its implementation and high-
lighting of the challenges that had to be met. These
aspects are essential, not only for replicating a model
but for making adjustments to it.
The Foundation has certainly advocated this ap-
proach in the case of the pilot projects it has funded,
The Transitions and MESA Projects
With the addition of studies published by
Human Resources and Skills Development
Canada, the Canadian Labour Market and Skills
Researcher Network (CLSRN) and Statistics
Canada, among others, our pool of knowledge
on young people’s educational pathways has been
both extended and deepened.
Although they have differing disciplinary approaches
and objectives, the Transitions and Measuring the
Effectiveness of Student Aid (MESA) projects have
contributed to sustained exploitation of the data
collected by the Youth in Transition Survey. In both
cases, the researchers pooled their knowledge by
sharing their interpretations of the data, methodo-
logies, and so on. This approach allowed them to
achieve significant economies of scale.

CHaPTer 5 — geTTing To PosT-seCondary sTudies 149
as evidenced in an article by Charron (forthcoming).
Establishing from the start that a project or program
will be evaluated enables the gathering of invaluable
information that is sometimes impossible to track
down after implementation.
Promote Engagement from the Entire Community To use a somewhat hackneyed expression, “edu-
cation is everyone’s business.” Governments, the
community sector and private enterprise all have
everything to gain from easier and more equitable
access to post-secondary studies. The short-term gains
to be had may not always be obvious: increasing post-
secondary participation rates requires investments by
both individuals and governments, and investments,
of course, mean costs. The benefits, however, will be
felt over the medium term, in terms of increased pro-
ductivity and greater social cohesion.
The creation of partnerships across various
sectors (e.g., private enterprise, non-governmental
organizations) sends a clear message: education
matters. This, in a sense, is what we are seeing
with Pathways to Education in Ontario, the Conseil
régional de prévention de l’abandon scolaire (CREPAS)
in Quebec and the Canadian Post-Secondary Access
Partnership. All are promising initiatives.
There are many options for bridging the skills gap
in the workforce. We can decide to do nothing, based
on the premise that things will adjust over time. We
might envision greater reliance on immigration to fill
workforce needs (not forgetting, however, that other
countries have decided to adopt the same strategy).
We may also decide to invest in a segment of the
population that traditionally has not had access to
post-secondary education. Although the research
described in this chapter underscores the fact that
there is no magic formula, it does allow us to identify
certain avenues to follow.

The Price of Knowledge: Access And sTudenT finAnce in cAnAdA150

Student Financial Assistance in Canada: Past, Present and FutureJoseph Berger and Noel Baldwin
The Price of KnowledgeAccess and Student Finance in Canada
6

153
1. In the next chapter, we examine how these policies affect student debt levels at graduation.
Governments spend a significant amount of money
on post-secondary students. In 2007–08, Canadian
governments provided more than $4.4 billion worth
of student loans, grants and loan reduction payments
to students with financial need. In addition, govern-
ments provided more than $3 billion in education tax
credits, merit scholarships and education savings
grants (paid to families saving for their children’s
education). As explained in Chapter 4, governments
use student aid programs as the principal method of
enabling Canadians with limited resources to keep up
with the rising cost of post-secondary education.
As described in previous volumes of The Price of
Knowledge and in Berger and Parkin (2008), govern-
ment expenditures on public student support in
Canada are not only substantial but complex. Student
financial aid is delivered through an intricate web
of both federal and provincial/territorial programs;
increasingly, colleges and universities are also involved
as sources of funds and administrators of aid pro-
grams. In this chapter, as in previous volumes, we
again enumerate what governments provide to stu-
dents in the form of need-based aid (loans, grants and
loan remission programs) and non-need-based aid
(tax credits, education savings grant payments and
merit scholarships). We also describe how changes in
government policies have affected the amounts and
types of student aid distributed.1 As was the case the
last time we reviewed these data (Berger and Parkin,
2008), the news is mostly good, at least as far as
need-based aid is concerned. Not only are students
receiving more aid, the aid they are receiving is
increasingly non-repayable. Need-based student aid
has improved since 2000 in two distinct waves. Were it
not for the fact that governments continue to devote
billions of dollars to education tax measures that do
little to help those most in need pay for their studies,
the news would be entirely positive.
Following the review of how much financial
support students have been receiving, we shift the
focus to the question of what comes next. We discuss
several different approaches to the modernization and
simplification of student financial aid—approaches
that, taken together, could be part of a comprehen-
sive strategy to improve access and student success.
In the context of a severe recession and anticipated
government budget constraints in the years to come,
we offer suggestions for governments seeking to get
the most out of their aid program dollars. This can be
done by moving toward a system that: reaches stu-
dents early enough to influence their educational
aspirations and planning; is easy to access and
navigate; delivers the best types of aid to the stu-
dents who need it most; adequately covers costs;
keeps debt levels in check; and complements ini-
tiatives designed to alleviate non-financial barriers
to access. Student financial aid programs in
Canada have improved since the 1990s, but, as our
discussion will show, we can still do much better.
Chapter 6
I. Introduction

The Price of Knowledge: Access And sTudenT finAnce in cAnAdA154

155
2. All figures in this chapter, unless otherwise noted, have been adjusted to account for inflation and are expressed in September 2007 dollars.
Need-based aid in Canada is composed of student
loans, grants and loan remission payments (to avoid
double-counting, we henceforth refer to “net loans”
as the value of a loan once remission payments have
been taken into account). Governments provide
need-based aid to students who lack their own funds
to pay for tuition, books and educational and living
costs while in school. All need-based aid is subsi-
dized in Canada: student loans are offered
interest-free while the student is in school, and
grants and loan remission payments do not need to
be paid back (loan remission is paid to reduce the
student’s loan balance retroactively, while grants
either act as “upfront” remission by reducing the
loan amount a student receives or provide non-
repayable funds in addition to the loan amount).
In 2007–08, Canada’s federal and provincial
governments provided students with $4.4 billion in
need-based aid, including $2.9 billion in net loans,
$960 million in grants and $541 million in loan remis-
sion payments. After falling in the late 1990s, the
value of need-based aid has been steadily increasing
since 2001–02. The average over the last three years
is 13 percent higher than it was in the first few years
of this decade. Between 2004–05 and 2007–08, loan
remission increased by $211 million, or 64 percent,
while grant expenditures increased by $285 million,
or 42 percent. Net loans, meanwhile, declined by
$32 million, or one percent. Thus, the entire increase
in government spending on students has occurred
in the form of non-repayable assistance.
Non-repayable assistance grew after 2004–05 for
three reasons.
• First, in 2005–06, the federal government, the
Canada Millennium Scholarship Foundation and
the Government of Ontario introduced approxi-
mately $125 million in new grant programs for
students from low-income families, students with
permanent disabilities, rural students, Aboriginal
students and certain adult learners. As Berger
(2007) explains, a substantial proportion of these
grant funds were designed specifically to support
students previously unlikely to qualify for existing
grants or loan remission programs.
• Second, also in 2005–06, the federal and provin-
cial governments increased the maximum amount
of financial aid provided to students. Typically,
this meant that students had access to $11,900 in
loans, grants and remission, up from $9,350 in
previous years (student aid limits are not indexed
to inflation or increases in tuition; they are there-
fore adjusted periodically). Because of the nature
of the grant and remission programs in certain
provinces, the lion’s share of these new funds was
provided in the form of non-repayable assistance.
In Ontario, for example, the province left its Ontario
Student Opportunity Grant in place, meaning that it
would continue to remit any student loan in excess
of $7,000 per year on the condition that the student
successfully completed the academic year (the
OSOG “floor” increases to $10,500 for students who
study during three terms during one academic year).
This meant that the additional aid that flowed to
students as a result of the increase in aid maximums
was in most cases converted from a loan to a grant
through the OSOG program.
Chapter 6
II. Need-Based Student Aid in Canada2

The Price of Knowledge: Access And sTudenT finAnce in cAnAdA156
3. It should be noted that not all students are eligible for the debt cap. However, the eligibility requirements did not change during the period when the level of the debt cap was first raised and then restored to its previous level.
• In Quebec, the cut in grants that took effect in
2004–05 was reversed. In two stages beginning in
2005–06, the province restored its annual debt
cap to the level it had been before it was increased
in 2004–05. This meant that by 2007–08, Quebec
students once again received a grant to cover
any aid amount greater than $1,760 (CEGEP
students), $2,440 (undergraduate students) and
$3,240 (graduate students).3 Between 2006–07
and 2007–08, net loan expenditures in Quebec
dropped by $48 million, or nine percent, while
grant expenditures increased by $190 million, or
63 percent.
Because aggregate amounts of loans, grants and
remission can fluctuate based on demand—that is,
they can rise or fall depending on whether more or
fewer students apply for financial aid in any given
year—it is important to examine year-over-year
trends on a per-recipient basis. In 2007–08, Canadian
student aid recipients were provided with an average
of $10,494 each in need-based aid, 20 percent more
How Much Does a Student Loan Cost?
running its student loan program represents only
38 percent of the total costs incurred that year.
The actual cost of a loan is determined by calcu-
lating the expenditure not recovered in repayment,
typically including the interest subsidy and costs
associated with default. The net cost is generally
estimated to be between 30 and 40 percent of the
loan’s value, meaning governments can, for the
same cost, provide a grant of, say, $1 or a loan of
between $2.50 and $3. When thinking about govern-
ment expenditures on student support, including
loans, remission, grants and tax expenditures, it is
worth keeping in mind that loans are substantially
cheaper than their face value. While the value of all
need-based aid far exceeds the value of non-need-
based aid currently provided in Canada, the cost of
the former is probably not substantially greater.
While Canadian governments provided students
with $2.9 billion in net student loans in 2007–08,
this figure masks what was actually spent on these
loans. Because most student loans are repaid, their
net cost is considerably cheaper than their value.
For example, in 2006–07, the Canada Student
Loans Program issued $1.99 billion in student loans.
However, according to its public financial state-
ments, its expenses (which include interest subsidies,
administration, provision for bad debt and defaults
but exclude its grant programs and the alternative
payment to non-participating provinces) were
only $840 million. Additionally, its revenue, stem-
ming principally from loan repayment, totalled
$523 million. Thus, the net operating costs for
the loan program were only $316 million (Canada,
2009). The net cost to the federal government of

CHaPTer 6 — sTudenT finanCial assisTanCe in Canada: PasT, PresenT and fuTure 157
4. The State of Student Aid Survey is conducted annually by the Educational Policy Institute on behalf of the Canada Millennium Scholarship Foundation. It consists of questions about the value of loans, grants loan remission, tax credits and other forms of financial aid. It is administered to officials in all 14 Canadian governments.
than in 2004–05. In 2004–05, the average financial
aid recipient received a net loan of $6,511, a grant
of $1,501 and a loan remission payment of $732. By
2007–08, these amounts had increased to $6,913,
$2,290 and $1,291, respectively (net loans increased
by six percent, grants by 53 percent and loan remis-
sion by 76 percent). In all three cases, the increase
per recipient exceeded the increase in the aggregate
amount. This is because the number of provincial
student aid recipients has been declining steadily
since 2004–05.
Figures 6.II.1, 6.II.2 and 6.II.3 demonstrate the
expansion of grant and loan remission aid in recent
years.
1993–1994
1995–1996
1997–1998
1999–2000
2001–2002
2003–2004
2005–2006
2007–2008
Net LoansRemissionGrantsTax Credits
$0
$500,000,000
$1,000,000,000
$1,500,000,000
$2,000,000,000
$2,500,000,000
$3,000,000,000
$3,500,000,000
Figure 6.II.1 — Total Student Financial Aid in Canada by Type of Aid, 1993–94 to 2007–08
$4,000,000,000
$4,500,000,000
1993–1994
1995–1996
1997–1998
1999–2000
2001–2002
2003–2004
2005–2006
2007–2008
Net LoansRemissionGrants
$0
$1,000
$2,000
$3,000
$4,000
$5,000
$6,000
$7,000
Figure 6.II.2 — Total Need-Based Student Financial Aid per Recipient in Canada by Type of Aid, 1993–94 to 2007–08
$8,000
Source: State of Student Aid Survey, 2009.4
Source: State of Student Aid Survey, 2009.

The Price of Knowledge: Access And sTudenT finAnce in cAnAdA158
5. This excludes the exceptional 1999–2000 academic year, during which the Ontario government adjusted the way it accounted for loan remission payments.
6. The spike observed in 1999–2000 was caused by a change in the way the Government of Ontario accounted for its loan remission program. That year, it shifted from paying remission at the end of a student’s program of study to the end of each academic year. While the effect for students remained the same, the change meant that the province’s expenditure on remission for the year spiked abnormally.
Another way of measuring the trend in student aid
in recent years is to examine the share of financial
aid provided in the form of non-repayable assis-
tance. The proportion of all need-based aid received
as a grant or loan remission payment reached
34 percent in 2007–08, the highest ever, compared to
26 percent in 2004–05.5 Of course, the proportion is not
the same in every province. In Manitoba, the share of
non-repayable aid has grown by 20 percentage
points, from 31 percent in 2004–05 to 51 percent in
2007–08. In Quebec, the proportion follows closely
behind, at 50 percent. The share of non-repayable
aid is lowest in New Brunswick and Nova Scotia, at
15 and 18 percent, respectively. After reaching a low
of 17 percent in 2004–05 in B.C., the figure has been
increasing, reaching 22 percent in 2007–08.
1993–1994
1995–1996
1997–1998
1999–2000
2001–2002
2003–2004
2005–2006
2007–2008
Total Need- Based AidTotal Need- Based Aid per recipient
$0
$500,000,000
$1,000,000,000
$1,500,000,000
$2,000,000,000
$2,500,000,000
$3,000,000,000
$3,500,000,000
$4,000,000,000
$4,500,000,000
Figure 6.II.3 — Aggregate and Per-Recipient Need-Based Student Financial Aid in Canada by Type of Aid,1993–94 to 2007–08
$5,000,000,000 $12,000
$10,000
$8,000
$6,000
$4,000
$2,000
$0
Source: State of Student Aid Survey, 2009.
1993–1994
1995–1996
1997–1998
1999–2000
2001–2002
2003–2004
2005–2006
2007–2008
0%
5%
10%
15%
20%
25%
30%
35%
Figure 6.II.4 — Proportion of Need-Based Aid That Is Non-Repayable in Canada, 1993–94 to 2007–086
40%
Change in Ontarioaccounting practicesregarding loan remission
Source: State of Student Aid Survey, 2009.

CHaPTer 6 — sTudenT finanCial assisTanCe in Canada: PasT, PresenT and fuTure 159
7. For this exercise, Quebec’s 2007–08 figure is compared to its figure for 2003–04, since the 2004–05 figure is an outlier. That year, the provincial government cut its bursary program by $103 million. As mentioned above, this amount was restored beginning in 2005–06.
The proportion of aid that is non-repayable
increased significantly in several provinces besides
Manitoba: from 27 to 43 percent in Saskatchewan and
from 14 to 38 percent in Newfoundland and Labrador.
Ontario’s share increased at the same rate as the
national average, eight percentage points, from 22 to
30 percent. B.C., Nova Scotia and P.E.I. grew at rates
below the national average. In Quebec, New Brunswick
and Alberta, the share of non-repayable aid was lower
in 2007–08 than in 2004–05, although the amounts for
Quebec and Alberta were at all-time highs in 2004–05,
well above the national average.7
Myth: Most Low-Income Students Rely on Student Financial Aid
although the introduction of income-based grants
in 2005–06 has moderated this somewhat.
Second, only a minority of students from low-
income families actually participate in student
aid programs. Data from Statistics Canada’s Youth
in Transition Survey (YITS) and Post-Secondary
Education Participation Survey (PEPS) reveal that
fewer than half of all students from families
earning less than $50,000 per year receive student
financial aid. As Figure 6.II.5 makes clear, while
student aid is rare among high-income house-
holds, a majority of low-income students do not
While we might assume that students from low-
income households benefit from student financial
aid programs, this is not the case for the following
two reasons.
First, as outlined in Berger (2007), the nature of
the student aid need assessment process means
that many low-income students are only eligible
to receive relatively small amounts of financial aid.
Low-income students who work a significant
number of hours per week, live at home or attend
relatively low-cost programs are effectively prevented
from receiving the largest amounts of financial aid,
No employeeearnings
Less than$25,000
$25,000 to$50,000
$50,000 to$75,000
$75,000 to$100,000
$100,000and up
YITS-APEPS
0%
10%
20%
30%
40%
50%
60%
Figure 6.II.5 — Student Loan Take-Up among College and University Students by Parental Income
51%
40%44%
33%
25%
26%
13%
10%6%
35%
Note: The YITS-A data refer to student aid take-up at age 19. The income of students’ parents was reported when the students were 15. The PEPS data were collected among students and families in 2002.
Source: Educational Policy Institute, MESA Annual Report 2008 (forthcoming).
The Price of Knowledge: Access And sTudenT finAnce in cAnAdA160
Myth: Most Low-Income Students Rely on Student Financial Aid (continued)
These data should be kept in mind by policy-
makers seeking to improve access for students from
low-income families. To the extent that the main
policy “tool” being relied on is loan and grant pro-
grams, efforts are destined to miss at least half of the
group being targeted—at least until the relationship
between these programs and potential clients is
changed.
borrow from government student aid programs.
Meanwhile, as shown in Figure 6.II.6, a majority of
university students from families earning below
$25,000 per year receive student aid, but less than
one-third of college students with similar parental
income reported accessing student aid. This may
be in part due to the fact that need is largely deter-
mined by educational cost, which tends to be
lower for college students.
No employeeearnings
Less than$25,000
$25,000 to$50,000
$50,000 to$75,000
$75,000 to$100,000
$100,000and up
YITS-A CollegeYITS-A UniversityPEPS CollegePEPS University
0%
10%
20%
30%
40%
50%
60%
Figure 6.II.6 — Student Loan Take-Up among College and University Students by Parental Income
Note: The YITS-A data refer to student aid take-up at age 19. The income of students’ parents was reported when the students were 15. The PEPS data were collected among students and families in 2002.
Source: Educational Policy Institute, MESA Annual Report 2008 (forthcoming).

CHaPTer 6 — sTudenT finanCial assisTanCe in Canada: PasT, PresenT and fuTure 161
8. Average amounts for these two periods have been used for two reasons. First, multi-year averages are less likely than single-year data points to present one-time, skewed figures. Second, the years in question allow for a broader examination of the trend in student aid leading up to and following the significant policy changes introduced in 2005–06.
Provincial TrendsNationally, on a per-recipient basis the average
amount of need-based aid for the years 2005–06
to 2007–08 was 14 percent higher than for the
period 2001–02 to 2004–05.8 Outside of Ontario and
Saskatchewan, every province has seen a double-
digit increase in need-based aid provided to students
in recent years.
As discussed earlier, the growth in student aid
during this period was primarily driven by non-
repayable grants and loan remission. This was
the case in all provinces except Alberta, B.C. and
New Brunswick. In Alberta, non-repayable aid did
increase by a significant amount (12 percent), but
this change was not solely responsible for the
increase in total aid, since net loans also increased
by 13 percent. In B.C., non-repayable aid per
recipient actually declined by five percent, while in
New Brunswick it grew by one percent (net loans
increased by 12 percent).
In a few provinces, non-repayable aid per recipi-
ent increased dramatically. In Newfoundland and
Labrador, non-repayable aid per recipient increased
by 154 percent between the two periods, while in
Manitoba it increased by 91 percent and in Nova
Scotia by 87 percent. In Manitoba, Saskatchewan,
Newfoundland and Labrador and Ontario, the average
amount of net loans per recipient declined.
The highest net loans in Canada are in the Mari-
times, where the average student aid recipient borrows
$8,603 and receives non-repayable aid in the amount
of $1,815. Given that costs in the Maritimes are
higher than in most of the country (total need-based
aid is only higher in Alberta) and that only 17 percent
of financial aid is non-repayable, it is likely that
Maritime students will remain the most indebted in
Canada (see Chapter 7 for a discussion of student
Institutional Financial Aid in Canada
• Merit scholarships are more common on cam-
pus, with 23 percent of G-13 and 20 percent of
non-G-13 universities providing their students
with this kind of aid, worth an average of $1,750
and $1,375, respectively.
• Only eight percent of college students received
need-based aid, worth an average of $800. Six
percent received merit aid, worth an average
of $911.
• Ontario universities are required to spend a
portion of funds collected through increased
tuition fees on need-based aid. Ontario G-13
universities provided more need-based aid to
their students than their non-Ontario counter-
parts, although their tuition fees were higher.
While financial aid generally falls under the purview
of Canada’s federal, provincial and territorial
governments, post-secondary institutions also pro-
vide considerable assistance to their students.
As described by Berger and Parkin (2008), the
most recent survey of institutional aid, conducted
among 31 universities and 11 colleges representing
73 percent of Canadian undergraduates, revealed
that institutions spent at least $114 million on
need-based financial aid and $144 million on
merit scholarships for undergraduate students in
2006–07.
• At “G-13” universities (Canada’s major research
institutions), 19 percent of students received an
average of $2,000 in need-based aid from their
institution. Outside the G-13, only 11 percent of
students received an average of $1,200 in need-
based aid.

The Price of Knowledge: Access And sTudenT finAnce in cAnAdA162
debt). Net loans are lowest in Quebec ($3,542) and
Manitoba ($4,759)—the two provinces where non-
repayable aid per recipient is highest both in dollar
figures ($3,581 and $4,981, respectively) and as a
proportion of total aid (50 percent and 51 percent,
respectively)—as well as Saskatchewan, where non-
repayable aid per recipient was $4,382 in 2007–08.
Net loans are lower than the national average in
Ontario ($6,314) and Saskatchewan ($5,737).
Table 6.II.1 — Change in Student Aid per Recipient Between the Periods 2001–02 to 2004–05 and 2005–06 to 2007–08 by Type of Aid and Province
Net Loans Remission GrantsTotal
Non-Repayable AidTotal
Need-Based Aid% of Aid That Is Non-Repayable
BC 16% 389% -63% -5% 11% -13%
AB 13% -6% 21% 12% 12% 0%
SK -7% 24% 32% 26% 2% 23%
MB -13% 69% 173% 91% 18% 62%
ON -3% 32% 23% 27% 4% 22%
QC 18% -39% 25% 24% 21% 3%
NB 12% -11% 7% 1% 10% -8%
NS 2% 42% 239% 87% 11% 68%
PE 8% 9% 86% 35% 12% 20%
NL -7% 51% 398% 163% 14% 130%
CA 9% 58% 19% 29% 14% 13%
Source: State of Student Aid Survey, 2009.
Table 6.II.2 — Average Student Aid per Recipient in 2007–08 by Type of Aid and Province
Net Loans Remission GrantsTotal
Non-Repayable AidTotal
Need-Based Aid% of Aid That Is Non-Repayable
BC $7,437.32 $1,444.26 $677.76 $2,122.01 $9,559.33 22%
AB $7,976.18 $822.71 $2,594.94 $3,417.65 $11,393.83 30%
SK $5,737.68 $3,484.69 $897.66 $4,382.35 $10,120.04 43%
MB $4,759.47 $3,312.10 $1,668.30 $4,980.41 $9,739.88 51%
ON $6,314.35 $1,429.74 $1,300.39 $2,730.13 $9,044.48 30%
QC $3,542.79 $11.63 $3,569.79 $3,581.42 $7,124.21 50%
NB $8,996.66 $440.72 $1,089.68 $1,530.40 $10,527.06 15%
NS $8,098.96 $1,064.78 $693.23 $1,758.00 $9,856.96 18%
PE $8,714.64 $918.43 $1,238.96 $2,157.39 $10,872.03 20%
NL $6,042.46 $1,126.33 $2,549.74 $3,676.07 $9,718.53 38%
CA $6,930.50 $1,273.96 $2,289.68 $3,563.65 $10,494.15 34%
Source: State of Student Aid Survey, 2009.

CHaPTer 6 — sTudenT finanCial assisTanCe in Canada: PasT, PresenT and fuTure 163
How Many Student Aid Recipients Are There?
college and university data are available, 26 percent
of students were receiving a provincial student
loan, while 21 percent were receiving a Canada
Student Loan.
It is reasonable to conclude that a booming
economy, particularly in Western Canada, during
the early part of the current decade meant two
things: that a larger share of students could pay
for their studies without borrowing and that many
prospective students were lured away from higher
education by a flourishing labour market. In the
context of a global recession, however, news stories
about rising numbers of financial aid applications
are unsurprising. A cool labour market likely means
fewer students can fund their education via
employment income and more young Canadians
will turn away from work and toward school.
According to the 2009 State of Student Aid Survey,
the number of Canada Student Loan recipients has
been growing in recent years, although the number
of provincial student aid recipients has been
declining; this trend holds even when excluding
Quebec, which does not participate in the CSLP.
Between 2004–05 and 2007–08, the number of CSL
recipients increased by 15,000, or five percent. The
number of provincial student aid recipients
dropped by 30,000, or seven percent. The number
of recipients of provincial aid has been increasing
in Ontario, Quebec and New Brunswick, and declin-
ing elsewhere, particularly in B.C. (35 percent).
Using recent university and college enrolment
data, we can estimate the proportion of post-
secondary students receiving student financial aid.
In 2005–06, the most recent year for which both

The Price of Knowledge: Access And sTudenT finAnce in cAnAdA164

165
9. The CLB is available to families receiving the National Child Benefit Supplement whose child was born after January 1, 2004. They must open an RESP, although they do not have to make a contribution to it.
Since the late 1990s, Canadian governments have pro-
vided students with billions of dollars in educational
tax credits. As Neill (2007) describes, students receive
tax credits in relation to the amount of tuition they pay
and the number of months in which they are registered
at a post-secondary institution. The federal govern-
ment also provides assistance to prospective students
through the Canada Education Savings Program,
through which it offers the Canada Education Savings
Grant (CESG) and Canada Learning Bond (CLB). The
CESG is a matching contribution paid into a Regis-
tered Education Savings Plan (RESP); the federal
government typically matches contributions at a rate
of 20 percent, up to $400 per year. Low- and middle-
income families can receive the one-time CLB of
$500, as well as an additional annual contribution of
$150 to $200 through the CESG.
Spending on education-related tax credits has
remained fairly constant since the beginning of this
decade. Between 2004–05 and 2007–08, when non-
repayable aid grew by 49 percent, tax credits only grew
by four percent, or $74 million. In 2007–08, govern-
ments spent $2.1 billion on tax credits, $615 million
more than they did on loan remission and grants. Tax
expenditures surely surpassed net expenditures on
loans as well, which were likely in the neighbourhood
of $1 billion—see the box in Section 6.II.
Although tax credits comprise the largest single
source of spending on student support in Canada, it
is unlikely that they have a significant impact on access
to or success in post-secondary education. Because
they are untargeted, tax credits disproportionately
benefit the individuals least likely to need them,
since all students receive them and students from
low-income families are under-represented in post-
secondary education. Because they cannot be claimed
until the spring following the calendar year when
they were earned, rather than when tuition bills are
due, they are unlikely to provide recipients with the
funds they need in a timely fashion. Because they are
not refundable, they cannot benefit those without
taxable income. And because their value is deter-
mined by the student’s term of study and tuition
costs, they are akin to an entitlement program,
meaning they grow substantially if enrolment booms
and can easily crowd out other, more effective forms
of student support.
Education savings grants are meant to encourage
families to save for their children’s post-secondary
education. Like tax credits, CESGs disproportionately
support higher-income families that have the
means to set money aside for future education. The
introduction of the CLB was meant to better target
education savings incentive funds to low-income
families, since it does not require low-income fami-
lies to invest any of their own money.9 However,
while the take-up rate in the program has been
growing, it remains extremely low. The CLB was
introduced in 2005, but as of December 2008, only
16 percent of eligible families had taken up the
program. By comparison, 39 percent of eligible
families were participating in the CESG program in
December 2008 (Canada, 2008).
Chapter 6
III. Non-Need-Based Student Aid in Canada

The Price of Knowledge: Access And sTudenT finAnce in cAnAdA166

167
As the preceding discussion of government student
financial aid has shown, students have benefited from
more generous financial aid during the past decade.
Prior to 2000, need-based aid levels were falling, with
the share of financial aid that was non-repayable
between 15 and 20 percent. Following the introduction
of the Canada Millennium Scholarship Foundation
and the sub-sequent investment in loan remission
and grant aid in 1999–2000, the amount of non-repay-
able aid increased, to approximately 30 percent. The
expansion of need-based aid following the policy
changes of 2005–06 occurred primarily in the form
of additional non-repayable assistance, and the pro-
portion of need-based aid provided as a grant or
loan remission payment reached an all-time high of
34 percent in 2007–08. The student aid system itself,
however, has not changed dramatically, despite fluc-
tuations in spending on different types of aid. The
question of whether there are ways of improving
the Canadian student aid system remains. In this
section, we turn our attention to this issue.
Over the past few years, numerous conversations
have taken place about the future of financial aid in
Canada. Often these have been stimulated by issues
such as rising student debt levels or low participa-
tion rates among students from low-income families.
On other occasions, they have coincided with the
introduction of a new program or policy, such as the
creation of access grants in 2005 or the announce-
ment in 2008 of the winding down of the Canada
Millennium Scholarship Foundation and its replace-
ment by the new federal Canada Student Grants
Program. Sometimes, perhaps less productively,
they have been provoked by editorials or lobbying
campaigns. Even less frequently, unfortunately,
these conversations have been stimulated by new
insights into how financial aid works.
The various chapters in this volume summarize
the state of knowledge in Canada about the factors
that affect access to and success in post-secondary
education and about trends in government spending
on financial support for students and their families.
In our view, this research offers the best starting
point for a conversation about the future direction
that student financial assistance programs should
take. Reflecting on the evidence gathered and knowl-
edge gained in recent years allows us to think more
productively about what might be possible in the
future.
The purpose of this section is not to summarize
again the numerous research conclusions related to
access and student finance. It suffices here to recog-
nize that over the past decade we have learned a
great deal about the nature of the obstacles that dif-
ferent students face in making the transition into
post-secondary education, about the information
(or misinformation) that high school students
receive on the benefits and costs of higher educa-
tion, about who is and is not likely to access student
financial aid, about which types of students tend to
receive which types of aid and about the way in
which student aid policies can negatively impact
persistence and completion (by resulting in the
accumulation of excessive debt from year to year, by
providing aid that is not sufficient to cover costs,
etc.). We are even starting to learn more about the
impact of different student aid policies and financial
Chapter 6
IV. The Future: Modernizing Student Financial Assistance in Canada

The Price of Knowledge: Access And sTudenT finAnce in cAnAdA168
incentives through various experimental projects (see,
for instance, Malatest, 2009a, b and c and SRDC, 2009).
We continue to add to this stock of knowledge
through new studies that have only just been com-
pleted. For instance, we are learning that the
complexity of the student aid system in Canada is not
limited to the difficulties students have in discovering
what programs are available and anticipating how
much they will receive; it is also evident that advanced
literacy and numeracy skills are required to success-
fully complete the task of applying for a loan or grant
(Baldwin, forthcoming). We have also learned that
the way in which the student aid system interacts
with other government programs, such as social
assistance, is important (Torjman, 2009). Beyond the
question of the actual level of support provided, other
programs can put tremendous strain on student aid
clients by asking them to complete additional forms,
produce additional material and regularly justify con-
tinued support. There is a case for better coordinating
programs and reducing the overall administrative
burden.
These and other conclusions from research should
inform our thinking about future developments in
student aid. Research findings provide a basis upon
which to evaluate and prioritize policy options.
Those options that can be validated by evidence
should be favoured; those that do not find support in
research should be viewed with more skepticism.
This is hardly a controversial approach, yet experience
shows it is still all too often discarded at the moment
policy decisions are made.
Based on just the kind of research findings men-
tioned above, we previously proposed four principles
to guide the developing conversation about the
“modernization” of student aid in Canada (Baldwin
and Parkin, 2007):
• Provide early and easy access to the student aid
system, especially for under-represented students
who need to know there will be predictable fund-
ing available to support their studies;
• Target assistance to those with the greatest need
first;
➢• Be sure to acknowledge and address non-financial
barriers to access and success; and
• Ensure flexibility, transparency and accountability
in the delivery of aid.
These principles still seem relevant. They have been
echoed in work conducted in other jurisdictions,
most notably in the work of the U.S. College Board’s
Rethinking Student Aid study group, whose report
Fulfilling the Commitment: Recommendations for
Reforming Federal Student Aid grounds its recom-
mendations in a very similar set of principles (College
Board, 2008). The College Board, however, included
an additional principle at the heart of its work that
was notably, and regrettably, omitted from Baldwin
and Parkin’s list—namely, the interests of students
Canada Millennium Scholarship Foundation (Baldwin and Parkin, 2007)
Reforming Student Aid study group (College Board, 2008)
Four principles for modernization:
1. Provide early access to SFA information and SFA system to increase understanding and predictability
2. Target aid to the right people and provide the right mix of loans, grants and other aid
3. Take a comprehensive approach that acknowledges and addresses all barriers: financial and non-financial
4. Ensure flexibility, transparency and accountability
Federal student aid should be:
• Targeted to those in need
• Adequately funded
• Clear, transparent and well communicated
• Predictable
• Student-focused
• Supportive of both access and success
• Efficient in using taxpayer funds
Principles for Reforming Student Aid

CHaPTer 6 — sTudenT finanCial assisTanCe in Canada: PasT, PresenT and fuTure 169
10. For example, a news story on the impact of universities’ receding investment income stated: “At many… universities, especially smaller ones, endowments aren’t used to cover operating costs, but fund primarily scholarships and student financial aid—a purpose for which they are crucial… Some universities, such as Bishop’s, Queen’s and the University of Regina, said they won’t be cutting scholarships or financial aid this year, but student aid could suffer in the long run if the market doesn’t rebound” (CBC.ca, 2009).
11. We hope that eligibility for Canada Student Grants will not be tied to assessed need for very long. As discussed in the next section, providing grants to students from low-income families serves useful purposes regardless of their eligibility for a loan.
must be at the centre of reform. This principle is a
welcome addition to the Canadian conversation
about modernizing student aid.
We will use these principles to shape the sugges-
tions we offer below about how to change the way in
which student aid is delivered in Canada. These sug-
gestions are neither especially radical nor especially
expensive. This is not because we lack imagination;
it is rather because we recognize that bold, expensive
proposals are not likely to be welcomed at a time
when the effects of the 2008–09 recession are still
being played out. These effects will certainly shape
policy-making for some time to come. Already, it
appears that some institutions are reducing their own
student aid offerings in the wake of the reductions
to the size of their endowment that resulted from
the tumbling stock market.10 In addition, as Usher and
Dunn (2009) have argued, if past experience is any-
thing to go by, we can anticipate a period of constraints
on public spending even once the economic recovery
takes hold. After the recession of the early 1990s, for
example, when “zero deficits” came into vogue, stu-
dent grant programs were scaled back or eliminated
and tougher eligibility restrictions were imposed
to limit access to loans. The coming post-recovery
period in Canada could turn out to be an equally
precarious one for student aid funding.
That being said, it is important not to ignore the
improvements that have been made in recent
years. Since the introduction of the Millennium and
Canada Access Grants in 2005, both Ontario and
Nova Scotia have invested in similar programs,
significantly increasing available grant aid for stu-
dents from low- and moderate-income families in
those provinces. These programs, along with other
provincial loan and grant programs, will need
to accommodate the new federal Canada Student
Grants Program, but setting aside the need for inter-
jurisdictional coordination, the CSGP is another
positive development. First, the $350 million in non-
repayable aid to be delivered annually through the
CSGP (scheduled to rise to $430 million by 2012–13)
will be directed to students from low- and moderate-
income families and other under-represented
populations for whom low-income is a proxy. This
targeting of aid is important (although it raises ques-
tions about whether some high-need students will
end up with higher debt levels, as we will discuss in
the next chapter). Second, the CSGP will guarantee
four years of funding to eligible students as long as
they continue to have at least one dollar of assessed
need.11 This nod toward predictability is welcome, as
it will provide some additional peace of mind to stu-
dents with few financial resources of their own. This
predictability should be considered the “new norm”
in student aid programs—at the very least in those
directed to low-income and under-represented
students—and should feed into future initiatives to
streamline the process. As we will discuss below,
there are other ways to provide transparent and
predictable financial support for students from
low-income families that should be explored.
Also announced in the 2008 Federal Budget was
the Repayment Assistance Program (RAP), which
replaces the old Interest Relief (IR) and Debt Relief in
Repayment (DRR) programs at the federal level and
has been adopted by Nova Scotia (which pioneered
the idea), New Brunswick and Saskatchewan. As will
be discussed in Chapter 7, the RAP offers clients
repaying their student loans relief during periods of
low income due to unemployment or under-employ-
ment when making their loan payments is impossible
or a major hardship (student debt can also be com-
pletely wiped out after 15 years of persistent eligibility
for the RAP). Eligibility for the RAP is determined
based on income and family size, and payments are
made on a sliding scale such that no borrowers who
enter the program would have to make a payment of
more than 20 percent of their income. The program
has some flaws, however. Clients in financial distress
must opt in to the RAP, and anyone who has already
defaulted, presumably because of the very burdens
that the RAP seeks to ease, is excluded from the pro-
gram. Nevertheless, it represents an improvement in
the way we treat students who have borrowed to pay
for their studies and subsequently found that, for
whatever reason, their post-graduation earnings are
lower than expected.

The Price of Knowledge: Access And sTudenT finAnce in cAnAdA170
These recent developments, the research findings
and the principles stated above all lay the foundation
for our thinking about future directions for the way
student aid is organized, delivered and funded.
There are many positive attributes of the current sys-
tem, and for many students it has worked reasonably
well and efficiently for nearly half a century. How-
ever, as has been argued throughout this volume (as
well as in its previous edition), participation in higher
education needs to be expanded by bringing in
more students from traditionally under-represented
groups. In thinking about student aid, we thus need
to anticipate the needs of tomorrow’s clients as well
as today’s. We need to develop policies and programs
that facilitate the pathways into post-secondary
education for those that the current system has not
generally served best. With these objectives in mind,
we turn now to a series of suggestions.
The Limits of What We Know
province. We are only just beginning to develop
a solid understanding of how each of these
measures (or combinations of them) impacts
access and persistence.
• Is Canadian student aid too complicated? From
the legalistic wording of student aid application
forms to the federal-provincial split in the funding
of loans and grants to the various terms of loan
repayment in effect, student aid in Canada is
certainly complex. We do not know, however,
whether its complexity is merely inconvenient or
poses a significant barrier to access and success
in post-secondary education.
• What contribution do post-secondary insti-
tutions make to student aid? Institutions provide
both need-based bursaries and merit scholar-
ships, but, despite some recent research efforts
(Berger and Parkin, 2008), there are few data
available on either the relative amounts or the
profile of the recipients. The lack of data makes
it difficult to explore the question of whether
or not this funding complements government
student aid funding (as is expected, at least, in
Ontario through its “access guarantee” policy),
thereby contributing to the coherence of the
overall system.
Many of the findings in this chapter echo those
of reports discussing earlier waves of the annual
State of Student Aid Survey. While we have become
accustomed to annual reporting on aggregate
student aid amounts in recent years, we continue
to lack individual-level data that could reveal
much more about the impact of the $4.4 billion
provided to students in the form of need-based aid
in Canada. In the absence of a research project
that examines data at a deeper level, many of the
questions Canadian policy observers have about
student aid stubbornly persist:
• Who gets what? While we have a fairly accurate
idea of what governments spend in total, we lack
reliable data on the characteristics of the re-
cipients of each different type of aid. We cannot
compare, for instance, the amounts that lower-
income students typically receive from loan and
grant programs with the amounts that higher-
income students typically receive from merit
scholarships, tax credits and savings grants.
• What is the right mix of financial aid? Govern-
ments chiefly offer loans, grants and tax credits
to students. The share of aid that is repayable
or non-repayable, or that is based on financial
need or provided to all students regardless of
their financial situation, varies from province to

CHaPTer 6 — sTudenT finanCial assisTanCe in Canada: PasT, PresenT and fuTure 171
12. See www.insidehighered.com/news/2009/01/14/duncan.
13. That said, the actual amount of a student’s access grant has, in the past, been determined in part on the basis of his or her assessed need.
Reform the FormFor years, policy-makers in the U.S. have debated
the complexity of the Free Application for Federal
Student Aid (FAFSA) process. The current U.S.
Secretary of Education, Arne Duncan, even declared
that an applicant needs a Ph.D. simply to complete
the form.12 This concern has led both to research and
to innovative policy proposals about how to simplify
the FAFSA.
One of the most well-known of these is a paper
by Harvard economists Susan Dynarski and Judith
Scott-Clayton entitled “College Grants on a Postcard:
A Proposal for Simple and Predictable Federal
Student Aid” (2007). The authors evaluate the impact
on the distribution of aid that would result from
dropping some of the required data elements of the
FAFSA. Their analysis suggests that even if as many
as 82 percent of the required questions were elimi-
nated, 77 percent of Pell Grant recipients (the
signature student aid program in the U.S.) would
remain eligible for a grant whose value was within
$100 of their actual grant and 88 percent would be
eligible for a grant whose value was within $500 of
their actual grant. Based on this, they conclude that
the U.S. government has all the information it needs
to determine eligibility for Pell Grants, as well as Hope
and Lifetime Learning tax credits, through the data it
collects on tax forms. The information required to
determine eligibility “could fit on a postcard,” which in
turn could be used as part of a campaign to provide
early information about student aid eligibility.
Until recently, there has been no parallel debate in
Canada, perhaps in part because there are 13 different
application forms for government student aid rather
than one. In 2009, however, a project similar to Dynarski
and Scott-Clayton’s was conducted in this country.
Unfortunately, the results were much less promising in
terms of streamlining student aid applications.
Prairie Research Associates, Inc. (PRA) concluded
an analysis of need-assessment data from four
provinces by saying that “there appears to be little
scope for needs assessment simplification while
maintaining the accuracy of the assessment process.”
(Baldwin, forthcoming)
The reason it is difficult to eliminate variables
from the need assessment process, and the attendant
questions on student loan application forms, is
largely that need assessment is currently serving two
distinct functions. First, it is used to allocate loans
(as well as loan-reducing grants for students with
large loans) by determining a student’s total financial
need. Since government loan programs strive to allo-
cate precisely the amount of aid a student needs for
a year of study, reducing the precision of the calcu-
lation of need by simplifying the application form is
not necessarily desirable. Second, the calculation is
also used to determine eligibility for access grants
(prior to 2009–10) and the new Canada Student
Grants Program (from 2009–10 onward). This is done
by establishing that the students’ family income falls
under the eligibility threshold and that they have at
least one dollar of need. The latter calculation is
much simpler than the calculation of total need and
requires less information from the applicant.13 As
long as the same application form is used for both
functions, however, the options are limited in terms
of substantial simplification for income-based grants.
The limitations on eliminating questions on stu-
dent loan application forms as they currently stand,
however, do not limit our ability to make them
better. Also in 2009, Clear Language and Design
(CLAD) conducted literacy skill assessments of paper
and online student loan application forms used in
Alberta, Saskatchewan, Manitoba and Nova Scotia. It
found that the literacy skills demanded of the pro-
grams’ clients are not appropriate given that most
student applicants have yet to begin post-secondary
studies. In the four provinces, the average grade
reading level of the paper forms was 15.4 (assessments
of the online forms are forthcoming). In fact, it was
rare to find even a single section of the forms that was
written at an appropriate reading level, which was
pegged at Grade 11 for this purpose. The forms not
only demand a daunting amount of information from
multiple sources, including students, parents and
spouses, but are also written in such a way as to make
it very difficult to understand what is being asked. In
particular, in all three provinces the declaration of

The Price of Knowledge: Access And sTudenT finAnce in cAnAdA172
informed consent that both students and their parents
or spouse (if necessary) are asked to sign requires
such a high level of reading comprehension that it is
unrealistic to consider that the “consent” given by most
applicants is truly “informed.”
All governments that are in the business of
administering student loan programs would benefit
from submitting their forms to a “plain language”
assessment and working to improve their compre-
hensibility. This would reduce errors, which might
save governments money in the long run. It could also
result in more applications being successfully
completed, which would redirect that saved money
to its primary purpose. It would also likely improve
students’ experience of applying for and receiving aid,
which should be the object of any reform.
Start EarlyOne of the greatest challenges in efforts to improve
access for those who might not otherwise plan to par-
ticipate in post-secondary education is the need to
reach them early enough to shift both their aspirations
and their preparations. As Saul Schwartz (2008) has
explained, in terms of financial aid programs, there are
two main reasons for thinking that reaching students
earlier would help: “First, the knowledge that college
was affordable might give some students the incentive
to work harder in elementary and secondary school
than they would if they thought college was financially
out of reach. Second, and regardless of the possible
effect of early commitment on academic achievement,
students and their families would be better able to
plan the financing of college” (p. 177). The question is
whether there is a feasible way to provide information
about financial aid to low-income families, informa-
tion that could help their planning and dispel myths
about the costs and benefits of post-secondary edu-
cation. The answer is yes.
The Canada Child Tax Benefit (CCTB) and
National Child Benefit Supplement (NCBS) are fairly
simple programs: Canadians who have children and
are below an income eligibility threshold receive a
cheque from the federal government every month
until their children reach 18 years of age. In fact,
the income eligibility thresholds for many of the
Millennium Access Grants and Canada Access
Grants available prior to 2009–10, as well as the new
Canada Student Grants Program, are based on
income eligibility thresholds for the NCBS. The
CCTB and NCBS are remarkably efficient in their
ability to reach their intended recipients.14
As discussed above, take-up rates for the Canada
Learning Bond remain low (at the end of 2008, only
16 percent of eligible families had taken the steps
necessary to receive the benefit). It would be better
if it were transformed from an opt-in program to an
automatic entitlement for low-income families,
along the lines of the NCBS, beginning from the year
in which they report a dependent child on their tax
return. An auto-enrol CLB could then be treated as
a virtual individual development account in which
the government contribution accumulates and is held
for children until they pursue a post-secondary edu-
cation. If they never do so, the government would
not be required to pay benefits from the account (or
the account could have certain other approved uses,
such as on-the-job training, even if these are not
considered forms of post-secondary education).
A program along these lines was recently created
in B.C.: for each child born in the province after
January 1, 2007, the government is investing a fund
of $1,000, which is expected to grow to roughly
$2,200 by the time the child is 17 and can be used
to pay for post-secondary education. It should be
noted, however, that this program is universal, rather
than targeted to low-income families.
The periodic deposits into the account could be
accompanied by clear and useful information about
the costs and benefits of post-secondary education,
financial assistance programs and other support
programs that might be available locally for their
children. These communications could change over
time as the child ages, from initial messages about
the idea of post-secondary education as an attainable
goal to specific information directing parents and
children to local initiatives that could support their
efforts to navigate through the system. Starting this
process early, essentially from birth, might relieve
some of the anxiety that parents feel if they believe
14. They cannot, however, reach those people who do not file income tax forms.

CHaPTer 6 — sTudenT finanCial assisTanCe in Canada: PasT, PresenT and fuTure 173
they cannot afford the post-secondary education
that they want for their children (or that their children
want for themselves).
The opportunity to communicate directly with
parents who, because of their financial situation, may
see post-secondary education as something that is
not attainable for their children is one that should
not be missed. Parents play a key role in shaping the
educational pathways of their children. As previous
research has shown, however, while children turn to
their parents for information about their futures,
parents are not always able to provide them with
accurate information about how college or uni-
versity studies can be financed (Canada Millennium
Scholarship Foundation, 2006). Moreover, one of the
greatest challenges in delivering programs to more
marginalized populations is to find a way to make
a connection with them. Piggy-backing on top of
the tax system, which has already identified who is
eligible for the program and already delivers benefits
to them, would be not only simple and efficient but
also potentially quite effective.
Such a program would not be a substitute for con-
ventional student aid. It also would not prevent
anyone from participating in other savings-based
programs as well (e.g., RESPs). It would, however,
provide initial “seed funding,” allowing low-income
parents to put aside some money toward their
children’s post-secondary education. Given that
the eligibility threshold we propose for this early
investment program is the same as that used for
the Canada Student Grants Program, it would be
relatively easy to build a bridge between the two,
encouraging students from low-income families
to take advantage of the available student aid and
adding to the coherence of the system.
Finally, such a program would also need to fit well
into the mix of other government programs aimed at
low-income Canadians, such as social assistance. A
new national survey of the interface between student
aid and social assistance (Torjman, 2009) and a
report on the same topic in Ontario (Stapleton,
2007) both argue convincingly that for low-income
Canadians who are forced into the social assistance
system, getting out, especially to pursue education,
is very challenging. This is in part because of the way
the assets that those living in poverty might wish
to improve their skills through further education are
often taxed back at incredibly high rates as long as
they remain in the social assistance system. As always,
changes to programs and their rules have to be well
thought out and coordinated to limit unintended
consequences.
Decouple Loans and GrantsIn Canada, a post-secondary student who wishes to
obtain a government need-based grant can only do
so by first applying and qualifying for a student loan.
This makes sense if the policy objective of grants is to
limit the accumulation of debt; the most important
form of student aid is a loan, which must be accessed
first, but those who qualify for the largest loans also
then receive a grant. It makes less sense if, as was
the case with the access bursaries available until
2008–09 and will be case with the Canada Student
Grants available from 2009–10 onward, the goal is
to help low-income students overcome financial
barriers to participation regardless of whether they
have a large loan or not. Since, for these students, the
most important form of student aid might be a grant,
it is not clear why a loan must be accessed first (as
opposed to subsequently, if desired).
It is possible in theory to separate the processes
of applying for loans and grants, as is the case, for
example, in the U.S. with Pell Grants and Stafford
Loans. This could be done either by having two sepa-
rate application forms or by dividing the application
form into a short “part one” used to determine grant
eligibility and a longer, optional “part two” for those
who also wish to be considered for a loan.
The decoupling of student loans and grants would
accomplish two things. First, it would serve to simplify
the process of applying for and receiving grants. As
mentioned above, the number of questions needed
to determine eligibility for the new federal grants
that are replacing the millennium bursaries—grants
that are targeted to low- or moderate-income
students—is relatively limited. The main items of
information that need to be collected (apart from

The Price of Knowledge: Access And sTudenT finAnce in cAnAdA174
name and address) are family income, family size15
and institution attended. To borrow from Dynarsky
and Scott-Clayton (2007), an application form designed
to collect this information could fit on a postcard.
In fact, it would be possible to go even further.
Given the use of National Child Benefit Supplement
cut-offs for determining eligibility for Canada
Student Grants, the government could in principle
identify potential recipients before they even apply
for financial aid. This ability to identify eligible
youth in advance through the income tax system has
a number of potential advantages: it would allow
promotional material about both post-secondary
education and financial assistance to be distributed
in a targeted way well in advance of the point of
application; it would make aid much more predict-
able (the grant program could become in part an
early promise of aid, made to students identified
through the tax system even before they complete high
school); and, by connecting it to parents’ tax returns, it
could lead to the generation of an application form
that is already complete except for the applicant’s
signature and choice of post-secondary institution.
Linking student aid forms with tax data in order to
pre-populate certain fields of data is an approach
that has been advocated in the U.S. by The Institute
for College Access and Success (Asher, 2007) and is
being explored by the U.S. Department of Education
(2009). All of this would significantly alleviate the bur-
den of applying for grants, as well as reducing concerns
about error rates in the information submitted.
Secondly, beyond the issue of simplification,
decoupling could also serve to send an important
signal to low-income students about the types of aid
that are available for them. Clearly, grants are more
attractive to students than loans.16 In the absence of
a decoupled system, however, the first question stu-
dents must ask themselves before applying for
student financial assistance is whether or not they
desire a loan, not a grant. In fact, it would be fair to
say that in the current system, grants are buried under
or hidden within a student loan program. It is thus
very difficult to signal to low-income students that
grants are available for them when such information
is drowned out by the competing signal that student
financial aid in Canada means taking out a student
loan. (The Canada Millennium Scholarship Founda-
tion has observed in focus groups that some students
from low-income or under-represented backgrounds
are even skeptical that they will receive a grant if they
apply for student aid, while some doubt that the
grants would really be grants and suspect they would
ultimately have to be paid back). Relieving low-
income students of the requirement to borrow in
order to receive non-repayable funding for their
post-secondary education is a viable way out of this
signalling problem. Decoupling loans and grants
would make it clearer to the student what types of
aid are available and how much funding of each type
they could expect to receive.
The decoupling of loans and grants would change
little on the loan side. The current mechanism
remains a relatively efficient one for allocating sig-
nificant amounts of public funds to those facing high
post-secondary education costs and low personal
resources. Loan remission for high borrowers, which
remains an important feature of many provincial
programs (and, as we will argue below, should not be
ignored), would also continue to be allocated through
a traditional process for assessing need. While some
low-income students who receive a grant may choose
to try to work in order to pay for their remaining
education and living expenses, others will choose
to proceed to the second step in the financial aid
application process and request a loan.
In short, then, the argument for splitting loans
and grants into two separate systems is based on the
premise that in so doing we can affect the perceptions
of young people from under-represented backgrounds
whom we wish to pursue post-secondary education
in greater numbers. The changes that have occurred
in Canadian financial assistance since 2005 have set
the stage for this move by delinking eligibility for
loans from the new federal and provincial access
grants. A great deal of the mystery about what a stu-
dent is applying for and what they can expect to
receive could be resolved by using a one-page form
for grants and a separate one for loans.
15. The income eligibility threshold is adjusted for family size.
16. This is not merely an assumption. The economic experiments conducted for the Foundation, discussed earlier in Chapter 5, show that grants are indeed more effective than loans of the same face value in encouraging youth to opt for post-secondary education, for the simple reason that loans, because they have to be paid back, are more costly to students than grants.

CHaPTer 6 — sTudenT finanCial assisTanCe in Canada: PasT, PresenT and fuTure 175
17. It should be noted that there is a difference between unmet need and unrecognized need. Unmet need does not take into account those costs that the student financial aid system simply does not recognize. Unrecognized need is thus even greater than unmet need.
Fully Fund Assessed NeedOn the CanLearn.ca website, the main online
information portal for the Canada Student Loans
Program and other federal student aid, the following
statement is posted:
Student loans are a great help if you need some
financial assistance to get through school. But
they’re meant to give you a helping hand, not
to pay for your entire post-secondary education.
You are still expected to contribute some money
(CanLearn, 2009).
As this suggests, expected personal and family contri-
butions toward the cost of a higher education are an
important part of the student financial aid system in
Canada. That said, to a surprising extent, many stu-
dents who have agreed to make these contributions
nevertheless find that they have unmet financial need.
Unmet need is the difference between the finances
the student aid system recognizes that students need
for a year of study and the maximum amount of
aid they are actually provided.17 To offer an analogy,
it is as if a bank agreed to provide a mortgage to a
home buyer but, after taking into consideration the
buyer’s down payment and income, issued several
thousand dollars less than required to complete
the transaction. Most people would consider this a
bizarre form of “bait and switch,” yet it is common
in student aid.
A recent study of eight provincial aid systems
shows that the proportion of student aid recipients
with unmet need rose steadily until 2005. In 2005–06,
maximum student aid limits were increased and
the incidence of unmet need dropped sharply but
temporarily. By the 2006–07 academic year, the per-
centage of students across Canada (excluding Quebec)
experiencing “high” unmet need (greater than $1,360
per year) had reached 21 percent; in six of these pro-
vinces, more than 20 percent of students experienced
high levels of unmet need. In B.C., more than half
of student aid recipients were considered to have
high unmet need (McElroy, 2009; State of Student
Aid, 2009).
Unmet need can have negative effects on persis-
tence and completion (see, for instance, McElroy,
2004). Other effects include increasing the amounts
that students must borrow from private sources
(such as banks) and the amount of hours worked
while in school. An ongoing study in Manitoba,
involving students who initially had unmet need in
the 2008–09 academic year and who were provided
with a Millennium Student Success Grant part way
through the year to cover most or all of the funding
gap, sheds some light on the problem. In focus
groups, most recipients of the grant said they had
used a loan calculator available on a student aid
website prior to applying for aid but were still not
expecting to have unmet need. In a survey of these
students, more than a quarter (27 percent) said they
would be borrowing from a private financial insti-
tution to deal with their unmet need and more
than half (54 percent) said they would be relying
on employment income; these answers were not
mutually exclusive. The amount the students esti-
mated they would obtain from each source varied
quite substantially: $13,335 from private financial
institutions and a little more than $4,500 from
employment income, including both earnings during
the summer and during the school year.
The study also asked about the effect of receiving
the grant to cover unmet need. Sixty percent of reci-
pients agreed that having their unmet need covered
by the Student Success Grant meant that they were
able to meet their basic needs for the year and did not
have to turn to others for loans of food, additional
money or a place to stay. The fact that these students
with unmet need would otherwise have considered
these options is particularly troubling given that they
were predominantly older (average age of 28 years)
and female (64 percent), with half having dependants
of their own.
About 30 percent of Student Success Grant reci-
pients were working in the academic year in which
they received their grant. They worked part-time
for an average of 16 hours per week. While these
students did not necessarily attribute it to receiving
the grant, in the survey, 36 percent reduced their
work hours in the winter semester (when the grant
was delivered) compared to the fall semester, and
18 percent of those who worked in the fall semester
did not work at all in the winter semester.

The Price of Knowledge: Access And sTudenT finAnce in cAnAdA176
Of course, there are many different reasons why
students face high costs and therefore potentially
have unmet need: some students have dependent
children, while others are enrolled in programs that
have higher costs, usually university professional pro-
grams. In the case of those who are raising children
while in school, it is clear that they simply are not
eligible for enough funding to support their costs. In
most provinces, the maximum aid available to stu-
dents with children is less than $20,000, which, once
full-time education costs are deducted, poses a clear
challenge to their ability to support children. While we
need to reduce, if not eliminate, the prevalence and
burden of unmet need in the student aid system, we
also need an approach that recognizes that not every
student is in the same situation.
First, governments across the country should once
again adjust aid limits upward. Each province needs
to look carefully at the incidence of unmet need
among its students and work with the federal govern-
ment to adjust aid limits accordingly. In addition,
aid limits should then be indexed to meet tuition
and other cost increases. Unmet need should be
continuously monitored and further adjustments to
aid levels made as required.
Second, students who experience very large
amounts of unmet need because they are enrolled in
competitive, expensive programs, such as medicine,
law and dentistry, which are also likely to yield high
incomes fairly soon after graduation, could be offered
a second type of government loan that covers their
unmet need but more closely resembles a private
loan. For example, the in-study interest subsidy
could be eliminated. While concerns may arise about
these students owing even more money to govern-
ments, the alternative for many is to end up no less
indebted to private lending institutions, which do
not tend to have creative repayment options like the
new Repayment Assistance Program.18
Third, students with dependent children of their
own should not find themselves thousands of dollars
short of their assessed need for their year of study
while also supporting a family. (The situation is per-
haps easier for those who can count on spousal
income, but this spousal income is already taken into
account in the assessment of the student’s need.)
These students tend to be older, and many are
returning to education in order to improve their
employment prospects, keep the job they have or,
in the case of many immigrants, have an existing
18. Another option for governments is to collect these unsubsidized loans through the income tax system once a young doctor, lawyer or dentist has established a successful practice.
Table 6.IV.1 — Incidence and Average Amount of Unmet Need in Select Provinces in 2006–07
No unmet need
% low unmet need
% high unmet need
$ unmet need low
$ unmet need high
avg $ unmet need
BC 37% 12% 5% $783 $6,345 $2,490
AB 65% 14% 22% $636 $5,504 $3,612
SK 55% 12% 33% $629 $4,379 $3,394
MB 63% 15% 23% $561 $4,938 $3,216
NB 81% 4% 14% $646 $6,619 $5,214
NS 49% 16% 35% $743 $5,387 $3,942
PE 87% 6% 7% $568 $4,752 $2,868
NL 55% 19% 26% $529 $4,377 $2,762
Unweighted average
61% 12% 21% $637 $5,288 $3,437
Ontario 58% – – – – $1,191
Source: McElroy (2009); source for Ontario is the 2009 State of Student Aid survey.
CHaPTer 6 — sTudenT finanCial assisTanCe in Canada: PasT, PresenT and fuTure 177
19. See Berger, Motte and Parkin, 2007, Chapter 5, as well as Canada Millennium Scholarship Foundation, 2006a, for a discussion of studies of the impact of bursaries conducted by Lori McElroy.
20. A review of the impact of the introduction of millennium bursaries conducted for Human Resources and Social Development Canada found that there was an 86 percent increase in non-repayable student financial aid between the pre- and post-Foundation periods. Fifty-six percent of this change was due to the millennium bursaries themselves, 27 percent to increases in provincial spending on grants and 17 percent to increases in federal spending on grants (Human Resources and Social Development Canada, 2007).
21. The Canada Student Grants will still reduce debt, but they will be delivered to students whose loans are not necessarily the largest, and those with the largest loans will not necessarily be eligible.
credential recognized in Canada. In the context of
the economic difficulties of 2008–09, it is unwise to
add to the challenges of those attempting to return to
or improve their standing in the labour market. There-
fore governments should also review their aid limits
for students with dependent children to ensure that
those limits reflect the reality of the costs associated
with raising children while studying, including, but
certainly not limited to, the cost of child care where it
is not provided.
The student aid system in Canada helps provide
many students with the financial resources they need
to pursue their educational goals. It is also, however,
structurally designed to fail to meet the need it identi-
fies for a significant number of students, some of
whom are in quite vulnerable circumstances. Given
the detrimental effect unmet need can have on a stu-
dent’s ability to succeed in post-secondary education,
this state of affairs should not be allowed to continue.
Don’t Ignore Student DebtAs discussed in the previous edition of this volume
and elsewhere,19 there are important reasons to be
concerned about the accumulation of student debt
(either annually or in total). High levels of annualized
debt have been shown to affect persistence from
one year of study to the next and completion of a
student’s program. There is some evidence that they
can also dissuade those students who do complete
their first program from continuing their studies
(Prairie Research Associates, 2007b). Students with
high levels of debt relative to their post-graduation
incomes are also likely to have difficulty keeping up
with repayment. All in all, the accumulation of debt
can be an obstacle to students progressing through
the post-secondary system and transitioning into the
labour market.
In the 1990s, average student debt of under-
graduates in Canada doubled in real terms. As we will
discuss in the next chapter, student debt levels have
more or less stabilized since then. This is due in part to
the introduction of the millennium bursaries in 2000,
as well as to provincial investments in grants in the
years that followed (as well as some increase in federal
grants).20 As we have noted above, millennium burs-
aries were allocated to students with the highest levels
of financial need. They thus served to limit the amount
of debt accumulated by those who needed to borrow
the most. Their debt-limiting effect complemented
those of provincial bursary programs in most juris-
dictions that set de jure or de facto caps on annual or
cumulative student debt.
The phasing out of the millennium bursaries
means that the main federally funded bursary pro-
gram will no longer be targeted at curbing the
accumulation of debt by high borrowers. Of course,
overall federal funding for non-repayable aid will
remain in place through the Canada Student Grants
Program. The point here is simply that the purpose
of these new grants, which are directed to borrowers
with the lowest family incomes, will no longer be to
reduce debt for high-need students.21 The effect of this
change on some high-need students will be muted
in the short term due to the federal government’s com-
mitment to “grandfather” the final (2008–09) cohort of
millennium bursary recipients by providing them
with Transition Grants that will ensure they receive
an equivalent level of grant funding for up to three
subsequent years (as long as they continue to have
financial need). For those high-need students enter-
ing the system in 2009–10 (or those who otherwise
have high levels of need but did not receive a millen-
nium bursary in 2008–09), no federally funded debt
reduction grants will be available. This will put
pressure on those provincial grant programs that
cap or limit the accumulation of debt. This pressure
may be accentuated by the effect of the recent eco-
nomic downturn. While it is too early to know for
certain how the economic situation will affect the
number of students who take advantage of student
aid programs, early indications in many jurisdictions

The Price of Knowledge: Access And sTudenT finAnce in cAnAdA178
22. See also the discussion of student summer employment income in Chapter 4.
show that applications for student aid are up sub-
stantially in 2009–10.22 This will likely affect debt
accumulation, putting it on the rise sooner rather
than later.
The access bursary programs introduced in 2005
and the new Canada Student Grants Program priori-
tize students who face financial barriers but who are
not typically accumulating the most debt. Making
the provision of non-repayable aid to students from
low-income families a priority was an important and
necessary improvement to the student financial
assistance system in Canada. It should not, however,
be made at the expense of other priorities, such as
limiting the accumulation of debt by students with
the highest levels of financial need. It is important
to develop and maintain a comprehensive approach
to student financial aid in Canada that is able to
respond to the needs of different types of student.

179
The suggestions above represent our current thinking
about future directions in student aid. They are based
as much as possible on the research conducted to
date. As discussed above, they are designed to put the
interests of students first. In the first place, the empha-
sis should be on those students less likely to make it to
and through post-secondary education without some
additional help—whether financial support or infor-
mation and encouragement. Yet we should also not
ignore the fact that post-secondary education is no less
expensive for those students who already have a clear
preference for it.
There are certain subjects that we have not covered
here, the main one being education tax credits. We
have discussed these at length above and in previous
publications, and there is no need to add to the argu-
ments we have made elsewhere. It is worth repeating,
however, that despite the extensive spending on tax
credits for post-secondary education in Canada and
the new post-graduation tuition tax rebates intro-
duced by several provinces, there remains no evidence
that these measures have a positive impact on student
behaviour. Moreover, as mentioned above and on
other occasions, the benefits delivered through these
measures are distributed inequitably and arrive too
late to help students facing financial barriers make
ends meet during the school year.
Additionally, as the country moves out of a reces-
sionary period and governments inevitably begin to
look for areas in which spending might be controlled,
we should recall that expenditures on education-
related tax measures exceed those on need-based aid.
Expenditures on grants, which provide non-repayable
assistance in a timely fashion to students who have
financial need, represent only two-thirds of the
expenditures on tax credits. At the very least, then,
if difficult choices need to be made, surely uni-
versal tax expenditures will no longer be favoured.
Policymakers and politicians should avoid further
investments in education tax credits that superficially
address the question of affordability in favour of
need-based student aid measures that will actually
contribute to the goal of increasing participation and
success in higher education.
If the opportunity to pursue a post-secondary
education is to be open to all Canadians who are
prepared, qualified and motivated to pursue that
path, we need a student aid system that is up to the
challenge. This means making sure that the system
puts students first; that it starts sending an early
message to students that there will be support for
them in meeting their goals; that it appropriately
targets those who need student aid the most with the
right kinds and amounts of aid; that it acknowledges
that financial aid alone will not be enough for some
students to reach their goals; and that it is flexible,
accountable and transparent. By making smart choices
and investments, student aid programs and policy
can be a positive influence on the aspirations and
success of students. We believe that by following the
suggestions presented here, Canada’s student aid
system can play a critical role in shaping the future of
our post-secondary education system in the next
decade and help realize the promise of higher edu-
cation for Canadians from all backgrounds.
Chapter 6
V. Conclusion

The Price of Knowledge: Access And sTudenT finAnce in cAnAdA180
23. This should not be taken as an endorsement of all available programs or funding mentioned.
Table 6.V.1 — Vision of Student Aid in Canada After Suggested Changes Have Been Adopted23
Type of Student/Period Low-Income Students All Students
Pre-secondary school • Auto-enrolment in CLB and virtual account balance statements
• Information about PSE, local access initiatives and student aid
• RESP account opened
• Information about PSE and student aid
• RESP account opened
Secondary school • Auto-enrolled CLB virtual account balance statements
• Early identification of eligibility for grants aimed at low-income students
• Information about PSE, local access initiatives and student aid, including specific programs like CSGP
• Application for federal and provincial student loans
• Institutional outreach and targeted grants
• Information about PSE and student aid
• Application for federal and provincial student loans
• Institutional aid
Post-secondary studies • Access to auto-enrolled CLB balance and RESP savings
• Funding packages for full assessed need
• Annual debt remission to a cap
• Tailored institutional support and institutional aid
• Unsubsidized public loans for extremely high borrowers
• Tax credits
• Access to RESP savings
• Funding packages for full assessed need
• Annual debt remission to a cap
• Unsubsidized public loans for extremely high borrowers
• Institutional aid
• Tax credits
Completed post-secondary • RAP during periods of low income
• Post-grad tax credits (some jurisdictions)
• Collection of unsubsidized loan debts through tax system
• RAP during periods of low income
• Post-grad tax credits (some jurisdictions)
• Collection of unsubsidized loan debts through tax system

Student Debt in CanadaJoseph Berger
The Price of KnowledgeAccess and Student Finance in Canada
7

183
More than half of Canadian students graduate with
debt. The latest figures suggest that six in ten uni-
versity graduates and 45 percent of college graduates
have amassed some student debt while in school.
In 2009, university undergraduates who borrowed to
pay for their studies graduated owing an average of
$26,680; for college graduates, the figure was $13,600
(although as we will discuss below, debt levels vary
significantly from one province to another). These
students have decided that the long-term benefits of
post-secondary education are worth the short-term
financial sacrifices associated with having debt upon
graduation.
Most students who borrow do so through govern-
ment student aid programs: that is, governments
lend students money to cover their educational and
living costs. Government student loans are typically
interest-free during the study period, and the first
payment is not due until six months after studies
end, although interest does accumulate during this
six-month “grace period.” Some students, out of
either choice or necessity (e.g., if they are ineligible
for publicly funded financial aid), opt for loans from
banks, friends or family members.
This chapter chronicles student debt in Canada
over the past decade. In it, we describe the impact of
debt reduction measures introduced at the end of
the 1990s on student debt, as well as assessing more
recent trends. There are three main areas of focus:
• First, we examine the debt situation of university
students. Using data from two sources, we dem-
onstrate how debt has increased much more
slowly in the current decade than it did in the
1990s. While student debt doubled in real terms
during the 1990s, it only increased by nine percent
between 2000 and 2009. This is partly because of
the introduction of government-funded debt re-
duction programs such as the Canada Millennium
Scholarship Foundation.
• Second, we examine the situation of college stu-
dents. While the data are not as complete as those
collected at the university level, it is apparent that
college debt levels have followed a similar pattern.
They declined during the early part of the decade
and have been rising since then.
• Third, we examine debt repayment and manage-
ment. We find that the $20 billion of outstanding
student debt in Canada poses a serious challenge to
many Canadian post-secondary graduates. Many
graduates report difficulty repaying their debt,
perhaps because their payments consume an un-
sustainable portion of their earnings. In recent years,
governments have turned their attention toward
improving programs that support borrowers during
the repayment period, as we will describe.
The chapter will highlight both policy successes and
new areas of concern. On the one hand, recent expe-
rience shows that improvements to student financial
assistance programs can help control the accumula-
tion of student debt. On the other hand, changes to
student costs and resources can put pressure not
only on student budgets, but on government pro-
gram budgets as well: as tuition and other costs rise,
or as student revenues from sources such as employ-
ment fall, controlling student debt becomes more
expensive. Thus, while the 2000s have been very
different from the 1990s in terms of the dynamics of
student debt, there are no guarantees for what lies
ahead in the 2010s.
The Government of Canada’s decision to create
the Canada Student Grants Program to take over
from the Millennium Bursary Program after 2008–09
is a positive step, as it provides for a gradual increase
in the amount of federally funded grants over a five-
year period beginning in 2009–10. Any subsequent
Chapter 7
I. Introduction

The Price of Knowledge: Access And sTudenT finAnce in cAnAdA184
changes to provincial tuition or student aid policies
or federal transfer payments to provinces, however,
will either reinforce or reduce that program’s effect.
Only time will tell, therefore, which of the two most
recent decades—the 1990s or the 2000s—represents
the norm and which the exception in terms of
changes in student debt levels.

185
During the 1990s, Canadian undergraduate student
debt doubled (in real terms). The 45 percent of stu-
dents who completed an undergraduate degree in
1990 with some level of student debt—including
government debt, bank debt and debt from family
and friends—reported just over $8,000 in student
debt, or $12,271 in 2009 dollars. By 2000, a majority
of graduates (53 percent) reported accumulating stu-
dent debt. The average debt level among the class of
2000 was $20,500, or $24,706 in 2009 dollars. (Please
note that unless indicated otherwise, all subsequent
dollar amounts reported in this section are given in
2009 dollars.)
Since 2000, a different portrait of student debt has
emerged. As discussed in the previous edition of The
Price of Knowledge, average student debt levels did
not change substantially during the first half of this
decade. According to Statistics Canada’s National
Graduates Survey (NGS), the incidence of debt among
undergraduates who finished their studies in 2005 was
only one percentage point higher than that of gradu-
ates from the class of 2000 (54 percent). Furthermore,
the amount of debt, after controlling for inflation,
had actually declined slightly, from $24,706 in 2000
to $24,548 in 2005.
A more or less similar pattern emerges from the
results of the Canadian University Survey Consortium’s
triennial survey of students in their last year of under-
graduate studies. In the early part of the decade, debt
levels fell. In 2000, CUSC respondents who borrowed
reported having accumulated $24,448 in debt. By 2003,
that amount had declined to $22,541 (the incidence of
student debt, however, increased slightly from 56 per-
cent in 2000 to 59 percent in 2003).
The CUSC surveys not only corroborate the Statis-
tics Canada findings, but, because they are more
frequent, allow us to continue our examination of
student debt in this decade. According to the CUSC,
by 2006—one year after the most recent Statistics
Canada data, which showed a decline between
2000 and 2005—debt levels had started rising again,
reaching a level three percent higher than in 2000
($25,275). The results of the 2009 survey reveal that
debt has increased a further five percent since 2006,
to $26,680.
In short, average student debt for university
undergraduates dipped slightly in the early part of
this decade before beginning to rise again at a rela-
tively moderate pace. The bottom line is that while
student debt doubled between 1990 and 2000, it has
increased by only nine percent in the nine years
since 2000 (Table 7.II.1).
There are a number of possible explanations for
the substantial change in the dynamics of student
Chapter 7
II. University Student Debt in Canada
Table 7.II.1 — Undergraduate Student Debt at Graduation in Canada in 2000, 2003, 2005, 2006 and 2009
2000 (NGS) 2000 (CUSC) 2003 (CUSC) 2005 (NGS) 2006 (CUSC) 2009 (CUSC)
Incidence of debt 53% 56% 59% 54% 59% 58%
Average amount of debt
$20,500 $20,286 $20,074 $22,800 $24,047 $26,680
Average amount of debt in 2009 dollars
$24,706 $24,448 $22,541 $24,548 $25,275 $26,680
Source: CUSC, Graduating Students Survey, 2000, 2003, 2006 and 2009; Statistics Canada, NGS.

The Price of Knowledge: Access And sTudenT finAnce in cAnAdA186
1. The Canada Millennium Scholarship Foundation was created with an endowment of $2.5 billion from the federal treasury and a ten-year mandate. In its early years, it dispensed about $285 million per year to more than 90,000 students across Canada. In its later years, its expenditures on need- and income-based bursaries increased to about $340 million per year.
2. The comparison is imperfect for a number of reasons. Most importantly, students graduating in 2000 would have had access to more generous financial aid in their last year of studies than in their first years of university.
debt in Canada before and after the year 2000. One
is simply that for most of the decade after 2000, the
Canadian economy—and thus its labour market—
was performing well, which positively affected the
financial resources available to students and their
families. Other developments stemmed directly from
government policy decisions.
• The first is the moderation of tuition increases.
As discussed by Junor and Usher (2004), average
Canadian university tuition doubled between
1989–90 and 1997–98, partly in response to
government budget cuts in the mid-1990s. This
contributed to the doubling of average student
debt. As we discussed in detail in Chapter 4 of this
volume, tuition has continued to increase since,
although not quite as rapidly. Between 1997–98
and 2008–09, university tuition increased by
37 percent. The fact that the growth in tuition fees
in the current decade has not been followed by
a proportional increase in student debt brings us
to the second factor.
• The second development concerns changes in
student financial aid policy. Since most student
debt is composed of government-provided loans,
student debt levels are shaped directly by trends in
both the amount of student financial aid provided
and in the proportion of that aid that is repayable.
As discussed in Chapter 6 of this volume and in
detail in the third edition of The Price of Knowledge
and Berger and Parkin (2008), student financial as-
sistance in Canada underwent substantial changes
over the course of the past two decades. The same
mid-90s cuts that led to tuition increases also re-
duced the budgets of student aid programs across
the country. After 2000, however, both federal and
provincial governments began to reinvest in both
loans and grants.
What follows is an analysis of changes in student
debt levels since 2000 within the context of tuition
prices and student aid policies. As the next section
makes clear, government policies with regard to the
cost of education and the level and type of financial
aid subsidies have an important impact on student
debt in Canada.
Student Financial Aid Policy from 2000 to 2005: Controlling Student DebtWith the introduction of the Canada Millennium
Scholarship Foundation in 1999–2000 (and related
provincial investments in need-based student aid),
student assistance in Canada became more generous.1
The proportion of need-based aid that is repayable
(i.e., the loan portion of a student’s loan/grant package)
decreased from 84 percent in 1996–97 to 70 percent
in 2003–04. To put it another way, between the mid-
1990s and the middle of the current decade, Canadian
governments doubled the proportion of student aid
that is non-repayable (i.e., grants and payments to
reduce existing student debt—see Chapter 6 for more
details). All else being equal, in the wake of this change,
one would expect student debt to fall after 2000.
The 2000 and 2003 CUSC surveys of graduating
students and the 2000 and 2005 Statistics Canada
surveys of graduates allow us to compare under-
graduate cohorts immediately before and after the
introduction of the Millennium Bursary Program and
the expansion of non-repayable student financial
aid.2 Despite a five percent overall increase in uni-
versity tuition (over and above inflation)—including
sharp increases of 14 percent or more in B.C.,
Saskatchewan, New Brunswick and Nova Scotia—
student debt did in fact decrease between 2000 and
2003 by $1,907, from $24,448 to $22,541. Similarly,
between 2000 and 2005, the NGS reported that the
incidence of student debt grew by one percentage
point, while the average amount declined by
$157. This suggests that the debt reduction measures
put in place in each jurisdiction by the Canada
Millennium Scholarship Foundation did their job, as
did similar provincial grant programs such as the

CHaPTer 7 — sTudenT debT in Canada 187
Ontario Student Opportunities Grant (OSOG) and
the grant portion of Quebec’s student aid system
(see below for more on the student debt situation in
these two provinces).
Other factors, however, cannot be ignored. Some
of these have already been mentioned—namely, a
more moderate tuition increase rate and a more
favourable job market. Also important was the fact
that in the first part of this decade, the maximum
amount of student aid that governments were willing
to provide remained unchanged. This means that
students with high levels of need could not have
borrowed more from governments in successive
years of their programs even if they had wanted
to. While some of these students borrowed privately
to make up their funding shortfall, others ended
up coping with “unmet need” (i.e., the difference
between their recognized costs and the aid they
received). When aid maximums are frozen, rising
costs lead to increases in unmet need more than debt.
Student Financial Aid Policy from 2005 to 2009: Expanding Need-Based AidAs mentioned earlier, the next era of student financial
assistance began in 2005–06, with a number of signi-
ficant policy changes. As described by Berger and
Parkin (2008), these include:
• increased student aid limits through the Canada
Student Loans Program and many provincial stu-
dent aid programs;
• reduced expected parental contribution amounts,
providing expanded access to student aid for stu-
dents from middle-income families considered
dependent on parental support;
Table 7.II.2 — Undergraduate Student Debt at Graduation in Canada in 2000, 2003 and 2005
2000 (CUSC) 2003 (CUSC) 2000 (NGS) 2005 (NGS)Difference
(2000 to 2005)
Incidence of debt 56% 59% 53% 54% +1 percentage point
Average amount of debt
$20,286 $20,074 $20,500 $22,800 - $2,300
Average amount of debt in 2009 dollars
$24,448 $22,541 $24,706 $24,548 - $158
Source: CUSC, Graduating Students Survey, 2000 and 2003; Statistics Canada, NGS.
Table 7.II.3 — Undergraduate Student Debt at Graduation in Canada in 2000, 2003, 2005 and 2006
2000 (NGS)
2005 (NGS) 2000 2003 2006
Difference (2003 to 2006)
Incidence of debt 53% 54% 56% 59% 59% 0
Average amount of debt
$20,500 $22,800 $20,286 $20,074 $24,047 + $3,973
Average amount of debt in 2009 dollars
$24,706 $24,548 $24,448 $22,541 $25,275 + $2,734
Source: CUSC, Graduating Students Survey, 2000, 2003 and 2006; Statistics Canada, NGS.

The Price of Knowledge: Access And sTudenT finAnce in cAnAdA188
• the expansion of grant programs through the intro-
duction of the Canada Access Grant, the millennium
access bursaries and the Ontario Access Grant, all of
which provided targeted support to students from
low-income families and other under-represented
groups (Aboriginal students, rural students, adult
learners and students with disabilities).
Given these policy changes and trends in student
borrowing, we might expect the following with respect
to student financial assistance:
• Increased loan limits and lower expected parental
contribution amounts might lead to higher debt
levels, since more students would have access to
more repayable public funds to keep up with rising
educational and living costs.
• The expansion of grant programs might have the
opposite effect of reducing overall indebtedness.
The policy changes, in other words, could be expected
to produce counteracting effects on debt.
In addition, there are two other counteracting
factors to take into account. The first is the effect of the
provincial loan reduction programs already in place,
such as OSOG. When aid limits rise, grant programs in
provinces such as Ontario serve to replace the higher
loans with more grants, nullifying any impact on debt
levels. At the same time, in two of the country’s biggest
provinces, Quebec and B.C., provincial grant pro-
grams were actually cut in 2004–05; in Quebec the
grant money that had been cut was fully reinstated
by 2006–07, but in B.C. the cut was permanent. When
Unmet Need in Canada
(only New Brunswick, at six percent, experienced
an increase of more than two percent during the
years in question).
With the exception of Alberta, the total amount
of aid increased considerably between 2004–05 and
2005–06, likely due to the increase in student aid
limits. In Manitoba, Nova Scotia and Newfound-
land and Labrador, the total award increased by
more than ten percent from one year to the next
(increases of 15 percent, 12 percent and 14 percent,
respectively). In P.E.I., the average total award
increased by nine percent; in B.C., Saskatchewan
and New Brunswick, the average total award
increased by eight percent.
The policy of expanding the size of student aid
packages to keep up with rising levels of student
need appears to have worked as intended. Between
2004–05 and 2005–06, unmet need decreased in six
provinces (by 15 to 63 percent).
An analysis of eight provincial student aid data-
bases (all but Ontario and Quebec) conducted by
Lori McElroy (2009) for the Council of Ministers
of Education, Canada offers insight into the evo-
lution of student financial need during the first
part of this decade. McElroy examines changes
in the level of assessed need (the costs-minus-
resources calculus employed by provincial student
aid programs), total award (the loan and grant
combination that comprises a student’s aid pack-
age) and unmet need (the amount of assessed
need not funded through the total award). Between
2001–02 and 2004–05, after accounting for infla-
tion, the average level of assessed need increased
by no more than eight percent in all of the eight
participating provinces. The actual amount of stu-
dent aid distributed to students decreased in three
provinces (B.C., Saskatchewan and Newfoundland
and Labrador) between 2001–02 and 2004–05
and increased only slightly in the remaining five

CHaPTer 7 — sTudenT debT in Canada 189
3. It should be noted, however, that the average loan fell by $240 in 2006–07.
4. See Berger (2008) for a more detailed discussion of why low-income students, the recipients of most of these new grants, would not have had high levels of financial need.
looking at national averages, these cuts could be
expected to result in higher levels of debt.
What actually happened to debt levels in the after-
math of all these changes? The 2006 CUSC survey
provides a baseline for analysis of student debt in the
most recent period. That year, 59 percent of those
graduating from an undergraduate program had
$25,275 in debt, somewhat higher than 2000 levels.
As mentioned above, higher student aid limits did
not always mean higher student loans for all borrow-
ers, since certain provinces, like Ontario, covered high
aid limits by expanding loan reduction programs.
That said, across the country as a whole, the average
loan (net of loan reduction) per recipient increased
between 2004–05 and 2005–06 by $351, or six percent,
contributing to the slight increase in debt.3
At the same time, the average grant per recipient
increased by nearly 19 percent between 2004–05 and
2005–06 and then by another 15 percent by 2006–07.
Thus, the expansion of grant programs mitigated
the increase in loans. Of course, not all borrowers
were affected in the same way. On the one hand,
much of the additional grant funding stemming from
the introduction of access grant programs flowed to
students who had relatively low levels of financial
need, even though they had low family incomes.4 For
these student aid recipients, the quality of their
financial aid (i.e., the grant-to-loan ratio) improved.
On the other hand, high-need students (at least in
provinces without loan reduction programs with
fixed loan maximums) who were receiving the maxi-
mum amount of student aid prior to 2004–05 were
likely to receive larger student loans beginning in
2005–06, as the typical student aid limit increased
from $9,650 to $11,900 per year (the amount varies
from province to province).
As discussed in Chapter 4, the costs students face—
including tuition, accommodation, transportation,
food, etc.—tend to increase from year to year, often
well above the rate of inflation. Tuition has not
increased substantially since 2005–06; university
students who studied between 2005–06 and 2008–09
(the most likely group of respondents to the CUSC’s
2009 survey of graduating students) would have
paid an average of $4,652 in tuition, or four percent
more than those studying between 2002–03 and
2005–06. Given that student borrowers had greater
access to higher government-funded student loans
between 2006 and 2009, it follows that student debt
would increase, which it did. As Table 7.II.4 demon-
strates, among the 59 percent of students completing
an undergraduate program in 2006 who had accu-
mulated some education-related debt, the average
was $25,275. In 2009, 58 percent of graduates
reported an average debt of $26,680—5.56 percent
more than in 2006. Given that, as mentioned, annual
maximum student aid amounts had increased in
most of the country by more than $2,000 in 2005–06,
this increase in average debt upon graduation
appears fairly moderate. This is likely the result of
the factors already mentioned: the combination of
the expansion of debt reduction programs in Ontario
and Quebec and the introduction of income-based
bursaries. Again, in the absence of these measures, it
Table 7.II.4 — Undergraduate Student Debt at Graduation in Canada in 2000, 2003, 2005, 2006 and 2009
2000 (NGS) 2005 (NGS) 2000 2003 2006 2009Difference
(2006 to 2009)
Incidence of debt
53% 54% 56% 59% 59% 58% - 1 percentage point
Average amount of debt
$20,500 $22,800 $20,286 $20,074 $24,047 $26,680 + $2,633
Average amount of debt in 2009 dollars
$24,706 $24,548 $24,448 $22,541 $25,275 $26,680 + $1,405
Source: CUSC, Graduating Students Survey, 2000, 2003, 2006 and 2009; Statistics Canada, NGS.

The Price of Knowledge: Access And sTudenT finAnce in cAnAdA190
is likely that student debt levels in 2009 would have
been considerably higher than in 2006.
In short, university student debt in Canada was
somewhat more common at the end of the current
decade than it was at the beginning. Students
who completed an undergraduate program in 2009
owed an average of $26,680—which is $2,231, or
nine percent, more than those who completed their
studies in 2000. During a decade in which the average
tuition increased by 14 percent, student debt grew at a
slower pace. This contrasts with students’ experience
in the 1990s, when a doubling of university tuition
fees led to a doubling of their debt. Although tuition
and other costs may have continued to rise after 2000,
and although aid limits increased after 2005, the
public policies that were designed to keep student
debt stable appear to have succeeded.
This portrait of university student debt in Canada
offers insight into the sometimes conflicting priorities
of student aid policy-makers. On the one hand, it
is crucial that student aid levels be adjusted regularly
to accommodate increasing costs, be they educational
(tuition, books, supplies) or other (housing, transpor-
tation, etc.). On the other hand, if aid levels rise and
grant levels do not, the result is not only more aid but
also more debt. The experience of the 1990s is telling:
when students’ costs increase rapidly and the policy
response is to allow student borrowing to rise corre-
spondingly, student debt levels grow quickly (in this
case, they doubled in less than eight years). The
expansion of non-repayable student financial aid,
beginning in 1999–2000 with the introduction of
the Canada Millennium Scholarship Foundation’s
millennium bursaries, allowed students to keep up
with rising costs without accumulating larger levels
of debt.
Not all students experienced the current decade
in the same way, however. The national averages
reviewed above disguise significant regional differ-
ences. As discussed in more detail in the next section,
student debt levels follow a geographical pattern:
they are highest in the East, lowest in Quebec,
Ontario and Manitoba, and in between these two
extremes in the West.
Average Amount of DebtAverage Amount of Debt (in 2009 Dollars)Incidence of Debt (%)
Figure 7.II.1 — University Student Debt in Canada from 1990 to 2009 in Nominal and Real 2009 Dollars
$0
$5,000
$10,000
$15,000
$20,000
$25,000
$30,000
$35,000
2000 2003 2006 20091990 1995 2000 2005
56%59% 59% 58%
45% 45%
53% 54%
10%
20%
30%
40%
0%
50%
60%$12,271
$16,629
$24,707
$24,449
$22,541
$25,276
$24,549
$26,680
NGS CUSC
Note: The NGS measures undergraduate student debt at graduation every five years; the CUSC’s graduating students survey measures undergraduate student debt every three years.
Source: Allen and Vaillancourt, 2004; Bayard and Greenlee, 2009; CUSC, Graduating Students Survey, 2000, 2003, 2006 and 2009.

191
5. See Chapter 4 for a discussion of student costs by province and Chapter 6 for a discussion of trends in student aid by province.
6. Data are not available for students in P.E.I. and Newfoundland and Labrador in 2009.
As discussed in Chapter 4, the costs students face
and the resources available to them vary consider-
ably from one region of the country to another.5 The
federal government provides direct support to stu-
dents through the Canada Student Loans Program
and indirect support through transfers to provincial
governments for post-secondary education. Yet Can-
ada’s post-secondary system differs considerably
from province to province. Provincial governments
establish their own frameworks for tuition and fees
and offer their own student aid programs. Employ-
ment opportunities, wages and family savings also
differ from one jurisdiction to the next. As a result,
the financial situation of students at graduation is
hardly uniform across the country. As we described
in Chapter 1, the wage premium associated with
higher education is higher in certain parts of Canada
than in others. In Chapter 2, we explored how par-
ticipation in post-secondary education varies from
region to region. It should come as no surprise, then,
that student debt levels follow a similar course.
Atlantic CanadaAccording to the CUSC survey of undergraduates in
their final year of study, the proportion of university
students who graduate with debt is greater in Atlantic
Canada than in other parts of the country, and the
average debt among those who borrow is also the
highest nationwide. In 2009, 62 percent of under-
graduates completing their studies in New Brunswick
and 64 percent doing so in Nova Scotia reported
accumulating student debt. These individuals owed
an average of $28,904 (New Brunswick) and $30,128
(Nova Scotia).6
Even after adjusting for inflation, the average
amount of student debt in the Maritimes has increased
faster than the national average since 2000. While
undergraduate student debt in Canada grew by nine
percent between 2000 and 2009, it grew by 12 percent
in New Brunswick and 13 percent in Nova Scotia.
The increase in debt is likely a function of three
factors. First, student employment (during the school
year and the summer) was lower in Atlantic Canada
than in the rest of the country during the early part of
this decade. Second, tuition increased in the three
Maritime provinces during this decade (particularly
in New Brunswick). Third, as Berger and Parkin
(2008) note and as discussed in Chapter 6, the share
of financial aid composed of non-repayable grants
and loan reduction remained below 20 percent in
the four Atlantic provinces throughout this period,
whereas the Canadian average in 2004–05 was 25 per-
cent. In short, costs tend to be higher and students
tend to have fewer resources at their disposal in the
Atlantic region—a formula that naturally adds up to
more debt.
QuebecQuebec has the lowest incidence of student debt
and the lowest average debt amount in the country.
In 2009, 45 percent of respondents to the CUSC
Graduating Students Survey reported owing an aver-
age of $15,102 in student debt. The incidence of debt
actually declined from 48 percent in 2006 (it was at
47 percent in 2000 and 2003), although the average
amount of debt grew by one percent between 2000
and 2009.
Chapter 7
III. University Student Debt by Region

The Price of Knowledge: Access And sTudenT finAnce in cAnAdA192
7. It should be noted that students who move to study at CEGEP and university must undertake at least five years of study, which may be funded through student financial aid.
8. Prior to the 2004–05 academic year, the Quebec government cut its bursary program by $103 million by significantly increasing the maximum amount a student could borrow (which saved the government money because students qualify for a bursary only after the amount they borrow has surpassed the maximum loan threshold). Following considerable public pressure, chiefly demonstrated through a large-scale student strike, the government reinstated the $103 million on a gradual basis. The province restored $70 million of the funding in 2005–06 and the full $103 million in 2006–07 and beyond.
There are three reasons why student debt in
Quebec has been consistently lower than in other
provinces during the past decade. First, under-
graduate university programs are typically shorter
in Quebec than elsewhere (i.e., three years instead of
four): Quebec students finish high school in Grade 11
and must complete a two-year pre-university CEGEP
program (the province’s public CEGEPs do not
charge tuition) before they can enrol in their first
year of university, which corresponds to second year
of university outside of Quebec.7 Second, Quebec’s
university tuition was frozen at about $1,800 between
1994 and 2007, at which point regular increases
of approximately $50 per semester (planned until
2011–12) were introduced. Even in 2008–09, after the
freeze was lifted, Quebec’s tuition fees were the
lowest in the country. Third, Quebec’s student aid
program has typically offered the most generous
financial aid in the country, with students receiving
between one-third and one-half of their financial aid
in the form of non-repayable assistance since 2000. A
Quebec university student borrowing the maximum
amount during each of the past three years would
have accumulated $7,320 in publicly funded student
debt upon graduation. Of course, Quebec students
can borrow from non-government sources too, and
they do not necessarily complete their studies in
three years.
It should be noted that the average student debt
dropped after 2000, as shown in Figure 7.III.1. With
the introduction of the Millennium Bursary Program,
the maximum annual loan in Quebec was reduced by
about one-quarter in 1999–2000, from $3,200 to $2,440,
where it has remained ever since, aside from 2004–05
and 2005–06.8
OntarioUndergraduate student debt in Ontario declined by
$2,515 between 2000 and 2003, before increasing by
$781 in 2006 and finally surpassing 2000 levels in
2009. Students graduating with debt in 2009 owed an
average of $25,778, only four percent higher than the
2000 average of $24,869. The initial decline and sub-
sequent slow increase in Ontario university student
debt mirrors the national portrait. In both cases, the
reasons underlying the trend are largely the same:
tuition fees rose above the level of inflation (although
a tuition freeze was in place for undergraduate pro-
grams for part of the decade) and financial aid
became increasingly non-repayable, as grants and
remission grew from about one-fifth to one-third of
all student aid. It is also important to acknowledge
the effect of the OSOG program, as discussed previ-
ously: OSOG grants reduce borrowing to $7,000 per
year. As long as this cap on annual debt is maintained,
increases in total debt upon graduation in Ontario will
be moderated, even if costs rise.
While the average amount of student debt did not
increase dramatically, debt became a more common
occurrence in the province during this decade. In
2000, 56 percent of respondents in the CUSC Gradu-
ating Students Survey reported having accumulated
debt. The rate grew to 57 percent in 2003, 58 percent
in 2006 and 64 percent in 2009.
The PrairiesUndergraduate student debt in the Prairie provinces
of Alberta, Saskatchewan and Manitoba grew faster
than the national average between 2000 and 2009,
although debt levels in these jurisdictions still
remain below the Canadian mean. In 2000, 56 per-
cent of Prairie graduates reported an average debt of
$21,666. That amount increased to $24,116 in 2009.
The increase in debt can be explained in part by ris-
ing tuition in Alberta and Saskatchewan. In Alberta,
tuition increased steadily by 16 percent (after inflation)
between 1999–2000 and 2008–09. In Saskatchewan,
tuition increased faster, rising by 33 percent between
1999–2000 and 2004–05; it was then reduced by ten
percent by 2008–09. In Manitoba, the province reduced
and then froze tuition in 2000–01. In 2008–09,
tuition in Manitoba was 24 percent cheaper than in
1999–2000.

CHaPTer 7 — sTudenT debT in Canada 193
9. It is worth noting that the share of non-repayable aid in the 2000s was considerably higher than in the 1990s in these three provinces; it doubled in Alberta, increased by 50 percent in Saskatchewan and tripled in Manitoba.
Student financial aid became more generous in
most of the Prairies during this decade. In Alberta,
tuition increases were offset by a moderate increase
in non-repayable assistance, with the share of need-
based aid made up of grants and loan remission
increasing from 28 percent in 1999–2000 to 32 per-
cent in 2006–07. In Saskatchewan, the share of
non-repayable aid fluctuated around 29 percent
throughout most of the decade, while it doubled in
Manitoba, from 24 percent in 2000–01 to 48 percent
in 2006–07.9
British ColumbiaIn 2000 and 2003, university graduates in B.C. had
debt levels that were slightly below the national
average. According to the CUSC Graduating Students
Survey, 43 percent of B.C. graduates in 2000 had an
average debt of $23,522. While the incidence of debt
increased to 57 percent in 2003, the average amount
declined by $1,156. In 2006, the incidence of debt
increased to 58 percent, while the average debt
load jumped by $3,986, to $26,351. By 2009, it had
increased by just under $400, with 54 percent of
graduates reporting an average debt of $26,738.
Between 2000 and 2009, undergraduate student debt
in B.C. grew by 14 percent, more than anywhere else
in Canada.
The considerable decline and then spike in debt
(student debt dropped five percent between 2000
and 2003 before increasing by 18 percent in 2006)
can be explained by significant changes to university
tuition in B.C. and to the province’s student financial
aid policy. At the start of the decade, B.C. students
paid the second-lowest tuition in the country, trailing
only Quebec and nearly $1,000 less expensive than in
the next cheapest province, New Brunswick. B.C. had
the second most generous financial aid program in
the country that year as well, again following only
Quebec in the share of non-repayable financial aid
provided to students. By 2006–07, following a jump
of 69 percent over five years, tuition in B.C. was $350
higher than the national average. At the same time,
B.C. significantly reduced the scale of its grant pro-
gram in 2004. As a result of these two changes, B.C.
financial aid recipients have the country’s biggest
student loans—almost $1,200 more per year than in
the runner-up province, New Brunswick.
Average debt owed to all sources at time of graduation ($) 2000 (adjusted)Percentage of graduates who owed student debt to any source (%) 2000Average debt owed to all sources at time of graduation ($) 2005Percentage of graduates who owed student debt to any source (%) 2005
Figure 7.III.1 — Incidence and Amount of Student Debt in Canada among Bachelor’s Degree Graduates with Debtfrom 2000 to 2005 in Real 2005 Dollars, by Province
$0
$5,000
$10,000
$15,000
$20,000
$25,000
$30,000
$35,000
$40,000
$45,000
$50,000
NL PE ON MB SK AB BC CANS NB QC
20%
40%
60%
80%
$31,600
$29,500
$31,900
$30,800
$34,813
$23,731
$30,000
$25,858
$13,600
$23,700
$19,300
$27,800
$15,224
$25,410
$21,381
$25,858
$23,000
$26,400
$22,800
$21,604
$23,172
$22,948
0%
78%
67% 69%
44%
54%
47%
59%
62%
50%53%
71%
69% 71%
46%53%
49%
63%
61% 53% 54%65%
74%
Source: Allen and Vaillancourt, 2004; Bayard and Greenlee, 2009; Statistics Canada, NGS (custom tabulations).

The Price of Knowledge: Access And sTudenT finAnce in cAnAdA194
BC AB MB ON QC NB NSSK
43%
58% 54%
57%
63%
55%54%
62% 57%
60%60%
62%
50%
49% 47%
49%
56%
58%64%
57%
47%
48% 45%
47%
64%
68%62%
67%
61%
65%64%
64%
Figure 7.III.2 — Incidence of Student Debt in Canada among Bachelor’s Degree Graduates from 2000 to 2009, by Province
0%
10%
20%
30%
40%
50%
60%
70%
80%2000200320062009
BC AB MB ON QC NB NSSK
$23,522
$26,351$26,738$22,365
$22,927
$24,619$24,305$22,763
$21,066
$27,389$28,089$23,923
$21,005 $15,595$19,953
$16,286
$24,869
$23,136$25,778
$22,354
$14,953
$13,656$15,102
$11,682
$25,834
$33,825 $28,904
$26,625
$26,572
$29,926$30,128
$28,818
Figure 7.III.3 — Average Amount of Student Debt in Canada among Bachelor’s Degree Graduates with Debt from 2000 to 2009, by Province
$0
$5,000
$10,000
$15,000
$20,000
$25,000
$30,000
$35,000
$40,0002000200320062009
Source: CUSC, Graduating Students Survey, 2000, 2003, 2006, 2009.
Source: CUSC, Graduating Students Survey, 2000, 2003, 2006, 2009.

195
10. The 2009 survey is restricted to a sample of students from ten colleges, six of which participated in previous waves of the survey. The sample of institutions is down from 19 in 2006; it was highest in 2003, at 27. In analyzing the survey responses, efforts have been made to compare the 2009 results to both the entire samples from previous years and samples from previous years composed only of colleges participating in 2009. While the survey is not comprehensive enough to describe the entire college sector or offer a regional analysis, in the absence of a large-scale representative survey of college students, it provides useful insight into their financial situation.
In 2005, 45 percent of college graduates reported
owing an average of $14,510 in student debt. Both the
incidence and the amount of debt were lower than in
2000, when 49 percent of graduates reported owing
an average of $15,168.
As we reported in the last edition of The Price of
Knowledge, despite the fact that average debt among
graduates fell between 2000 and 2005, the propor-
tion of current students with very large debt loads
has been edging upwards since 2003. According to
the Canadian College Student Survey Consortium
(CCSSC), the proportion of students (not graduates,
but students at all levels of study) reporting already
having more than $15,000 of debt increased from six
percent in 2003 to eight percent in 2004 and 13 per-
cent in 2005.
The 2009 College Student Survey reveals that this
trend is continuing: 55 percent of college students
have debt, and 18 percent of them owe more than
$15,000.10 Among those who had less than one year
of study left in 2009, 62 percent reported expecting
to accumulate some debt, with 24 percent expecting
to owe more than $15,000 (Figure 7.IV.1). Since 2003,
therefore, the proportion of students with more than
$15,000 of debt has tripled, rising from six percent
to 18 percent.
Chapter 7
IV. College Student Debt in Canada
0%
5%
10%
15%
20%
None/no response
Less than$5,000
$5,001 to$10,000
$10,001 to$15,000
15% 15%
9% 8%
$15,001 to$30,000
Over$30,000
16%
12%
8%6%
15%14%
Figure 7.IV.1 — College Student Debt in Canada in 2009
25%
30%
35%
40%
45%
50%Students with less than one year leftAll students
38%
45%
Source: CCSSC, College Student Survey, 2009.

The Price of Knowledge: Access And sTudenT finAnce in cAnAdA196
Provincial VariationOutside of Quebec, where college (CEGEP) edu-
cation is offered for free, student debt among college
graduates is fairly uniform. While college tuition
varies considerably from province to province (in
2006–07, college tuition outside Quebec ranged from
an average of $1,362 in Newfoundland and Labrador
to $3,425 in P.E.I.), debt levels do not. Some trends in
college debt levels, however, appear to have a
regional angle.
According to the National Graduates Survey, college
student debt in the Maritimes, Quebec and Ontario
declined between 2000 and 2005. In the Atlantic
region, debt declined from $15,194 among graduates
in 2000 to $14,198 among those who completed their
studies in 2005. In Quebec, debt declined by 12 per-
cent, from $9,554 to $8,429, during the same time
period. In Ontario, it dropped by nine percent, from
$17,676 to $16,004.
Meanwhile, in the Prairies, debt increased by 13 per-
cent, from $13,041 to $14,770, and in B.C. it increased
by 38 percent, from $13,018 to $17,925, during the same
years. These increases are likely due to significant
college tuition hikes in B.C. (nearly $1,300 between
1999–2000 and 2004–05) and Alberta (nearly $750).
0%
20%
40%
60%
80%
100%
20042003 20092005 2006
None/no responseLess than $5,000$5,001 to $10,000$10,001 to $15,000Over $15,000
Figure 7.IV.2 — College Student Debt in Canada in 2003–2006 and 2009
50%
15%
6%
22%
6%
50%44%
17%
17%
8%
13%
47%
17%
14%
8%
13%
45%
15%
15%
8%
18%
16%
7%
19%
8%
Source: CCSSC, College Student Survey.

CHaPTer 7 — sTudenT debT in Canada 197
11. The figure for 2003 was 26 percent, although in that year the proportion of students not responding to the question or reporting not knowing the answer was several times higher than in 2006 and 2009, raising concerns about the validity of comparisons; the question was not included in the 2000 survey.
Public and Private Debt in Canada
debt from financial institutions was $13,227 in
2006; by 2009, it had increased to $14,862.
The incidence of debt from family members has
remained stable in recent years. In 2006, 17 per-
cent of graduates reported borrowing an average
of $15,126 from family members. In 2009, the pro-
portion had increased to 18 percent, but the
average decreased to $14,435. Only seven percent
of students reported debt from other sources in
both years. The average amount increased from
$6,992 in 2006 to $8,500 in 2009.
Private borrowing also occurs at the college
level. Among students surveyed in 2009, 26 percent
reported having borrowed an average of $11,870
from financial institutions, up from 19 percent in
2006 (an average amount for 2006 is not available).
Twenty-seven percent of students in 2009 reported
an average of $5,384 in debt from family, while
19 percent reported owing an average of $5,644 to
other sources.
As noted earlier, changes to government student
financial aid programs in 2005-06 were in part
designed to make more students from middle-
income families eligible for student loans. One
might expect that university students graduating in
2009 would, therefore, be less likely than those who
graduated in 2006 to rely on non-public student
loans. It appears, however, that the market for
loans provided by banks or family members
remained stable, suggesting that certain students
might simply prefer to borrow from non-govern-
ment sources, despite the implicitly higher costs.
The main source of student debt in Canada is
government-funded student loans. This is the case
because, generally speaking, government-funded
student loans are more accessible and more afford-
able than those offered by private banks. First, public
student financial aid does not require borrowers to
offer collateral. Since most students have little in
the way of assets, they face considerable obstacles
to securing a private loan or line of credit, often
requiring a parent or guardian to co-sign. Second,
public student financial aid is heavily subsidized,
as interest does not accumulate while the student is
in school. Furthermore, student loans are increas-
ingly subject to repayment assistance measures
like interest relief and debt reduction in repay-
ment schemes.
Of course, not all students are eligible for
government loans, especially if they are consid-
ered dependent on parental income whose level
exceeds government aid cut-offs. Other students
might find that banks offer more flexible loan
options. Thus, whether they are crowded out of the
student aid market by choice or eligibility criteria,
many students finance their education in part
through non-government loans.
The 2009 CUSC Graduating Students Survey
provides information about the incidence of pri-
vate borrowing among university students. In 2006
and 2009, approximately 20 percent of students in
their last year of undergraduate studies reported
accumulating debt from financial institutions.11
The average debt load among those who reported

The Price of Knowledge: Access And sTudenT finAnce in cAnAdA198

199
While it may be called “student” debt, those doing
the repayment are usually not themselves students.
Student debt is typically amortized over ten years,
although many individuals repay their debt sooner,
just as many borrowers extend the terms of their
repayment by several years. For many individuals,
then, student debt is present throughout major life-
cycle events—such as marriage, buying a home and
childbirth. It is thus worth examining how student
debt in Canada fits within the context of the country’s
larger financial portrait.
RepaymentThe NGS offers information on debt repayment
among student borrowers. According to the first
follow-up survey of graduates of the class of 2005,
conducted in 2007, about one in seven graduates
repaid their entire student debt within two years of
graduating (Figure 7.V.1). A little less than half were still
in repayment two years after graduation.
Chapter 7
V. Life After School: Student Debt Beyond Post-Secondary Education
0%
20%
40%
60%
80%
100%
BachelorCollege Master Doctorate
Percentage of all graduates with debt remaining after two yearsPercentage of all graduates who had repaid their debt within two years of graduatingPercentage with no debt
Figure 7.V.1 — Student Debt Repayment among the Class of 2005
55%
34%
11%
46%
54%
15%
31%
56%
13%
31%39%
15%
Source: Statistics Canada, NGS.

The Price of Knowledge: Access And sTudenT finAnce in cAnAdA200
12. Schwartz and Baum suggest a payment-to-income ratio of no more than 18 to 20 percent of an individual’s discretionary income; the amount would slide downward for those with relatively low levels of income.
Among college graduates who were still in repay-
ment two years after graduation, the average balance
on their loan was $11,800. For those who completed
undergraduate studies in 2005, the average balance
two years later was $20,400. Students who completed
graduate programs were more likely to have paid off
their loans within two years. Among those with a
master’s degree who had debt, 32 percent had repaid
their entire loan within two years, while 30 percent of
Ph.D.s who graduated with debt had done so as well.
Among college graduates, those in Quebec, B.C.
and the Prairies were most likely to have entirely
repaid their loans within two years of graduation;
among bachelor’s degree graduates, this was true for
those in Quebec, Ontario, Alberta and Manitoba. For
both college and university graduates, those in the
Atlantic region were least likely to have repaid their
loans within two years of graduation. Students in the
four Atlantic provinces faced a double whammy of
sorts: they tended to report above-average levels of
debt and below-average earnings.
An analysis of both the 2006 and 2009 Graduating
Students Surveys reveals a relationship between
accumulated debt and plans to immediately pursue
additional education. In 2009, students who reported
planning on pursuing education immediately after
completing their bachelor’s degree program had an
average debt of $15,036; those who were not plan-
ning on returning to school had an average debt of
$16,457 (in 2006 these amounts were $11,530 and
$14,707, respectively; these figures are unadjusted
for inflation and include students without debt).
There does not appear to be a statistically significant
relationship between the amount of debt a student
has incurred and either his or her employment plans
or expected earnings, suggesting that post-secondary
students do not appear to link their decisions
about whether and how much to borrow with their
immediate post-study plans. By the time they assess
their labour market prospects, their debt has already
been incurred.
Student Debt in ContextAccording to Statistics Canada (2006a), the aggregate
amount of student debt among all Canadian families
(and not just graduating students) increased by
15.8 percent between 1999 and 2005. By 2005,
Canadian families collectively owed more than
$20 billion in student debt, up from $17 billion in
1999. Among the 12 percent of families reporting
student debt (the incidence did not change between
1999 and 2006), the average amount increased from
$12,000 to $12,700. Twenty-eight percent of families
whose main income earner was under 35 reported
owing student debt; in comparison, less than ten
percent of families whose main income earner was
over 45 reported owing student debt. Among the
various kinds of debt, aggregate student debt grew
the least during the six years in question. Mortgage
debt grew by 43 percent, line of credit debt by
133 percent, credit card debt by 59 percent, car loans
by 41 percent and other debt by 32 percent. As a
result, the student debt share of all debt declined
from 3.3 percent to 2.6 percent. In total, the debt load
of Canadian families grew by 48 percent in six years,
from $515 billion to $760 billion.
Debt-to-Income Ratios and Repayment AssistanceAs noted by Kapsalis (2006), the ability to repay
student debt on time is more closely linked to post-
study income than debt size. His ten-year overview
of student loans consolidated in 1994–95 found that
after controlling for debt size, the likelihood of a loan
going into default within three years of consolidation
fell by 1.2 percentage points for every $1,000 of an
individual’s income. As Schwartz and Baum (2006)
discuss in detail, as graduates’ income increases, so
does their ability to repay student loans. As a result,
they argue, policy-makers should consider restricting
loan repayment amounts to manageable proportions
of a graduate’s income.12 Evidence from the 2005 NGS

CHaPTer 7 — sTudenT debT in Canada 201
13. College graduates were also less likely to have medium or large debt loads. Forty-six percent of college graduates who borrowed reported less than $10,000 in debt, compared to 28 percent of bachelor’s degree graduates.
14. During the second phase of the RAP, the federal government pays both the interest amount and the portion of the loan payment not covered by the borrower.
suggests that a number of Canadian post-secondary
graduates had debt servicing ratios (i.e., the ratio of
debt payments to income) that ran the risk of placing
them in financial jeopardy. Using the NGS data,
Bayard and Greenlee (2009) ranked borrowers by the
size of their government debt servicing ratios. Among
college and bachelor’s degree graduates with large
student loans (i.e., debt of $25,000 or more), those
at the 75th percentile had debt servicing ratios of
14 and 15 percent, respectively. In other words, after
they had made their debt payments, these indi-
viduals had about 85 percent of their gross income
left over.
The NGS also asks graduates whether they had
difficulty repaying their student loans within the first
two years after graduation (as Kapsalis notes, the
majority of student loan defaults occur within the
first three years after graduation). Twenty-nine per-
cent of college graduates, 26 percent of bachelor’s
degree graduates, 23 percent of master’s degree
graduates and 25 percent of doctoral graduates who
owed money on government student loans reported
difficulty repaying their debt. As one would expect,
graduates with larger loans were more likely to report
difficulty making their payments. Statistics Canada
divided borrowers into three categories: those with
small (less than $10,000), medium ($10,000 to
$24,999) and large ($25,000 or more) levels of debt.
At the college level, 17 percent of graduates with
small debt loads reported difficulty repaying their
loans, compared to 34 percent of those with medium-
sized debt loads and 59 percent of those with large
debt loads. At the bachelor’s level, graduates were less
likely to report difficulty with repayment at all levels:
12 percent of those with small debt loads, 22 percent
of those with medium-sized debt loads and 43 per-
cent of those with large debt loads. Graduates in
2005 were slightly more likely than those in 2000
to report difficulty repaying their loans. Given that
university graduates typically earn more than
college graduates and that loan defaults tend to be
associated more with income levels than size of debt,
it follows that college graduates would be more likely
than university graduates to report difficulty making
their payments.13
A number of jurisdictions have recently introduced
public policies to assist those having difficulty repaying
their student loans. The federal Repayment Assis-
tance Plan (RAP), introduced in August 2009 to replace
the existing Interest Relief and Debt Reduction in
Repayment programs, establishes a repayment frame-
work similar to that promoted by Schwartz and Baum.
First, it restricts the repayment period to 15 years
(ten years for borrowers with permanent disabilities).
Second, it establishes payments on the basis of a
borrower’s income and family size. And third, it limits
payments to a maximum of 20 percent of a borrower’s
income. Individuals participating in the RAP will have
the payments they are able to make directed to
reduce their loan principal (the interest will be
covered by the federal government) for a period of
up to five years. Individuals who need assistance
beyond five years or have been in repayment for
more than ten years will make affordable payments
based on income and family size; the federal govern-
ment will cover interest charges as well as a portion
of the principal amount, such that the loan is paid
off within 15 years of the borrower leaving school.14
In Nova Scotia, the Enhanced Repayment Assistance
Plan (which applies only to provincial loans) offers
borrowers up to 54 months of assistance, during
which payments will not exceed seven percent of the
borrower’s gross family income. Versions of the RAP
have also been implemented in New Brunswick and
Saskatchewan.
Rather than introduce a version of the RAP, the gov-
ernment of Newfoundland and Labrador announced
in its 2009 budget the elimination of interest on pro-
vincial student loans. Beginning in August 2009, all
provincial residents who have student loans no longer
pay interest on the provincial portion of their loan. The
interest-free status applies to all provincial student
loans, regardless of the borrower’s financial circum-
stances or current province of residence.

The Price of Knowledge: Access And sTudenT finAnce in cAnAdA202

203
The story of student debt in Canada between 2000
and 2009 is as much the story of government policies
to fund post-secondary education and support stu-
dents as it is the story of borrowing. Particularly at
the university level, student debt is influenced sub-
stantially by two factors: tuition policy and student
financial aid. For most students, tuition is the single
largest expenditure they make during the academic
year, representing roughly one-third of their costs. As
we saw in the 1990s, dramatic increases in tuition
can easily lead to significant increases in both the
incidence and amount of student debt. During that
decade, university tuition and average student debt
both doubled.
Student debt, however, does not necessarily
increase in step with tuition. Between 1999–2000 and
2008–09, undergraduate tuition in Canada increased
by 14 percent over and above inflation. Students who
graduated in 2009 had only nine percent more debt
than did graduates from the class of 2000. In fact,
between 1999–2000 and 2004–05, despite tuition
increasing by ten percent, the debt load of graduates
in those two years declined by one percent. This
did not occur by accident. At the end of the 1990s,
governments significantly increased the amount
of non-repayable financial aid, establishing and
expanding programs designed specifically to reduce
student debt loads. The introduction of the Canada
Millennium Scholarship Foundation in 1999–2000
and the corresponding increases in need-based
grants and loan remission offered by provincial
governments allowed students to meet their growing
costs without increasing their loan burden. During
the second half of the decade, university student
debt began to rise again, although the presence of
debt reduction programs like those of the Founda-
tion have allowed for a more moderate increase
than that which occurred during the 1990s. Clearly,
governments have the tools at their disposal to
control—or even reduce—student debt.
Analysis of debt among college graduates is ham-
pered by a lack of comprehensive data, but the trend
appears to be similar to that of university graduates.
Debt declined during the early part of this decade,
and appears to have been increasing since. College
graduates are significantly more likely than university
graduates to report difficulty repaying their loans in
the initial years after graduation. Given that loan
defaults appear to be tightly linked to income levels
and that college graduates earn less than university
graduates, this comes as little surprise.
Governments in recent years have increasingly
oriented their student debt policy toward the issue of
debt manageability. The introduction of programs
like the federal Repayment Assistance Plan stream-
lines existing measures like interest relief and debt
reduction in repayment. Graduates who earn less
than they expected—or not enough to make their
loan payments—can reduce their payments to a
manageable level without extending their “debt
sentence” beyond 15 years. Although debt levels did
not increase dramatically during this decade, they
are not insignificant. For graduates entering a tight
labour market, programs like the RAP may become
popular rather quickly.
Chapter 7
VI. Conclusion

The Price of Knowledge: Access And sTudenT finAnce in cAnAdA204
After Millennium?
students whose incomes may be above the grant
eligibility cut-offs but who have large loans will see
their debt go up.
Third, the new program is designed to reach a
greater number of students, although it will do
this by lowering the value of the grant provided.
The Millennium Bursary Program provided grants
averaging $3,000 to approximately 90,000 stu-
dents per year, while its access bursary program
provided grants averaging $2,000 to approximately
25,000 students. The Canada Student Grants Pro-
gram hopes to serve 245,000 students per year,
but will do so with grants of either $2,000 or $800,
depending on whether they are from families with
low or moderate incomes. In short, then, more
students will benefit from federally funded debt
reduction, but the average benefit per student will
be less—which means that some types of students
will end up with less debt than would previously
have been the case, while others will end up
with more.
The final point concerns the interaction of fed-
eral and provincial student aid programs. When
both levels of government provide similar benefits
to the same clients, there is always a danger that,
in the absence of coordination, spending increases
by one level will be met by spending reductions by
the other, leaving the clients no better off. This
danger existed when the Canada Millennium
Scholarship Foundation was created by the fed-
eral government without prior consultation with
provinces and territories. The Foundation dealt
with this problem through its bilateral negotia-
tions with each jurisdiction that preceded the
delivery of the first millennium bursaries. These
negotiations led to commitments from provinces
and territories to ensure that students would
benefit fully from the injection of the new funds.
By the time the Foundation introduced its access
bursary program in 2005–06, its practice had
evolved further to the point of coordinating the
The introduction of the Canada Millennium Scholar-
ship Foundation resulted in a significant increase in
the portion of student aid that is non-repayable and,
as we have seen, contributed to the moderation of
student debt levels after 2000. How will the end of
the Millennium Bursary Program in 2008–09 affect
students and the debt loads they carry?
In the first instance, average student debt
should be unaffected, because the federal govern-
ment introduced the Canada Student Grants
Program to take over from the Millennium Bursary
Program in 2009–10. While the Foundation’s annual
$335 million in need-based bursaries will dis-
appear, $350 million in federal grants will take their
place. In fact, since the funds provided through the
new federal grants program are scheduled to rise
each year—reaching $430 million by 2012–13—the
new program may serve to reduce average student
debt levels rather than simply maintaining them
at present levels. This is, of course, good news for
Canadian students who have to borrow to pay for
their post-secondary education.
Secondly, the change in program will affect
which students receive grants. The Foundation
paid the majority ($285 million annually) of its
need-based grants to students with high levels
of need. The purpose was to help reduce the
loans of those students who faced the steepest
borrowing requirements. Beginning in 2005–06,
the Foundation provided a further $50 million per
year to students from low-income, rural and
Aboriginal families who faced financial barriers to
pursuing their studies, even though they might not
have the highest levels of need (see Berger, 2008b,
for a discussion of the difference between the
two programs and types of recipients). The new
Canada Student Grants Program, by contrast, will
direct all of its funds to students from low- and
moderate-income families, regardless of the size
of their loans. This means that students with low
incomes will see their debt go down, while other

CHaPTer 7 — sTudenT debT in Canada 205
15. Millennium bursaries replaced provincial student loans and, in some cases, grants, creating savings for provinces which the latter, in the context of their bilateral agreements with the Foundation, committed to reinvesting in student aid or related programs. The new federal grants program pays down federal loans and so does not produce comparable savings for provinces. In the period following the switch from one program to the other, provinces will have to decide whether they can continue to fund the programs that originated from the savings produced by the interaction of their programs with the Millennium Bursary Program once these savings are no longer realized.
After Millennium? (continued)
with the Millennium Bursary Program,15 or more
generally that the new federal spending gives them
“room” to redirect their own spending away from
non-repayable assistance, then the question of
the displacement of funds will arise once again
and, most importantly, student debt may increase.
One of the biggest test cases will be Quebec, which
has opted out of the Canada Student Loans Pro-
gram. Quebec’s share of the funding for the new
federal grants program will be delivered as an
“alternative payment” to the government rather
than directly to students in the context of an agree-
ment addressing the issue of displacement, as was
the case with the Foundation. If the Quebec gov-
ernment chooses not to pass the federal funds on
to students in the form of grants, then the federal
program will not have produced an incremental
benefit to students and debt will rise.
Only time will tell, therefore, whether the way in
which federal funding for non-repayable aid is
delivered—and not simply the amount—matters in
terms of the objective of controlling student debt.
design of the program in advance with individual
jurisdictions, to the point where in some cases
joint Foundation-provincial programs were devel-
oped that provided even greater certainty that there
would be no “displacement” of millennium funds.
This concern to avoid the displacement of new
spending is far from typical in federal-provincial
relations; in fact, a review of recent federal spend-
ing initiatives showed that the Millennium Bursary
Program was one of only a few cases where the issue
was addressed (Lazar, 2008).
While the new Canada Student Grants Program
continues the non-repayable funding previously
provided by the Foundation, it does not continue
the Foundation’s model of coordinating the
interaction of federal and provincial spending in
advance with each jurisdiction. This will be of no
consequence if provinces do not reduce the bene-
fits they provide to students themselves in the
period of adjustment that follows the introduction
of the new federal program. If some provinces
instead decide that they can no longer afford the
reinvestments they had introduced in conjunction

The Price of Knowledge: Access And sTudenT finAnce in cAnAdA206

The Price of KnowledgeAccess and Student Finance in Canada
Conclusion: From Research to Action

209
The Canada Millennium Scholarship Foundation
was created in 1998 with a $2.5 billion fund and a
mandate to “improve access to post-secondary edu-
cation so that Canadians can acquire the knowledge
and skills needed to participate in a changing economy
and society.” It was directed to achieve this mandate by
granting scholarships “to students who are in financial
need and who demonstrate merit.” This led to the
establishment of two flagship programs: a bursary
program, which by and large helped reduce the
amounts of money students with high levels of finan-
cial need had to borrow, and a merit scholarship
program, which recognized academic achievement,
community engagement, leadership and social inno-
vation. By the time its ten years of providing bursaries
and scholarships is completed at the end of 2009,
it will have delivered $3.2 billion in awards to post-
secondary students across Canada.
As instruments of public policy, however, founda-
tions such as the Canada Millennium Scholarship
Foundation were intended to do more than deliver
funds to clients. They were expected to innovate, to
harness the insight of experts and to focus it on specific
policy issues (KPMG, 2007, 19). This—and concern that
access-related policy was being made in the absence of
comprehensive data and research about who was and
was not participating in post-secondary education
and why—prompted the Foundation to create the
Millennium Research Program in 2001. By the time its
work is done, the Program will have commissioned
dozens of studies and published over 80 reports,
including this volume—the fourth and final edition of
The Price of Knowledge.
In the early days of the Program, a number of
questions were identified for investigation. These
included questions about who does and does not
attend post-secondary education and why, about the
amounts provided to students through student
financial assistance programs, about the effective-
ness of these programs, about the importance of
financial barriers relative to other types of barriers to
post-secondary education and about the situations
of different types of student, including the different
ways they pay for their college or university studies
(Canada Millennium Scholarship Foundation, 2001
and 2003). Subsequently, through the development of
the Millennium Pilot Projects, a number of questions
were asked and investigations conducted to determine
whether specific interventions could be demonstrated
to have a positive and cost-effective impact on access
or persistence. More recently, the Program has sought
to deepen our understanding of the behaviour of
particular groups of students (notably students from
low-income families and Aboriginal students), of
the various pathways that young people follow after
high school and of the impacts of different types of
financial aid programs. It has also highlighted how the
country’s changing demographics mean that efforts
to increase the post-secondary participation of under-
represented groups of students are more important
than ever.
It would be reassuring to think that each of the
research questions noted above had been answered
definitively. Unfortunately, social science is rarely
able to solve policy puzzles the way mathematicians
can solve equations. Questions are seldom answered
definitively. Each study adds to our knowledge but
raises new issues for exploration that were previously
overlooked. The more we learn, the more we wish
we knew.
Despite this, it is important to acknowledge the
progress that has been made. There is no doubt—as
is hopefully evident from the material presented in
the preceding chapters—that we know more about
post-secondary students, the factors affecting access
and persistence and the workings and effects of stu-
dent support policies than we did a decade ago.
We know more about who accesses post-secondary
education and who doesn’t, and we even know quite
a lot more about why. We know how much the
209
Conclusion
From Research to Action

The Price of Knowledge: Access And sTudenT finAnce in cAnAdA210
14 governments involved in delivering student finan-
cial assistance in Canada spend on different programs
and how these programs interact to the benefit or
detriment of their clients. We know more about the
goals and needs of different groups of students and
are better able to appreciate what distinguishes
college students from university students, older stu-
dents from younger students, Aboriginal students
from non-Aboriginal students, students from lower-
income families from students from higher-income
families, and so on. When the final results of the
Millennium Pilot Projects become available, we will
know more about which policies are likely to result in
greater participation and success in post-secondary
studies and which ones are not.
No one would ever pretend that this progress has
stemmed uniquely from the Foundation’s own
efforts. Many others have been active in the field,
including those who were researching access long
before the Foundation was created. In particular, the
development of new data sources by Statistics Canada
over the course of this decade has underpinned
important advances in our understanding of young
Canadians’ pathways into and out of the education
system. The Foundation’s contribution has been not
only to commission research studies to complement
those conducted by others, but to collect and organize
findings from a variety of sources with the goal of
better informing policy discussions related to parti-
cipation in post-secondary studies. What’s more,
the Foundation’s own research activities were only
possible because it was able to work with a wide range
of partners, whether other researchers or research
agencies, provinces, schools, colleges or universities.
So where have these efforts brought us? As men-
tioned, most of the research questions remain open
for continued exploration. At the same time, partly
on the basis of the research the Foundation and
others have conducted in recent years and partly on
the basis of the Foundation’s first-hand experience as
an agency interacting with students, post-secondary
institutions and governments, a number of impor-
tant lessons have been learned. The inescapable
need to continue research must not pre-empt us
from drawing conclusions that can inform action.
First and foremost, it has become clear that access
is not an issue that arises at a single moment in
time, such as the moment following high school
graduation when young people decide whether they
will continue their studies or not. Access is an issue
that must be addressed long before high school is
complete and long after the first day of college or
university classes has begun.
In short, all the work we have done to date has led
us to conclude that an effective access policy must
have three pillars:
• Better outreach to and preparation of students
well before they reach post-secondary education;
• More effective student financial assistance pro-
grams;
➢• Improved support programs for students once
they have enrolled in post-secondary education.
To some, this observation is but common sense, yet
it is important to acknowledge that most policy dis-
cussions around access still deal only with the
financial element and do not seriously engage with
the questions of how to ensure more youth from
under-represented backgrounds can be readied for
the academic and social challenges of campus life
and how they can be supported to succeed and excel
once their classes start. Even discussions about the
financial element do not always focus in a serious
way on which types of financial support are likely to
be most effective in improving access and
persistence.
Beyond these three pillars, a number of specific
lessons can be identified that help to define what an
effective access policy should look like.
• Since students from segments of the population
currently under-represented at the post-secondary
level face a complex set of interacting barriers,
policy responses must be comprehensive, which
means they must include financial assistance as
well as academic and other forms of student
support.

ConClusion — from researCH To aCTion 211
• Support programs should take effect long before
the student has completed high school. Many
students could benefit from being recruited into
outreach programs as early as elementary school
or the first years of high school.
• Student financial assistance programs should be
modernized to ensure not only that they reach stu-
dents early enough to influence their educational
aspirations and planning, but also that they are
easy to access and navigate, that they deliver the
best types of aid to the students who need it most,
that they adequately covers costs and that they
keep debt levels in check.
• Strategies to improve access to post-secondary
education should include career development
initiatives. Career development can provide stu-
dents, including those from under-represented
groups, with the information, skills and strategies
they need to help them navigate the transitions
from secondary to post-secondary education to
the labour market.
• Institutional outreach initiatives must go hand-in-
hand with “in-reach.” This means that colleges
and universities must go beyond the question
of access to address the question of how best to
support different types of learners during their
studies to ensure success. Most importantly, post-
secondary institutions must recognize that better
education outcomes require changes to the insti-
tutions themselves—in terms of the way they
relate to students at every stage of their journey
through the education system—and not just
changes to the students.
• Governments should seek to maximize value for
money by directing their financial support for stu-
dents to programs that are likely to have a positive
impact on the objective of improving access
and student success (such as grants for students
facing financial barriers). Since public resources are
limited, such programs should be given priority over
expensive programs that do little to improve
education outcomes, such as universal tax credits
or rebates.
• Appropriate government programs are the back-
bone of any access strategy, but governments
acting alone cannot achieve the progress that is
required. Community organizations, businesses
and post-secondary institutions all must play
their parts in reaching out to young Canadians to
encourage them to raise their aspirations and to
equip them with the skills and resources they need
to succeed in higher education.
• “One size fits all” approaches are rarely appropriate.
Students (or prospective students) from different
parts of the country or from different groups face
different challenges and are likely to respond
differently to particular programs. Moreover, it is
not only young people finishing high school who
stand to benefit from programs to facilitate transi-
tions into higher education and the labour market;
access strategies should focus on adult learners as
well. Program design and delivery must be flexible
enough to respond to these realities.
• Programs must be evaluated to ensure they are
having the intended impact. In practice, too few
policies to improve access and student success
programs are properly evaluated. Governments
and non-governmental organizations must em-
brace a “culture of evidence” that leads them
to collect and analyze the data needed to reach
conclusions about whether their programs are
achieving the expected results.
• The country’s diversity should be used to its advan-
tage. Rather than lament the lack of a federal minis-
try of education, Canada should take full advantage
of the learning and partnership opportunities that
stem from having 13 different education systems
within one country.
As the Foundation closes, then, it leaves behind these
observations, along with the many other findings
summarized in this volume, in the hope that they
can form a coherent starting point for subsequent
policy-making to improve access to post-secondary
education—a starting point of the type that was
lacking when the Foundation itself opened its doors.
Clearly, this list is hardly a detailed “how to” manual,
one that is easy to implement and that can guarantee
success. Rather, it is a general guiding framework that

The Price of Knowledge: Access And sTudenT finAnce in cAnAdA212
can point policy-makers and practitioners in the right
direction to ensure that gradual progress can be made.
Meanwhile, the research itself should continue.
As mentioned above, it is possible to celebrate the
advances in knowledge that have been made while
being conscious of how much we still do not know. It
would be a mistake to think that all the questions
have been answered. At the very least, changing eco-
nomic conditions and the continuing evolution of
government programs make it necessary to stay on
top of trends in post-secondary participation and
persistence. Equally important is the dissemination
of research in a manner that makes it accessible and
useful to practitioners. Research on access must
continue, but it must not continue simply for the
benefit of researchers.
At the same time, while new data should continue
to be collected, there is also the need to make better
use of the data that already exist. These include not
only national survey data such as those collected
by Statistics Canada, but also provincial and insti-
tutional administrative data which might hold many
lessons about how programs affect particular stu-
dents in particular circumstances, if only they could
be accessed for this purpose. Thinking about how
to broaden the range of data that is collected is
important, but so is asking the right questions of the
information that is already at hand.
This book ends, therefore, with two messages that
hopefully appear complementary and not contra-
dictory. First, research must continue in order to
inform action. Second, we do not need to wait for
more research in order to act intelligently. We hope
that the research conducted by the Foundation has
not only established the rationale for action—the
connection between the country’s future economic
prosperity and quality of life and its ability to improve
access to and success in post-secondary education—
but that it has also succeeded in establishing the
general directions that policy needs to take.
At the end of the day, however, research on its
own does not solve problems. Progress is made
through the actions of dedicated individuals in all
sectors who seek to provide opportunities in higher
education to Canadians from all backgrounds. These
individuals work in a variety of settings: in legisla-
tures; in government departments and offices; in
schools, colleges and universities; in community
organizations; and in businesses. We wish all of them
the best of luck, for Canada needs them to succeed.
Andrew Parkin
Montreal
October 2009

213
Allard, Real, Rodrigue Landry and Kenneth Deveau. 2009. And After High School? A Pan-Canadian Study of
Grade 12 Students in French-Language Schools in Minority Settings — Executive Summary. Montreal:
Canada Millennium Scholarship Foundation.
Allen, Mary, and Chantal Vaillancourt. 2004. Class of 2000: Profile of Post-Secondary Graduates and Student
Debt. Ottawa: Statistics Canada.
Asher, Lauren. 2007 Going to the Source: A Practical Way to Simplify the FAFSA. Berkeley: The Institute for
College Access and Success.
Association of Universities and Colleges of Canada. 2007. Trends in Higher Education: Volume 1—Enrolment.
Ottawa: AUCC.
Association of Universities and College of Canada. 2009. “Universities Matter: How Canada’s Universities
Contribute to Economic Recovery and Long-Term Prosperity.” Pre-budget Submission to the House
of Commons Standing Committee on Finance, August 14, 2009 (www.aucc.ca/_pdf/english/
reports/2009/prebudget_08_14_e.pdf).
Baldwin, Noel. Forthcoming. The Limits and Opportunities for Simplifying Student Aid in Canada. Montreal:
Canada Millennium Scholarship Foundation.
Baldwin, Noel, and Andrew Parkin. 2007. “The Case for Modernizing Student Financial Assistance in Canada.”
Policy Options. 28(10): p.47-53.
Baum, Sandy and Saul Schwartz. Forthcoming. Toward a Realistic Concept of Post-secondary Affordability.
Montreal: Canada Millennium Scholarship Foundation.
Bayard, Justin, and Edith-Elizabeth Greenlee. 2009. Graduating in Canada: Profile, Labour Market Outcomes
and Student Debt of the Class of 2005. Ottawa: Statistics Canada.
Beatty, Perrin, and Claire M. Morris. 2008. “The Key to Meeting Canada’s Crucial Skills Challenge.”
Web-only commentary published by The Globe and Mail (www.aucc.ca/publications/media/
2008/oped_globe_02_26_e.html).
Belzil, Christian, and Jorgen Hansen. 2006. Educational Attainment in Canada: Effects of Individual Attributes
and Expected Outcomes. HISSRI Working Paper 2006 C-11.
Berger, Joseph. 2007. A New Kind of Student Aid: Creating, Implementing and Assessing the Millennium Access
Bursaries. Montreal: Canada Millennium Scholarship Foundation.
Berger, Joseph. 2008a. “Why Access Matters Revisited”: A Review of the Latest Research. Millennium Research
Note #6. Montreal: Canada Millennium Scholarship Foundation.
Berger, Joseph. 2008b. A New Kind of Student Aid: Creating, Implementing and Assessing the Millennium Access
Bursaries. Millennium Research Note #7. Montreal: Canada Millennium Scholarship Foundation.
Bibliography

The Price of Knowledge: Access And sTudenT finAnce in cAnAdA214
Berger, Joseph, Anne Motte, and Andrew Parkin. 2007. The Price of Knowledge: Access and Student Finance in
Canada. 3rd ed. Montreal: Canada Millennium Scholarship Foundation.
Berger, Joseph, and Andrew Parkin. 2008. Ten Things You Need to Know about Financial Support for
Post-Secondar Students in Canada. Millennium Research Note #5. Montreal: Canada Millennium
Scholarship Foundation.
Boarini, Romina, and Hubert Strauss. 2007. The Private Internal Rates of Return to Tertiary Education:
New Estimates for 21 OECD Countries. OECD Economics Department Working Paper No. 591.
Boggs, Andrew Michael. 2009. “Ontario’s University Tuition Framework: A History and Current Policy Issues.”
Canadian Journal of Higher Education 39(1): 73–87.
Boothby, Daniel, and Torben Drewes. 2006. “Returns to University, College and Trades Education.” Canadian
Public Policy 32(1): p. 1–21.
Brooks, Bradley. 2005. Chronic Unemployment: A Statistical Profile. Ottawa: Statistics Canada.
Canada. 2008. Canada Education Savings Program: Annual Statistical Review. Ottawa: Human Resources and
Social Development Canada.
_____. 2009. Canada Student Loans Program Annual Report 2006-2007. Ottawa: Human Resources and Social
Development Canada.
Canada Millennium Scholarship Foundation. 2001. Does Money Matter? Montreal: Canada Millennium
Scholarship Foundation.
Canada Millennium Scholarship Foundation. 2003. Does Money Matter? II (2003-2004). Montreal: Canada
Millennium Scholarship Foundation.
Canada Millennium Scholarship Foundation. 2006a. The Impact of Bursaries: Debt and Student Persistence in
Post-Secondary Education. Millennium Research Note #4. Montreal: Canada Millennium Scholarship
Foundation.
Canada Millennium Scholarship Foundation. 2006b. Closing the Access Gap: Does Information Matter?
Montreal: Canada Millennium Scholarship Foundation.
Canadian Career Development Foundation. 2007. Applying the Construct of Resilience to Career Development:
Lessons from Curriculum Development. Montreal: Canada Millennium Scholarship Foundation.
Canadian Council on Learning. 2007. “Canada’s PSE Performance: File under ‘M’ for Missing”
(www.ccl-cca.ca/CCL/Newsroom/Releases/20070920ReleaseCanadasPSEperformance.htm).
CanLearn. 2009. “Repayment Assistance Plan.” (www.canlearn.ca/eng/after/repaymentassistance/rpp.shtml).
Carmichael, Lorne, and Ross Finnie. 2008. “Family Income, Access to Post-Secondary Education and Student
Grants: Why Equal Access Requires More Than Loans.” In Who Goes? Who Stays? What Matters?:
Accessing and Persisting in Post-Secondary Education in Canada. Eds. R. Finnie, R.E. Mueller,
A. Sweetman, and A. Usher. Montreal and Kingston: McGill-Queen’s University Press.
CBC.ca. 2009. Universities seek students, private contracts amid funding crunch. CBC.ca News, April 17.

215
Certified General Accountants Association of Canada. 2007. Where Does the Money Go: The Increasing
Reliance on Household Debt in Canada. Burnaby: Certified General Accountants Association
of Canada.
Chambers, Tony, Mahadeo Sukai, & Melissa Bolton. Forthcoming. Assessment of Debt Load and Financial
Barriers Affecting Students with Disabilities in Canadian Post-Secondary Education. Montreal: Canada
Millennium Scholarship Foundation.
Charbonneau, Léo. 2007. “Busting the Myth of an Enrolment Bust,” University Affairs, April 10, 2007.
Charron, Jocelyn. Forthcoming. The Genesis of the Millennium Pilot Projects Program. Montreal: Canada
Millennium Scholarship Foundation.
Chawla, Raj K. and Ted Wannell. 2005. “Spenders and Savers.” Perspectives on Labour and Income (March): 5-13.
Chemin, Matthieu (2009). Does Student Financial Aid Cause More Participation In and Graduation From
University? Evidence from the Quebec Student Aid reform. A MESA Project Research Paper. Toronto,
ON: Educational Policy Institute.
Chung, Lucy. 2006. “Education and Earnings,” Perspectives on Labour and Income 7(6): p. 5–12.
Church, Elizabeth. 2008. “Students Chart Zigzag Routes, Study Finds.” The Globe and Mail, July 14.
College Board. 2008. Fulfilling the Commitment: Recommendations for Reforming Federal Student Aid.
New York: The College Board.
Côté, James E., and Anton L. Allahar. 2007. Ivory Tower Blues. Toronto: University of Toronto Press.
Day, Kathleen. 2008. “A Tangled Web: The Relationship between Persistence and Financial Aid.” In Who
Goes? Who Stays? What Matters?: Accessing and Persisting in Post-Secondary Education in Canada.
Eds. R. Finnie, R.E. Mueller, A. Sweetman, and A. Usher. Montreal and Kingston: McGill-Queen’s
University Press.
Dehaas, Josh. 2009. “Let’s Make University Elite Again,” Macleans OnCampus, March 19
(oncampus.macleans.ca/education/2009/03/19/lets-make-university-elite-again/).
Demers, Marius. 2008. Rate of Return on a Bachelor’s Degree: For Individuals and for the State. Education
Statistics Bulletin No. 38. Quebec City: Government of Quebec.
Doray, Pierre, France Picard, Claude Trottier, and Amélie Groleau. 2009. Transitions—Educational Pathways:
Some Key Concepts. Montreal: Canada Millennium Scholarship Foundation.
Drewes, Torben (2009). The University Gender Gap: The Role of High School Grades. MESA Project Research
Paper. Toronto, ON: Educational Policy Institute.
Drolet, Marie. 2005. Participation in Post-Secondary Education in Canada: Has the Role Changed over the
1990s? Ottawa: Statistics Canada.
Dubois, Julie. 2008. Outcomes for Alternate Pathways. Strategic Policy and Research Report SP-784-05-07E.
Gatineau, Human Resources and Social Development Canada.
Dynarski, Susan and Judith Scott-Clayton. 2007. College Grants on a Postcard: A Proposal for Simple and
Predictable Federal Student Aid. Washington, D.C.: The Brookings Institution.
bibliograPHy

The Price of Knowledge: Access And sTudenT finAnce in cAnAdA216
Educational Policy Institute. Forthcoming. MESA Annual Report 2008. Montreal: Canada Millennium
Scholarship Foundation.
EKOS. 2009. An Examination of Barriers to Pursuing PSE and Potential Solutions. Montreal: Canada
Millennium Scholarship Foundation and Toronto: Council of Ministers of Education, Canada.
Emery, Herb. 2005. “Total and Private Returns to University Education in Canada: 1960–2030 and in
Comparison to Other Post-Secondary Training,” in Charles M. Beach, Robin W. Boadway and
R. Marvin McInnis (eds.), Higher Education in Canada, John Deutsch Institute, p. 77–112.
Fédération étudiante universitaire du Québec. 2008. Student Financial Assistance (SFA) Kit. Ed. Daniel
Pierre-Roy and Benjamin Laplatte. Montreal: FEUQ.
Ferrer, Ana M., and Alicia Menendez. 2009. The Returns to Flexible Postsecondary Education: The Effect of
Delaying School. Canadian Labour Market and Skills Researcher Network Working Paper No. 17.
Ottawa: Human Resources and Social Development Canada.
Ferrer, Ana M., and W. Craig Riddell. 2002. “The Role of Credentials in the Canadian Labour Market,”
Canadian Journal of Economics 35(4): p. 879–905.
Finnie, Ross and David Johnson. Forthcoming. Taking a Gap Year: Evidence from YITS-A. MESA Project
Research Paper. Toronto, ON: Educational Policy Institute.
Finnie, Ross, and Richard E. Mueller. 2009. Access to Post-Secondary Education in Canada Among the Children
of Canadian Immigrants. MESA Project Research Paper. Toronto: Educational Policy Institute.
Finnie, Ross and Richard E. Mueller. Forthcoming. Access to Post-Secondary Education in Canada:
Differences Between Provinces. MESA Project Research Paper. Toronto: Educational Policy Institute.
Finnie, Ross, and Hanqing Theresa Qiu. 2008. “Is the Glass (or Classroom) Half-Empty or Nearly Full?
New Evidence on Persistence in Post-Secondary Education in Canada” In Ross Finnie et al., eds.,
Who Stays? Who Goes? What Matters? Accessing and Persisting in Post-Secondary Education in
Canada. Kingston: McGill-Queen’s University Press.
Finnie, Ross and Hanqing Theresa Qiu. 2009. Moving Through, Moving On: Persistence in Post-secondary Education
in Atlantic Canada—Evidence from the PSIS. Ottawa: Statistics Canada, Centre for Education Statistics.
Finnie, Ross and Hanqing (Theresa) Qiu. Forthcoming. “Persistence in Post-Secondary Education in Canada:
Background Effects.” Unpublished manuscript.
Frenette, Marc. 2002. Too Far to Go On?: Distance to School and University Participation. Ottawa: Statistics Canada.
_____. 2003. Access to College and University: Does Distance Matter? Ottawa: Statistics Canada.
_____. 2008. “Why Are Lower-Income Students Less Likely to Attend University?: Evidence from Academic
Abilities, Parental Influences, and Financial Constraints.” In Who Goes? Who Stays? What Matters?:
Accessing and Persisting in Post-Secondary Education in Canada. Eds. R. Finnie, R.E. Mueller,
A. Sweetman, and A. Usher. Montreal and Kingston: McGill-Queen’s University Press.
_____. Forthcoming. What Explains the Educational Attainment Gap between Aboriginal and Non-Aboriginal
Youth? Unpublished manuscript.
217
Frenette, Marc, and Klarka Zeman. 2008. “Understanding the Gender Gap in University Attendance: Evidence
Based on Academic Performance, Study Habits, and Parental Influences.” In Who Goes? Who Stays?
What Matters?: Accessing and Persisting in Post-Secondary Education in Canada. Eds. R. Finnie,
R.E. Mueller, A. Sweetman, and A. Usher. Montreal and Kingston: McGill-Queen’s University Press.
Globe and Mail. 2005. “Why Quebec Should Let Its Tuition Fees Rise,” The Globe and Mail, February 14, A12.
Grayson, J. Paul, and Kyle Grayson. 2003. Research on Retention and Attrition. Montreal: Canada Millennium
Scholarship Foundation.
Groux, David. 2007. Portrait statistique de la participation aux études postsecondaires des jeunes Canadiens
en 2004-2005. Unpublished manuscript.
Hango, Darcy, and Patrice de Broucker. 2007a. Postsecondary Enrolment Trends to 2031: Three Scenarios.
Ottawa: Statistics Canada.
_____. 2007b. Education-to-Labour-Market Pathways of Canadian Youth: Findings from the Youth in Transition
Survey. Ottawa: Statistics Canada.
Hansen, Jorgen. 2007. Education and Early Labour Market Outcomes. Ottawa: Human Resources and Social
Development Canada.
Heisz, Andrew. 2007. Income Inequality and Redistribution in Canada: 1976 to 2004 Ottawa: Statistics Canada.
Hossler, Don, Mary Ziskin, Sooyeon Kim, Osman Cekic, and Jacob P.K. Gross. 2008. “Student Aid and Its
Role in Encouraging Persistence.” In Sandy Baum, Michael Macpherson and Patricia Steele, eds.,
The Effectiveness of Student Aid Policies: What the Research Tells Us. New York: The College Board.
Human Resources and Social Development Canada, 2007. The Review of Canada Millennium Scholarship
Foundation Bursaries: A Macro Study. Ottawa: Human Resources and Social Development Canada.
Institute for Higher Education Policy. 1998. Reaping the Benefits: Defining the Public and Private Value of
Going to College. Washington, DC: Institute for Higher Education Policy.
Junor, Sean, and Alex Usher. 2004. The Price of Knowledge: Access and Student Finance in Canada. 2nd ed.
Montreal: Canada Millennium Scholarship Foundation.
Kapsalis, Constantine. 2006. Factors Affecting the Repayment of Student Loans. Ottawa: Statistics Canada.
KPMG Advisory Services. 2007. Final Report: Evaluation of Foundations. Ottawa: Treasury Board Secretariat.
Kroes, Geneviève. 2008. Aboriginal Youth in Canada: Emerging Issues, Research Priorities, and Policy Implica-
tions. Ottawa: Policy Research Initiative.
Labrie, Normand, Sylvie Lamoureux and Denise Wilson. 2009. L’accès des francophones aux études postsecondaires
en Ontario : le choix des jeunes. Toronto : Centre de recherche en éducation franco-ontarienne.
Lachance, Marie, Pierre Beaudoin and Jean Robitaille. 2006. “Quebec young adults’ use of and knowledge
of credit.” International Journal of Consumer Studies, 30, 4 July, pp347–359.
Lambert, Mylène, Klarka Zeman, Mary Allen, and Patrick Bussière. 2004. Who Pursues Postsecondary Education,
Who Leaves and Why: Results from the Youth in Transition Survey. Ottawa: Statistics Canada.
bibliograPHy

The Price of Knowledge: Access And sTudenT finAnce in cAnAdA218
Lazar, Harvey. 2008. Displacement in Federal Transfer Payments: Exploring Concept and Practice with Special
Reference to the Canada Millennium Scholarship Foundation. Montreal: Canada Millennium
Scholarship Foundation.
Lefebvre, Pierre and Philip Merrigan. Forthcoming. Gender Gap in Dropping out of High School: Evidence
from the Canadian NLSCY Youth. Montreal: Canada Millennium Scholarship Foundation.
Lero, D., T. Smit Quosai, T. van Rhijn. 2007. Access to Post‐Secondary Education for Student Parents: Final Report.
Report prepared for Human Resources and Social Development Canada..
Levin, Ben. 2009. Commission on Tuition Fees and Accessibility to Post-Secondary Education in Manitoba:
Report to the Minister of Manitoba Advanced Education and Literacy. Winnipeg: Government of
Manitoba.
Lleras-Muney, Adriana. 2005. “The Relationship between Education and Adult Mortality in the United States,”
Review of Economic Studies 72 (January): p. 189–221.
Lleras-Muney, Adriana, and Frank R. Lichtenberg. 2002. “The Effect of Education on Medical Technology
Adoption: Are the More Educated More Likely to Use New Drugs?” National Bureau of Economic
Research Working Paper No. 9185.
Looker, E. Dianne. 2009. Regional Differences in Canadian Rural-Urban Participation Rates in Post-Secondary
Education. A MESA Project Research Paper. Toronto, ON: Educational Policy Institute
Looker, E. Dianne and Victor Thiessen. 2008. The Second Chance System: Results from the Three Cycles of the
Youth in Transition Survey. Ottawa: Human Resources and Social Development.
Ma, Xin and George Frempong. 2008. Reasons for Non-Completion of Postsecondary Education and Profile of
Postsecondary Dropouts. Ottawa: Human Resources and Social Development Canada.
Malatest, R.A. & Associates Ltd. 2004. Aboriginal Peoples and Post-Secondary Education: What Educators Have
Learned. Montreal: Canada Millennium Scholarship Foundation.
_____. 2007. The Class of 2003 High School Follow-Up Survey. Montreal: Canada Millennium Scholarship
Foundation.
_____. 2008. Survey of Canadian Career College Students. Montreal: Canada Millennium Scholarship
Foundation.
_____. 2009a. Foundations for Success: Early Implementation Report. Montreal: Canada Millennium
Scholarship Foundation.
_____. 2009b. Foundations for Success: Early Implementation Report—Executive Summary. Montreal:
Canada Millennium Scholarship Foundation.
_____. 2009c. Foundations for Success: Short-Term Impacts Report. Montreal: Canada Millennium Scholarship
Foundation.
_____. 2009d. Survey of Canadian Career College Students, Phase III: Graduate Survey. Montreal: Canada
Millennium Scholarship Foundation.

219
Malatest, R.A. & Associates Ltd. and Blair Stonechild. 2008. Factors Affecting the Use of Student Financial
Assistance by First Nations Youth. Montreal: Canada Millennium Scholarship Foundation.
Malick, Heather. 2009. “Time to Shrink the University,” CBCNews.ca, February 27 (www.cbc.ca/canada/
story/2009/02/27/f-vp-mallick.html).
Maritime Provinces Higher Education Commission. 2009. University Participation: Measures of Student
Progress and Outcomes (www.mphec.ca/en/research/participation.aspx).
Marshall, Jim. 2007. “Returns to Education: International and National Evidence,” SIPP Briefing Note 19 (March).
Martinello, Felice. 2008. “Transitions and Adjustments in Students’ Post-Secondary Education.” In Ross
Finnie et al., eds., Who Stays? Who Goes? What Matters? Accessing and Persisting in Post-Secondary
Education in Canada. Kingston: McGill-Queen’s University Press.
Martinello, Felice. 2009. “Effects of University Characteristics and Academic Regulations on Student
Persistence, Degree Completion, and Time to Degree Completion.” A MESA Project Research Paper.
Toronto, ON: Educational Policy Institute
McElroy, Lori. 2004. The Millennium Bursary in B.C.: Exploring Its Impact. Montreal: Canada Millennium
Scholarship Foundation.
_____. 2005a. Student Aid and University Persistence: Does Debt Matter? Montreal: Canada Millennium
Scholarship Foundation.
_____. 2005b. The Millennium Bursary in Manitoba: Exploring Its Impact. Montreal: Canada Millennium
Scholarship Foundation.
_____. 2008a. The Millennium Bursary in New Brunswick: Impact on Debt and Persistence. Montreal: Canada
Millennium Scholarship Foundation.
_____. 2008b. In Pursuit of PSE: Whether and When to Go On. Montreal: Canada Millennium Scholarship
Foundation.
_____. 2009. Examination of the Impact of the Provincial Need Assessment Process. Toronto: Council of
Ministers of Education, Canada.
Mendelson, Michael. 2006. Aboriginal Peoples and Post-Secondary Education. Ottawa: Caledon Institute
of Social Policy.
Ministère de l’Éducation, du Loisir et du Sport (MELS). 2008. Statistiques de l’éducation: Enseignement
primaire, secondaire, collégial et universitaire. Quebec: MELS.
Morissette, René, and Feng Hou. 2006. “Unemployment Since 1971,” Perspectives on Labour and Income 7(5):
p. 11–16.
Morissette, René, and Xuelin Zhang. 2006. “Revisiting Wealth Inequality,” Perspectives on Labour and Income 7(12):
p. 5–16.
Motte, Anne, and Saul Schwartz. 2009. Are Student Employment and Academic Success Linked? Millennium
Research Note #9. Montreal: Canada Millennium Scholarship Foundation.
bibliograPHy

The Price of Knowledge: Access And sTudenT finAnce in cAnAdA220
Munroe-Blum, Heather, and Peter MacKinnon. 2009. “Canada’s Innovation Deficit.” Policy Options 30(5):
p. 8–10.
Neill, Christine. 2007. Canada’s Tuition and Education Tax Credits. Montreal: Canada Millennium Scholarship
Foundation.
Nova Scotia. 2009. “Department of Education: Student Assistance: Managing and Repaying your Loan”
(studentloans.ednet.ns.ca/repayment_options01.shtml).
Organisation for Economic Cooperation and Development. 2008. Education at a Glance 2008. Paris: OECD.
Ouellette, S. (2006). How Students Fund their Post-Secondary Education: Findings from the Post-Secondary
Education Participation Survey. Ottawa: Statistics Canada.
Parkin, Andrew, and Noel Baldwin. 2009. Persistence in Post-Secondary Education in Canada: The Latest
Research. Montreal: Canada Millennium Scholarship Foundation.
Polytechnics Canada. 2009. “Submission to the House of Commons Standing Committee on Finance’s 2009 Pre-
Budget Consultations.” (www.polytechnicscanada.ca/pdf/publications/publications/pc_fina2009.pdf).
Prairie Research Associates. 2007a. First-Year University Student Survey prepared for the Canadian Survey
University Consortium.
Prairie Research Associates. 2007b. Report on Student Debt. Montreal: Canada Millennium Scholarship
Foundation.
Prairie Research Associates. 2009a. Graduating Students Survey (unpublished).
Prairie Research Associates. 2009b. Canadian College Student Survey (unpublished).
Rae, Bob. 2005. Ontario: A Leader in Learning—Report and Recommendations. Toronto: Ontario Ministry of
Training, Colleges and Universities.
Raymond, Mélanie. 2008. High School Dropouts Returning to School. Ottawa: Statistics Canada.
Richards, John. 2008. Closing the Aboriginal/Non-Aboriginal Education Gaps. Ottawa: C.D. Howe Institute.
Riddell, W. Craig. 2006. The Impact of Education on Economic and Social Outcomes: An Overview of Recent
Advances in Economics. Ottawa: Canadian Policy Research Networks.
Santiago, Paulo, Karine Tremblay, Ester Basri and Elena Arnal. 2008. Tertiary Education for the Knowledge
Society, Volume 2. Paris: OECD.
Schwartz, Saul, and Sandy Baum. 2006. How Much Debt Is Too Much?: Defining Benchmarks for Manageable
Student Debt. New York: The College Board.
Shaienks, Danielle, Eisl-Culkin, Judy, and Bussière, Patrick. 2006. Follow-Up on Education and Labour Market
Pathways of Young Canadians Aged 18 to 20—Results from YITS Cycle 3. Ottawa: Statistics Canada.
Shaienks, Danielle, and Gluszynski, Tomasz. 2007. Participation in Postsecondary Education: Graduates,
Continuers and Drop Outs—Results from YITS Cycle 4. Ottawa: Statistics Canada.

221bibliograPHy
Shaienks, Danielle and Gluszynski, Tomasz. 2009. Education and Labour Market Transitions in Young
Adulthood. Ottawa: Statistics Canada.
Shaienks, Danielle, Gluszynski, Tomasz, and Bayard, Justin. 2008. Postsecondary Education: Participation
and Dropping Out: Differences Across University, College and Other Types of Postsecondary Institutions.
Ottawa: Statistics Canada.
Sharpe, Andrew, Jean-François Arsenault, and Simon Lapointe. 2007. The Potential Contribution of Aboriginal
Canadians to Labour Force, Employment, Productivity and Output Growth in Canada, 2001–2017.
Ottawa: Centre for the Study of Living Standards.
Sharpe, Andrew, Jean-François Arsenault, Simon Lapointe and Fraser Cowan. 2009. The Effect of Increasing
Aboriginal Educational Attainment on the Labour Force, Output and the Fiscal Balance. Ottawa: Centre
for the Study of Living Standards.
Social Research and Demonstration Corporation (SRDC). 2009. Future to Discover: Interim Impacts Report.
Montreal: Canada Millennium Scholarship Foundation.
Stapleton, J. 2007. Why is it So Tough to Get Ahead? How Our Tangled Social Programs Pathologize the
Transition to Self-Reliance. Toronto: Metcalf Foundation.
Statistics Canada. Ongoing. Post-Secondary Student Information System. Ottawa: Statistics Canada.
_____. Ongoing. Survey of Labour and Income Dynamics. Ottawa: Statistics Canada.
_____. Ongoing. Estimates of Population, by Age Group and Sex for July 1, 2008, Canada, Provinces and
Territories, Annual (Persons Unless Otherwise Noted). CANSIM (database) Table 051-0001. Ottawa:
Statistics Canada.
Statistics Canada. 2004. “Distance as a Postsecondary Access Issue.” Education Matters April (1).
_____. 2006a. The Wealth of Canadians: An Overview of the Results of the Survey of Financial Security 2005.
Ottawa: Statistics Canada.
_____. 2006b. Census of Population. Ottawa: Statistics Canada.
_____. 2007. “Personal Debt,” Perspectives on Labour and Income (January): 28–34.
_____. 2008a. Earnings and Incomes of Canadians Over the Past Quarter Century, 2006 Census.
Ottawa: Statistics Canada.
_____. 2008b. Educational Portrait of Canada, 2006 Census. Ottawa: Statistics Canada.
_____. 2008c. Immigration in Canada: A Portrait of the Foreign-Born Population, 2006 Census.
Ottawa: Statistics Canada.
_____. 2009a. 2006 Census of Population. Ottawa: Statistics Canada.
_____. 2009b. “Labour Force Survey.” The Daily, May 8, 2009.
_____. 2009c. Income in Canada: 2007. Ottawa: Statistics Canada.

The Price of Knowledge: Access And sTudenT finAnce in cAnAdA222
Statistics Canada, 2009d. Household Spending on Education – Catalogue no. 81-599-X — Issue no. 001
Retrieved, June 3rd 2009: http://www.cmec.ca/Publications/Lists/Publications/Attachments/195/
81-599-x2009001-eng.pdf
Thiessen, Victor. 2009. The Pursuit of Post-Secondary Education: A Comparison of First Nations, African, Asian
and European Canadian Youth. Working Paper No. 19. Vancouver: Canadian Labour Market and Skills
Researcher Network.
Torjman, Sherri. 2009. Student Aid Meets Social Assistance. Ottawa: Caledon Institute of Social Policy.
University of Victoria. 2008. LE,NONET Project: A Pilot Project to Support the Success of Aboriginal
Post-Secondary Students. Montreal: Canada Millennium Scholarship Foundation.
U.S. Department of Education. 2009. “Obama Administration Announces Streamlined College Aid Application.”
Press release, June 24. Accessed October 5: www.ed.gov/news/pressreleases/2009/06/06242009.html
Usalcas, J. & Bowlby, G. (2006). “Students in the labour market.” Education Matters. 3(1).
Usher, Alex. 2006. Beyond the Sticker Price — A Closer Look at Canadian Tuition Fees. Toronto: Educational
Policy Institute.
Usher, Alex, and Patrick Duncan. 2008. Beyond the Sticker Shock 2008: A Closer Look at Canadian Tuition Fees.
Toronto: Educational Policy Institute.
Usher, Alex, and Ryan Dunn. 2009. On the Brink: How the Recession of 2009 Will Affect Post-Secondary
Education. Toronto: Educational Policy Institute.
Wente, Margaret. 2008. “Who Needs University Anyway?: It’s Not That Too Few Kids Go, But Too Many—
We Are Setting Them Up for Failure,” The Globe and Mail, May 24, A23.
Zeman, Klarka. 2008. “A first look at provincial differences in educational pathways from high school to
college and university.” Education Matters 4(2).

1000 Sherbrooke Street West, Suite 800
Montreal, QC, Canada H3A 3R2
www.millenniumscholarships.ca
Toll Free: 1-877-786-3999
Fax: (514) 985-5987
E-mail: [email protected]