Embed Size (px)
Citation preview

The Prevalence and Phenotype of Activated Microglia/Macrophages within the Spinal Cord of the HyperostoticMouse (twy/twy) Changes in Response to ChronicProgressive Spinal Cord Compression: Implications forHuman Cervical Compressive MyelopathyTakayuki Hirai1, Kenzo Uchida1*, Hideaki Nakajima1, Alexander Rodriguez Guerrero1, Naoto Takeura1,
Shuji Watanabe1, Daisuke Sugita1, Ai Yoshida1, William E. B. Johnson2, Hisatoshi Baba1
1Department of Orthopaedics and Rehabilitation Medicine, Faculty of Medical Sciences, University of Fukui, Eiheiji, Fukui, Japan, 2 Life & Health Sciences, Aston
University, Aston Triangle, Birmingham, United Kingdom
Abstract
Background: Cervical compressive myelopathy, e.g. due to spondylosis or ossification of the posterior longitudinal ligamentis a common cause of spinal cord dysfunction. Although human pathological studies have reported neuronal loss anddemyelination in the chronically compressed spinal cord, little is known about the mechanisms involved. In particular, theneuroinflammatory processes that are thought to underlie the condition are poorly understood. The present study assessedthe localized prevalence of activated M1 and M2 microglia/macrophages in twy/twymice that develop spontaneous cervicalspinal cord compression, as a model of human disease.
Methods: Inflammatory cells and cytokines were assessed in compressed lesions of the spinal cords in 12-, 18- and 24-weeksold twy/twymice by immunohistochemical, immunoblot and flow cytometric analysis. Computed tomography and standardhistology confirmed a progressive spinal cord compression through the spontaneously development of an impingingcalcified mass.
Results: The prevalence of CD11b-positive cells, in the compressed spinal cord increased over time with a concurrentdecrease in neurons. The CD11b-positive cell population was initially formed of arginase-1- and CD206-positive M2microglia/macrophages, which later shifted towards iNOS- and CD16/32-positive M1 microglia/macrophages. There was atransient increase in levels of T helper 2 (Th2) cytokines at 18 weeks, whereas levels of Th1 cytokines as well as brain-derivedneurotrophic factor (BDNF), nerve growth factor (NGF) and macrophage antigen (Mac) 22 progressively increased.
Conclusions: Spinal cord compression was associated with a temporal M2 microglia/macrophage response, which may actas a possible repair or neuroprotective mechanism. However, the persistence of the neural insult also associated withpersistent expression of Th1 cytokines and increased prevalence of activated M1 microglia/macrophages, which may lead toneuronal loss and demyelination despite the presence of neurotrophic factors. This understanding of the aetiopathology ofchronic spinal cord compression is of importance in the development of new treatment targets in human disease.
Citation: Hirai T, Uchida K, Nakajima H, Guerrero AR, Takeura N, et al. (2013) The Prevalence and Phenotype of Activated Microglia/Macrophages within the SpinalCord of the Hyperostotic Mouse (twy/twy) Changes in Response to Chronic Progressive Spinal Cord Compression: Implications for Human Cervical CompressiveMyelopathy. PLoS ONE 8(5): e64528. doi:10.1371/journal.pone.0064528
Editor: Michelle L. Block, Virginia Commonwealth University, United States of America
Received January 12, 2013; Accepted April 16, 2013; Published May 24, 2013
Copyright: � 2013 Hirai et al. This is an open-access article distributed under the terms of the Creative Commons Attribution License, which permitsunrestricted use, distribution, and reproduction in any medium, provided the original author and source are credited.
Funding: This study was supported by Grants-in-Aid to HB and KU for General Scientific Research of the Ministry of Education, Science and Culture of Japan (#B-22390287 and #B-24390351) and also by grants to HB and KU from the Investigation Committee on Ossification of the Spinal ligaments, Public Health Bureau ofthe Japanese Ministry of Health and Welfare (2011–2014). The funders had no role in study design, data collection and analysis, decision to publish, or preparationof the manuscript.
Competing Interests: The authors have declared that no competing interests exist.
* E-mail: [email protected]
Introduction
Mechanical compression of the spinal cord can cause neural
tissue damage, reduction of neuronal cell activity and protein
synthesis, and neuronal cell death. Cervical compressive myelop-
athy is characterized by progressive stenosis of the cervical canal
and compression of the spinal cord due to spondylosis, degener-
ative disc disease, and ossification of the posterior longitudinal
ligament (OPLL) [1–4]. Symptoms usually start to appear after
middle age with slowly progressive clumsiness and paresthesia in
the hands, gait disturbance, and signs of posterior and pyramidal
column dysfunction; eventually leading to tetraplegia or tetrapa-
resis. Human pathological studies have reported flattening of the
anterior horns, loss of anterior horn cells, cavity formation,
PLOS ONE | www.plosone.org 1 May 2013 | Volume 8 | Issue 5 | e64528

ascending demyelination in the posterior columns, descending
demyelination in the lateral columns and proliferation of
hyalinized small blood vessels [5–7]. However, since it is difficult
to properly estimate and follow the progression of these changes in
humans, considerable uncertainty exists regarding the biological
and molecular mechanisms responsible for the demyelination that
takes place in these disorders, and for the progressive loss of
neurons and oligodendrocytes. Moreover, although pro-inflam-
matory cytokines and related immune effector molecules are
considered to be produced after chronic, slow compression of the
spinal cord as seen in cervical compressive myelopathy, and could
result in induction of cell death through necrosis and apoptosis,
their role in compression-induced damage remain questionable
[8,9].
The inflammatory changes following spinal cord injury (SCI)
are complex and involve the activation of resident microglia and
recruitment of neutrophils, macrophages and lymphocytes into the
lesion from the systemic circulation [10–12]. This leads to tissue
damage, demyelination and neurological dysfunction [13], as well
as apoptosis of neurons and oligodendrocytes [14,15]. Activated
microglia and recruited macrophages (which are antigenically not
distinguishable, henceforth these cell types have been referred to as
microglia/macrophages) are implicated in neuroinflammation
through the induction or modulation of a broad spectrum of
cellular responses [10]. These cells are the primary source for pro-
inflammatory cytokines within the spinal cord, and their presence
and activity have the potential to act as markers of disease onset
and prognosis of neurological outcome following SCI [13,16].
Interestingly such neuroinflammation, including the microglial
response, has also been identified as a contributor to cell death in
ischemic injury in the brain [17] and chronic neurodegenerative
disorders [18]. These findings point to the potential commonality
of mechanisms underlying cell damage and cell death in both
acute neural injury and in slow-developing pathologies of neural
systems, like those seen in Alzheimer’s disease and Parkinson
disease, even in the absence of prominent leukocyte infiltration
[18].
Recent studies have demonstrated phenotypic changes in
macrophages during the immunological and inflammatory
responses to various conditions [19,20]. This divergence is referred
to as macrophage polarization and has been reported in non-
neural [21] and neural tissues [22,23], and also in both in vitro and
in vivo experiments [24]. Approximately, two subtypes of macro-
phages have become of great interest in the field of spinal cord
regeneration: classically activated macrophages (M1 phenotype)
and alternatively activated macrophages (M2 phenotype) [25–28].
Whereas the M1 phenotype is the product of exposure to T helper
1 (Th1) cytokines, such as interferon gamma (IFN-c), tumor
necrosis factor-alpha (TNF-a), and interleukin (IL)-6, the M2
phenotype is activated via T helper 2 (Th2) cytokines, such as IL-
4, IL-10, and IL-13 [22,29,30]. While the M1 phenotype is known
for their high expression of inflammatory cytokines and bacteri-
cidal activity, M2 phenotype exhibits enhanced phagocytic and
anti-inflammatory properties; although at least three subsets of M2
macrophages have also been documented [21,25]; for such
reasons, macrophages with the latter phenotype are considered
to function in recovery of SCI [19,23,31]. Thus, modification of
the SCI microenvironment to increase the number of M2
macrophages may promote neuroprotection. A similar possibility
has also been recently attributed to microglia by showing that
these cells can also be induced under certain conditions to both
extremes of the M1 and M2 differentiation spectrum [25,32].
The study of the pathological mechanisms of spinal cord
dysfunction related to cervical spondylotic myelopathy (CSM) and
OPLL has been impaired in the past due to the lack of good in vivo
models. However, this has changed with the recent characteriza-
tion of the tip-toe Walking Yoshimura (twy/twy) mouse; an
autosomal recessive mutant. The twy/twymouse has a spontaneous
mutation in the nucleotide pyrophosphatase (Npps) gene develop-
ing posterior calcification of the atlantoaxial membrane at the
cervical (C) 1-C2 vertebral level. The defective vertebral column
causes cervical spinal cord compression progressively over several
months. Thus, our group has used the twy/twy mouse as a suitable
model to investigate the effects of the chronic, slow compression of
the spinal cord that is seen in CSM and OPLL [33–36].
Recent studies have suggested that neuronal and oligodendro-
cytic apoptosis through activation of the Fas death receptor
pathway is a key event in the twy/twy mouse spinal cord [37] and
have shown that neutralization of Fas ligand with a function-
blocking antibody reduced neural inflammation at the lesion
mediated by activated microglia and macrophages [7]. Another
study from our laboratory reported that increased expression of
TNF-a and TNF receptor 1 (TNFR1) released by the activated
microglia/macrophages correlated with neuronal and oligoden-
drocytic apoptosis [8]. Based on the above findings, the present
study was designed to provide insight on previously unexplored
aspects of microglia/macrophage phenotypic changes induced by
chronic, slow spinal cord compression seen in cervical compressive
myelopathy. Specially, we investigated the expression and
colocalization of markers of microglia/macrophages (both M1
and M2 phenotypes) as well as the levels of neuroinflammatory
cytokines closely related to these cells, which could promote
neurotoxicity or neuroprotection and lesion repair in the twy/twy
spinal cord.
Materials and Methods
The Spinal Hyperostotic twy/twy and Control Mice andSpinal Cord Progressive Compression Evaluated byComputed Tomography (CT)The Ethics Review Committee for Animal Experimentation of
University of Fukui approved the experimental protocol. Spinal
hyperostotic twy/twy mice purchased from the Central Institute for
Experimental Animals (Kawasaki, Japan), were used in all
experiments (aged 12 weeks; n = 29, 18 weeks; n = 29, 24 weeks;
n = 29) (Table S1). Homozygous twy/twy mice were maintained by
brother-sister mating of heterozygous Institute of Cancer Research
(ICR) mice (+/twy). ICR mice at the age of 12, 18, and 24 weeks
were used as control animals (n = 10 in each age group). The
disorder is inherited in an autosomal recessive manner and the
homozygous hyperostotic mouse is identified by a characteristic
tip-toe walking at 6 to 8 weeks of age, but no congenital
neurological abnormalities are detected at that age. The twy/twy
mouse exhibits spontaneous calcified deposits posteriorly at the
C1–C2 vertebral level, producing a variable degree of compression
of the spinal cord between C2 and C3 cord segments with a
general ankylosis of joints. The calcified mass grows in size
progressively with age particularly in the atlantoaxial membrane,
causing profound motor paresis at the age of 18–24 weeks
[9,33,37].
For hematoxylin and eosin (H&E) staining, the resected cervical
spine of each twy/twy mouse of different ages (n = 5 for each time
point) was fixed in buffered formaldehyde for 48 hours at 4uC.The sample was then decalcified for 2 weeks at 4uC in 0.5 M
ethylenediaminetetraacetic acid (0.5 M Tris-HCl buffer) at pH 7.6
and then embedded in paraffin using standard procedures. Serial
4-mm-thick cryostat sagittal and axial sections were prepared.
Activated Microglia in Spinal Cord Compression
PLOS ONE | www.plosone.org 2 May 2013 | Volume 8 | Issue 5 | e64528
In order to confirm differences in the severity of compression
before H&E staining, flow cytometry, and immunoblot analysis,
we measured the spinal canal area in the cervical spine of twy/twy
mice on CT scans (GE Medical Systems, Milwaukee, WI) obtained
under anesthesia with ravonal (TiopentalH, Mitsubishi Tanabe
Pharma, Osaka, Japan), using Image J, the image analysis software
of the National Institutes of Health (Bethesda, MD). The
correlation between age and spinal canal area at the site of
maximum compression at C1–C2 vertebral level was determined.
We also compared the spinal canal areas at C1–C2 to that at
thoracic (Th) 1 vertebral level. In the same way, we also compared
the spinal cord areas at the site of maximum compression in H&E
staining at C1–C2 to that at Th1 vertebral level using the color
image analyzer (MacSCOPE, Minani, Fukui, Japan).
ImmunohistochemistryDeep anesthesia was induced in each group of mice (n = 5 twy/
twy mice and n=2 control ICR mice for axial sections, and n= 2
twy/twy mice for sagittal sections in each time point) followed by
transcardial perfusion and fixation with 4% paraformaldehyde in
0.1 M phosphate-buffered saline (PBS); the spinal cords were
dissected and post-fixed in the same fixative for a few hours. The
tissue samples were immersed in 10% sucrose in 0.1 M PBS at 4uCfor 24 hours, and 30% sucrose in 0.1 M PBS for 24 hours.
Segments of the cervical spinal cord were embedded in optimal
cutting temperature compound (Sakura Finetek, Torrance, CA)
and cut on a cryostat into serial 10 mm-thick axial or sagittal
frozen sections, which were serially mounted on glass slides and
fixed with 2% paraformaldehyde in 0.1M PBS for 5 minutes,
rinsed in PBS and stored at 280uC.For immunofluorescence staining, frozen sections were permea-
bilized with 0.1 M Tris-HCl buffer (pH 7.6) containing 0.3%
Triton X-100. The following primary antibodies diluted in
Antibody Diluent with Background Reducing Components (Dako
Cytomation, Carpenteria, CA) were applied overnight at 4uC:rabbit anti-Integrin aM (equivalent to CD11b), 1:200 (Santa Cruz
Biotechnology, Santa Cruz, CA); mouse anti-neuronal nuclei
(NeuN) monoclonal antibody, 1:400 (Millipore Corporation,
Billerica, MA); rabbit anti-inducible nitric oxide synthase (iNOS),
1:200 (BD Pharmingen, San Jose, CA); rat anti-CD16/32, 1:200
(Santa Cruz Biotechnology); goat anti-arginase-1, 1:200 (Santa
Cruz Biotechnology); goat anti-CD206, 1:200 (Santa Cruz
Biotechnology); rabbit anti-brain derived neurotrophic factor
(BDNF) polyclonal antibody, 1:300 (Abcam plc, Cambridge,
UK); rabbit anti-nerve growth factor (NGF) polyclonal antibody,
1:300 (Abcam plc); anti-macrophage antigen-2 (Mac-2), 1:200
(BioLegend, San Diego, CA); and mouse monoclonal anti-CD4
antibody, 1:100 (Abcam plc). The sections were then incubated for
1 hour at room temperature with Alexa Fluor-conjugated 488- or
568- secondary antibodies, 1:250 (Molecular Probes, Eugene,
OR). Finally, the sections were washed, wet-mounted, and
examined by the omission of a primary antibody or through the
use of a non-specific negative primary antibody that was isotype
matched. Furthermore, some sections were counterstained with
nuclear marker DAPI (Abbott Molecular, Des Plaines, IL).
All images were obtained using a fluorescence microscope
(Olympus AX80, Olympus Optical, Tokyo) or a confocal laser
scanning microscope (model TCS SP2, Leica Instruments,
Nussloch, Germany), where the 488- and 543-nm lines of the
argon/helium-neon laser were used for fluorescence excitation.
Semi-quantitative Analysis of Stained TissuesChanges in CD11b-(red), NeuN- (green) and CD4- (red) positive
areas at 12, 18, and 24 weeks of age twy/twy mice, and control
ICR mice were assessed by the following procedure: serial axial
sections were divided into five groups (slide glass) by collecting
every fifth section separately from the site of maximum
compression (between the C2 and C3 dorsal roots) and half of
the spinal cord on the compressed side was analyzed using grain
counting with the light intensity automatically set by the color
image analyzer (MacSCOPE).
The proportions of CD11b-positive cells double immunostained
with iNOS, CD16/32, arginase-1 or CD206 in each groups were
determined semi-quantitatively by the following procedure: the
serial axial sections divided into five groups (slides) as mentioned
above from the site of maximum compression (between the C2
and C3 dorsal roots) and the number of positive cells per cross-
section in each fluorescence stain was determined automatically
using grain counting based on light intensity by a color image
analyzer (MacSCOPE). The light intensity and threshold values
were maintained at constant levels when collecting digitized
images in all analysis. We documented the extent to which the
microglia/macrophages present within the spinal cord were
polarized by the M1/M2 ratio, as determined by the number of
CD11b cells that were also positive iNOS and CD16/32/the
number of CD11b cells that were also positive for CD206 and
arginase-1.
Flow CytometryImmediately after deep anesthesia, the mouse was perfused
intracardially with 200 ml of ice-cold 0.1 M PBS, and the spinal
cords were harvested (n = 3 for each time point). The cervical
spinal cord around the maximally compressed site was surgically
dissected and dissociated with collagenase, 175 U/ml (Sigma-
Aldrich, St. Louis, MO) for 1 hour at 37uC. Cells were washed in
Dulbecco’s modified Eagle’s Medium (Invitrogen Life Technolo-
gies, Carlsbad, CA) containing 10% fetal bovine serum and
filtered through a 40 mM nylon cell strainer (BD Biosciences, San
Jose, CA) under centrifugation to remove tissue debris and obtain
a single-cell suspension, as described in detail previously [38].
From this point on, prior to every staining, a cell-count was
performed in every sample to ensure a cell density of 1.06106
cells/100 mL. Cells were incubated for 1 hour on ice with the
following fluorescent antibodies: allophycocyanin (APC) rat anti-
CD45, 0.25 mg/ml (BioLegend, San Diego, CA); Pacific Blue rat
anti-Ly-6G/Ly-6C, 1.0 mg/ml (equivalent to Gr-1; BioLegend)
and PerCP-Cy 5.5 rat anti-CD11b, 0.25 mg/ml (BD Pharmigen,
San Jose, CA). For intracellular staining [39], the cells were
resuspended in Fixation buffer and treated with Permeabilization
Buffer (both from Santa Cruz Biotechnology) followed by re-
suspension in ice-cold PBS and incubation for 1 hour with goat
anti-arginase 1, 1:200 conjugated to fluorescein isothiocyanate
(FITC),1:200 (Santa Cruz Biotechnology) and phycoerythrin (PE)-
conjugated rabbit anti-iNOS, 3.0 mg/ml (Abcam plc); or PE/Cy7
conjugated rat anti-CD16/32, 1.0 mg/ml (Biolegend) and FITC
rat anti-CD206, 1.0 mg/ml (Biolegend). Samples with cells alone
were used as negative controls to eliminate background autofluo-
rescence, and samples where the cells had been incubated with a
single-added antibody were used as positive controls to set up the
cytometer alignment and to remove any spectral overlap.
Flow cytometry was performed immediately using a FACS
CantoTM II (Becton Dickinson Biosciences, San Jose, CA).
Forward scatter was set to further eliminate any cellular debris
from analysis. In each test, a minimum of 250,000 cells were
analyzed and the data were processed using BD FACSDiva
software (Becton Dickinson Biosciences). The different cell
populations present in the suspension were classified according
to the combination of expressed antigens, as stated in previous
Activated Microglia in Spinal Cord Compression
PLOS ONE | www.plosone.org 3 May 2013 | Volume 8 | Issue 5 | e64528

reports, as follows: CD11bhigh/CD45low/GR-1negative represented
resting microglia [39], and CD11bhigh/CD45high/GR-1negative
represented activated microglia/macrophages [38]. At the previ-
ously described time points, CD11bhigh cells in the spinal cord
were sub-fractioned into a CD45low/GR-1negative population,
identifying them as resting microglia. In a similar fashion,
CD11bhigh cells were sub-fractioned into a CD45high/GR-1negative
population, which identified them as activated microglia/macro-
phages.
The phenotype of microglia/macrophage sub-populations was
corroborated through their expression of iNOS or CD16/32 (pro-
inflammatory M1 phenotypes) as well as arginase 1 and CD206
(anti-inflammatory M2 phenotypes).
Myeloperoxidase (MPO) Staining and AssayThe 3,39-diaminobenzidine (DAB) staining kit (Muto Pure
Chemicals Co., Tokyo) was used in each mouse (n = 3 for each
time point) for cytochemical staining of MPO according to the
instructions supplied by the manufacturer. Briefly, the peroxidase
reaction was developed with 0.05% 3,39-DAB in 50 mmol/L Tris-
HCl (pH 7.6) and 0.03% H2O2 for 1 to 2.5 min. The sections
were counterstained with eosin, dehydrated, and mounted.
Oxidized 3,39- DAB (a brown, highly insoluble indamine polymer)
was visible under light microscopy.
MPO activity levels in harvested compressed spinal cord tissues
(n = 3 for each time point) were measured with MPO assay kit
(BioVision, Milpitas, CA) using a spectrophotometer at 412 nm.
One unit of MPO activity was defined as the amount of enzyme
degrading 1 mmol of 5-thio-2-nitrobenzoic acid (TNB) per minute
at 25uC. MPO activities in the spinal cord tissues were calculated
by using a standard curve generated with MPO and expressed in
units per miligram weight of wet tissue.
Immunoblot AnalysisImmediately after deep anesthesia, the spinal cord of each
mouse (n = 3 for each time point) around the maximally
compressed site (between C2 and C3 dorsal roots) was carefully
dissected en bloc from the cervical spine and stored immediately at
280uC in liquid nitrogen. Segments were centrifuged at 15,0006g
for 30 seconds using a BioMasher Rapid Homogenization Kit
(Funakoshi, Tokyo), then solubilized in RIPA lysis buffer 1X
(Santa Cruz Biotechnology), homogenized and stored at 280uC.The protein concentration was determined in the obtained
samples by a Lowry protein Assay using a DC protein assay kit
(Bio-Rad Laboratories, Hercules, CA). Laemmli sodium dodecyl-
sulfate buffer samples containing the protein mixtures were boiled
and subjected to immunoblot analysis. Total protein (20 mg/lane)was separated on 12.5% SDS-PAGE and transferred onto
polyvinylidene difluoride membrane (PE Applied Biosystems,
Foster, CA) for 70 minutes using a semi-dry blot apparatus. The
membrane was washed twice in PBS containing 0.05% Tween 20,
blocked by 5% skimmed milk in PBS for 1 hour at room
temperature, and then incubated with one of the following
antibodies: rabbit anti- IFN-c, 0.2 mg/ml (Abcam plc), rabbit anti-
TNF-a, 0.2 mg/ml (Abcam plc), rabbit anti- IL-6, 1:200 (Santa
Cruz Biotechnology), rat anti-IL-4, 1:200 (Santa Cruz Biotech-
nology), rabbit anti-IL-10, 1:200 (Santa Cruz Biotechnology), goat
anti-IL-13, 1:200 (Santa Cruz Biotechnology), rabbit anti-BDNF,
1:200 (Abcam plc), rabbit anti-NGF, 1:200 (Abcam plc), or rat
anti-Mac-2, 1:200 (BioLegend) overnight at 4uC. After triple
washing in 0.1 M PBS, the membranes were incubated for 1 hour
in the respective secondary IgG/HRP complex antibodies: anti-
goat, 1:1,000; anti-rabbit, 1:5,000; or anti-rat, 1:1,000 (all from
Santa Cruz Biotechnology). After triple washing with 0.1 M PBS,
the membrane was immersed in ECL Advance Western Blot
Detection kit (GE Healthcare, Buckinghamshire, UK) for 1 minute
and then exposed to X-ray film for visualization of peroxidase
activity and determination of the level of each specific protein. The
band intensities were normalized to b-actin, 1:2000 (Abcam plc),
and Kaleidoscope Prestained Standards (Bio-Rad Laboratories)
was used as the molecular weight control.
Statistical AnalysisAll values are expressed as mean6 standard deviation (SD).
Differences between groups were examined for statistical signifi-
cance using one-way factorial analysis of variance (ANOVA).
Before the priori comparison, Kolmogorov-Smirnov test was used
for verification of normality. A p value ,0.05 denoted the
presence of a significant difference with Tukey’s post hoc analysis.
The above tests were conducted using SPSS software version 11.0
(SPSS, Chicago, IL).
Results
Chronic and Slow Progressive Compression in twy/twyMouse Induces the Increase of Activated Microglia/MacrophagesThe twy/twy mouse exhibited a clear age-related compression of
the spinal cord at the C1–C2 vertebral level. The calcified mass
grew progressively with age particularly in the atlantoaxial
membrane posteriorly at the C1–C2 vertebral level (Figs. 1A–D).
CT scans and H&E staining demonstrated that the spinal canal
and spinal cord transverse area rate at the C1–C2 relative to that
at the Th1 vertebral level was 0.90260.077 and 0.79560.098 in
12-week-old, 0.67760.162 and 0.62360.151 in 18-week-old,
0.42360.107 and 0.39760.101 in 24-week-old twy/twy mice,
respectively (Figs. 1B–G). These results indicated there is
correlation between the CT findings and histological examina-
tions, and that the spinal canal and spinal cord transverse area
decreased with advancing age.
The area of the spinal cord that was positive for CD11b
immunostained increased and that area which was positive for
NeuN immunostained cells decreased with advancement of spinal
cord compression. The CD11b-positive area increased according
to the degree of spinal cord compression in both the gray and
white matters, especially in the anterior horn and anterior column
of the maximally compressed site compared with the rostral or
caudal sites of the spinal cord (Fig. 2A). On the other hand, the
NeuN-positive area, mainly in the anterior horn, decreased
accordingly to the degree of spinal cord compression; the
difference between 18- and 24-week-old twy/twy mice was
significant (Fig. 2). The results of ICR mice in each age group
(12-, 18-, and 24-week-old) were the same as those from 12-week-
old twy/twy mice (Fig. S1A).
Chronic Progressive Spinal Cord Compression InducesChanges in the Phenotype Markers of Microglia/MacrophagesTo evaluate the phenotype of microglia/macrophages, tissues
were immunostained with iNOS and CD16/32 for the M1
phenotype, and arginase-1 and CD206 for the M2 phenotype, as
well as the pan-specific marker CD11b for microglia/macrophag-
es. Double-positive merged cells were found particularly in the
anterior horn and anterior column. In control ICR mice (with the
same results seen in each age group; Fig. S1B) and in 12-week twy/
twy mice, multiple cells co-expressing arginase-1 and CD11b were
found; but no CD11b-positive cells co-expressing iNOS, CD16/32
Activated Microglia in Spinal Cord Compression
PLOS ONE | www.plosone.org 4 May 2013 | Volume 8 | Issue 5 | e64528

or CD206 were identified (Fig. 3A). In 18-week twy/twy mice,
while some CD11b-positive cells co-expressed iNOS or CD16/32,
the number of those co-expressing arginase-1 or CD206 and
CD11b remained higher (Fig. 3B). In 24-week twy/twy mice, while
the number of CD11b- positive cells co-expressing iNOS or
CD16/32 remained elevated, that of cells co-expressing CD11b
and arginase-1 or CD206 persisted as the most abundant type
(Fig. 3C). These differences between iNOS-CD16/32 and
arginase-1-CD206 were statistically significant in 18- and 24-
week-old twy/twy mice (Fig. 3D). Figure 3E shows the antigen
expression ratio of M1 phenotype (CD11b-positive cells co-
expressing iNOS or CD16/32)/M2 phenotype (CD11b-positive
cells co-expressing arginase-1 or CD206) using immunofluores-
cence staining. The percentage of microglia/macrophages that
was of M2 phenotype was 82.0% in 18-week-old and 61.6% in 24-
week-old twy/twy mice with a concomitant increase in the
percentage of microglia/macrophages that were of M1 phenotype.
To further determine the activity of CD11b-positive cells in the
chronically compressed spinal cords, the profile of the CD11b-
positive cells was analyzed by flow cytometry (Fig. 4). Of the
250,000 spinal cord cells, 10.460.7% (26,04161,794 cells) was
CD11b positive. The immunoprofile of CD11b-positive cells shifted
from CD11bhigh/CD45low/GR-1negative cells (resting microglia) to
CD11bhigh/CD45 high/GR-1negative cells (activated microglia/
macrophages) with the advancement of spinal cord compression
(Figs. 4A–C). While almost all CD11b-positive cells were resting
microglia in control ICR mice (with the same results seen in each
age group; Fig. S2A) and in 12-week twy/twy mice, the population
of activated microglia/macrophages increased significantly in the
18- and 24-week twy/twy mice (Figs. 4D and E).
We also determined the subtypes of resting microglia and
activated microglia/macrophages in terms of M1/M2 phenotypic
marker expression (Fig. 5). Of the CD11bhigh/CD45 low/GR-
1negative cells (resting microglia), 10.262.2% (458697 cells) in 12-
week and 73.0616.1% (40176884 cells) in 18-week-old twy/twy
mice were arginase-1 positive, while only a few were iNOS positive,
CD16/32 positive or CD206 positive. The number of arginase-1positive resting microglia in samples from control ICR mice of each
age group were the same as in 12-week-old twy/twy mice (Fig. S3).
Of the CD11bhigh/CD45 high/GR-1negative cells (activated mi-
croglia/macrophages), 5.161.1% (5316112 cells) were iNOSpositive, 7.661.5% (7886156 cells) were arginase-1 positive,
23.765.2% (25776564 cells) were CD16/32 positive and
56.3612.5% (612361358 cells) were CD206 positive in the 18
week twy/twy mice (Fig. 5B). In the activated microglia/
macrophages in the 24-week twy/twy mice, 30.961.4%
(32056150 cells), 44.268.9% (45786925 cells), 43.669.3%
(485161032 cells), and 48.9611.0% (544261223 cells) were
iNOS positive, arginase-1 positive, CD16/32 positive and CD206positive, respectively (Fig. 5C). These results indicated that the
prevalence of microglia/macrophages of M2 phenotype (arginase-
1 and CD206) remained dominant compared to that of the M1
phenotype (iNOS and CD16/32), despite the advancement of
spinal cord compression, in agreement with the results of
immunostaining. In some of these dot plots, a proportion of
microglia/macrophages were double positive to M1 (CD16/32)
and M2 (CD206) phenotypic markers (,15%).
M2 Microglia/Macrophages are a Source of NeurotrophicFactors in the Chronically Compressed Spinal CordTo evaluate the expression of neurotrophic factors and
phagocytic activity in correlation with M1 and M2 phenotypes,
double immunofluorescence staining for BDNF, NGF, and Mac-2
with either iNOS or arginase-1 was performed. Double-positive
cells were found particularly in the anterior horn and anterior
column. In 12-week twy/twy mice, some expression of BDNF,
NGF and no expression of Mac-2 was found (Fig. 6A): those
expressions were also noted in 18-week-old twy/twy mice (Fig. 6B)
and their intensity reached peak levels in 24-week-old twy/twymice
Figure 1. Histological and imaging evidence of progressive cervical spinal compression in twy/twy mice. Microphotographs ofhematoxylin and eosin (H&E)-stained sagittal (A) and transaxial (B–D) sections, and computed tomography (CT) scans (E, F) of the cervical spine of 12-(B), 18- (C) and 24-week-old twy/twymice (A, D, E, F). Calcified lesions originating from the atlantoaxial membrane increased in size progressively withage, compressing the lateral and dorsal aspects of the spinal cord between C2 and C3 segments (*) calcified lesions. A spinal canal transverse area onCT at thoracic (Th) 1 level and the site of compression of a 24-week-old twy/twymouse is surrounded by white dotted line in (E, F). The relative spinalcanal and spinal cord transverse area was shown compared with that of Th1 vertebral level assessed by CT and H&E staining (G). The spinal canal andspinal cord transverse area decreased with advancing age. Scale bars = 500 mm (A); 200 mm (B–D). **p,0.01 (n = 3 for each time point).doi:10.1371/journal.pone.0064528.g001
Activated Microglia in Spinal Cord Compression
PLOS ONE | www.plosone.org 5 May 2013 | Volume 8 | Issue 5 | e64528
(Fig. 6C). Some neurotrophic factors and Mac-2 colocalized with
arginase-1- or CD206-positive cells, whereas they did not with
iNOS- or CD16/32-positive cells (Fig. 6). These results indicate
that the M2 phenotype, but not the M1 phenotype, is a source of
neurotrophic factors.
Helper T Cells, but not Neutrophils, Infiltrate theChronically Compressed Spinal CordTo evaluate the infiltration of neutrophils and helper T cells in
the chronically compressed spinal cord, tissues were stained for
MPO and CD4. No MPO-positive cells and very small amount of
MPO activity were detected irrespective of the degree of spinal
cord compression (Fig. S4), while the area of CD4-positive
increased with advancement of spinal cord compression; especially
in the gray matter of 18-week-old twy/twy mice (Figs. 7A–F). Few
positive cells were seen in each age group of the control ICR mice
and in 12-week-old twy/twy mice (Fig. S1C).
Increased Expression of Th2 Cytokines and NeurotrophicFactors in Chronically Compressed Spinal CordWestern blotting was performed to evaluate the correlation
between the severity of spinal cord compression and IFN-c,TNF-a, IL-6, IL-4, IL-10, IL-13, BDNF, NGF, and Mac-2
protein levels (Fig. 8). IFN-c (28 kDa band) was weakly
expressed and its expression level did not change with age.
The intensities of the bands of TNF-a (19 kDa band) and IL-6
(26 kDa band) increased with worsening of spinal cord
compression (Fig. 8A). The intensities of the bands for IL-4
(18 kDa band), IL-10 (37 kDa band), and IL-13 (13 kDa band)
reached peak levels in 18-week twy/twy mice, but somewhat
decreased in 24-week twy/twy mice (Fig. 8B). The expression of
these proteins in control ICR mice (with the same results seen
in samples of different age groups; Fig. S2B) was the same as
that seen in 12-week twy/twy mice. These results indicate
increased Th1 cytokine expression reflects worsening of spinal
cord compression, whereas increased Th2 cytokine expression
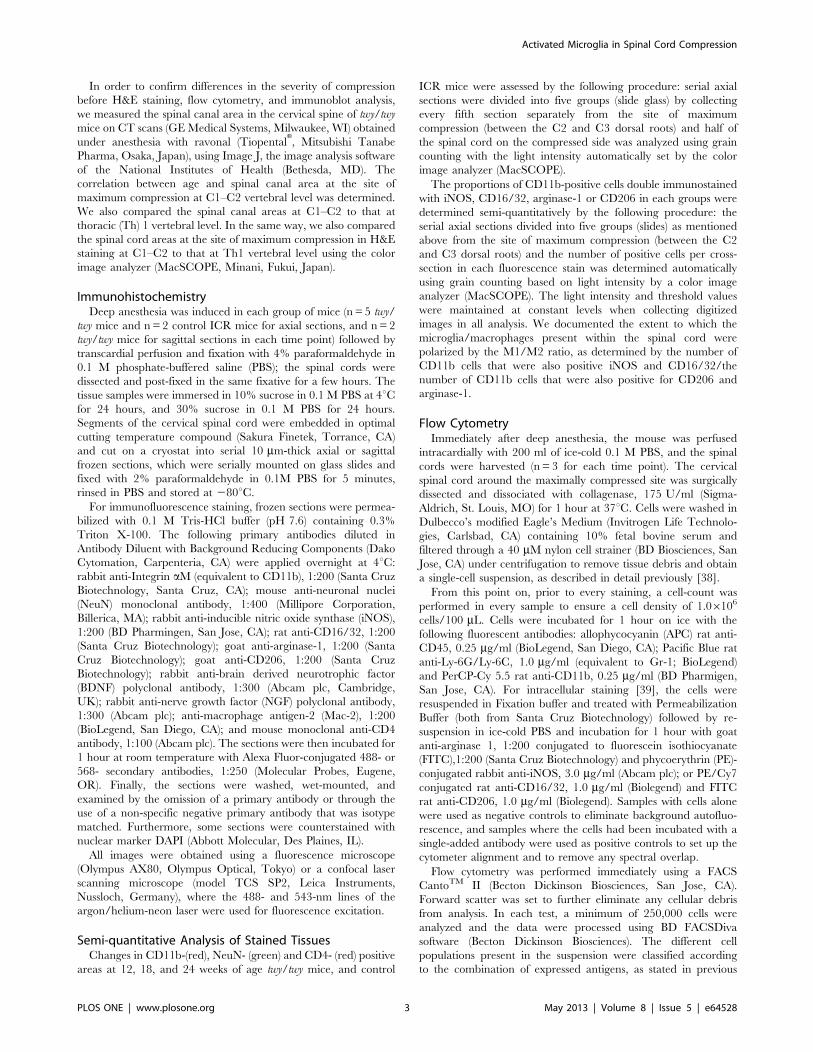
Figure 2. Increased prevalence of activated microglia/macrophages after spinal cord compression correlates to neuronal changesin twy/twy mice. Immunofluorescence staining for the expression of CD11b (red) and NeuN (green) in 12- (B–C), 18- (A, E–G) and 24-week-old (H–J)twy/twymice. In sagittal sections of the spinal cords of 18-week-old twy/twymice, CD11b-positive cells were distributed mainly in the sites of maximalcompression site, compared with those sites that were rostral or caudal to the cord compression (A). The CD11b-positive area increased with theworsening of spinal cord compression, both in the gray and white matter, especially in the anterior horn (C, F, I) and anterior/lateral column (D, G, J).The NeuN-positive area of mainly the gray matter was especially lower in 24-week-old twy/twy mice (K). Scale bars = 500 mm (A, B, E, H); 50 mm (C, D,F, G, I, J). *p,0.05, **p,0.01 (n = 5 for each time point). AH: anterior horn, PH: posterior horn, AC: anterior column, LC: lateral column, PC: posteriorcolumn. A–J microphotographs were taken using confocal laser scanning microscope.doi:10.1371/journal.pone.0064528.g002
Activated Microglia in Spinal Cord Compression
PLOS ONE | www.plosone.org 6 May 2013 | Volume 8 | Issue 5 | e64528

seems to reflect changes in the population of activated
microglia. On the other hand, the intensities of the bands for
BDNF and NGF, as well as Mac-2, increased significantly with
advancement of spinal cord compression (Figs. 8C and D).
Discussion
We reported in the present study that chronic progressive
compression of the cervical spinal cord due to a calcified lesion of
the atlantoaxial membrane at C1–C2 in the twy/twy mouse caused
neuronal loss, as indicated by NeuN-positive cells, an increase in
CD11b-positive cells in both the grey matter and white matter,
Figure 3. The prevalence of phenotypically activated microglia/macrophages in association with increased severity of spinal cordcompression in twy/twy mice. Immunofluorescence staining for the expression of iNOS and CD16/32 (green) for classically activated microglia/macrophages (M1 phenotype) and arginase-1 and CD206 (green) for alternatively activated microglia/macrophages (M2 phenotype) co-localized withCD11b (red) in the anterior column of 12- (A), 18- (B) and 24-week-old (C) twy/twy mice. The numbers of CD11b-, CD11b/iNOS- and CD11b/CD16/32-positive cells (arrow heads) increased with the worsening of spinal cord compression. The CD11b/arginase-1- and CD11b/CD206-expressing cells(arrow heads) were the predominant population. The differences between iNOS, CD16/32 and arginase-1, CD206 were statistically significant in 18-and 24-week-old twy/twy mice. In control ICR mice, the expression of these factors was same as in 12-week-old twy/twy mice (D). The M1/M2 antigenexpression ratio was higher in 24-week twy/twy mice compared with younger mice and control mice (E). Scale bars = 50 mm (A–C). Data aremean6SD. *p,0.05 (n = 5 for each time point). A–C microphotographs were taken using confocal laser scanning microscope.doi:10.1371/journal.pone.0064528.g003
Activated Microglia in Spinal Cord Compression
PLOS ONE | www.plosone.org 7 May 2013 | Volume 8 | Issue 5 | e64528

and infiltration of CD 4-positive cells in the grey matter as well as
few MPO positive cells and the activity, with these changes seen at
the site of the compression. The following are the main findings: 1)
the number of CD11b positive microglia/macrophages increased
with the severity of spinal cord compression; 2) there was a shift in
the polarity of M1 and M2 cells present, with the prevalence of
M1 cells increasing with the severity of spinal cord compression; 3)
the number of resting microglia decreased in proportion with
increases in activated microglia/macrophages; 4) arginase-1-
positive cells, but not iNOS-positive cells, expressed neurotrophic
factors (BDNF, NGF) and higher Mac-2 immunoreactivity; 5) an
increase in Th1 cytokines increased with the severity of spinal cord
compression, while an increase in Th2 cytokines was observed
concurrently with changes in presence of the activated microglia
population.
Several groups have characterized the pathological features of
chronic spinal cord compression of patients with CSM and OPLL
[5–7] or of the animal model of spinal cord compression seen in
the twy/twy mouse [8,9,33–37]. Significant similarities in histo-
pathological and pathophysiological changes have been described
in chronic progressive spinal cord compression and traumatic SCI.
These similarities include a decrease in the neuronal population
with degeneration and demyelination followed by a cascade of
‘‘secondary’’ injury [2]. Activated microglia, derived from resting
microglia, and recruited macrophages from the peripheral
circulation are among the main effector cells of the inflammatory
response that follows SCI, and are associated with the production
of proinflammatory cytokines and related immune effector
molecules that can induce both necrotic and programmed cell
death, which correlate with neurological deficit [10,11,16].
Activation of microglia after SCI is evident on day one, and the
number of activated microglia has been shown to increase during
the first 7 days and then plateau, 2–4 weeks after injury; with small
differences related to the animal strain being used as a model [13].
The present results demonstrated a decrease in the NeuN-positive
area in the anterior horn opposite the posterior compression and
posterior horn and an increase in the CD11b-positive area,
especially in the anterior horn and anterior column; these changes
were in proportion with the degree of spinal cord compression. In
our previous studies, we observed a significant reduction in the
Figure 4. The resting microglia population decreased in association with increased severity of spinal cord compression in twy/twymice. Semi-quantitative flow cytometric analysis of resting microglia and activated microglia/macrophages in the CD11b positive cells (10.460.7% ofthe spinal cord cells) according to the degree of spinal cord compression. Representative data for 12- (A), 18- (B) and 24-week-old (C) twy/twy mice.CD11bhigh cells in the spinal cord were sub-fractioned into a CD45low/GR-1negative population, identifying them as resting microglia; or CD45high/GR-1negative population, which identified them as activated microglia/macrophages. The numbers of resting microglia (CD11bhigh/CD45low/GR-1negative
cells) were significantly lower in 24-week-old mice (D), while the numbers of activated microglia/macrophages (CD11bhigh/CD45 high/GR-1negative cells)were higher in 18- and 24-week-old twy/twy mice (E). The number of resting microglia and activated microglia/macrophages in control ICR mice wassame as in 12-week-old twy/twy mice (D, E). Data are mean6SD. **p,0.01 (n = 3 for each time point).doi:10.1371/journal.pone.0064528.g004
Activated Microglia in Spinal Cord Compression
PLOS ONE | www.plosone.org 8 May 2013 | Volume 8 | Issue 5 | e64528

Figure 5. Expression of the M1 phenotype in activated microglia/macrophages correlated to increased severity of spinal cordcompression in twy/twy mice. Semi-quantitative flow cytometric analysis of iNOS, CD16/32, arginase-1, and CD206 in activated microglia/macrophages. Representative data for 12- (A), 18- (B), and 24- (C) week-old twy/twy mice. The number of iNOS positive and CD16/32 positive activatedmicroglia/macrophages increased with the worsening of spinal cord compression. Arginase-1 positive and CD206 positive cell populations were thepredominant in cells present 18- and 24-week-old twy/twy mice (D). Data are mean6SD. **p,0.01 (n = 3 for each time point).doi:10.1371/journal.pone.0064528.g005
Activated Microglia in Spinal Cord Compression
PLOS ONE | www.plosone.org 9 May 2013 | Volume 8 | Issue 5 | e64528

number of remaining surviving neurons when the transverse
remnant area of the spinal cord of the twy/twy mouse spinal cord
decreased to #70% of the control (+/twy mice) [33], and further
that the extent of demyelination and Wallerian degeneration in the
white matter increased proportionately with the magnitude of
spinal cord compression [35]. We also reported a significant
increase in TUNEL-positive cells in the anterior horn and also
glial cells in the white matter, in spinal cord segments located
rostral and caudal to the segment with maximal compression [8].
It is well-known that activated microglia/macrophages secrete
cytotoxic substances including various cytokines (e.g., TNF-a, IL-1and -6), reactive free radicals, and nitric oxide. In addition, the
major role of microglia at the lesion centre is probably rapid
phagocytosis of debris [25,40]. Our results suggest that neuronal
loss through the mechanisms of necrosis and apoptosis is
associated with activation of microglia/macrophages, production
of proinflammatory cytokines by these cells, and putative
phagocytosis, which may also be associated with axonal demye-
lination in the twy/twy spinal cord. This chain of events is
somewhat similar to the delayed apoptosis of oligodendrocytes
following activation of microglia after SCI [41].
As part of the response to chronic and progressive spinal cord
compression, the present results showed high numbers of CD11b-
positive cells, representing resting and activated microglia, as well
as recruited macrophages, at different stages of microglia/
macrophages activation and polarization [29]. The proportion of
both M1 and M2 microglia/macrophages increased with the
severity of spinal cord compression with abundant cells appearing
as the M2 phenotype at 24 weeks in twy/twy mice. Furthermore,
the results also showed increased M1/M2 antigen expression rate,
a ratio known to correlate with CNS damage and repair [22]. M2
microglia/macrophages seem to promote neuroprotection, neu-
rogenesis, and repair even in severely compressed spinal cord. On
the other hand, further progression of the spinal cord compression
may have resulted in the induction of CD11b -positive cells into
the M1 phenotype, which is known for its deleterious effects [27].
We reported previously the presence of axonal and dendritic
outgrowth, which were induced by overexpression of neurotrophic
factors at the site of compression in the twy/twy mice spinal cord
[36]. Immunostaining in the present study demonstrated high co-
expression of neurotrophic factors in M2 phenotype macrophages
as well as increased expression of Mac-2, which reflects enhanced
phagocytic activity [40,42]. These changes possibly represent the
spinal cord response to chronic progressive spinal cord compres-
sion in order to maintain neuronal function [28,36].
The results of flow cytometry provided further details on the
phenotypes of the involved cells, where resting microglia mainly
expressed M2 markers, as described previously by other groups
[17,32]. Our data confirmed that resting microglia are also the
source of activated microglia/macrophages, since the population
of resident microglia decreased while that of the activated
microglia/macrophages increased in response to severity of spinal
mechanical compression. In addition, the phenotypic changes in
activated microglia/macrophages showed dynamic behavior with
important M2 phenotype populations in 18- and 24-week-old twy/
twy mice and further increase in the M1 phenotype at 24 weeks,
probably reflecting worsening of chronic spinal cord compression.
The results related to the serial changes in the expression levels of
phenotypic markers in activated microglia deserve special atten-
tion. It has already been documented both in vitro and in vivo that
resting microglia possesses the M2 phenotype and are the only
neural cells that express arginase-1 [26,32]. However, after their
activation, these cells express different markers in a time-related
manner. For example, arginase-1 is a well-documented early
marker expressed in those cells that undergo the alternative
pathway of activation to acquire the M2 macrophage phenotype,
Figure 6. Expression of brain-derived neurotrophic factor (BDNF), nerve growth factor (NGF) and macrophage antigen (Mac)-2correlated to the phenotype of activated microglia/macrophages and increased spinal cord compression in twy/twy mice.Immunofluorescence staining for the expression of BDNF, NGF, and Mac-2 (red) colocalized with iNOS and arginase-1 (green) in the anterior columnof 12- (A), 18- (B) and 24-week-old (C) twy/twy mice (n = 5 for each time point). The expression levels of neurotrophic factors and Mac-2-positive cellsincreased with the worsening of spinal cord compression. Neurotrophic factor and Mac-2 colocalized with arginase-1- and CD206-positive cells (arrowheads), but not with iNOS- and CD16/32-positive cells. Scale bars = 50 mm. A–C microphotographs were taken using confocal laser scanningmicroscope.doi:10.1371/journal.pone.0064528.g006
Activated Microglia in Spinal Cord Compression
PLOS ONE | www.plosone.org 10 May 2013 | Volume 8 | Issue 5 | e64528

whereas iNOS is a marker of cells activated through the classical
pathway, changing into M1 activated macrophages [22]. As the
activation process advances, the fully mature activated cells
express CD16/32 and CD206, which are phenotypic hallmarks
of M1 and M2 macrophages, respectively [17,28]. Our immuno-
histochemical and flow cytometric data showed a similar behavior
where the expression of such phenotypic markers increased with
time, representing completion of the macrophage activation
process. CD206 is an endocytic receptor that recognizes glyco-
protein for antigen processing and presentation and is widely used
to identify the M2 phenotype [26]. Our results showed that the
expression of iNOS and arginase-1 persisted and increased with
time; possibly related to the persistence of the insult triggering
microglial/macrophages activation, since these markers mainly
reflect the early stages of activation [22].
Cells that were double immunopositive for M1 and M2
phenotypic markers were seen locally within the spinal cord,
which is highly suggestive of microglia/macrophages undergoing
phenotype change due to environmental influences created by the
cervical compression. Polarization of the microglia/macrophages
requires an active response in the form of inflammatory cytokines,
other immune effector molecules and neurotrophic factors
released from the cells in the injured tissue as well as from
different cells recruited to the site of the primary insult [27]. The
sources of these cytokines remain controversial. Astrocytes seem to
be the main source of TNF-a since they are the most abundant cell
type after SCI capable of producing this cytokine [43]. Previous
studies indicated that the main source of IFN-c is blood-derived
cells recruited to the site of injury (macrophages, natural killer
cells, neutrophils and helper T cells) through the inflammatory
process mediated by some ILs [44,45]. Some of these recruited
cells can produce Th2 cytokines, but the main source of IL-4 and
IL-13 seems to be microglia [46,47]. However, the pathophysi-
ology of chronic spinal cord compression in the twy/twy mouse
spinal cord could include a limited blood cell access into the
injured spinal cord, and there is no evidence of the destruction of
the blood spinal cord barrier [33,35,37], thus limiting the
infiltration of helper T cells and neutrophils. Under such
circumstances, the expression of IFN-c is expected to be weak
and TNF-a becomes the most important Th1 cytokine responsible
for macrophage activation. The preserved blood spinal cord
barrier would also limit the supply of Th2 cytokines; leaving
resting and activated microglia at the injury site as the main source
of Th2 cytokines for alternative activation of microglia/macro-
phages [46,47]. While there is no evidence to our knowledge of
disruption of the blood spinal cord barrier in the twy/twy mouse to
Figure 7. The prevalence of CD4-positive cells in the spinal cord of twy/twy mice. Immunostaining of infiltrating helper T cells increasedwith the worsening of spinal cord compression, especially in 18-week-old twy/twy mice (A–E). Panel (C) and (E) are high-power photographs of theanterior horn (boxed area). (F) CD4-positive area in control ICR, 12-, 18-, and 24-week-old twy/twy mice. Scale bar = 500 mm (A, B, D); 200 mm (C, E).Data are mean6SD. **p,0.01 (n = 3 for each time point).doi:10.1371/journal.pone.0064528.g007
Activated Microglia in Spinal Cord Compression
PLOS ONE | www.plosone.org 11 May 2013 | Volume 8 | Issue 5 | e64528

date, future research may prove otherwise. For analysis of this
aspect, special twy/twy background chimeric mice models would
be required [42], which are not currently commercially available;
therefore, the possibility of cytokines deriving from blood and
having an important role in determining inflammatory and
immunomodulatory activity within the spinal cord remains as a
possible limitation of our animal model. Our immunoblot results
provided insight on the polarization process; the expression of Th2
cytokines increased from 18 weeks in possible correlation with the
enlarged activated microglia population. The transient increase of
Th2 cytokines explains our findings of M2 phenotype being the
predominant type of activated cell; which would also explain the
enhanced expression of neurotrophic factors and Mac-2
[19,26,29]. The present results also demonstrated increased
expression of Th1 cytokines, as reported previously by our group
[8], together with the reported increase in IL-6 expression as part
of the inflammatory process [42,48]. Thus, over-expression of
TNF-a in the twy/twy mice may be the most important Th1
cytokine responsible for M1 macrophage activation [28].
Interestingly, the resultant increase in the neurotropic factors at
the site of spinal cord compression did not reverse the pathological
changes of increased expression of proinflammatory cytokines and
apoptosis of neurons and glia. Accordingly, the only treatment
available at present is the surgical removal of the cause of chronic
spinal cord compression [1–4]. However, surgery is unlikely to
reverse the symptoms in patients with advanced cervical
compressive myelopathy. In such patients, the use of specific
antibodies against Fas ligand to reduce apoptosis of neurons and
oligodendrocytes [7,37], promotion of neuronal regeneration,
through blockade of the inflammatory cascade, and induction of
the M2 phenotype [48] are promising options for combined
medical therapies in future management of this condition.
In conclusion, the present study demonstrated that chronic and
progressive spinal compression induced over-expression of Th1
cytokines (TNF-a, IL-6) and increased the population of classically
activated macrophages (M1 phenotype). These changes could be
responsible, at least in part, for neuronal loss and may also induce
the demyelination of axons found in CSM and OPLL; however,
they could also induce alternative activation by Th2 cytokines (IL-
4, -10, and -13) and increase M2 microglia/macrophages, which
provide neuroprotection and enhanced phagocytic activity. This
work provides the rationale for therapeutic targeting of alternative
activation of microglia/macrophages in human CSM and OPLL.
Supporting Information
Figure S1 Assessment of aging effects in control ICRmice by immunofluorescent staining. (A) Immunofluores-
cence staining for the expression of CD11b (red) and NeuN (green)
in 12-, 18- and 24-week-old ICR mice. (B) Immunofluorescence
staining for the expression of iNOS and CD16/32 (green)
identifying classically activated microglia/macrophages (M1
phenotype) and arginase-1 and CD206 (green) characterizing
alternatively activated microglia/macrophages (M2 phenotype);
co-localized with CD11b (red) in the anterior column of 12-, 18-
and 24-week-old ICR mice. (C) Immunostaining of infiltrating
helper T cells in 12-, 18- and 24-week-old ICR mice. In these
Figure 8. Cytokine expression and phagocytic activity in the twy/twy mouse. Immunoblot analysis of T helper 1 (Th1), T helper 2 (Th2)cytokines, neurotrophic factors and phagocytic activity in control ICR, 12, 18, and 24-week-old twy/twy mice. (A) The expression of IFN-c was notdetected in all age groups, but the expression levels of TNF-a and IL-6 increased significantly with the severity of spinal cord compression. (B) Theexpression levels of Th2 cytokines were highest in 18-week-old and remained significantly elevated in 24-week-old twy/twy mice. (C) The expressionlevels of neurotrophic factors and Mac-2 (D) increased significantly with the severity of spinal cord compression. Each graph shows the relative bandintensity normalized to that of b-actin. Data are mean6SD. *p,0.05 (n = 3 for each time point).doi:10.1371/journal.pone.0064528.g008
Activated Microglia in Spinal Cord Compression
PLOS ONE | www.plosone.org 12 May 2013 | Volume 8 | Issue 5 | e64528

assessments, there were no differences between samples from
different ages. Scale bars = 500 mm (A-upper row, C), 50 mm (A-
lower row, B).
(TIF)
Figure S2 Assessment of aging effect in control ICRmice by flow cytometry and immunoblot analysis. (A)
Semi-quantitative flow cytometric analysis of resting microglia and
activated microglia/macrophages in the CD11b positive cells in 12-,
18- and 24-week-old ICR mice. (B) Immunoblot analysis of T
helper 1 (Th1), T helper 2 (Th2) cytokines, neurotrophic factors
and phagocytic activity in 12-, 18- and 24-week-old ICR mice. In
these assessments, there were no differences between samples from
different ages.
(TIFF)
Figure S3 Characterization of resting microglia popu-lation in spinal cord of twy/twy mice. Semi-quantitative
analysis for iNOS, CD16/32, arginase-1, and CD206 in resting
microglia was performed in flow cytometry. Representative data of
12- (A), 18- (B), and 24- (C) week-old twy/twy mice (n= 3 for each
time point). Arginase-1 positive resting microglia constituted
10.262.2% (458697 cells) and 73.0616.1% (40176884 cells) of
the cells in 12- and 18-week-old mice. The number of arginase-1positive resting microglia in control ICR mice was same as in 12-
week-old twy/twy mice. Only a few iNOS-, CD16/32- and
CD206-positive resting microglia were present in control ICR and
twy/twy mice (D). Data are mean6SD.
(TIF)
Figure S4 Assessment of the neutrophil populations andmyeloperoxidase (MPO) activity in the spinal cord oftwy/twy mice. To examine the presence of neutrophils in the
compressed spinal cord, we examined the presence of MPO by
immunohistochemistry and by assay for MPO activity. MPO
immunostaining demonstrated the lack of infiltration of neutro-
phils (A–C), whereas biochemical assay indicated a very small
amount of MPO activity (D) irrespective of the severity of the
spinal cord compression (n= 3 for each time point). Scale
bars = 500 mm. Data are mean6SD.
(TIF)
Table S1 This table shows experimental groups used in the
present study.
(DOCX)
Acknowledgments
The authors thank Mr. Hitoshi Takagi and Mrs. Junko Yamamoto
belonging to Life Science Research Laboratory, University of Fukui,
Division of Bioresearch for advice with respect to the confocal microscopy
and flow cytometry experiments.
Author Contributions
Conceived and designed the experiments: KU HN HB. Performed the
experiments: TH ARG NT SW DS AY. Analyzed the data: TH KU HN
NT. Contributed reagents/materials/analysis tools: TH HN ARG NT SW
DS AY. Wrote the paper: TH KU HN ARG WEBJ HB.
References
1. Bohlman HH, Emery SE (1988) The pathophysiology of cervical spondylosis
and myelopathy. Spine 13: 843–846.
2. Fehlings MG, Skaf G (1988) A review of the pathophysiology of cervical
spondylotic myelopathy with insights for potential novel mechanisms drawn
from traumatic spinal cord injury. Spine 23: 2730–2737.
3. Matsunaga S, Nakamura K, Seichi A, Yokoyama T, Toh S, et al. (2008)
Radiographic predictors for the development of myelopathy in patients with
ossification of the posterior longitudinal ligament: a multicenter cohort study.
Spine 33: 2648–2650.
4. McCormack BM, Weinstein PR (1996) Cervical spondylosis. An update.
West J Med 165: 43–51.
5. Kameyama T, Hashizume Y, Ando T, Takahashi A, Yanagi T, et al. (1995)
Spinal cord morphology and pathology in ossification of the posterior
longitudinal ligament. Brain 118: 263–278.
6. Mizuno J, Nakagawa H, Chang HS, Hashizume Y (2005) Postmortem study of
the spinal cord showing snake-eyes appearance due to damage by ossification of
the posterior longitudinal ligament and kyphotic deformity. Spinal Cord 43:
503–507.
7. Yu WR, Liu T, Kiehl TR, Fehlings MG (2011) Human neuropathological and
animal model evidence supporting a role for Fas-mediated apoptosis and
inflammation in cervical spondylotic myelopathy. Brain 134: 1277–1292.
8. Inukai T, Uchida K, Nakajima H, Yayama T, Kobayashi S, et al. (2009) Tumor
necrosis factor-alpha and its receptors contribute to apoptosis of oligodendro-
cytes in the spinal cord of spinal hyperostotic mouse (twy/twy) sustaining chronic
mechanical compression. Spine 34: 2848–2857.
9. Uchida K, Nakajima H, Watanabe S, Yayama T, Guerrero AR, et al. (2012)
Apoptosis of neurons and oligodendrocytes in the spinal cord of spinal
hyperostotic mouse (twy/twy): possible pathomechanism of human cervical
compressive myelopathy. Eur Spine J 21: 490–497.
10. Hausmann ON (2003) Post-traumatic inflammation following spinal cord injury.
Spinal Cord 41: 369–378.
11. Jones TB, McDaniel EE, Popovich PG (2005) Inflammatory-mediated injury
and repair in the traumatically injured spinal cord. Curr Pharm Des 11: 1223–
1236.
12. Pineau I, Sun L, Bastien D, Lacroix S (2010) Astrocytes initiate inflammation in
the injured mouse spinal cord by promoting the entry of neutrophils and
inflammatory monocytes in an IL-1 receptor/MyD88-dependent fashion. Brain
Behav Immun 24: 540–553.
13. Popovich PG, Wei P, Stokes BT (1997) Cellular inflammatory response after
spinal cord injury in Sprague-Dawley and Lewis rats. J Comp Neurol 377: 443–
464.
14. Beattie MS, Hermann GE, Rogers RC, Bresnahan JC (2002) Cell death in
models of spinal cord injury. Prog Brain Res 137: 37–47.
15. Crowe MJ, Bresnahan JC, Shuman SL, Masters JN, Beattie MS (1997)
Apoptosis and delayed degeneration after spinal cord injury in rats and monkeys.
Nat Med 3: 73–76.
16. Popovich PG, Guan Z, McGaughy V, Fisher L, Hickey WF, et al. (2002) The
neuropathological and behavioral consequences of intraspinal microglial/
macrophage activation. J Neuropathol Exp Neurol 61: 623–633.
17. Perego C, Fumagalli S, De Simoni MG (2011) Temporal pattern of expression
and colocalization of microglia/macrophage phenotype markers following brain
ischemic injury in mice. J Neuroinflammation 8: 174.
18. Glass CK, Saijo K, Winner B, Marchetto MC, Gage FH (2010) Mechanisms
underlying inflammation in neurodegeneration. Cell 140: 918–934.
19. Bomstein Y, Marder JB, Vitner K, Smirnov I, Lisaey G, et al. (2003) Features of
skin-coincubated macrophages that promote recovery from spinal cord injury.
J Neuroimmunol 142: 10–16.
20. Stout RD, Jiang C, Matta B, Tietzel I, Watkins SK, et al. (2005) Macrophages
sequentially change their functional phenotype in response to changes in
microenvironmental influences. J Immunol 175: 342–349.
21. Mantovani A, Sozzani S, Locati M, Allavena P, Sica A (2002) Macrophage
polarization: tumor-associated macrophages as a paradigm for polarized M2
mononuclear phagocytes. Trends Immunol 23: 549–555.
22. Kigerl KA, Gensel JC, Ankeny DP, Alexander JK, Donnelly DJ, et al. (2009)
Identification of two distinct macrophage subsets with divergent effects causing
either neurotoxicity or regeneration in the injured mouse spinal cord. J Neurosci
29: 13435–13444.
23. Schwartz M (2010) ‘‘Tissue-repairing’’ blood-derived macrophages are essential
for healing of the injured spinal cord: From skin-activated macrophages to
infiltrating blood-derived cells? Brain Behav Immun 24: 1054–1057.
24. Wong SC, Puaux AL, Chittezhath M, Shalova I, Kajiji TS, et al. (2010)
Macrophage polarization to a unique phenotype driven by B cells. Eur J Immunol
40: 2296–2307.
25. David S, Kroner A (2011) Repertoire of microglial and macrophage responses
after spinal cord injury. Nat Rev Neurosci 12: 388–399.
26. Gordon S (2003) Alternative activation of macrophages. Nat Rev Immunol 3:
23–35.
27. Laskin DL (2009) Macrophages and inflammatory mediators in chemical
toxicity: a battle of forces. Chem Res Toxicol 22: 1376–1385.
28. Mantovani A, Sica A, Sozzani S, Allavena P, Vecchi A, et al. (2004) The
chemokine system in diverse forms of macrophage activation and polarization.
Trends Immunol 25: 677–686.
29. Gordon S, Martinez FO (2010) Alternative activation of macrophages:
mechanism and functions. Immunity 32: 593–604.
30. Ma J, Chen T, Mandelin J, Ceponis A, Miller NE, et al. (2003) Regulation of
macrophage activation. Cell Mol Life Sci 60: 2334–2346.
Activated Microglia in Spinal Cord Compression
PLOS ONE | www.plosone.org 13 May 2013 | Volume 8 | Issue 5 | e64528

31. Busch SA, Hamilton JA, Horn KP, Cuascut FX, Cutrone R, et al. (2011)
Multipotent adult progenitor cells prevent macrophage-mediated axonal diebackand promote regrowth after spinal cord injury. J Neurosci 31: 944–953.
32. Michelucci A, Heurtaux T, Grandbarbe L, Morga E, Heuschling P (2009)
Characterization of the microglial phenotype under specific pro-inflammatoryand anti-inflammatory conditions: Effects of oligomeric and fibrillar amyloid-
beta. J Neuroimmunol 210: 3–12.33. Baba H, Maezawa Y, Imura S, Kawahara N, Nakahashi K, et al. (1996)
Quantitative analysis of the spinal cord motoneuron under chronic compression:
an experimental observation in the mouse. J Neurol 243: 109–116.34. Okawa A, Nakamura I, Goto S, Moriya H, Nakamura Y, et al. (1998) Mutation
in Npps in a mouse model of ossification of the posterior longitudinal ligament ofthe spine. Nat Genet 19: 271–273.
35. Uchida K, Baba H, Maezawa Y, Furukawa S, Furusawa N, et al. (1998)Histological investigation of spinal cord lesions in the spinal hyperostotic mouse
(twy/twy): morphological changes in anterior horn cells and immunoreactivity to
neurotrophic factors. J Neurol 245: 781–793.36. Uchida K, Baba H, Maezawa Y, Furukawa S, Omiya M, et al. (2003) Increased
expression of neurotrophins and their receptors in the mechanically compressedspinal cord of the spinal hyperostotic mouse (twy/twy). Acta Neuropathol 106:
29–36.
37. Yu WR, Baptiste DC, Liu T, Odrobina E, Stanisz GJ, et al. (2009) Molecularmechanisms of spinal cord dysfunction and cell death in the spinal hyperostotic
mouse: implications for the pathophysiology of human cervical spondyloticmyelopathy. Neurobiol Dis 33: 149–163.
38. Saiwai H, Ohkawa Y, Yamada H, Kumamaru H, Harada A, et al. (2010) TheLTB4-BLT1 axis mediates neutrophil infiltration and secondary injury in
experimental spinal cord injury. Am J Pathol 176: 2352–2366.
39. Stirling DP, Yong VW (2008) Dynamics of the inflammatory response aftermurine spinal cord injury revealed by flow cytometry. J Neurosci Res 86: 1944–
1958.
40. Schilling M, Besselmann M, Muller M, Strecker JK, Ringelstein EB, et al. (2005)
Predominant phagocytic activity of resident microglia over hematogenous
macrophages following transient focal cerebral ischemia: an investigation using
green fluorescent protein transgenic bone marrow chimeric mice. Exp Neurol
196: 290–297.
41. Shuman SL, Bresnahan JC, Beattie MS (1997) Apoptosis of microglia and
oligodendrocytes after spinal cord contusion in rats. J Neurosci Res 50: 798–808.
42. Mukaino M, Nakamura M, Yamada O, Okada S, Morikawa S, et al. (2010)
Anti-IL-6-receptor antibody promotes repair of spinal cord injury by inducing
microglia-dominant inflammation. Exp Neurol 224: 403–414.
43. Pineau I, Lacroix S (2007) Proinflammatory cytokine synthesis in the injured
mouse spinal cord: multiphasic expression pattern and identification of the cell
types involved. J Comp Neurol 500: 267–285.
44. Ethuin F, Gerard B, Benna JE, Boutten A, Gougereot-Pocidalo MA, et al. (2004)
Human neutrophils produce interferon gamma upon stimulation by interleukin-
12. Lab Invest 84: 1363–1371.
45. Suzuki Y, Claflin J, Wang X, Lengi A, Kikuchi T (2005) Microglia and
macrophages as innate producers of interferon-gamma in the brain following
infection with Toxoplasma gondii. Int J Parasitol 35: 83–90.
46. Ponomarev ED, Maresz K, Tan Y, Dittel BN (2007) CNS-derived interleukin-4
is essential for the regulation of autoimmune inflammation and induces a state of
alternative activation in microglial cells. J Neurosci 27: 10714–10721.
47. Shin WH, Lee DY, Park KW, Kim SU, Yang MS, et al. (2004) Microglia
expressing interleukin-13 undergo cell death and contribute to neuronal survival
in vivo. Glia 46: 142–152.
48. Guerrero AR, Uchida K, Nakajima H, Watanabe S, Nakamura M, et al. (2012)
Blockade of interleukin-6 signaling inhibits the classic pathway of macrophage
activation after spinal cord injury in mice. J Neuroinflammation 9: 40.
Activated Microglia in Spinal Cord Compression
PLOS ONE | www.plosone.org 14 May 2013 | Volume 8 | Issue 5 | e64528


![Research Paper Sex specific inflammatory profiles of ......cells, activated by microglia and astrocytes [27, 28]. Pro-inflammatory cytokine contributions to the inflammasome associated](https://img.dokumen.tips/doc/110x75/60f96bbd0ba77f202104e786/research-paper-sex-specific-inflammatory-profiles-of-cells-activated-by.jpg)


![Subanesthetic isoflurane abates ROS-activated MAPK/NF-κB ......cells [9]. OGD-activated microglia upregulate the expression of inflammatory factors via nuclear factor (NF)-κB, the](https://img.dokumen.tips/doc/110x75/60bd0d2bb544f344d8358881/subanesthetic-isoflurane-abates-ros-activated-mapknf-b-cells-9-ogd-activated.jpg)