Embed Size (px)
Citation preview

THE PREVALENCE AND ECONOMIC IMPACT OF POTENTIALLY INAPPROPRIATE
MEDICATION USE IN THE U.S. ELDERLY
by
ZHUO JIANG
(Under the Direction of Matthew Perri III)
ABSTRACT
Objectives: To determine the prevalence of potentially inappropriate medication (PIM) use and
estimate the extra expenditures related to PIM among the U.S. elderly. Methods: Patients over
65 years were taken from the Medical Expenditure Panel Survey through January 2000 to
December 2001. A Retrospective cohort study was conducted. The prevalence of PIM was
evaluated by the 2002 explicit criteria and the expenditures were estimated by employing
multiple regression models and the propensity score method. Results: The prevalence of PIM
among the non-institutionalized elderly in 2000, 2001 and 2-year period were 27.75%, 27.80%
and 35.58%, respectively. The median expenditures attributable to PIM were $1,372 per person
annually. Conclusions: This study found that the prevalence of PIM use among the elderly is
slightly higher than the previous studies and identified significant relationship between the PIM
use and higher total health care expenditures.
INDEX WORDS: Potentially inappropriate medication, The 2002 explicit criteria, Medical
Expenditure Panel Survey

THE PREVALENCE AND ECONOMIC IMPACT OF POTENTIALLY INAPPROPRIATE
MEDICATION USE IN THE U.S. ELDERLY
by
ZHUO JIANG
BMED. Shanghai Second Medical University School of Medicine
Shanghai China, 1995
A Thesis Submitted to the Graduate Faculty of The University of Georgia in Partial Fulfillment
of the Requirements for the Degree
MASTER OF SCIENCE
ATHENS, GEORGIA
2005

© 2005
Zhuo Jiang
All Rights Reserved

THE PREVALENCE AND ECONOMIC IMPACT OF POTENTIALLY INAPPROPRIATE
MEDICATION USE IN THE U.S. ELDERLY
by
ZHUO JIANG
Major Professor: Matthew Perri III
Committee: Jack E. Fincham Jaxk H. Reeves
Electronic Version Approved: Maureen Grasso Dean of the Graduate School The University of Georgia May 2005

iv
TABLE OF CONTENTS
Page
LIST OF TABLES......................................................................................................................... vi
LIST OF FIGURES ...................................................................................................................... vii
CHAPTER
1 Introduction....................................................................................................................1
2 Background ....................................................................................................................3
The Drug Related Problem in the U.S.......................................................................3
The Causes of Drug Related Problems......................................................................4
Drug Related Problems in the Elderly Population ....................................................5
Criteria Measured for Inappropriateness of Prescriptions.........................................5
3 Literature Review...........................................................................................................9
Inappropriate Medication Prescribing for Elderly in the Ambulatory Setting..........9
Inappropriate Medication Prescribing for Elderly in Emergency Departments......11
Inappropriate Medication Prescribing for Elderly in Nursing Homes....................11
Inappropriate Medication Prescribing for the Elderly in Assisted Living
Facilities………………………………………………………………………11
Evaluating the Costs in Potentially Inappropriate Medication Users......................12
4 Research Objectives and Hypotheses ..........................................................................16
5 Methods........................................................................................................................19
Data Sources............................................................................................................19

v
Exclusion and Inclusion Criteria .............................................................................22
Potentially Inappropriate Medication Prescriptions Measures................................23
Expenditure Measures .............................................................................................24
Data Analysis ..........................................................................................................24
Statistical Analyses..................................................................................................29
6 Results..........................................................................................................................31
Results of Prevalence analysis ................................................................................31
Results of Expenditure Analysis .............................................................................32
7 Discussion and Conclusion ..........................................................................................49
Potentially Inappropriate Medication Use in the Elderly........................................49
Strength of the Study...............................................................................................51
Limitations of the Study ..........................................................................................51
Conclusion...............................................................................................................52
REFERENCES ..............................................................................................................................53
APPENDICES ...............................................................................................................................59
A The Beers Inappropriate Medication Usage Criteria in 1991 ......................................60
B Updated Beers Criteria in 1997: Independent of Diagnosis ........................................61
C Changes in 2002 Explicit Criteria according to 1997 Beers Criteria...........................62

vi
LIST OF TABLES
Page
Table 1: Results of Literature Review by Aparasu and Mort (2000) ...........................................14
Table 2: Results of Literature Review by Liu and Christensen (2002) .........................................15
Table 3: Dosage Dependent PIM in the Analysis ..........................................................................23
Table 4: Adapted Charlson Comorbidity Index.............................................................................26
Table 5: Variables in the Multiple Regression Models .................................................................29
Table 6: Variables in the Logistic Regression Models ..................................................................30
Table 7: Distribution of PIM Use in 2000 .....................................................................................33
Table 8: Distribution of PIM Use in 2001 .....................................................................................35
Table 9: Distribution of PIM Use in MEPS Panel 5......................................................................37
Table 10: Bivariate Comparisons of Dependent Variables between the Patients Prescribed and
not Prescribed PIM........................................................................................................40
Table 11: Bivariate Comparisons of Independent Variables between the Patients Prescribed and
not Prescribed PIM........................................................................................................40
Table 12: The Results of the Multiple Regression Models............................................................43
Table 13: The Results of the Logistic Regression Models ............................................................46
Table 14: Comparisons for Covariances after Simple Matching Method .....................................48

vii
LIST OF FIGURES
Page
Figure 1: MEPS Time Frame of Year 2000 and 2001 ..................................................................21
Figure 2: The Composition of Expenditure Study ........................................................................23

1
CHAPTER ONE
INTRODUCTION
Drug related problems (DRPs) in the elderly have been a major health care safety concern
due to the increasing number of people in this population (Ferguson JA. 1990) Persons 65 years
or older constitute less than 15% of the US population but consume nearly one third of all
prescription medications in the United States (Arnett RH III et al 1990, Rahtore et al 1998,
Soumerai et al 1999). Since older people have a greater likelihood of having more than one
chronic disease, they tend to take more medications concurrently than other age groups (Hanlon
JT et al 2001). Additionally, the elderly population is more likely to have a prolonged drug half-
life time and reduced capability of metabolizing drug products, which can result in the
potentially increased drug toxicity and adverse drug events (ADEs) (Montamat et al 1989,
Mahoney et al 1991).
The report by the Institute of Medicine indicated that DRPs in inpatient care alone are
responsible for about 44,000 to 98,000 deaths each year (Kohn et al 2000). A 1997 study
(Bootman and Johnson) estimated that the annual cost due to drug related morbidity and
mortality for patients in nursing facilities is $7.6 billion, where others estimated that $76.6
billion for ambulatory care and $5.6 billion for hospitals (Johnson and Bootman 1995, Bates et al
1997).
Previous research has suggested that inappropriate medication use in the elderly is one of
the primary risk factors of DRPs (Lindley et al 1992). The most widely used approach that can
be used to assess the appropriateness of drugs prescribed for the elderly was Beers criteria. It was

2
first developed by Beers and colleagues for nursing home residents in 1991(Beers et al 1991).
Inappropriate medication use was defined as those drugs pose more risks than benefits to the
elderly. In 1997, Beers updated the criteria to make them more applicable to the general elderly
population (Beers 1997). In 2002, Fick and colleagues updated and revised the 1997 Beers
criteria by adding new information for both existing and newer drug agents (Fick et al 2003).
Although a number of studies have been done to examine the prevalence and potential
risk factors for inappropriateness of prescriptions in the elderly (Aparasu RR et al 2000, Liu GG
et al 2002), no study has been done using the 2002 explicit criteria. Most of the latest published
research used data before 2000 (Caterino et al 2004, Lau et al 2004, Aparasu et al 2004). Recent
studies estimated the economic impact of DRPs in different settings (Bootman et al 1997,
Johnson et al 1995, Bates et al 1997), but no study has been done to estimate expenditures
attributable to inappropriate medication use for the non-institutionalized elderly.
This study will determine the prevalence of inappropriate medication use among the non-
institutionalized elderly population with the latest Medical Expenditure Panel Survey (MEPS)
from 2000 to 2001 with the updated 2002 explicit criteria (Fick et al 2003). Secondly, the current
study will estimate the different health expenditures between elderly patients who use potentially
inappropriate medication and those who don’t.

3
CHAPTER TWO
BACKGROUND
The drug related problem in the U.S.
When medications are prescribed to patients for treatment of disease, optimal therapeutic
outcomes are always desired by patients and healthcare providers. With the advent of modern
drug therapy, pharmacotherapy has brought benefits to all ages, including the elderly population.
However, if patient outcomes are not optimal, a drug related problem (DRP) has occurred.
A DRP is defined as an event or circumstance involving a patient’s drug treatment that
actually or potentially interferes with the achievement of an optimal outcome (ASHP statement
on pharmaceutical care). Strand et al (1990) identified 8 categories of DRP: untreated indication,
improper drug selection, subtherapeutic dosage, failure to receive drugs (including patients
noncompliance), over dosage, adverse drug reaction, drug interaction, and drugs used without an
indication. Although many DRPs are preventable with appropriate prescribing, patient
compliance or outpatient monitoring, there is considerable literature demonstrating that DRPs
result in adverse outcomes and contribute to high rates of morbidity and mortality.
Lazarou et al (1998) estimated that in 1994 more than 1 million Americans were
hospitalized because of adverse drug events accounting for 4.7% of all admissions. Another
meta-analysis reported that data retrieved from eight retrospective and four prospective trials
indicated that as many as 28% of all emergency department visits were drug related, of these, as
many as 24% resulted in hospital admission (Patel et al, 2002). There is also some evidence that
adverse DRPs occur more frequently among inpatients. Bates et al (1995) reported that during a

4
6-month period, 247 adverse drug reactions and 194 potential adverse drug reactions were
identified in the medical and surgical units of two hospitals. This study showed that 6.5% of
hospitalized patients had an adverse drug event. In a nursing home facility, during a four year
period, Cooper (1999) showed that one in seven patients experienced adverse drug reactions led
to hospitalization.
DRPs not only lead to a serious negative health outcomes, but also present a serious
economic problem to society. As previously noted, one report from the Institute of Medicine
estimates that DRPs may cause between 44,000 and 98,000 deaths annually in hospitals in the
US, and cost $8 billion annually(Kohn et al, 2000). Using a cost-of-illness model, Johnson and
Bootman (1995) estimated that drug-related morbidity and mortality in the ambulatory setting in
the US cost $76.6 billion per year and this cost exceeded prescription pharmaceutical use ($73
billion) while Perry and colleagues (2000) estimated that DRPs may result in 106,000 deaths and
cost $85 billion annually. In their 1997 study, Bootman and colleagues estimated that the cost of
drug related morbidity and mortality was $7.6 billion annually in nursing facilities, while Bates
et al (1997) projected $5.6 billion for hospitals related to DRPs.
The causes of drug related problems
From the time a drug is prescribed to the time it is taken, there are many possible
interrelated occurrences, which can lead to a DRP. Thus, the causes of DRPs may be
multifactorial, such as inappropriate prescription, dispensing errors, patient noncompliance,
idiosyncrasy of patients, and the lack of monitoring (Hepler et al 1990), among which
inappropriate medication use is the principal cause attributable to DRPs (Lindley et al 1992).
The previous studies demonstrated that between 56% and 72% of DRPs could be due to
prescribing errors by physician (Lindley et al 1992, Bates et al 1993, Bates et al 1995). Bates and

5
colleagues (1999) found many DRPs also occurred at the monitoring stage by nursing personnel.
Senst and colleagues (2001) found that patient noncompliance was the cause of the 69% of the
ADES causing hospital admission. Dennehy and colleagues (1996) reported that 58% of DRPs in
patients visiting one hospital’s emergency department were caused by noncompliance. Col and
colleagues (1990) estimated that up to 17% of all elderly patients admitted to a hospital resulted
from ADEs were related to noncompliance.
Drug related problems in the elderly population
Frail older people are more likely to experience multiple acute and chronic diseases.
Martin (2000) showed that the use of prescription and over-the-count (OTC) medications
increased with age. In the US, patients older than age 65, who comprise less than 15% of the
population, receive 30% of all prescriptions. Since body compositions change substantially with
age, especially decreased liver and kidney function, elderly persons do not eliminate drugs from
their bodies as efficiently as younger persons. Therefore, the elderly are more likely to
experience DRPs.
Criteria measured for inappropriateness of prescribing
Inappropriate prescribing is one of the primary risk factors of DRPs especially in the
elderly population (Lindley et al 1992). Although many studies have been done to examine
inappropriate drug use in the elderly in the past, there were no uniform criteria defining
inappropriate drug use, which made it difficult to compare results across studies (Beers et al
1991). In response, Beers and colleagues (1991) developed the first set of criteria to measure the
inappropriate prescription medication use in nursing home residents. This list provided an
approach for researchers to quantitatively examine and compare the extent of inappropriate
medication use across studies. In the Beers criteria, inappropriate medications are defined as

6
those drugs which pose more risks than benefits to the elderly. Based on the consensus opinions
of thirteen nationally recognized experts in psychopharmacology, pharmacoepidemiology,
clinical geriatric pharmacology, general clinical geriatrics and long–term care, the criteria
identified two types of inappropriate medications regardless of the health condition being treated:
(1) medications that should be generally avoided, and (2) doses, frequencies, or durations of
medication use that should generally not be exceeded. The criteria list the following categories of
inappropriate medications: sedative-hypnotics, antidepressants, antipsychotics,
antihypertensives, non-steroidal anti-inflammatory agents, oral hypoglycemics, analgesics,
dementia treatments, platelet inhibitors, histamine blockers, antibiotics, decongestants, iron
supplements, muscle relaxants, gastrointestinal antispasmodics, and antiemetics. The detailed
descriptions of the criteria are shown in Appendix A (Beers 1991).
In 1992, Hanlon and colleagues developed a Medication Appropriateness Index (MAI)
for measuring drug therapy appropriateness. The MAI consists of a 10-item scale, including
indication, effectives, dosage, correct directions, practical direction, drug-drug interaction, drug-
disease interaction, duplication, duration, and expense. Although this index brought a reliable
method to assess drug therapy appropriateness, only two studies have been identified which have
used these explicit criteria (Schmader 1994, Hanlon 2004). One possible reason for this is that
the MAI may be more complex to use than the Beers criteria.
Because the original Beers criteria were developed for the elderly in nursing homes, who
are frailer than the noninstitutionalized elderly population, Stuck and colleagues (1994) modified
the original list to study the inappropriateness of prescription use in the community-dwelling
elderly. The modified criteria by Stuck et al kept most of the same drugs as the original list, with
the exception of methyldopa and propranolol which were not included in the Stuck list.

7
In 1997, Beers (1997) updated the criteria to make them more applicable to the general
elderly population. Similar to the 1991 criteria, the updated one was based on the consensus of a
panel of six nationally recognized experts on the appropriate use of medications among the
elderly. Compared with the original one, the updated list consists of two categories of
inappropriate medications: one of drugs defined as inappropriate regardless of the disease
condition and the other of drugs defined as inappropriate if the clinical information is available
on certain known diagnoses. The unconditional inappropriate medication list was used in most of
the studies (Liu and Christensen, 2002). Another advantage of the 1997 Beers criteria is that a
severity rating to each criterion was indicated to each drug. A high severity was defined as a
combination of both the likelihood that an adverse outcome would occur and the clinical
significance of that outcome if it occurs. Among the inappropriate medications in the final
criteria, 14 of these were considered high severity, others were low. Drugs added to the 1997
criteria included antihistamine, doxepin, meperidine, ergot mesyloids, cyclospasmol, ticlopidine,
oxybutynin, chlorzoxazone, metaxalone, disopyramide, and gastrointestinal antispasmodics.
Drugs dropped in the 1997 criteria were pentobarbital, secobarbital, propranolol, cyclandelate,
isoxuprine, and orphenadrine because they are now seem as not being a problem when used in
the elderly (See Appendix B).
With the continuous arrival of new drugs and increasing knowledge about geriatric
medicines, in 2002, Fick and colleagues (2003) updated and revised the 1997 Beers criteria by
adding new information for both existing and newer drug agents. Consistent with the previous
criteria, the latest updated criteria were developed through a consensus opinion from a panel of
12 nationally and/or internationally recognized experts in psychopharmacology,
pharmacoepidemiology, pharmacy practice, clinical geriatric pharmacology and clinical geriatric

8
medicines after they completed a two rounds survey. Similar to 1997 criteria, there are two types
of statement included in the updated criteria: (1) medications that should be generally avoided
regardless of medical conditions. (2) medications should not be used in the elderly if certain
specific medical conditions are known. There were 11 medications/medication classes in the
1997 list but not in 2002 list, most of them were related to medical conditions; four
medications/medication classes were modified in the 2002 update list and 44 medications were
added to the update list. (See Appendix C)
Continual updating of the previously established criteria regularly is important so that
healthcare practitioners can better monitor, evaluate and select therapies for the elderly. In this
manner, potentially inappropriate medication (PIM) prescribing can be reduced.

9
CHAPTER THREE
LITERATURE REVIEW
When the first criteria developed by Beers and colleagues in 1991, a number of empirical
papers were carried out using both the 1991 and 1997 criteria. Aparasu and Mort (2000)
completed a review of eight studies conducted from 1992 through 1999 to explore the prevalence
and risk factors of PIM of the elderly in various settings based on the 1991 Beers criteria (See
Table 1). Liu and Christensen (2002) conducted another review of nine studies published
between 1997 and the end of 2001 applying 1997 criteria (See Table 2). The two studies reported
that the prevalence in the elderly varied from 10.6% in an urban hospital Emergency Department
to 40.3% in nursing homes.
Thus, our literature review will only focus on the studies which were published after
2001 and examined the prevalence of potentially inappropriate medication (PIM) with Beers
criteria. There were ten published studies that were identified in the literature search indicating
PIM use in the elderly since 2002.
Inappropriate medication prescribing for elderly in the ambulatory setting
Stuart and colleagues (2003) recently examined the trends of PIM use among U.S.
community–dwelling elderly patients between 1995 and 1999 using the 1995 and 1999 Medicare
Current Beneficiary Surveys (MCBS). They showed that 24.8% of patients took at least one PIM
in 1995 and 21.3% in 1999, which indicated that there was a significant decrease in the PIMs use
between 1995 and 1999 among the elderly.

10
Based on the national pharmaceutical benefit manager (PBM) outpatient pharmacy
claims database, Curtis and colleagues (2004) conducted a retrospective cohort study analyzing
the prevalence of PIM for the U.S. elderly. They reported that 21% of the outpatients aged over
65 received one or more PIMs. Amitriptyline and doxepin were the most commonly used
offending agents.
According to 1997 National Ambulatory Medical Care Survey (NAMCS), Huang and
colleagues (2002) conducted a study to analyze the pattern of PIM use among elderly ambulatory
care patients at a national level. They estimated that 10% of patients in the U.S. who visited
physician’s office would take at least one PIM in 1997.
Recently, Goulding (2004) studied two national surveys: NAMCS and the National
Hospital Ambulatory Medical Care Survey (NHAMCS) between 1995 and 2000 to analyze the
trends in the prevalence of PIM usage at ambulatory care visits in the elderly. The study
concluded that the prevalence of PIM in the ambulatory setting among the older patients did not
change a lot in 1995 (7.62%), 1996 (7.63%), 1997 (7.63%), 1998 (7.63%), and 2000 (7.82%). In
this study, the most common agents for PIM were pain relievers and central nervous system
drugs.
Aparasu and Mort (2004) examined inappropriate psychotropic medication use in the
elderly by the 1996 MEPS dataset. They used both types of Beers criteria to explore their study:
inappropriate psychotropic drugs should be avoided with and without medical conditions and
found that an estimation of 2.3 million community–dwelling elderly persons (7.14%)
administrated inappropriate psychotropic medications in 1996.

11
Inappropriate medication prescribing for elderly in emergency departments
Base on 1992-2000 National Hospital Ambulatory Medical Care Surveys, Cateruno and
colleagues (2004) found that a national level estimation of 16.1 million or 12.6% elderly in
emergency department (ED) visits received at least one PIM from 1992 to 2000. The rates did
not statistically significantly differ over the study period: from 1992 to 1994 the rate was 12.1%;
from 1995 to 1997, the rate was 12.9%; from 1998 to 2000 the rate was 12.6%. The most
frequently used medications in general were promethazine, meperidine, propoxyphene,
hydroxyzine, diphenhydramine and diazepam.
Inappropriate medication prescribing for elderly in nursing homes
Lau and colleagues (2004) examined a nationally representative sample of PIM use
among nursing homes residents using the 1996 Medical Expenditure Panel Survey (MEPS).
They reported that 50% of all residents aged over 65 administrated at least one PIM with an NH
stay for three months or longer. The most common agents used were propoxyphene,
diphenhydramine, hydroxyzime, oxybutynin, amitriptyline, cyproheptadine, iron supplements
and ranitidine.
A recent study conducted by Perri and colleagues (2005) analyzed the prevalence of
inappropriate medication use in nursing homes in Georgia in 2002. After reviewing patient
medical records in 15 Georgia nursing homes, they estimated that 46.5% of patients received at
least one inappropriate medication applying the 1997 Beers criteria.
Inappropriate medication prescribing for elderly in assisted living facilities
Sloane and colleagues (2002) analyzed the medication profiles of older residents in a
four-state random sample of 193 residential care/assisted living facilities (RC/AL) in Florida,
New Jersey, North Carolina, and Maryland between October 1997 and November 1998.

12
Researchers found that 16% of the residents received at least one PIM and the most common
PIMs were oxybutynin, propoxyphene, diphenhydramine, ticlopidine, doxepin, and
dipyridamole.
In 2003, Gray and colleagues examined 282 elderly participants in community residential
care (CRC) facilities through analysis of Washington State Medicaid pharmacy prescription
claims data between April 1998 and December 1998. They reported that 22% of the residents
were administrated at least one PIM and the most common agents were oxybutynin and
amitriptyline.
The previous studies reported here examined the prevalence of inappropriate medication
use among the elderly in various settings such as emergency departments, nursing homes,
residential care facilities, via ambulatory care visits, or in community dwelling options. All of
the studies reviewed applied 1997 Beers criteria, most of which used the list regardless of dosage
dependence and medical condition, only two studies used the complete 1997 Beers criteria (Lau
et al 2004, Huang et al 2002). In general, patients in nursing homes seem to receive a higher
prevalence of PIM than those in other settings. However, only one study analyzed the prevalence
after year 2000 (Perri et al 2005) and no research has been done using the updated 2002 criteria.
The possible reasons could be as follows: firstly, most of the studies used a retrospective
database, which is always released several years after initial data collection; secondly, since the
2002 explicit criteria list is quite recently published in 2003, it is not possible for research to be
conducted prior to its release in 2003.
Evaluating the costs of potentially inappropriate medication use
Although inappropriate medication use in the elderly has been linked to serious negative
health outcomes and excess health care utilization, there is only one published study addressed

13
the association between PIM and costs and utilization (Fick et al 2001). Another two studies
demonstrated the relation between additional resource utilization and an adverse drug event
(Senst et al 2001, Bates et al 1997). Using a cost of illness analysis, there are another two studies
published assessing the cost of drug related morbidity and mortality in ambulatory settings and
nursing facilities. Here, we only included the study that sheds light on PIMs (Fick et al 2001).
Based on a Southeastern health maintenance organization’s (HMO) claim dataset, Fick
and colleagues (2001) conducted a study using Beers criteria demonstrated a strong relationship
between the PIM and significantly higher costs, higher numbers of inpatient, outpatient and
emergency room visits in the elderly. In addition to inappropriate medication use, age, gender,
medication use, self-rated health and Charlson Comorbidity Index were included in the analysis,
which were assumed to affect the health costs and utilization. Although a lot of confounders had
been considered in this study, since the distribution of cost data is always positively skewed it
might be better to use logarithmic transformation to reduce the skewness rather than use direct
cost which was assessed in the regression model (Motheral Et al 2003). Moreover, their sample
was drawn from a HMO database, which constrained the generalizability to a national level
population.

14
Table 1 Results of literature review by Aparasu and Mort(2000)
Prevalence
Authors Setting Scope Data source Time period of PIM
Beers et al. Nursing home LA area prescription orders 1 year 40.3 1992 residents 1990-91
Stuck et al Community Santa Monica interview 1 year 14.0 1994 elderly community 1989-90
Spore et al. Board and care 10 states interview 1 year 24.1 1997 facility elderly 1993 Wilcox et al Community National NMES 1 year 23.5 1994 elderly 1987 GAO Report Medicare National MCBS 1 year 17.5 1995 recipients 1992 Aparasu et al Ambulatory National NAMCS 1 year 5 1997 elderly(in 1992 physician office) Aparasu et al Ambulatory National NHAMCS 1 year 2.9 Elderly(in 1994 outpatient Dep.)

15
Table 2 Results of literature review by Liu and Christensen (2002)
Prevalence
Authors Setting Scope Data source Time period of PIM
Chin et al. Elderly patients Chicago interview period of 10.6 1999 admitted to ED urban area 10/95-06/96 admission Fick et al. Medicare National HMO claims 14 month 24.2 2001 managed care data from
elderly 06/97-10/98 Golden et al. Nursing home Miami Pharmacy profiles 1 year 39.7 1999 home-bound from Medicaid managed care plan 1997 Hanlon et al. Community North Duke EPESE 1 year 2000 elderly Carolina 1989-90 27 1992-93 22.6 Meredith et al. Home health New York Claims data with 4 week 17 2001 care patients Los Angeles interview Mort &Aparasu Ambulatory National NAMCS 1 year 27.2 2000 elderly NHAMCS (psychotropic 1996 agents only) Mott et al. Elderly at One Midwestern interview point of 14.3 2000 community State pharmacy visit pharmacy 1994 Piecoro et al. Elderly with Kentucky Medicaid claims 1 year 27 2000 Medicaid pharmacy claims 1996 Spiker et al. Indigent and Ohio Medical profiles 5 months 35.6 2001 homeless elderly from 7 government Subsidized clinics 1999-2000 Zhan et al. Community- National MEPS 1 year 21.3 2001 dwelling elderly 1996

16
CHAPTER FOUR
RESEARCH OBJECTIVES AND HYPOTHESES
Although most of the previous studies have investigated the prevalence and trends of
inappropriate medication use in different settings among the elderly population, there is no
current study examining this issue on the national level using updated 2002 explicit criteria.
Recently, several studies (Fick et al 2001, Fu et al 2004, Perri et al 2005, Lau et al 2005) have
demonstrated the relationship between inappropriate medication use in the elderly and negative
health outcomes. However, none of these studies have estimated health care expenditures related
to inappropriate prescribing of medication use among the older population.
The main purpose of this study is to investigate the relationship between the total health
expenditures and PIM use in the elderly. The objectives of this study are: (1) to determine the
prevalence of inappropriate prescription use among the non-institutionalized elderly population
from 2000 to 2001 using Medical Expenditure Panel Survey (MEPS) data file and 2002 explicit
criteria. (2) to determine the incremental health expenditures related to potentially inappropriate
prescription medication use among the non-institutionalized elderly. The specific hypotheses to
be tested are:
Hypothesis 1:
There is no relationship between PIM use and higher health expenditures.
To test this relationship a multiple linear regression model will be employed so that we
can control for age, gender, race, health insurance status, total number of prescriptions, self rated
health condition, co morbidities and previous year total health expenditures. Each of these has

17
been established as important variables in predicting health outcomes in this population (Perri et
al 2005, Fu et al 2004, Fick et al 2001).
We will define total health expenditures as the sum of emergency room expenditures, in-
hospital expenditures, outpatient expenditures, office based visit expenditures, prescription
expenditures and home care expenditures. Self rated health status was measured by the self-
report versions of SF-12 physical component summary score (PSC), which has been shown to be
the best approach to differentiate between patients with PIMs and those who do not (Jiang and
Franic 2005). We plan to use the same adapted Charlson Co Morbidity index as was used in Fick
study(2001). The original Charlson index classified certain comoribid conditions with an
international Classification of Disease (ICD-9) code (Charlson ME et al 1987); the adapted
Charlson index assigns a weighted index which takes into account both the number and
seriousness of different co-morbid diseases, and is commonly used with administrative databases
to evaluate patient comorbidities (William D.H. et al 1996).
Hypothesis 2:
There is no relationship between higher expenditures for emergency room, in-patient,
outpatient and office based visits, prescription and home care and utilization of PIMs.
Again, a multiple linear regression model will be used to control for age, gender, race,
health insurance status, total number of prescriptions, the previous year self rated health
condition, co morbidity conditions and the health services expenditures of previous year.
Hypothesis 3:
Expenditures incurred from health services such as emergency room visits, in-patient,
outpatient, and home care are not related to PIM use or prior use of these services.

18
Because there will be many patients without emergency room visits and other
expenditures, a logistic regression will be employed to predict the relationship between PIM use
and no expenses in 2000 and 2001 after controlling age, gender, race, health insurance status,
total number of prescriptions, the previous year self rated health condition, and co morbidity
conditions.
Hypothesis 4:
PIM use is not related to gender, race and insurance type. A Chi-square test will be used
to assess the relationship between these discrete variables and PIM use.
Hypothesis 5:
PIM use is not related to patient continuous demographic or descriptive variables.
These variables are age, Charlson comorbidity index, self reported health condition, total
number of prescriptions, total expenditures in 2000, 2001 and their subcategories.
We will investigate if there is any relationship between the variables of age, total number
of prescriptions, self rated health condition, comorbidity conditions, total expenditures, and it’s
subcategories between patients with and without PIM medications using independent t-tests.

19
CHAPTER FIVE
METHODS
5.1Data Sources:
Our data were drawn from the 2000 and 2001 Medical Expenditure Panel Survey
(MEPS). The primary purpose of the MEPS database is to provide national estimates of health
care utilization, expenditures, sources of payment, and insurance coverage for the U.S. non-
institutionalized.
MEPS is a nationally representative survey and comprises three component surveys: the
Household Component (HC), the Medical Provider Component (MPC), and the Insurance
Component (IC). Among these segments, the HC is the core survey. The MEPS is co-sponsored
by the Agency for Healthcare Research and Quality (AHRQ) and the National Center for Health
Statistics. The MEPS is the most recent available survey conducted by AHRQ on the financing
and use of medical care in U.S., following by the National Medical Expenditure Survey
(NMCES or NMES-1, 1977) and the National Medical Expenditure Survey (NMES-2, 1987).
The sampling frame for the MEPS HC is drawn from respondents of the National Health
Interview Survey (NHIS) and MEPS HC collected additional data on their health care
expenditures. Additionally, MEPS links these data with additional information collected from the
respondents’ medical providers, employers, and insurance providers.
Using computer-assisted personal interviewing technology, The MEPS data were
collected on demographic characteristics, health conditions, health status, use of medical care
services, charges and payments, access to care, satisfaction with care, health insurance coverage,

20
income and employment. The MEPS conducts a 5- round interview per household for each panel
and it uses an overlapping panel design for each year, which means that there are two group
participants interviewed each year, one group is from a new cohort panel started interviews from
round one to round three and the other is from the previous panel round three to five (see Figure
1).
Panel 4 1999-2000 Panel 5 2000-2001
Round 1 Round 2 Round 3 Round 4 Round5
Panel 6 2001-2002
Round1
Round 2 Round 3
Figure1 MEPS Time Frame Year 2000 and 2001
This current study used the HC component of MEPS 2000, MEPS 2001. Involved files
are as follows:
HC065: MEPS Panel 5 Longitudinal Weight file (updated on October 2004)
HC050: 2000 Full Year Consolidated Data File (updated on June 2003)
HC051a:2000 Prescribed Medicines (updated on April 2003)
HC052: 2000 Medical Conditions File (updated on June 2003)
HC060: 2001 Full Year Consolidated Data File (updated on April 2004)
HC059a:2001 Prescribed Medicines (updated on February 2004)
Round3 Round 4 Round 5
MEPS 2000
MEPS 2001
2001
21
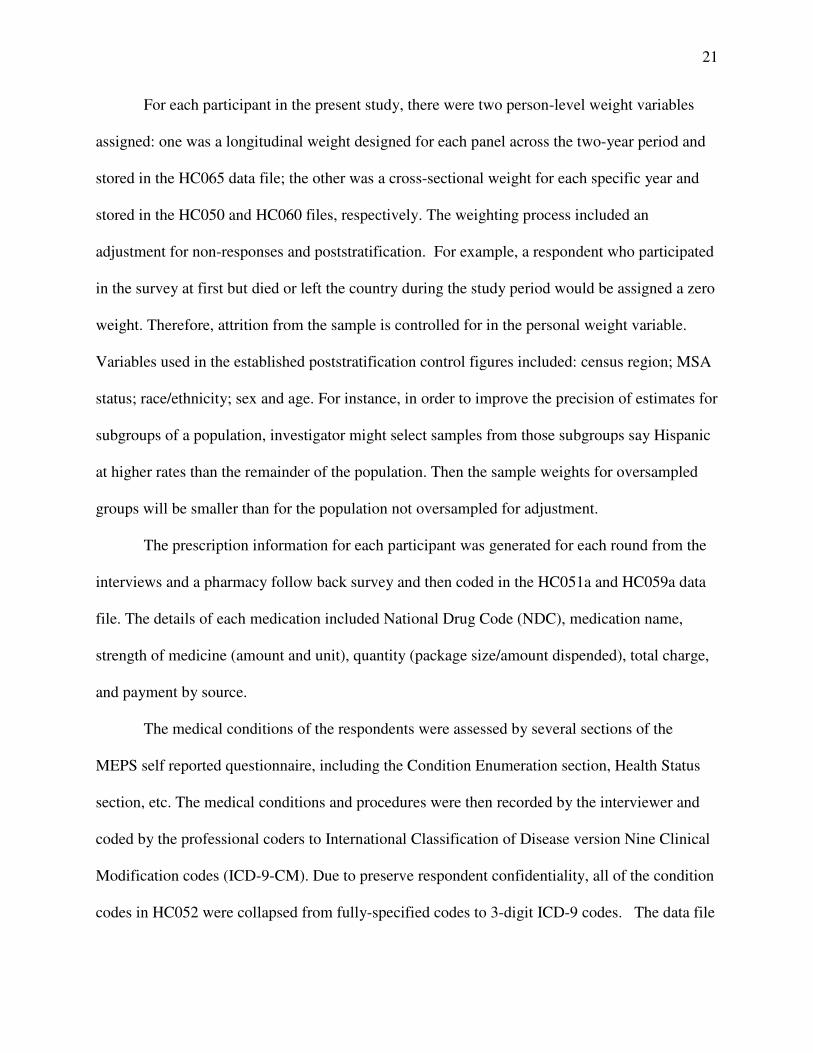
For each participant in the present study, there were two person-level weight variables
assigned: one was a longitudinal weight designed for each panel across the two-year period and
stored in the HC065 data file; the other was a cross-sectional weight for each specific year and
stored in the HC050 and HC060 files, respectively. The weighting process included an
adjustment for non-responses and poststratification. For example, a respondent who participated
in the survey at first but died or left the country during the study period would be assigned a zero
weight. Therefore, attrition from the sample is controlled for in the personal weight variable.
Variables used in the established poststratification control figures included: census region; MSA
status; race/ethnicity; sex and age. For instance, in order to improve the precision of estimates for
subgroups of a population, investigator might select samples from those subgroups say Hispanic
at higher rates than the remainder of the population. Then the sample weights for oversampled
groups will be smaller than for the population not oversampled for adjustment.
The prescription information for each participant was generated for each round from the
interviews and a pharmacy follow back survey and then coded in the HC051a and HC059a data
file. The details of each medication included National Drug Code (NDC), medication name,
strength of medicine (amount and unit), quantity (package size/amount dispended), total charge,
and payment by source.
The medical conditions of the respondents were assessed by several sections of the
MEPS self reported questionnaire, including the Condition Enumeration section, Health Status
section, etc. The medical conditions and procedures were then recorded by the interviewer and
coded by the professional coders to International Classification of Disease version Nine Clinical
Modification codes (ICD-9-CM). Due to preserve respondent confidentiality, all of the condition
codes in HC052 were collapsed from fully-specified codes to 3-digit ICD-9 codes. The data file

22
mentioned above can be used alone or in conjunction with other files by using merging
procedure.
5.2 Exclusion and Inclusion Criteria:
This was a cross-sectional, longitudinal, retrospective cohort study. We used MEPS
2000, 2001 databases to estimate the one-year prevalence of inappropriate medication
prescribing among a sample of non-institutionalized elderly, respectively; and used MEPS panel
5 data to estimate the two-year prevalence of PIM use. Participants drawn only from MEPS
panel 5 data were utilized to estimate the different expenditures attributable to the inappropriate
medication use among the non institutional elderly. The present study population is restricted to
participants who were age 65 years and older.
For the one-year prevalence study, we chose the participants from MEPS 2000 and
MEPS 2001 data, who were at least age 65 at that specific year; those who have zero sample
weight were deleted. In the two-year prevalence and expenditure estimation study, we chose the
participants from longitudinal MEPS panel 5 data set, who were at least 65 years old in 2000 and
completed the five-round interviews during the two-year period.
In the expenditure study, participants were those who only had appropriate medication
use in round one and round two, which was defined as our wash out period and was used to
minimize the carry over effect from previous inappropriate medication exposure. After followed
up for another two rounds, patients who were taking inappropriate medications in round three
and/or four were our case group, while the rest were defined as our control group (See Figure 2).
We didn’t include patients having a PIM in round 5 to ensure that all individuals in the case
group would have sufficient time in the study to incur expenditures.

23
JAN 2000 DEC 2000 JAN2001 DEC 2001
Capture of Expenditures
Panel 5
Round 1 Round 2
Round 3 Round 4
Round 5
Capture of PIM use
Wash out Period Follow up Period End Date
Figure 2 The composition of expenditure study
5.3 Potentially Inappropriate Medication Prescriptions Measures
For this study we adopted the updated 2002 explicit unconditional medication criteria
created by Fick (2003). Among that, there are 4 classes or agents which are dosage dependent
(See Table 3). Although MEPS does not provide information on daily dosage or frequency of use
for every prescription, we used strength instead of dosage in our analysis. If the strength was
above the dosage, we assumed that prescription was inappropriate.
Table 3 Dosage dependent PIM in the analysis
Prescription Classes or Agents Severity
Benzodiazepines
Lorazepam(if exceed 3 mg daily) Low
Oxazepam(if exceed 60 mg daily) Low
Alprazolam(if exceed 2 mg daily) Low
Temazepam(if exceed 5 mg daily) Low
Zolpidem(if exceed 0.25 mg daily) Low
Triazolam(if exceed 0.25 mg daily) Low
Digoxin (if exceed 0.125 mg daily) High
Ferrous Sulfate (if exceed 325 mg daily) Low
Reserpine (if exceed 0.25 mg daily) High
The National Drug Code (NDC) was primarily used to identify the inappropriate
prescription classes based on the 2002 criteria in the MEPS prescribed medicine files. The NDC
is a nationally recognized identifier for every unique drug product marketed in the US. The U.S.
Food and Drug Adminstration (FDA) designs the NDC Directory data. The NDC Directory data

24
can be downloaded from the FDA Center for Drug Evaluation and Research (FDA, 2001). Under
Section 510 of the Federal Food, Drug, and Cosmetic Act, each drug product listed is assigned a
unique 10-digit, 3-segment number. This number, known as the National Drug Code, identifies
the labeler/vendor, product, and trade package size. The FDA assigns the first segment, the
labeler code. A labeler is any firm that manufactures repacks or distributes a drug product. The
second segment, the product code, identifies a specific strength, dosage form, and formulation
for a particular product. The third segment, the package code identifies package sizes. Both the
product and package codes are assigned by the firm. The NDC will be in one of the following
configurations: 4-4-2, 5-3-2, or 5-4-1. In the MEPS data set, all valid NDCs are coded 11 digits.
5.4 Expenditure Measures
Expenditures in this study referred to what was paid for health care services, including
out-of pocket payments and payments by private insurance, Medicaid, Medicare and other
sources. Payments for over the counter drugs and for alternative care services were not included
here.
5.5Data Analysis
The current study used weighted analysis to examine the prevalence of PIM use and
explore the association between PIM use and higher health care expenditures among the U.S.
elderly. We employed a non-weighted propensity score method to estimate the expenditures
associated with the utilization of a PIM.
5.5.1 Prevalence Examination
Frequency counts of the number of participants who were dispensed at least one PIM
were used to calculate the prevalence of PIM for elderly patients in the observational period. We

25
not only calculated the prevalence yearly, but also the prevalence for each round in MEPS panel
5 data as well.
The formula for determine the prevalence is as follows:
The number of patients received PIMs
The total number of the studied population *100%
5.5.2 Expenditure Estimation
In the expenditure study, the total expenditures and subcategories of expenditure
(emergency expenditures, in-hospital expenditures, outpatient expenditures, office based
expenditures, prescription expenditures and homecare expenditures) in 2001 were our dependent
variables.
The variable of interest in terms of prescription utilization was whether or not a dispensed
medication was appropriate for use in the elderly, as defined by the Fick criteria described above.
PIM was coded (=1) if inappropriate and (=0) if not inappropriate within round three and or
round four from the MEPS Panel 5 data file.
Age, race, gender, total number of prescription, type of health insurance, comorbidity,
self rated health status and previous year health expenditures were included as independent
variables and used to control for differences in utilization when comparing health care
expenditures between patients who used a PIM and those who did not.
Participant age was defined as their age in year 2000 and was treated as a continuous
variable. Race was categorized into white coded as ‘1’ and non-white coded as ‘0’. Gender was
also treated as a dichotomous variable, ‘1’for male and ‘0’ for female. We classified insurance
type into private insurance (person had any private insurance coverage any time during 2000),
public insurance (person had only public insurance coverage during 2000), uninsured (no insured

26
during all of the period in 2000). Comorbidity condition was measured by the adapted Charlson
index (see Table 4). Self rated health condition was measured by SF-12 PCS.
Table 4 Adapted Charlson Comorbidity Index
Weights Conditions ICD-9 codes
1 Myocardial infarct 410, 411 Congestive heart failure 398, 402, 428 Peripheral vascular disease 440-447 Dementia 290, 291, 294 Cerebrovascular disease 430-433, 435 Chronic pulmonary disease 491-493 Connective tissue disease 710, 714, 725 Ulcer disease 53 l-534 Mild liver disease 571, 573 2 Hemiplegia 342, 434, 436, 437 Moderate or severe renal disease 403, 404, 580-586 Diabetes 250 Any tumor 140-195 Leukemia 204-208 Lymphoma 200, 202, 203 3 Moderate or severe liver disease 070, 570, 572 6 Metastatic solid tumor 196-199 Reference: William DH et al 1996
5.5.2.1 Descriptive Analysis of Expenditure Estimation Study
We performed Chi-squared tests to analyze the association of categorical variables
between the patients who were prescribed PIM and those were not, such as gender, race, and
insurance type. t-tests were used to examine the relationship of continuous variables between
case and control group, including age, Charlson comorbidity index, self reported health
condition, total number of prescription, total expenditures in 2000, 2001 and their subcategories.
Although a temporal relationship between PIM use and these descriptive and
demographic variables may be present, a simple bivariate analysis cannot be used to infer a
reliable relationship between the case and control group. In the next section, the explanatory
multiple regression analysis will be used to establish a better design.

27
5.5.2.2 Explanatory Analysis of Expenditure Study
After controlling for demographic and clinical differences such as age, race, gender,
insurance type, total number of prescription, and previous total expenditure and health
conditions, a multiple regression analysis was applied to examine our main hypothesis whether
expenditures were different between those prescribed PIM and those who did not.
Because the distribution of expenditures was highly skewed, we transformed the
expenditure variables into natural LOG term. The multiple regression models were as below:
LN ( TOTEXP01)=β0 + β1LN(TOTEXP00) + β2 Age + β3Race + β4Gender + β5
Insurance Type + β6 Comorbidity Index + β7 SF-12PCS00 Status +β8 Number of Prescription+
β9Index.
We also performed the multiple and logistic regression models on subcatogories of total
expenditures such as prescription drug expenses, emergency room expenses, inpatient visit
expense, outpatient visit expenses, office based visit expenses and home care visit expenses, the
detailed modeling was described as below.
Since there were a lot of zero expenses for both years in emergency room visits (n=527),
inpatient visits (n=497), out patient visits (n=389) and home care visits (n=638) we developed a
logistic regression model for these cases to predict the factors affecting the zero expenditure in
the following year. The subcategory expenditures in 2001 were still used as dependent variables
in the logistic regression models, but we treated the dependent variable as a dummy variable. If
patients had no expenditure in 2001 then the variable is 0, otherwise it was coded as 1. We
classified the variables of subcategorical expenditure in 2000 as dummy variables applying the
same criteria. Secondly, we used multiple regression to estimate the relationship between
inappropriate medication use and each subcategory expenditure after deleting those participants

28
who had no subcategory expenses within 2 years. A detailed description of variables was
presented in table 5 and 6.
The multiple linear and logistic regression models for subcategories were as below:
LN (Expenditure in subcategories in 2001)= β0+ β1PIM exposure or not +β2
LN(Expenditure in subcategories in 2000)+β3Age+β4Gender+β5Racer+β6Insurance
Type+β7Comorbidity+β8Self-rated Status+ β9Rxs
Pr (No Expenditure incurred for ER, Inpatient, outpatient,homecare in 2001)= β0+β1(No
Expenditure incurred for Inpatient, outpatient, ER, homecare in 2000)+β2(No PIM exposure)+
β3Age+β4Gender+β5Racer+β6InsuranceType+β7Comorbidity+β8Self-rated Status+ β9Rxs.
A propensity score (simple matching with caliper) was used to estimate the expenditure
difference between case group and controls. The propensity score is defined as the conditional
probability of being treated given the covariates (D’Agostime RB 1998). Patients in case and
control groups with nearly equal propensity score will tend to have same distributions on their
background covariates so that to remove the bias in the background covariates. With the same
propensity scores, we could imagine that paired case and control subjects are ‘randomly’
assigned to each group and receive treatment and control. As we know that in many
observational studies, investigators have no control over the treatment assignment, so propensity
score method is a good example to reduce bias and increase precision especially in observational
studies (Lavori PW et al 1988, Cook EF et al 1988, Fiebach NH et al 1990).
The function for calculating caliper is as follows (Martin BC and Ganguly R):
Caliper=0.20*sqrt[(VARcase+VARcontrol)/2]
The non parametric Sign test was performed to evaluate the paired samples of the
difference in expenditures between case and control groups for 2001.

29
The median difference expenditures in 2001 between the case and control group was the
estimate of expenditure attributable to PIM among the elderly.
5.6 Statistical
All data analyses were accomplished with the SAS (Release 8.1. SAS Institute Inc., Cary,
NC) statistical software. The level of significance was set at .05 levels.
Table 5 Variables in the Multiple Regression Models
Variables Description Character
Dependent Variables TOTEXP01 Total health Expenditures in 2001 Continuous RXEXP01 Expenditure of prescription drugs in2001 Continuous EMGEXP01 Expenditure of emergency visits in2001 Continuous
INHEXP01 Expenditure of inpatient visits in 2001 Continuous
OBVEXP01 Expenditure of office based visits in 2001 Continuous OUTHEXP01 Expenditure of outpatient visits in 2001 Continuous
HHCEXP001 Expenditure of home care in 2001 Continuous
Independent Variables Age Age in years Continuous Gender Gender DV=1 for female, 0 for male Race Race DV=1 for whites, 0 for non-whites Insurance Type Private DV=1 for private insurance, 0 for others Public DV= 1 for public insurance, 0 for others Uninsured DV=1 for people have no insurance, 0 for otherwise Charlson Comorbidity Index Adapted Chalson Comorbidity Index Continuous TOTEXP00 Total Expenditures in 2000 Continuous Index Had PIM or not DV=1 for had PIM, 0 for appropriate SF-12 PCS 00 SF-12 physical condition summary Continuous score interviewed in 2000 RXEXP00 Expenditure of prescription drugs in 2000 Continuous EMGEXP00 Expenditure of emergency visits in 2000 Continuous INHEXP00 Expenditure of inpatient visits in 2000 Continuous OBVEXP00 Expenditure of office based visits in 2000 Continuous OUTHEXP00 Expenditure of outpatient visits in 2000 Continuous HHCEXP00 Expenditure of home care in 2000 Continuous

30
Table 6 Variables in Logistic Regression Model
Variables Description Character
Dependent Variables
EMGEXP01 Expenditure of emergency visits in2001 DV=1 for expenditure>0
0 for expenditure=0
INHEXP01 Expenditure of inpatient visits in 2001 DV=1 for expenditure>0
0 for expenditure=0
OUTHEXP01 Expenditure of outpatient visits in 2001 DV=1 for expenditure>0
0 for expenditure=0
HHCEXP001 Expenditure of home care in 2001 DV=1 for expenditure>0
0 for expenditure=0s
Independent Variables
Age Age in years Continuous
Gender Gender DV=1 for male, 0 for female
Race Race DV=1 for whites, 0 for non-whites
Insurance Type
Private DV=1 for private insurance, 0 for others
Public DV= for public insurance, 0 for others
Uninsured DV=1 for people have no insurance,
0 for otherwise
Charlson Comorbidity Index Adapted Chalson Comorbidity Index Continuous
TOTEXP00 Total Expenditures in 2000 Continuous
Index Had PIM or not DV=1 for had PIM, 0 for appropriate
SF-12 PCS 00 SF-12 physical condition summary Continuous
score interviewed in 2000
EMGEXP00 Expenditure of emergency visits in 2000 DV=1 for expentidure>0
0 for expenditure=0
INHEXP00 Expenditure of inpatient visits in 2000 DV=1 for expentidure>0
0 for expenditure=0
OUTHEXP00 Expenditure of outpatient visits in 2000 DV=1 for expentidure>0
0 for expenditure=0
HHCEXP00 Expenditure of home care in 2000 DV=1 for expentidure>0
0 for expenditure=0

31
CHAPTER SIX
RESULTS
6.1 Results of prevalence analysis
Tables 7-9 list the numbers and national estimates of potentially inappropriate
medications use by the non-institutionalized elderly from MEPS 2000, MEPS 2001 and MEPS
Panel 5 data sets.
In MEPS 2000 file, the original study sample contained 2,834 elderly aged over 65. After
deleting 50 patients who had zero weight, which means they either expired or moved out of the
country, our final study sample comprised 2,734 elderly patients, which represented an
estimation of 33,247,684 community dwelling elderly in the U.S. in the calendar year 2000.
There were 757 patients (an estimate of 9,226,379 elderly) used at least one potentially
inappropriate medication (PIM) identified by the 2002 explicit criteria regardless of medical
diagnosis, yielding a 27.75% prevalence of PIM use in 2000.
In the 2001 dataset, our final sample consisted of 3,704 elderly patients with valid
personal weights, which represented an estimated 34,490,045 non institutionalized U.S. elderly
population, in which 1,017 persons (an estimate of 9,590,937 elderly) took at least one PIM. The
prevalence of PIM for the year 2001 was approximately 27.80% from MEPS 2001 data set.
The MEPS Panel 5 file data contained 1,161 elderly participants with personal
longitudinal weights in our study sample, we estimated 32,653,181 nationally non-
institutionalized U.S. elderly in year 2000 and 2001. There were 407 patients (an estimate of
11,618,744 elderly) receiving one PIM during 2 years which was equivalent to a prevalence of
35.58%. We also calculated the prevalence for each round in MEPS panel 5. The average
duration of each round was 3.5, 5.0, 6.0, 6.0, and 3.5 months from round one to five. There were

32
179 participants (15.84%) out of 1,161 received at least one inappropriate medication in round 1,
198 participants (17.43%) in round two, 210 (18.06%) in round three, 224 (19.78%) in round
four, and 179 (16.74%) in round five, respectively.
Since some patients could have several different inappropriate prescriptions at the same
time, the sample size and estimated population statistics listed on tables 7-9 are not the sum of all
the statistics on the above column.
The results showed that the prevalence in 2000 and 2001 did not shift dramatically;
neither did the round-specific period. But the prevalence of 2-year period is not the simply sum
of each year or each round, which implied that certain proportion of patients repeatedly took the
inappropriate medications each year or every round.
The most frequently prescribed inappropriate medications for the years 2000, 2001 and
for the two year period were, respectively: propoxyphene, digoxin, naproxen, doxazosin, and
amitriptyline; propoxyphene, digoxin, doxazosin, amitriptyline, naproxen; and propoxyphene,
digoxin, amitriptyline, naproxen and doxazosin. Propoxyphene is found to be the top PIM in our
study where naproxen and doxazosin are new agents added to the list by Fick in 2002 explicit
criteria.
Other than digoxin, the strength of all other three classes or individual agents is no
greater than the amount listed in the criteria.
6.2 Results of Expenditure Analysis
The original sample contained 1,161 participants in MEPS panel 5, after the wash out
period, the final sample consisted of 720 patients who had appropriate drug use in round 1 and
round 2, after another 2 rounds of follow up, there were 115 patients who had inappropriate

33
medication use in round 3 and /or 4. The balance of patients in the group (605 patients) was our
comparators.
TABLE 7Distrubution of PIM use in 2000
Prescription classes or individual agents
Sample
size
Estimated PIM use
in thepopulation
Analgesics propoxyphene and combination products 145 1,683,856 pentazocine N/A meperidine 2 18,282
NSAIDs indomethacin 29 305,154 naproxen, 75 961,155 oxaprozin, 8 98,319 piroxicam 2 26,397 ketotolac 1 20,873
Dementia treatment ergot mesyloids, 1 3,177 cyclospasmol N/A
Sedative or hypnotic agents All barbituates except phenobarbital 1 26139 meprobamate 3 36,793
Antipsychotics thioridazine 2 12,490 mesoridazine N/A
Antiemetics trimethobenzamide 2 31,035 Benzodiazepine hypnotics flurazepam 5 47,277 chlordiazepoxide 15 159,913 diazepam 25 342,834 chlorazepate 12 124,500
Hypoglycemic agents chlorpropamide 1 20,191
Antiarrhythmic drugs disopyramide 5 51,603
amiodarone 23 385,288 Antidepressants
doxepin 11 130,913 amitriptyline 64 758,643 fluoxetine 35 494,868
Antihypertensives methyldopa 12 131,300 guanethidine N/A clonidine 42 485,680 ethacrynic acid N/A guanadrel N/A
doxazosin 79 803,480 Antihistamine
diphenhydramine 15 181,221

34
chlorpheniramine, 30 263,626 hydroxyzine, 29 264,209 cyproheptadine, 8 74,037 promethazine, 30 384,782 tripelennamine,dexchlorpheniramine N/A orphenadrine 6 56,745 cimetidine 39 367,187
Platelet inhibitors ticlopidine 17 264,843 Short acting dipyridamole(Persantine®) 8 96,584
Gastrointestinal antispasmodic drugs dicyclomine, 17 169,967 hyoscyamine, 23 360,061 propantheline, N/A belladonna alkaloids 4 64,914
Muscle relaxants and antispasmodic drugs methocarbamol, 8 85,754 carisoprodol, 16 274,893
oxybutynin (excluding Ditropan XL®), 20 212,803 metaxalone, 6 56,295 cyclobenzaprine, 20 224,683 chlorzoxazone 1 10,624 Antibiotics nitrofurantoin 26 389,938
Amphetamines and anorexic agents 1 10,010 Stimulant laxatives
bisacodyl, 4 44,752 cascara sagrada, N/A castor oil (Neoloid®) N/A
hormone estrogens only(oral) 8 72,147 methyltestosterone 1 12,200
isoxsuprine N/A Short acting nifedipine(Procardia® and Adalat®) 6 103,794 mineral oil N/A desiccated thyroid 22 326,012
Benzodiazepines Lorazepam(if exceed 3 mg daily) N/A Oxazepam(if exceed 60 mg daily) N/A Alprazolam(if exceed 2 mg daily) N/A Temazepam(if exceed 5 mg daily) N/A Zolpidem(if exceed 0.25 mg daily) N/A Triazolam(if exceed 0.25 mg daily) N/A
Digoxin (if exceed 0.125 mg daily) 119 1,508,008 Ferrous Sulfate (if exceed 325 mg daily) N/A Reserpine (if exceed 0.25 mg daily) N/A
TOTAL 757 9,226,379

35
Table 8 DISTRUBUTION OF PIM USE IN 2001
Prescription classes or individual agents
Sample
size
Estimated PIM use in
the population
Analgesics propoxyphene and combination products 207 1,989,807 pentazocine 1 6,969 meperidine 3 31,026
NSAIDs indomethacin 33 313,709 naproxen, 95 810,473
oxaprozin, 10 73,898 piroxicam 10 74,747
ketotolac 5 41,103 Dementia treatment
ergot mesyloids, N/A cyclospasmol N/A
Sedative or hypnotic agents All barbituates except phenobarbital N/A meprobamate 4 49,045
Antipsychotics thioridazine 2 11,320 mesoridazine N/A
Antiemetics trimethobenzamide 4 23,351
Benzodiazepine hypnotics flurazepam 5 42,280 chlordiazepoxide 14 143,751 diazepam 45 429,088 chlorazepate 10 81,064
Hypoglycemic agents chlorpropamide 5 53,345
Antiarrhythmic drugs disopyramide 3 28,678
amiodarone 48 378,039 Antidepressants
doxepin 18 150,195 amitriptyline 87 801,667 fluoxetine 42 464,608
Antihypertensives methyldopa 23 167,156 guanethidine N/A clonidine 42 485,680 ethacrynic acid N/A
guanadrel N/A Antihistamines
diphenhydramine 22 234,208 chlorpheniramine, 30 269,485 hydroxyzine, 41 332,176 cyproheptadine, 6 32,614 promethazine, 63 527,221 tripelennamine,dexchlorpheniramine N/A

36
orphenadrine 4 25,678 cimetidine 34 283,565
Platelet inhibitors ticlopidine 11 144,987 Short acting dipyridamole(Persantine®) 8 59,922
Gastrointestinal antispasmodic drugs dicyclomine, 20 233,607 hyoscyamine, 13 151,499 propantheline, 1 18,201 belladonna alkaloids 8 82,571
Muscle relaxants and antispasmodic drugs methocarbamol, 17 142,520 carisoprodol, 17 203,913
oxybutynin (excluding Ditropan XL®), 34 339,551 metaxalone, 14 128,026 cyclobenzaprine, 8 59,083 chlorzoxazone 4 42,328
Antibiotics nitrofurantoin 25 253,996
Amphetamines and anorexic agents 3 23,569 Stimulant laxatives
bisacodyl, 4 55,741 cascara sagrada, N/A castor oil (Neoloid®) N/A
Hormone estrogens only(oral) 9 83,443 methyltestosterone N/A
isoxsurpine N/A doxazosin 101 913,578 Short acting nifedipine 5 30,279 mineral oil N/A desiccated thyroid 24 234,384
Benzodiazepines Lorazepam(if exceed 3 mg daily) N/A Oxazepam(if exceed 60 mg daily) N/A Alprazolam(if exceed 2 mg daily) N/A Temazepam(if exceed 5 mg daily) N/A Zolpidem(if exceed 0.25 mg daily) N/A Triazolam(if exceed 0.25 mg daily) N/A
Digoxin (if exceed 0.125 mg daily) 155 1,606,918 Ferrous Sulfate (if exceed 325 mg daily) N/A Reserpine (if exceed 0.25 mg daily) N/A
TOTAL 1,017 9,590,937

37
Table 9 DISTRUBUTION OF PIM USE IN MEPS Panel 5
Prescription classes or individual agents
Sample
size
Estimated PIM
use in the
population
Analgesics propoxyphene and combination products 110 3,040,596 pentazocine 1 15,482 meperidine 1 26,437
NSAIDs indomethacin 13 375,054 naproxen, 37 939,058 oxaprozin, 10 73,898 piroxicam 3 83,292 ketorolac 4 49,959
Dementia treatment ergot mesyloids, 1 6,856 cyclospasmol N/A
Sedative or hypnotic agents All barbituates except phenobarbital N/A meprobamate 2 99,339
Antipsychotics thioridazine 1 10,920 mesoridazine N/A
Antiemetics trimethobenzamide 1 40,183
Benzodiazepine hypnotics flurazepam 2 43,116 chlordiazepoxide 9 203,080 diazepam 14 405,588 chlorazepate 4 123,768
Hypoglycemic agents chlorpropamide 5 53,345
Antiarrhythmic drugs disopyramide 4 64,499
amiodarone 21 617,769 Antidepressants
doxepin 3 79,775 amitriptyline 39 1,198,818
fluoxetine 24 552,899 Antihypertensives
methyldopa 9 48,582 guanethidine N/A clonidine 20 612,320 ethacrynic acid N/A
guanadrel N/A Antihistamines diphenhydramine 7 222,661 chlorpheniramine, 28 858,091 hydroxyzine, 20 509,559 cyproheptadine, 5 79,370 promethazine, 29 759,024 tripelennamine,dexchlorpheniramine N/A orphenadrine 3 70,092

38
cimetidine 21 478,7515
Platelet inhibitors ticlopidine 9 328,090 Short acting dipyridamole(Persantine®) 5 145,452
Gastrointestinal antispasmodic drugs dicyclomine, 11 388,012 hyoscyamine, 15 593,071 propantheline, 1 18,201 belladonna alkaloids 2 81,722
Muscle relaxants and antispasmodic drugs methocarbamol, 9 190,730 carisoprodol, 16 614,545
oxybutynin (excluding Ditropan XL®), 16 459,193 metaxalone, 8 216,340 cyclobenzaprine, 19 578,702 chlorzoxazone 4 42,328
Antibiotics nitrofurantoin 19 569,343
Amphetamines and anorexic agents 3 23,569 Stimulant laxatives
bisacodyl, 3 101,230 cascara sagrada, N/A castor oil (Neoloid®) N/A
Hormone estrogens only(oral) 9 83,443 methyltestosterone N/A isoxsurpine N/A
doxazosin 37 922,495 Short acting nifedipine(Procardia® and Adalat®) 5 207,412 mineral oil N/A desiccated thyroid 13 447,451
Benzodiazepines Lorazepam(if exceed 3 mg daily) N/A Oxazepam(if exceed 60 mg daily) N/A Alprazolam(if exceed 2 mg daily) N/A Temazepam(if exceed 5 mg daily) N/A Zolpidem(if exceed 0.25 mg daily) N/A Triazolam(if exceed 0.25 mg daily) N/A
Digoxin (if exceed 0.125 mg daily) 54 11,618,744 Ferrous Sulfate (if exceed 325 mg daily) N/A Reserpine (if exceed 0.25 mg daily) N/A
TOTAL 407 2,093,341

39
6.2.1 Results of Descriptive Analysis:
The results of bivariate comparisons between the patients prescribed and not prescribed
inappropriate medications were shown in Tables 10 and 11. The descriptive analyses showed
significant differences in total expenditures, office based visit expenditures and outpatient
expenditures between patients who used inappropriate medications and who did not in 2001 (See
Table 10). On the other hand, people who took inappropriate prescriptions were more likely to
receive prescriptions and consume more in health services utilizations in the previous year than
their comparators (See Table 11).
A multiple regression model was conducted to access the effect of inappropriate
medication use on expenditures by controlling the previous year health expenditures, total
number of prescriptions, comorbidity conditions, self perceived health status in the prior year,
and social demographic characteristics. Since the distribution of expenditures is highly skewed,
the variable of expenditure in dollars is transformed into natural log in our study. Such a model
will provide us with more reliable information on how patients’ health expenditures will differ
based on the use of PIMs.
6.2.2 Results of Explanatory Analysis
The results of the multiple regression analyses are presented in Table 12. These results
indicate statistically significant differences between elderly patients who were prescribed
inappropriate medications and those who were not after controlling for age, gender, insurance
type, Charlson Comorbidity Index, self perceived health status, total number of prescriptions,
and previous year health expenditures. The case group had significantly higher total and
outpatient expenditures than comparisons, relatively higher inpatient expenditures because the p-
value is just above 0.05, but not statistically increasing expenditures on prescriptions,

40
Table 10 Bivariate comparisons of dependent variables between the patients prescribed (Cases) and not
prescribed (controls) inappropriate medications
Variables Case (115) Control(605) P-Value
TOTEXP01($) 9,292 6,643 0.0221** EMGEXP01($) 178 174 0.9659 INHEXP01($) 3,889 2,904 0.2942 OBVEXP01($) 2,253 1,051 <0.0001* * OUTHEXP01($) 935 386 <0.0011* * RXEXP01($) 1,743 1,385 0.1560 HHCEXP01($) 263 520 0.3665
*0.05>p>0.01 **p<0.01
Table 11 Bivariate comparisons of independent variables between the patients prescribed (Cases)
and not prescribed (controls) inappropriate medications
Variables Case (109) Control(633) P-Value
Gender Female 74.83% 60.45% 0.0023** Male 25.17% 39.55% Race Non-White 15.58% 8.75% 0.1186 White 84.42% 91.25% Insurance Private 53% 58.67% 0.6925 Public 47% 41.24% Uninsured 0 0.09% Mean Age 75.62 75.18 0.5349 Mean No. of Rxs 55.41 42.79 0.0008** Comorbidity Index 0.9804 0.8427 0.3217 SF-12 PCS 00 35.48 35.06 0.9372 TOTEXP00($) 6,588 4,821 0.0221** EMGEXP00($) 154 100 0.3432 INHEXP00($) 2,190 1,814 0.5524 OBVEXP00($) 1,500 791 <0.0001** OUTHEXP00($) 846 422 0.0220* HHCEXP00($) 257 263 0.8633
*0.01<P<0.05 **P<0.01

41
emergency visits, office based visits and homecare facilities after controlling for those
confounders.
Previous year health expenditures in each health utilization services and the total number
of prescriptions used were highly correlated with the increases in following year health
expenditures. The only exception to this was in home care facilities where there were no
significant differences between total number of prescriptions and home care expenditures. Some
of the coefficients of pervious year expenditures were negative because of the transformation of
natural LOG, which still implied that the higher the expenditure in the previous year the more the
expenditure the following year would be.
Based on the results of the model, both the Charlson Comorbidity Index and SF-12 PCS
in the previous year significantly influenced the total health expenditure of the next year. Persons
who had greater Charlson Comorbidity index, indicating that persons had various and severe
disease conditions, and lower SF-12 PCS scores, which implied the worse self-assessment
physical health status of persons in the previous year, tended to consume more health
expenditures in the next year. Another finding is that persons who had the higher SF-12 PCS
score in the previous year were likely to spend more on prescriptions and office based visits but
less on emergency room, inpatient and home care settings.
Increasing age was only correlated with the higher expenditure in home care facility.
Females (they are all >65 in this sample) spent more money on office based visits than males.
Compared with the non-white elderly, the white elderly had higher expenditures of outpatients’
visits. Patients with insurance incurred more health expenditures than those uninsured.

42
The results of logistic regression model in Table 13 demonstrated that patients without
inappropriate medication in the previous year significantly decreased the likelihood of paying
emergency visits, inpatient visits and out patient visits in the following year.
Combining the results of multiple regression model and logistic regression model, we
found that in the emergency department setting, patients who had no emergency visit, no PIM
use, used less prescriptions, remained in better medical conditions, or were younger were more
likely to have no emergency expenditures in the next year; while patients spent more on
emergency visit in the previous year or took more prescriptions in general were likely to spend
more on emergency visits in the next year.
For in-patient visits, patients who had no PIM use, better preexisting health conditions or
non-white elderly tended to have no in-patient cost in the next year. If patients visited the
hospital more often in the previous year and had PIM use and took more prescriptions, they
would more likely to receive in-patient visits in the next year.
In the outpatient visit setting, patients who had no PIM use, no outpatient cost in the
previous year, or non white elderly were less likely to incur outpatient expenditures in the
following year. Patients who had PIM use, spent more on outpatient visits or received more
prescriptions in general were likely to incur more expenditure on outpatient visits the next year.
In homecare facilities, patients who had no home care visits in the previous year or
perceived better health status by themselves in the previous year or were relatively younger,
tended to spend nothing on home care visits the next year. Patients who experienced home care
visits in the previous year, felt worse about their health status or were relatively old, would spend
more on home care the next year.

43
Table 12 The results of the multiple regression models
Variable Model R2 Coefficient S.E. T P-
Value
Total Expenditures (LN) # 0.3377 Prescription use Inappropriate 0.238 0.108 2.21 0.027* Appropriate (Reference) Previous year total expenditure (LN) 0.278 0.037 7.55 <0.001** Total numbers of prescriptions 0.009 0.001 7.31 <0.001** Charlson’s Comorbidity Index 0.077 0.030 2.53 0.010* SF-12 PCS -0.009 0.002 -4.13 <0.001** Age -0.0003 0.006 -0.06 0.9558 Gender Female 0.115 0.082 1.40 0.163 Male (Reference) Race White 0.249 0.134 1.87 0.060 Non-White (Reference) Insurance Private 4.868 1.069 4.56 <0.001** Public 4.602 1.069 4.30 <0.001** Not Insured (Reference)
Prescription Expenditures (LN) 0.3698 Prescription use Inappropriate 0.090 0.146 0.62 0.537 Appropriate (Reference) Previous year prescription expenditure (LN) 0.379 0.058 6.59 <0.001** Total numbers of prescriptions 0.018 0.002 8.60 <0.001** Charlson Comorbidity Index 0.028 0.040 0.70 0.484 SF-12 PCS 0.007 0.003 2.19 0.029* Age 0.003 0.007 0.45 0.650 Gender Female 0.015 0.007 0.58 0.561 Male(Reference) Race White -0.096 0.179 -0.53 0.593 Non-White (Reference) Insurance Private 3.509 1.442 2.43 0.015* Public 3.338 1.442 2.31 0.021* Not Insured (Reference)
Emergency Visits Expenditures (LN) 0.4391
Prescription use Inappropriate 1.035 0.670 1.54 0.124 Appropriate (Reference) Previous year emergency visits expenditure (LN) -0.607 0.053 -11.48 <0.001** Total numbers of prescriptions 0.0176 0.007 2.61 0.0097* Charlson Comorbidity Index -0.032 0.185 -0.12 0.901 SF-12 PCS -0.030 0.016 -1.95 0.053 Age 0.067 0.038 1.74 0.084 Gender Female -0.305 0.599 -0.51 0.612

44
Male (Reference) Race White 0.122 0.961 0.13 0.899 Non-White (Reference) Insurance Private 2.196 6.40 0.34 0.732 Public 1.879 6.40 0.29 0.770 Not Insured(Reference)
Inpatient visit Expenditures (LN) 0.4907 Prescription use Inappropriate 1.480 0.791 1.87 0.062 Appropriate (Reference) Previous year inpatient visit expenditure (LN) -0.652 0.047 -13.73 <0.001** Total numbers of prescriptions 0.014 0.008 1.67 0.096* Charlson Comorbidity Index 0.083 0.197 0.42 0.673 SF-12 PCS -0.065 0.019 -3.28 0.001** Age -0.059 0.045 -1.32 0.188 Gender Female -0.539 0.683 -0.79 0.431 Male (Reference) Race White 2.055 1.191 1.72 0.086 Non-White (Reference) Insurance Private 2.751 8.152 0.34 0.736 Public 1.822 8.158 0.22 0.824 Not Insured(Reference)
Outpatient visit Expenditures (LN) 0.2384 Prescription use Inappropriate 1.949 0.629 3.10 0.002** Appropriate(Reference) Previous year outpatient visit expenditure (LN) -0.437 0.048 -9.13 <0.001** Total numbers of prescriptions 0.017 0.006 2.65 0.008** Charlson Comorbidity Index -0.190 0.179 -1.06 0.292 SF-12 PCS -0.010 0.015 -0.71 0.477 Age -0.032 0.038 -0.81 0.416 Gender Female 0.101 0.554 0.18 0.856 Male (Reference) Race White 2.330 0.968 2.41 0.017** Non-White (Reference) Insurance Private 1.916 7.752 0.25 0.805 Public 0.877 7.756 0.11 0.910 Not Insured(Reference)
Home Care Expenditures (LN) 0.3014
Prescription use Inappropriate 0.388 1.385 0.28 0.780 Appropriate (Reference) Previous year home care expenditure (LN) -0.404 0.080 -5.03 <0.001** Total numbers of prescriptions 0.0138 0.010 1.28 0.205 Charlson Comorbidity Index -0.665 0.343 -1.94 0.056

45
SF-12 PCS -0.081 0.027 -2.97 0.004** Age 0.1302 0.063 2.07 0.041* Gender Female -0.164 1.012 -0.16 0.872 Male (Reference) Race White -0.022 1.516 -0.01 0.988 Non-White (Reference) Insurance Private -2.329 0.962 -2.42 0.017* Public (Reference) Not Insured
Office based visit Expenditures(LN) 0.1285 Prescription use Inappropriate 0.251 0.270 0.93 0.3526 Appropriate (Reference) Previous year office based visit expenditure (LN) 0.261 0.046 5.71 <0.001** Total numbers of prescriptions 0.012 0.003 4.32 <0.001** Charlson Comorbidity Index 0.099 0.076 1.30 0.195 SF-12 PCS 0.015 0.005 2.72 0.007** Age -0.012 0.014 -0.86 0.391 Gender Female 0.521 0.206 2.53 0.012* Male (Reference) Race White 0.053 0.333 0.16 0.873 Non-White (Reference) Insurance Private 4.674 2.671 1.75 0.081 Public 4.183 2.672 1.57 0.118 Not Insured (Reference)
*0.01<p<0.05 **p<0.01 #Bolded variables are dependent variables

46
Table 13 Results of logistic Regression
Dependent Variable: Wald
Emergency Visits Expenditures=0 OR 95% CI Statistics P value
Inappropriate Prescription use 0.535 0.329-0.870 6.3605 0.0117* Previous year emergency visits expenditure=0 0.390 0.244-0.623 15.556 <0.0001** Total numbers of prescriptions 0.994 0.989-0.999 5.5508 0.0185* Charlson Comorbidity Index 0.768 0.672-0.877 15.0955 <0.0001** SF-12 PCS 1.003 0.992-1.014 0.3584 0.5494 Age 0.969 0.942-0.997 4.6905 0.0303* Gender 1.069 0.705-1.623 0.0995 0.7524 Race 1.089 0.617-1.922 0.0871 0.7679 Insurance 1.238 0.832-1.840 1.1093 0.2922 Dependent Variable: Wald Inpatient Visits Expenditures=0 OR 95% CI Statistics P value
Inappropriate Prescription use 0.535 0.333-0.858 6.7345 0.0095* Previous year inpatient visit expenditure =0 0.724 0.454-1.156 1.8297 0.1762 Total numbers of prescriptions 0.996 0.991-1.001 2.8448 0.0917 Charlson Comorbidity Index 0.830 0.727-0.947 7.6327 0.0057** SF-12 PCS 1.012 1.002-1.022 5.2717 0.0217* Age 1.005 0.977-1.033 0.1053 0.7456 Gender 0.897 0.600-1.342 0.2797 0.5969 Race 0.521 0.274-0.989 3.9711 0.0463* Insurance 1.324 0.903-1.941 2.0693 0.1503 Dependent Variable: Wald Outpatient visit Expenditures=0 OR 95% CI Statistics P value Inappropriate Prescription use 0.586 0.377-0.912 5.6182 0.0178* Previous year outpatient visit expenditure =0 0.326 0.230-0.463 39.1962 <0.0001** Total numbers of prescriptions 0.997 0.992-1.002 1.7170 0.1901 Charlson Comorbidity Index 0.938 0.828-1.063 1.0049 0.3161 SF-12 PCS 1.001 0.991-1.010 0.0163 0.8983 Age 1.023 0.998-1.049 3.1349 0.0766 Gender 0.714 0.499-1.022 3.3885 0.0657 Race 0.372 0.207-0.667 10.9847 0.0009** Insurance 1.217 0.873-1.696 1.345 0.2462 Dependent Variable: Wald Home Care Expenditures =0 OR 95% CI Statistics P value
Inappropriate Prescription use 0.976 0.464-2.053 0.0040 0.9495 Previous year home care expenditure=0 0.082 0.043-0.158 55.8671 <0.0001** Total numbers of prescriptions 0.994 0.987-1.000 3.4413 0.0636 Charlson Comorbidity Index 0.973 0.799-1.185 0.0746 0.7848 SF-12 PCS 1.018 1.004-1.033 5.9940 0.0144* Age 0.928 0.893-0.965 13.9122 0.0002** Gender 0.955 0.531-1.718 0.0238 0.8773 Race 0.847 0.375-1.914 0.1593 0.6898 Insurance 1.042 0.606-1.793 0.0223 0.8813
*0.01<p<0.05 **p<0.01

47
6.2.3 Projecting the Expenditure Attributable to PIM
In the previous multiple regression models, although a significant relationship between
expenditure and inappropriate medication use was established, as we used the natural LOG of
expenditure instead of expenditure itself, the coefficient of the estimate is not easy to interpret.
In order to estimate the incremental increase in health expenditure associated with PIM, a
matching method was used. The simple Mahalanobis metric matching within calipers defined by
the propensity score method was used in this study. In the current study, the previous year total
expenditure, prescription expenditure, emergency room visit expenditure, inpatient visit
expenditure, outpatient visit expenditure, office based visit expenditure, homecare expenditure,
total number of prescriptions, Charlson comorbidity index score, SF-12 PCS score, age, gender,
race, insurance type were included to calculate propensity score. The caliper in the study was
used as 0.14 (see the methods section for detail). We also excluded those outliers which were
identified by examining the Cook’s distance and Studentized residual before using the matching
method.
There were 23 subjects removed due to Cook’s distance greater than 0.10 and
Studentized residual of -2 or lower or 2 or greater. The final sample contained 104 cases and the
matched 104 controls. As we can see from Table 14, the covariances between the case and
control group are much more balanced after applying matching method than that prior to
matching (Tables 10, 11). Among these 104 pairs, 60.58% of cases increased the expenditure in
the following year comparing to their controls from $12 to $35,460, 39.42% cases decreased the
expenditure in the next year from $103 to $33,340.
Since the distribution of the expenditures in the next year did not pass the test for
normality, we used the Sign test to assess the difference between the paired case and control

48
group. The 2-tailed p value for the Sign test was 0.0390, which means there was a significant
increase in health expenditures if patients took inappropriate medication use. The median
difference between the two groups was $1,372. The 95% confidence interval for the estimate is
from $118 to $ 2,115.
Table 14 Comparisons for covariances after simple matching method
Variable Cases Controls T Test
(n=100) (n=100) p-value
Mean Age 76.10 75.68 0.67 Total No. of prescriptions 55.04 56.58 0.78 Charlson’s Index 0.9231 0.9326 0.96 SF-12 PCS score 34.59 33.76 0.75 Total Expenditure 2000($) 6229 6345 0.93 Emergency Exp. 2000($) 206 236 0.82 Inpatient Exp. 2000($) 2559 2958 0.73 Office based Exp. 2000($) 986 1034 0.82 Outpatient Exp.2000($) 482 284 0.14 Prescription Exp. 2000($) 1215 1160 0.73 Home care Exp. 2000($) 413 380 0.91
F Test p-Value
Female No. (%) 78(75.00) 75(72.12) 0.64 White No. (%) 87(83.65)) 89(85.58) 0.72 Private Insurance No. (%) 46(44.23) 50(48.08) 0.89
*P-value<0.05

49
CHAPTER 7
DISCUSSION AND CONCLUSION
7.1 Potential Inappropriate Medication Use in the Elderly
Inappropriate medication use in the elderly population is a primary patient safety
concern. According to our literature review, the prevalence of PIM in community-dwelling
elderly is about 17.5%, 23.5% and 21.3% in 1987, 1992 and 1996, respectively, using Beer’s
explicit criteria. In our study, we found that the prevalence of PIM use among the elderly
population in 2000 (27.75%) and 2001 (27.80%) is slightly higher than the previous studies. As
we learn more about drugs and their effect on the elderly and the list of PIM in 2002 explicit
criteria expands, we expect to see great prevalence of PIM use in the elderly. This put our elderly
population at risk of negative health outcome. Additionally, we found more than 5% population
in our study were exposed to 3 or 4 PIMs, which may result in even worse health outcomes and
more health service utilizations (Perri et al 2005, Fu et al 2004, Fick et al 2001).
The most frequently prescribed medications included in our study were propoxyphene,
amitriptyline, naproxen, doxazosin. There is no doubt that propoxyphene is the top
inappropriately prescribed agent, which is consistent with many other studies (Perri et al 2005,
Sloane et al 2002, Lau et al 2004). Although there is consensus on the inappropriateness of
propoxyphene according to studies, we can still find the continuing evidence of its being
prescribed among the elderly. The finding in this study suggests that the need to influence
physicians to correct their prescribing behavior based on the evidence based practice.

50
In the descriptive analysis, we found that patients on PIM incurred significantly higher
expenditures for office based visits and outpatient visits. But, we can not simply conclude that
the difference between patients who had a PIM and those who didn’t is due to the PIM. As we
can see in Table 10, patients who had a PIM tended to take more prescriptions and consume
more for health service utilization in the prior year. So, it is possible that the elderly on PIMs
already had poorer health conditions, which may also explain the difference in expenditures
between these two groups. To control for these confounding variables, a multiple regression
model was used.
After controlling for the pre-existing health status and other covariates, our study
demonstrated that inappropriate prescription medication use was significantly associated with
increased health care expenditures. Patients having PIM incurred more expenses on inpatient
visits and outpatient visits than those who didn’t. In the logistic regression model, we found that
patients having less expenditures tended to be healthier, and had no PIM use. One reason that
PIM use can influence total health care expenditures might be due to drug-related morbidity
among the elderly. This implies a need to improve physicians’ prescribing behaviors and
increase the use of other medications to treat the same condition.
As we know, in retrospective studies, the subjects are not randomly allocated and
selection bias is inevitable. In our study, even though we introduced a wash out period,
covariates such as gender, prescription numbers, expenditure for total health care utilization,
outpatient visits, office based visits of two groups were still significantly different before
matching, which means these two group were quite different other than exposure to PIM or not.
So it’s hard to detect the real economic outcomes attributable to PIM use. Thus, in order to better
estimate the extra expenditures due to PIM use, we applied a propensity score method with

51
simple matching. As we can see from Table 14, the covariates between case and control group
after matching are very similar. The difference average expenditures in the following year
between the two groups are most likely due to PIM use itself. We are 95% confident to conclude
that the real incremental expenditures due to PIMs are between $118 and $2,115 per elderly
annually.
This study appears to be the first to access the relationship between inappropriate
medication use and increased health care expenditures measured by 2002 explicit criteria in a
non institutionalized elderly population. The present study also appears to be the first estimating
the incremental expenditures due to inappropriate prescription medication use among the elderly
after controlling other confounding factors.
7.2 Strength of the Study
Due to the design of the MEPS, the strength of the study is that the results of prevalence
and expenditure estimation are generalizable to the whole non institutionalized U.S. elderly
population. Additionally, no studies of inappropriate medication use had been done using 2002
explicit criteria. So the results in the current study would provide more information than the
previous research.
7.3 Limitations of the Study
Since MEPS data is independent of indication and does not provide information on daily
dosage, medications regarded as inappropriate under certain medical condition or exceeding
certain amount from the explicit criteria are excluded in our study, as a result, the prevalence of
our study is more likely to be underestimated. But the association between the inappropriate
medication use and higher health care expenditures may not be easily violated by such limitation
according to the analysis we did using strength to estimate the dosage in the criteria.

52
In the retrospective cohort study, we could not control all the patient characteristics of the
two groups (case and control). Even though a regression model was used to control as many
variables as could be included in the model, it was not possible for us to include all possible
characteristics of the two groups. For example we were not able to control for possible drug-drug
interactions because of the limitation of the data. If this unobserved characteristic is positively
correlated with inappropriate medication use and additional expenditures, then the impact of high
expenditures on PIM is probably confounded by drug-drug interactions.
In order to reduce the selection bias, we introduced a wash out period and matching
method to estimate the expenditures attributable to patients on PIM, on the other hand, we also
decrease the generalizablity to interpret our result. We should interpret the result with great
caution. Holding all other conditions equal, we estimate that the median annual expenditures
attributable to inappropriate medication use among the non institutional elderly population in the
U.S. are $1,372 per person, with a 95% confidence interval of $118 to $2,115.
7.4 Conclusion
This study used 2002 explicit criteria to explore the prevalence of inappropriate
medication use and examining the association between inappropriate prescriptions use and health
care expenditures among the elderly population at a national level. The study identified
statistically significant relationship from the use of inappropriate medication to higher total
health expenditures, inpatient visit expenditures, outpatient visit expenditures by multiple
regression models. The alarming amount of incremental expenditure estimation per year on
inappropriate medication use suggests more interventions be done to prevent the use of
inappropriate prescriptions in the elderly.

53
References
Aparasu RR, Mort JR. Prevalence, correlates, and associated outcomes of potentially
inappropriate psychotropic use in the community-dwelling elderly. Am J Geriatr Pharmacother
2004; 2:102-111.
Aparasu RR, Mort JR et al. Inappropriate prescribing for the elderly: beers-based review.
Ann Pharmacother. 2000; 34 (3): 338-346.
Arnett RH III, Blank LA, Brown AP et al. National health expenditures, 1988:office of
National Cost Estimates. Health Care Financ Rev 1990; 11:1-41.
ASHP statement on pharmaceutical care. Am J Hosp Pharm 1993; 50:1720-3
Bates DW, Spell N, Cullen DJ et al. The Costs of Adverse Drug Events in Hospitalized
Patients. JAMA 1997; 277:307-311.
Bates DW, Cullen D, Laired N et al. Incidence of Adverse Drug Events and Potential
Adverse Drug Events: Implications for Prevention. JAMA 1995; 274:29-34.
Bates DW, Leape LL, Petrycki S. Incidence and Preventability of Adverse Drug Events
in Hospitalized Adults. J Gen Intern Med. 1993; 8:289-294
Bates DW. Frequency, consequences and Prevention of Adverse Drug Events. J Qual
Clin Prac 1999; 19:13-17.
Beers MH, Ouslander JG et al. Explicit criteria for determining inappropriate medication
use in nursing home residents. Arch Intern Med 1991; 151:1825-1832.
Beers MH. Explicit criteria for determining potentially inappropriate medication use by
the elderly: an update. Arch intern Med 1997; 157: 1531-1536.

54
Bootman JL, Harrison DL, Cox E. The Health Care Cost of Drug-Related Morbidity and
Mortality in Nursing Facilities. Arch Intern Med 1997; 157:2089-2096
Cateruno JM, Emond JA, Camargo CA. Inappropriate Medication Administration to the
Acutely Ill Elderly: A Nationwide Emergency Department Study, 1992-2000. JAGS 2004;
52:1847-1855.
Col N, Fanale JE, Kronholm P. The Role of Medication Noncompliance and Adverse
Drug Reactions in Hospitalizations of the Elderly. Arch Intern Med 1990; 150:841-845.
Cook EF, Goldman L. ‘Asymmetric stratification: An outline for an efficient method for
controlling confounding in cohort studies’, American Journal of Epidemiology,1988;127:626-
639.
Cooper JW. Probable adverse drug reactions in a rural geriatric nursing home population:
A four-year study. J Am Geriatr Soc. 1996; 44:194-197.
Curtis LH, Ostbye T, Sendersky V et al. Inappropriate Prescribing for Elderly Americans
in a Large Outpatient Population. Arch Intern Med 2004; 164:1621-1625.
D’Agostino RB Tutorial in biostatistics propensity score methods for bias reduction in
the comparison of a treatment to a non-randomized control group. Statist Med 1998; 17:2265-81.
Dennehy CE, Kishi DT et al. Drug Related Illness in Emergency Department Patients.
Am J Health Syst Pharm 1996; 53:1422-1426.
Ferguson JA. Patient age as a factor in drug prescribing practices. Can J Ageing 1990;
9:278-95.
FDA Center for Drug Evaluation and Research, http://www.fda.gov/cder/.
Fick DM, Waller JL, Maclean JR et al. Potentially Inappropriate Mediation Use in a
Medicare Managed care Population: Association with higher Costs and utilizations. JMCP 2001;
7:407-413.

55
Fick DM, Cooper JW, Wade WE, et al Updating the Beers Criteria for Potentially
inappropriate Medication Use in older Adults: Results of a US consensus Panel of Experts. Arch
Intern Med 2003; 163:2716-2724.
Fiebach NH, Cook EF, Lee TH et al. Outcomes in patients with myocardial infarction
who are initially admitted to stepdown units:data from the multicenter chest pain study.
American Journal of Medicine 1990;89:15-20.
FU AZ, Liu GG, Christensen DB. Inappropriate Medication Use and Health Outcomes in
the Elderly. JAGS 2004; 52:1934-1939.
Goulding MR. Inappropriate Medication Prescribing for Elderly Ambulatory Care
Patients.Arch Intern Med 2004; 164:305-312.
Gray SL, Hedrick SC et al. Potentially Inappropriate Medication Use in Community
Residential Care Facilities. Ann Pharmacother 2003; 37:988-993.
Hanlon JT, Schmader KE, Koronkowski MJ, and et al. Adverse drug events in high-risk
older outpatients. J Am Geriatr Soc 1997; 45: 945-948.
Hanlon JT, Schmader KE, Ruby CM et al. Suboptimal prescribing in older inpatients and
outpatients. J AM Geriatr Soc. 2001; 49:200-209.
Hanlon JT, Artz MB, Pieper CF et al. Inappropriate Medication Use Among Frail Elderly
Inpatients. Ann Pharmacother 2004; 38:9-14.
Helper CD, Strand LM. Opportunities and Responsibilities in Pharmaceutical Care. Am J
Hosp Pharm 1990; 47:533-543.
Huang B, Bachmann KA, He X et al. Inappropriate Prescriptions for the Aging
Population of the United States: an Analysis of the National Ambulatory Medical Care Survey,
1997. Pharmacoepidemiology and Drug Safety 2002; 11:127-134.

56
Jiang JZ, Franic D. Relationship between Quality of Life and Inappropriate Drug Use: A
Retrospective Analysis in an Elderly Population, poster will be presented at ISPOR 10th Annual
International Meeting, Washington DC, May 15-18, 2005.
Johnson JA, Bootman L. Drug-Related Morbidity and Mortality A Cost-of-Illness Model.
Arch Intern Med. 1995; 155:1949-1956.
Kohn L, Corrigan K, Donaldson M. To Err is Human: Building a Safer Heath System.
Wahsington, DC: Institute of Medicine, Naitonal Academy Press; 2000
Lau DT, Kasper JD, Potter DE et al. Potentially Inappropriate Medication Prescriptions
Among Elderly Nursing Home Residents: Their Scope and Associated Resident and Facility
Characteristics. Health Serv Res 2004; 39:1257-1276.
Lau DT, Kasper JD, Potter DE et al. Hospitalization and Death Associated with
Potentiallly Inappropriate Medication Prescriptions Among Elderly Nursing Home Residents.
Arch Intern Med 2005; 165:68-74.
Lavori PW, Keller MB. Improving the aggregate performance of psychiatric diagnostic
methods when not all subjects receive the standard test. Statist Med 1988; 7:723-737
Lazarou J, Pomeranz BH, Corey PN. Incidence of adverse drug reactions in hospitalized
patients: a meta-analysis of prospective studies. JAMA 1998; 279:1200-1205.
Lindley CM, Tulley MP et al. Inappropriate medication use is a major cause of adverse
drug reactions in the elderly. Age ageing 1992; 21:294-300.
Liu GG, Christensen DB. The Continuing Challenge of Inappropriate Prescribing in the
Elderly: An Update of the Evidence. J Am Pharm Assoc 2002; 42:847-857.
Mahoney JM, Miller SW, Phillipa CR. Impact of an adverse drug reaction reporting
system in a geriatric health care center. Consultant Pharm 1991; 6:907-14.

57
Martin BC, Ganguly R. http://www.rx.uga.edu/main/home/cas/faculty/propensity.pdf
Martin U and George CF. Adverse drug reactions in the elderly: Drug therapy in old
age. George CF (ed.) JON WILEY& SONS: NY, 2000, 73-86.
Montamat SC, Cusack BJ, Vestal RE. Management of drug therapy in the elderly. N Engl
J Med 1989; 321:303-309.
Motheral B, Brook J, Clark MA et al. A checklist for retrospective database studies-
report of the ISPOR task force on retrospective databases. Value In Health 2003; 6:90-97.
Patel P, Zed PJ. Drug-Related visits to Emergency Department: How Big is the Problem?
Pharmacotherapy 2002; 22:915-923.
Perri M, Menon AM, Deshpande AD et al. Adverse Outcomes Associated with
Inappropriate Drug Use in Nursing Homes. Ann Pharmacother 2005; 39:405-11
Perry DP. When Medicine Hurts Instead of Helps. Consultant Pharmacist 1999; 14:1326-
30.
Rathore SS, Mehhta SS et al. Prescription medication use in older Americans: a national
report card on prescribing. Family Medicine 30(10):733-9.
Schmader K, Hanlon JT, Weinberger M, and et al. Appropriateness of medication
prescribing in ambulatory elderly patients. J Am Geriatr Soc 1994; 42:1241-1247.
Senst BL, Achusim LE, Genest RP, et al. Practical Approach to Determining costs and
frequency of Adverse Drug Events in a Health Care Network. Am J Health Syst Pharm.2001;
58:1126-1132.
Sloane PD, Zimmerman S, Brown L et al. Inappropriate Medication Prescribing in
Residential Care/Assisted Living Facilities. JAGS 2002; 50:1001-1011.

58
Soumerai SB, Ross-Degnan D. Inadequate prescription-drug coverage for Medicare
enrollees—a call to action. [erratum appears in N Engl J Med 1999 Mar 25;340(12):976]. New
Engl J Med 340(9):722-8.
Strand LM, Morley PC, Cipolle RJ, et al. Drug-related problems:their structure and
function. DICP 1990; 24:1073-7.
Stuart B, Kamal-Bahl S, Briesacher B et al. Trends in the prescription of inappropriate
Drugs for the Elderly between 1995 and 1999. Am J Geriatr Pharmacother 2003; 1:61-74.
Stuck AE, Beer MH. Steiner A, and et al. Inappropriate medication use in community-
residing older persons. Arch intern Med 1994; 154:2195-2200.

59
APPENDICES

60
AppendixA: Inappropriate Medications for Nursing Home Elderly (Beers, 1991)
Drugs should be avoided Drugs with specific dose and duration
Sedative-hypnotics Long-acting benzodiazepines Short-acting benzodiazepines nightly >4wk Chlordiazepoxide Alprazolam Diazepam Oxazepam single dose>30mg
Flurazepam Triazolam single dose>0.25mg Meprobamate Short-duration barbiturates Antipsychotics Pentobarbital Haloperidol >3mg/d Secobarbital Thioridazine >30mg/d Antidepressants Amitriptyline Antihypertensives Antihypertensives Methyldopa Hydrochlorothiazide >50mg/d Propranolol Reserpine NSAIDs and analgesics Histamine2 blockers Indomethacin Cimetidine >900mg & >12wk Phenylbutazone Ranitidine >300mg & >12wk Propoxyphene Pentazocine Oral Hypoglycemics Antibiotics Chlorpropamide Oral antibiotics >4wk Dementia treatments Cyclandelate Isoxsuprine Decongestants Daily >2 wk Platelet inhibitors Oxymetazoline Dipyridamole Phenylephrine Muscle relaxants-antispasmodics Pseudoephedrine Cyclobenzaprine Orphenidrate Methocarbamol Iron >325mg/d Carisoprodol Antiemetics Trimethobenzamide GI antispasmodics Long-term

61
Appendix B: Beers Criteria Drug List: Independent of Diagnosis (Beers, 1997)
Prescription classes or individual agents Reasons of concern for elderly Severity
Analgesics NSAIDs Phenylbutazone Indomethacin Narcotics Propoxyphene and combination products Pentazocine Meperidine
May produce serious hematological side effects. Produce the most central nervous system side effects. Cause central nervous system side effects. Cause more central nervous system side effects. Have many disadvantages to other narcotics.
Low Low Low High High
Dementia treatment Ergot mesyloids, cyclospasmol
Not effective in the doses studied.
Low
Sedative or hypnotic agents All barbituates except Phenobarbital Meprobamate
Cause more side effects than other drugs and addictive. Highly addictive and sedating anxiolytic.
High High
Antiemetics Trimethobenzamide
Least effective and cause extrapyramidal side effects.
Low
Benzodiazepine hypnotics Flurazepam Chlordiazepoxide and Diazepam
Extremely long half-life in the elderly, producing prolonged sedation and increasing the incidence of falls and fractures.
High High
Hypoglycemic agents Chlorpropamide
Cause SIADH. Its prolonged half-life can cause prolonged and serious hypoglycemia.
High
Antiarrhythmic drugs Disopyramide
Strongly anticholinergic. Most potent negative inotrope and may induce heart failure in the elderly.
High
Antidepressants Doxepin Amitriptyline
Strong anticholinergic and sedating. Strong anticholinergic and sedating.
High High
Antihypertensives Methyldopa Reserpine
May cause bradycardia and exacerbate depression. Induce depression, impotence, sedation, orthostatic hypotension.
High Low
Antihistamines Diphenhydramine Chlorpheniramine, diphenhydramine, hydroxyzine, cyproheptadine, promethazine, tripelennamine, dexchlorpheniramine
Potently anticholinergic properties. Potently anticholinergic properties.
Low Low
Platelet inhibitors Ticlopidine Dipyridamole
Considerably more toxic. Aspirin is better alternative. Cause orthostatic hypotension in the elderly.
High Low

62
Appendix B: (Continued)
Prescription classes or individual agents Reasons of concern for elderly Severity
Gastrointestinal antispasmodic drugs Dicyclomine, hyoscyamine, propantheline, belladonna alkaloids
Highly anticholinergic and produce substantial toxic effects. Effective doses tolerated by the elderly is questionable.
High
Muscle relaxants and antispasmodic drugs Methocarbamol, carisoprodol, oxybutynin, chlorzoxazone, metaxalone, cyclobenzaprine
Poorly tolerated, leading to anticholinergic side effects, sedation, weakness. Effective doses tolerated by the elderly is questionable.
Low
Benzodiazepines Lorazepam (if exceed 3 mg daily) Oxazepam (if exceed 60 mg daily) Alprazolam (if exceed 2 mg daily)
Temazepam (if exceed 15 mg daily) Zolpidem (if exceed 5 mg daily)
Triazolam (if exceed 0.25 mg daily)
Because of increased sensitivity to
benzodiazepines in the elderly, smaller doses may be effective as well as safer. Total daily
doses should rarely exceed the following suggested maximums.
Low
Digoxin (if exceed 0.125 mg daily) Because of decreased renal clearance, doses should rarely the suggested maximum daily.
High
Iron supplements (if exceed 325 mg daily) When doses are higher, total absorption is not substantially increased, but constipation is more
likely to occur.
Low
Note: NSAID = Nonsteroidal anti-inflammatory drugs. SIADH = Syndrome of inappropriate antidiuretic hormone.
Appendix C: Summary of Changes in 2002 Explicit Criteria List from 1997 Beers Criteria: Independent of Diagnosis (Fick
et al, 2003 )
Medicines Modified from 1997 Beers Criteria
1.Reserpine 3. Iron supplements>325 mg 2.Extended-release oxybutynin 4. Short-acting dipyridamole
Medicines Dropped from 1997 Beers Criteria
Phenylbutazone
Medicines Added in 2002 Criteria
1.Ketorolac tromethamine 15.Desiccated thyroid 2.Orphenadrine 16.Ferrous sulfate>325mg 3.Guanethidine 17.Amphetamines 4.Guanadrel 18.Thioridazine 5.Cyclandelate 19.Short-acting nifedipine 6.Isoxsuprine 20.Daily fluoxetine 7.Nitrofurantoin 21.Stimulant laxatives may 8.Doxazosin exacerbate bowel dysfunction 9.Methyltestosterone 22.Amiodarone 10.Mesoridazine 23.Non-COX-selective NSAIDs 11.Clonidine 24.Reserpine doses >0.25 12.Mineral oil 25.Estrogens in older women 13.Cimetidine 14.Ethacrynic acid