Embed Size (px)
Citation preview

The Presentation Effect on Graphical PasswordsJulie Thorpe
University of OntarioInstitute of Technology
Muath Al-BadawiUniversity of Ontario
Institute of [email protected]
Brent MacRaeUniversity of Ontario
Institute of [email protected]
Amirali Salehi-AbariUniversity of Toronto
Dept. of Computer [email protected]
ABSTRACTWe provide a simple yet powerful demonstration of how anunobtrusive change to a graphical password interface canmodify the distribution of user chosen passwords, and thuspossibly the security it provides. The only change to the inter-face is how the background image is presented to the user inthe password creation phase—we call the effect of this changethe “presentation effect”. We demonstrate the presentation ef-fect by performing a comparative user study of two groups us-ing the same background image, where the image is presentedin two different ways prior to password creation. Our resultsshow a statistically different distribution of user’s graphicalpasswords, with no observed usability consequences.
Author Keywordsuser authentication; passwords; graphical passwords
ACM Classification KeywordsH.5.2. Information Interfaces and Presentation; K.6.5 Man-agement of Computing and Information Systems: Securityand Protection
INTRODUCTIONGraphical passwords [1] are an alternative to traditional textpasswords where users choose an image (or some of its parts)instead of a word. Many graphical password schemes havebeen proposed; unfortunately, many studies have shown thatusers often create graphical passwords with similar propertiesthat make them easy for attackers to guess [4, 9, 10]. Surpris-ingly, little attention has been given to understanding how theuser interfaces of these systems impact their security.
Motivated by this, we study graphical passwords under whatwe call the presentation effect – the effect that presenting anobject’s informative components in a different order has on
Permission to make digital or hard copies of all or part of this work for personal orclassroom use is granted without fee provided that copies are not made or distributedfor profit or commercial advantage and that copies bear this notice and the full cita-tion on the first page. Copyrights for components of this work owned by others thanACM must be honored. Abstracting with credit is permitted. To copy otherwise, or re-publish, to post on servers or to redistribute to lists, requires prior specific permissionand/or a fee. Request permissions from [email protected] 2014, April 26 - May 01 2014, Toronto, ON, Canada.Copyright c© 2014 ACM 978-1-4503-2473-1/14/04...$15.00.http://dx.doi.org/10.1145/2556288.2557212
the viewer’s perception and decision making processes. Con-sider the presentation effect upon entering a hotel for the firsttime; you enter through the main door, then walk through thelobby, and finally each hallway. Now again consider enteringthe same hotel for the first time, but instead you take a differ-ent path, entering through the emergency side door, walkingthrough each hallway, and finally going to the lobby. Are yourperceptions of the hotel the same in each case? If you plan tovisit the hotel again at a later time, are you more inclined totake the same path? We aim to study the presentation effecton the creation of graphical passwords, how it alters the dis-tribution of user choice, and whether it impacts usability.
We focus on a form of graphical password known as Pass-Points [14] as it is known to suffer from patterns in the dis-tribution of user choice [10]. In PassPoints, a user is showna background image and then asked to select a sequence of5 click-points as his/her password. This style of graphicalpassword can be input using a mouse or a finger (on a touchscreen), but to reduce its vulnerability to observation attacksit can be input using an eye tracker as in other systems [6, 2].
We studied a variant of PassPoints with two different im-age presentations in the password creation phase: the imageis initially covered with a white foreground (a curtain), andthe curtain is drawn from either right-to-left (RTL) or left-to-right (LTR), gradually revealing the image beneath. Theusers watch the image reveal completely before creating theirgraphical password, thus any effect we observe is not due tousers desire to choose a password quickly. The image presen-tations are only used just before password creation; all otherinteractions with the system display the full background im-age to the user (as in the original version of PassPoints).
Our results demonstrate a statistically significant differencein the distribution of the first click-points of users in the RTLvs. LTR groups, with no observed negative usability conse-quences. We discuss the security and usability implications ofthese findings and some exciting possibilities for future work.
RELATED WORKThe literature on graphical passwords is rich (see a recent sur-vey [1] for an exposition). The present research is based on a“cued-recall” scheme called PassPoints [14], in which a pass-
word is a sequence of 5 (x, y) click-points on a backgroundimage. The user logs in by clicking on the same sequence of5 points, in the same order. A small amount of error toleranceis permitted upon re-entering these click-points, e.g., otherstudies have allowed up to 7-10 pixels for each click-point.
PassPoints suffer from security problems caused by userschoosing popular points [10] which help the success of au-tomated attacks [4, 9]. To counter these vulnerabilities, somepersuasive techniques have been proposed that limit user’schoice at the password creation phase to deter users fromchoosing popular points. One approach, Persuasive CuedClick Points [3], is based on a different cued-recall variant,and uses a randomly placed viewport containing a small re-gion of the image where the user can choose his/her point.Another approach [2] uses saliency masks to reduce interestin the salient and presumably more attractive parts of the im-age. Our approach in this paper does not limit user’s choicesby making parts of the background image unavailable, butrather aims to influence user’s choices in an unobtrusive way.
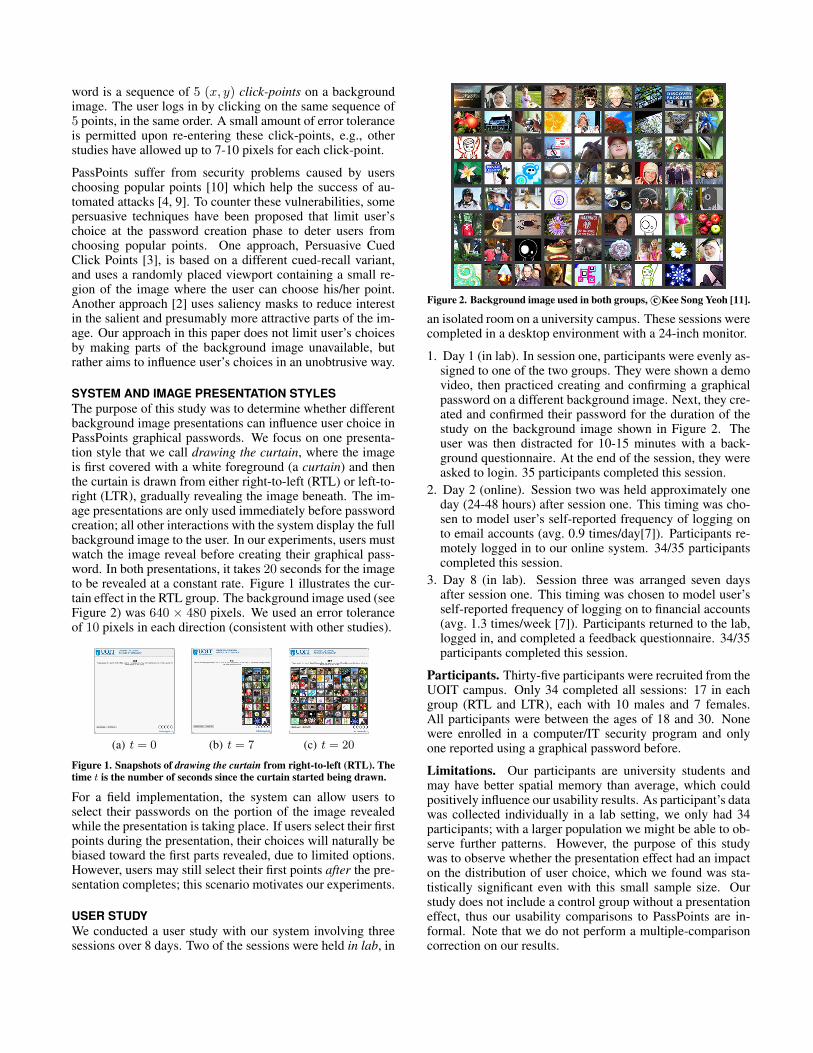
SYSTEM AND IMAGE PRESENTATION STYLESThe purpose of this study was to determine whether differentbackground image presentations can influence user choice inPassPoints graphical passwords. We focus on one presenta-tion style that we call drawing the curtain, where the imageis first covered with a white foreground (a curtain) and thenthe curtain is drawn from either right-to-left (RTL) or left-to-right (LTR), gradually revealing the image beneath. The im-age presentations are only used immediately before passwordcreation; all other interactions with the system display the fullbackground image to the user. In our experiments, users mustwatch the image reveal before creating their graphical pass-word. In both presentations, it takes 20 seconds for the imageto be revealed at a constant rate. Figure 1 illustrates the cur-tain effect in the RTL group. The background image used (seeFigure 2) was 640 × 480 pixels. We used an error toleranceof 10 pixels in each direction (consistent with other studies).
(a) t = 0 (b) t = 7 (c) t = 20
Figure 1. Snapshots of drawing the curtain from right-to-left (RTL). Thetime t is the number of seconds since the curtain started being drawn.
For a field implementation, the system can allow users toselect their passwords on the portion of the image revealedwhile the presentation is taking place. If users select their firstpoints during the presentation, their choices will naturally bebiased toward the first parts revealed, due to limited options.However, users may still select their first points after the pre-sentation completes; this scenario motivates our experiments.
USER STUDYWe conducted a user study with our system involving threesessions over 8 days. Two of the sessions were held in lab, in
Figure 2. Background image used in both groups, c©Kee Song Yeoh [11].
an isolated room on a university campus. These sessions werecompleted in a desktop environment with a 24-inch monitor.
1. Day 1 (in lab). In session one, participants were evenly as-signed to one of the two groups. They were shown a demovideo, then practiced creating and confirming a graphicalpassword on a different background image. Next, they cre-ated and confirmed their password for the duration of thestudy on the background image shown in Figure 2. Theuser was then distracted for 10-15 minutes with a back-ground questionnaire. At the end of the session, they wereasked to login. 35 participants completed this session.
2. Day 2 (online). Session two was held approximately oneday (24-48 hours) after session one. This timing was cho-sen to model user’s self-reported frequency of logging onto email accounts (avg. 0.9 times/day[7]). Participants re-motely logged in to our online system. 34/35 participantscompleted this session.
3. Day 8 (in lab). Session three was arranged seven daysafter session one. This timing was chosen to model user’sself-reported frequency of logging on to financial accounts(avg. 1.3 times/week [7]). Participants returned to the lab,logged in, and completed a feedback questionnaire. 34/35participants completed this session.
Participants. Thirty-five participants were recruited from theUOIT campus. Only 34 completed all sessions: 17 in eachgroup (RTL and LTR), each with 10 males and 7 females.All participants were between the ages of 18 and 30. Nonewere enrolled in a computer/IT security program and onlyone reported using a graphical password before.
Limitations. Our participants are university students andmay have better spatial memory than average, which couldpositively influence our usability results. As participant’s datawas collected individually in a lab setting, we only had 34participants; with a larger population we might be able to ob-serve further patterns. However, the purpose of this studywas to observe whether the presentation effect had an impacton the distribution of user choice, which we found was sta-tistically significant even with this small sample size. Ourstudy does not include a control group without a presentationeffect, thus our usability comparisons to PassPoints are in-formal. Note that we do not perform a multiple-comparisoncorrection on our results.

RESULTSWe report on how the image presentations used influenceduser’s graphical password selections, user perceptions of theirselection strategies, and usability. Data is reported from the34 participants who completed the study.
Effect on Password SelectionsWe highlight that users only began creating their graphicalpasswords after the image was fully revealed, thus any effectdemonstrated is not due to users aiming to choose a passwordfaster. We analyze the effect of drawing the curtain left-to-right (LTR) and right-to-left (RTL) on users’ graphical pass-word selections. Recall that a graphical password, for bothLTR and RTL groups, is a sequence of 5 (x, y) click-points.
Of special interest to us is the question of whether the twoexperimental groups exhibit the same distribution over the ithclick points. As our study has tested drawing the curtain intwo horizontal directions, we are interested to see the effecton the distribution of click-points over the x axis (i.e., alongthe image width). We let x(l)
ij and x(r)ij denote the x coordinate
of the ith click point, associated with subject j in LTR andRTL experimental groups, respectively. We formulate fivenull hypotheses in the form of
Hi0: the two samples
(x(l)i1 , · · · , x
(l)in
)and
(x(r)i1 , · · · , x(r)
in
)come from the same distribution,
where Hi0 refers to the distribution of the x coordinates of
the ith click-points for our two experimental groups, i ∈{1, · · · , 5}, and n = 17 in our study.
We ran the two-tailed Mann-Whitney U test for each of thesefive null hypotheses. We found that the test rejects H1
0 withp = 0.019 (U score=76), implying that the distribution of thefirst click-point’s x coordinates are statistically different be-tween the two groups. The effect size is |r| = 0.405, whichis medium-large by Cohen’s convention. The test fails to re-ject Hi
0 for i ≥ 2, suggesting that the 2nd, 3rd, 4th, and 5th
click-point distributions are not statistically different. Notethe p-value above does not include a multiple-test correction(e.g., Bonferroni, which would more conservatively suggestthat p = 0.091). Finally, we visualize these first click-pointsin Figure 3. In the RTL group, 14/17 chose their points inthe 5 rightmost columns of the image, and in the LTR group,13/17 chose their points in the 5 leftmost columns of the im-age. Interestingly, the remaining 3 and 4 in each group chosetheir first click-point in the last two columns revealed.
User Perception of Password SelectionsAlthough the data analysis in the last section shows that ap-proximately 80% of users chose their first point from the first5 columns of the image revealed, only 38% (13/34) usersagreed or strongly agreed with the statement that their strat-egy for choosing a graphical password involved the first ob-ject that drew their attention. This suggests that although theimage presentations influenced their first click-point choices,users may not have been aware of this influence. We surveyeduser’s self-reported password creation strategies and foundthat most users 85% (29/34) agree or strongly agree that theyused colours, shapes, patterns, and/or letters for selecting
Figure 3. The first click-points for all users, with background imagefaded to show points more clearly (squares for LTR, triangles for RTL).
their password points. We hypothesize that the remainingpoints are chosen based on similarity of shapes, colours, orpatterns; we leave testing this hypothesis as future work.
UsabilityWe evaluate the usability of the system in terms of logintimes, memorability, and user acceptance, finding that the im-age presentation did not have a negative impact when infor-mally compared to other PassPoints studies [14].
Login Time. The mean login time for sessions 1, 2, and 3 were23, 25, and 22 seconds respectively. These login times (mea-sured from image display until login success) appear compa-rable to the mean login time of 24 seconds found in previousPassPoints studies [14]. The mean time to create a graphicalpassword was 75 seconds, which is a bit higher than previ-ous studies on PassPoints that found a mean creation timeof 64 seconds [14]. This may be because the creation timerecorded includes the time the user is watching the image be-ing revealed, which takes 20 seconds.
Memorability. The memorability of the system was verygood; only one password reset occurred. Only 3% (1/34) ofusers had more than 2 login failures one week after passwordcreation, which is a better result than in previous PassPointsstudies [14], where 30% (6/20) had more than 5 login failures.
Acceptability. We asked the participants about their opinionregarding the way the background image was shown. Themajority (80%) of participants had no problem with the im-age presentation. Only 3% did not like it, and 12% indicatedthat they did not like it at the time but are OK with it now(remaining 5% with no opinion).
DISCUSSION OF SECURITY IMPLICATIONSOur simple modification to the PassPoints user interface re-sulted in different distributions of user’s first click-points onthe same background image. Since different first click-pointsresult in different graphical passwords, we have modified thepassword distribution for a given background image, simplyby presenting it differently to the user upon password cre-ation. The image presentations used in password creation isunknown to an adversary, and provided there are enough pre-sentations possible to be used, it complicates hot-spot analy-ses that could be used to inform guessing attacks. Password
system designers can make use of our findings by implement-ing a set of presentation styles to complicate password predic-tion and consequently increase the system’s effective security.
For the purpose of demonstration, the present study only fo-cuses on two opposite image presentations, but one can imag-ine many different presentations that might produce similarresults. If we only consider curtain presentations as in thepresent study, there are 8 possible when we consider pullingcurtains in 2 vertical, 2 horizontal, and 4 diagonal directions.We can also consider growing style presentations that start byrevealing a small circle in a randomly placed position on thebackground image, and as the circle grows, it slowly revealsthe entire image. Another alternative is a pop-up style presen-tation where the image is decomposed into different chunksand the chunks appear in random order.
The risk of shoulder-surfing a users’ presentation style dur-ing password creation can be mitigated by using LCD screenswith concurrent dual views [8]. Even if an adversary observesor somehow determines a user’s presentation style, it mayhelp them predict the first click-points but not the remainingfour. Based on our collected data (see Figure 3), about 80%of first click-points can be found in the first-revealed half ofthe image (vs. the whole image).
Of interest is that the presentation effect seems to influencethe first click-point, but apparently not the remaining points.For security, this is likely a good thing; if the remaining pointswere to have a predictable pattern conditional on the presen-tation style, then the adversary could easily compile a listof highly probable passwords for each possible presentationstyle that a target system offers. However, to determine thesecurity that the presentation effect will offer in practice, weneed to run larger scale studies, which is future work.
The presentation effect can possibly enhance the security ofPassPoints by an order of the number of presentation styles.However, one might also use this technique beyond the firstclick-point. For example, it could be applied before each pos-sible click-point in PassPoints, or for every image of multi-image graphical passwords (e.g., CCP [3]). The presentationeffect may also be useful in other knowledge-based schemes.
CONCLUDING REMARKS AND FUTURE WORKWe have demonstrated that the presentation effect is a sim-ple, unobtrusive, and acceptable way to modify the distribu-tion of user choice in graphical passwords. We found thatimage presentations significantly modified the distribution ofuser’s first click-points, which adds an unknown element foran adversary attempting to discover the distribution of popu-lar points for a target user’s background image. The resultsof our user study indicate that using the presentation effectfrom horizontally drawing the curtain does not have negativeusability consequences. We also found that the system is ac-ceptable to users, which is sensible given that it does not limitallowable click-points on the background image.
The positive findings of our study raise the question ofwhether the presentation effect might be useful for influenc-ing users to create secure choices in other password schemes.For example, the distribution of text passwords might benefit
from presenting a word cloud or a scrabble board contain-ing different concepts immediately before password creation.Future work includes investigation of such presentation ef-fects in text passwords, CCP [3], Background Draw-A-Secret[5], map-based authentication systems [12], video-passwords[13], and text passwords. Investigation of more diverse pre-sentation styles, faster presentations (< 20 sec.), and under-standing their security/usability impact is also of interest.
ACKNOWLEDGMENTSWe thank our user study participants. This research was sup-ported by the Natural Sciences and Engineering ResearchCouncil of Canada (NSERC).
REFERENCES1. Biddle, R., Chiasson, S., and Oorschot, P. C. van.
Graphical Passwords: Learning from the First TwelveYears. ACM Computing Surveys 44(4) (2012).
2. Bulling, A., Alt, F., and Schmidt, A. Increasing theSecurity of Gaze-based Cued-recall GraphicalPasswords Using Saliency Masks. In CHI (2012).
3. Chiasson, S., Stobert, E., Forget, A., Biddle, R., andOorschot, P. C. van. Persuasive Cued Click-Points:Design, Implementation, and Evaluation of aKnowledge-Based Authentication Mechanism. IEEETDSC 9(2) (2011), 222–235.
4. Dirik, A., Memon, N., and Birget, J.-C. Modeling UserChoice in the PassPoints Graphical Password Scheme.In SOUPS (2007).
5. Dunphy, P., and Yan, J. Do Background Images ImproveDraw-A-Secret Graphical Passwords? In ACM CCS(2007).
6. Forget, A., Chiasson, S., and Biddle, R.Shoulder-Surfing Resistance with Eye-Gaze Entry inCued-Recall Graphical Passwords. In CHI (2010).
7. Hayashi, E., and Hong, J. A Diary Study of PasswordUsage in Daily Life. In CHI (2011).
8. Kim, S., Cao, X., Zhang, H., and Tan, D. EnablingConcurrent Dual Views on Common LCD Screens. InCHI (2012).
9. Oorschot, P. C. van, Salehi-Abari, A., and Thorpe, J.Purely Automated Attacks on Passpoints-StyleGraphical Passwords. IEEE TIFS 5, 3 (2010), 393–405.
10. Oorschot, P. C. van, and Thorpe, J. ExploitingPredictability in Click-Based Graphical Passwords. JCS19, 4 (2011), 669–702.
11. Song Yeoh, K. (Photograph Courtesy of), 2013.12. Thorpe, J., MacRae, B., and Salehi-Abari, A. Usability
and Security Evaluation of GeoPass: a GeographicLocation-Password Scheme. In SOUPS (2013).
13. Thorpe, J., Salehi-Abari, A., and Burden, R.Video-passwords: Advertising while authenticating. InNSPW (2012).
14. Wiedenbeck, S., Waters, J., Birget, J., Brodskiy, A., andMemon, N. PassPoints: Design and LongitudinalEvaluation of a Graphical Password System. Int. J. ofHuman-Computer Studies 63, 1-2 (2005), 102–127.