Embed Size (px)
Citation preview

The Pre-Global-Financial-Crisis Slowdown in Productivity*
Gilbert Cette Banque de France
John Fernald Federal Reserve Bank of San Francisco
Benoît Mojon
Banque de France
September 22, 2015
Abstract
Slow productivity growth has been a striking feature of the recovery from the Global Financial Crisis (GFC). For major advanced economies, we highlight that this slow underlying trend had its origins prior to the GFC. The pre-GFC timing suggests that it is important to consider factors other than just the deep crisis itself or policy changes since the crisis. For the United States, at the frontier of knowledge, we highlight that there was a brief burst of innovation and reallocation related to the production and use of information technology in the second half of the 1990s and the early 2000s. But that burst ran its course prior to the GFC. Continental European economies were falling back relative to that frontier at varying rates since the mid-1990s. We emphasize (i) labor- and product-market regulations in France and Germany that prevented favorable IT-related resource reallocations; and (ii) the unfavorable resource reallocations that did happen in response to capital inflows to Italy and Spain. We also discuss the potential roles of mismeasurement as well as the crisis itself.
* Please address correspondence to [email protected]. We thank Andrew Tai and
Bing Wang for helpful research assistance. The views in this paper are those of the authors and do not necessarily reflect the views of the Federal Reserve Bank of San Francisco, the Banque de France, or anyone else associated with those institutions.

Since the Global Financial Crisis (GFC) began in 2007, productivity growth in advanced
economies has continually surprised to the downside.1 A severe downturn and slow recovery
could affect productivity through various channels, both cyclical and structural. But, as we
emphasize, the slowdown in advanced-economy total-factor productivity (TFP) growth was
broadly underway prior to the crisis. 2 The pre-GFC timing suggests the importance of factors
other than just the deep crisis (or ensuing policy changes) itself.
To understand the evolution of advanced-economy TFP growth prior to the crisis, we
highlight three broad factors that have shaped the global economy in recent decades: Technical
change, structural rigidities, and capital flows. Each factor has attracted considerable analysis
and attention but not, typically, together. For expositional clarity, we focus on a small number of
major advanced economies: the US, the four main Euro Area countries (Germany, France, Italy
and Spain) and the UK. For the United States, which we assume is at the frontier of knowledge,
we highlight the temporary burst of innovation and reallocation related to the production and use
of information technology in the late 1990s and early 2000s. But that burst ran its course prior to
the GFC. For continental Europe, we emphasize changes in the distance to the frontier that
started in the mid-1990s: (i) Favorable resource reallocations that did not happen because of
labor- and product-market rigidities (France, Germany, Italy and Spain); and (ii) also the
unfavorable reallocations that did happen in response to capital inflows (Italy and Spain).
1 This is written in the second half of 2015. See, for example, Tett (2015). 2 Other studies that emphasize the pre-crisis slowdown across advanced economies include OECD (2015),
IMF (2015), Bergeaud, Cette, and Lecat (2014) and Crafts and O’Rourke (2013). For the United States, Fernald (2014a) and Byrne, Oliner, and Sichel (2013) contain references. An early analysis is by Jorgenson, Ho, and Stiroh (2008).
2
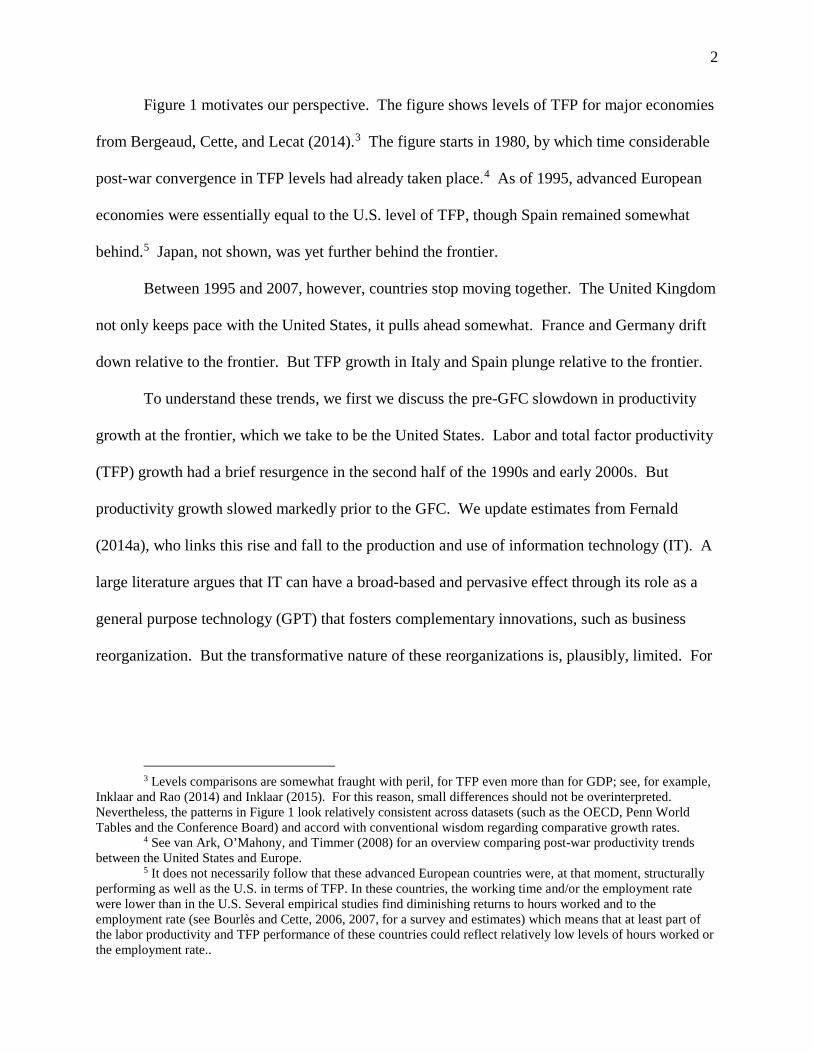
Figure 1 motivates our perspective. The figure shows levels of TFP for major economies
from Bergeaud, Cette, and Lecat (2014).3 The figure starts in 1980, by which time considerable
post-war convergence in TFP levels had already taken place.4 As of 1995, advanced European
economies were essentially equal to the U.S. level of TFP, though Spain remained somewhat
behind.5 Japan, not shown, was yet further behind the frontier.
Between 1995 and 2007, however, countries stop moving together. The United Kingdom
not only keeps pace with the United States, it pulls ahead somewhat. France and Germany drift
down relative to the frontier. But TFP growth in Italy and Spain plunge relative to the frontier.
To understand these trends, we first we discuss the pre-GFC slowdown in productivity
growth at the frontier, which we take to be the United States. Labor and total factor productivity
(TFP) growth had a brief resurgence in the second half of the 1990s and early 2000s. But
productivity growth slowed markedly prior to the GFC. We update estimates from Fernald
(2014a), who links this rise and fall to the production and use of information technology (IT). A
large literature argues that IT can have a broad-based and pervasive effect through its role as a
general purpose technology (GPT) that fosters complementary innovations, such as business
reorganization. But the transformative nature of these reorganizations is, plausibly, limited. For
3 Levels comparisons are somewhat fraught with peril, for TFP even more than for GDP; see, for example,
Inklaar and Rao (2014) and Inklaar (2015). For this reason, small differences should not be overinterpreted. Nevertheless, the patterns in Figure 1 look relatively consistent across datasets (such as the OECD, Penn World Tables and the Conference Board) and accord with conventional wisdom regarding comparative growth rates.
4 See van Ark, O’Mahony, and Timmer (2008) for an overview comparing post-war productivity trends between the United States and Europe.
5 It does not necessarily follow that these advanced European countries were, at that moment, structurally performing as well as the U.S. in terms of TFP. In these countries, the working time and/or the employment rate were lower than in the U.S. Several empirical studies find diminishing returns to hours worked and to the employment rate (see Bourlès and Cette, 2006, 2007, for a survey and estimates) which means that at least part of the labor productivity and TFP performance of these countries could reflect relatively low levels of hours worked or the employment rate..

3
example, once retailing was reorganized to take advantage of faster information processing, the
gains may have become more incremental.
Second, for France, Germany Italy and Spain, we highlight how labor and product market
regulations made these favorable IT-related reallocations more difficult. This view, which has
arguably been the conventional wisdom since at least the mid-2000s, reflects reallocations that
never happened, especially in market services such as distribution and transportation.6 In other
words, the relative weakness in European productivity growth reflected the interaction of within-
country institutions and changes in global technology.
Third, for peripheral European economies such as Italy and Spain, these interactions
appear to have led to increasing misallocation. That is, substantial reallocations did occur but
reduced productivity. Since at least the introduction of the euro in 1999, TFP growth in Italy,
Spain, and Portugal have been negative.7 In the context of Italy, Hassan and Ottaviano (2013)
describe this as “the great unlearning” of negative TFP growth. Reis (2013) argues that
misallocation increased in Portugal. For Spain and Italy, Gopinath et al (2015) also find
evidence of increased misallocation in the runup to the crisis. In other words, reallocations of
resources across firms made the average efficiency of businesses worse.
Reis (2013), Gopinath et al (2015), and Gorton-Ordonez (2015) provide models to
explain why capital flows might have worsened the problem of misallocation and weak
productivity growth. For example, in the Reis (2013) shows how, capital flows into a country
that has inefficient financial intermediation decrease real interest rates and induce changes in the
composition of entrepreneurs. Because the return on levered project is higher and the return on
6 See Inklaar (2015), Bourlès, Cette, Lopez, Mairesse, and Nicoletti (2013), Cette, Lopez, and Mairess
(2013), and van Reenen (2010) for references and discussion. This draft so far has little new evidence on this point. 7 We do not focus on Portugal in this paper because of its smaller size.

4
“deposits” decreases more entrepreneurs embark on creating firms. In addition, an inefficient
domestic financial system overcomes information asymmetries by allocating funds as a function
of collateral rather than through the screening of the most productive firms. This puts a cap on
the borrowing capacity of entrepreneurs and limits the ability of the post productive ones to
expand, leaving market shares for less efficient ones. In Reis’ model, capital inflows reduce the
average productivity in the economy by lowering the bar for less productive entrepreneurs.
This mechanism can be compounded by a boom in consumption whereby tradables are
imported and non-tradable are produced by local, typically small and not so efficient firms.
Kalantzis (2014) shows that the share of non-tradables in domestic output typically increases
following episodes of capital inflows (see also Benigno et al., 2015). And Gopinath et al (2015)
show that in Italy, Spain and Portugal the misallocation described in the model of Reis seem to
have also increased within the manufacturing sector since the launch the euro in 1999.
We provide new macroeconomic evidence that is consistent with this link between lower
real interest rates and weaker productivity growth. In particular, we test Reis’ model implication
that negative shocks to long-term interest rates should reduce productivity growth. Preliminary
evidence, either from an identified VAR estimated for the euro area, the UK and the US, or from
fixed-effect regression on a panel of 16 OECD countries, support this conjecture.
And given that real interest rates fell the most abruptly in peripheral Europe, their effect
of real rates on productivity is larger in Spain and in Italy than in Germany, France, the UK or
the US.
To summarize, advanced-economy productivity trends in the runup to the crisis involve a
slowdown at the frontier; and important interactions between country-specific institutions and
the shocks that hit the global economy. The four considered Euro Area countries were not able

5
to take full advantage of opportunities for productivity-enhancing reallocations; and Spain and
Italy were not able to take full advantage of capital inflows.
We also briefly […not in this draft] discuss the curious case of the United Kingdom. As
Figure 1 shows, the U.K. kept pace with U.S. TFP performance from the mid-1990s to the early
2000s. From 2003-2007, the U.K. pulled away somewhat from the U.S. (reflecting the
slowdown in the U.S. performance). But a sharp break came with the crisis. Other advanced
economies also saw an additional break post-2008. For some continental economies, low factor
utilization may still play a role in obscuring productivity trends; indeed, as of mid-2015, the
OECD estimates that output gaps remain very large. But for the U.K., resource slack had sharply
diminished well before this writing. It is unclear whether the crisis should have pushed the U.K.
or other countries to a different level of productivity relative to the frontier.
Many of the arguments here are not new. For example, Fernald (2014a) discusses the
U.S. experience. Van Ark, O’Mahony, and Timmer (2008), van Reenen et al (2010), Bourlès et
al (2013) or Cette, Lopez and Mairesse (2014) discuss the role of labor and product market
rigidities. Gopinath et al (2015) discuss peripheral Europe. Our innovation is to bring together,
update, and augment these sometimes disparate arguments into a single broad narrative for
advanced economies.
Of course, all of these arguments assume that the problem really is productivity, rather
than measurement. Considerable informal discussion questions whether measurement problems
have gotten worse. Specifically, some aspects of recent output growth are inherently hard to
measure—including quality improvement in specialized equipment and software, and “free”
goods on the Internet (such as Facebook, Google searches, and online cat videos).

6
As we discuss in Section 2.3, we are skeptical that measurement issues can resolve the
problem of a broadbased slowdown in productivity growth. First, mismeasurement has always
been with us, and we are not aware of evidence that would suggest that this problem is really
worse now than in the past. Second, most of the arguments involve a relatively narrow slice of
the economy. But the slowdown in U.S. industry productivity is broadbased. Third, to the
extent that there is growing mismeasurement in capital goods (equipment and software), it would
raise true labor productivity growth but reduce true TFP growth. And the slowdown in TFP
growth was sharp and broadbased.
The outline of the paper is as follows. Section 1 discusses facts about convergence and
divergence. Section 2 discusses the IT-related rise and fall of productivity growth in the United
States. Section 3 discusses the role of labor- and product-market rigidities in Europe, and
Section 4 discusses the periphery. (Placeholder sections appear after that.)
1. Facts: Convergence and Divergence of Global Productivity
This section discusses the stylized facts about the post-war convergence and then
divergence in productivity growth that took place prior to the GFC. Figure 1 shows the major
patterns in TFP that we focus on. The bar chart in Figure 2 shows further detail on labor
productivity growth and its main components, among them TFP, over different sub periods.
Prior to 1995, a striking feature of Figure 1 and Figure 2 is how similar labor productivity
and TFP growth (and, indeed, levels) are across countries from the mid-1990s. (Even Japan,
away from frontier level of TFP and not shown, is growing at a pace similar to the frontier in
these data.). Those similarities are consistent with conditional convergence models, where a
natural benchmark expectation is that, once convergence ends, countries grow at the frontier rate.
There might be institutional barriers that interfere and keep countries from reaching the frontier

7
level. But ideas spill across borders, however imperfectly and perhaps with lags. Innovations in
one country are, in principle, available in all countries. In some cases, innovations can be directly
observed and (perhaps with some effort) replicated. In other cases, key innovations are
embedded in tangible or intangible goods that can be purchased, such as information technology
hardware and software. And cross-border investments further transfer knowledge.
For a broader perspective on convergence, Figure 3 shows GDP per hour (which
corresponds to the labor productivity per hour) for the same set of economies. It shows that a
conditional-convergence perspective describes our country experience reasonably well. The
figure shows Conference Board data on GDP per hour worked (not per capita) relative to the US
level, for the five largest European economies plus Japan.8 In contrast to Figure 1, the United
States is not shown explicitly because it is normalised to 100. As is clear, these advanced
economies grew fast and converged towards U.S. level in the post-war period. In terms of GDP
per hour, convergence appears a bit slower than for TFP (see also van Ark at al, 2008, who make
this point). Nevertheless, by 1995 (the vertical line), France, Germany, and even Italy are above
U.S. levels in this dataset. (But as noted earlier, in these countries, the working time and/or the
employment rate are lower than in the US. Bourlès and Cette (2006 and 2007) argue that, because of
diminishing returns to these two variables, part of the labor productivity and TFP performance of
these countries could reflect these low levels of hours worked and employment rates.) Spain is above
90 percent of U.S. levels, and the U.K. is above 80 percent.
U.S. labor productivity and TFP growth sped up in the mid-1990s but slowed again after
the early 2000s. However, most other advanced economies showed a decrease in labor
productivity and TFP growth after 1995, which means the end of the convergence process and
8 This is still Conference Board. We should be consistent and use Bourles et al, and either drop the CB or
relegate it to an appendix.

8
even the starting point of a divergence one. Indeed, TFP growth in Italy and Spain was quite nil
over this period. As the figure suggests, the end of convergence inherently caused a first-order
slowdown in advanced-economy (non-U.S.) productivity growth—a slowdown that took place a
dozen or so years before the onset of the GFC. From a long perspective, it was nearly inevitable
that the advanced-economy labor productivity and TFP convergence process should end, but not
that a divergence process would follow the previous convergence one.
This end of conditional convergence is a reason to focus on the disparate productivity
patterns that take place since the mid-1990s. And of course, GDP per hour mixes TFP and
capital deepening, so we focus going forward on both labor productivity and TFP.
The conditional convergence framework shapes our argument, where we focus first on
the frontier of knowledge and productivity—which we take to be the United States—and second
on what was happening away from the frontier. Although ideas may be global, they have to be
implemented locally. And shocks of different sorts—whether to the nature of technology, or to
capital flows—may interact in particular ways with country-specific institutions to push
countries closer to or farther from the frontier. Figure 1, Figure 2, and Figure 3 show that, prior
to the GFC, productivity drifts down relative to the U.S. in France and Germany, but plunges in
Italy and Spain. A broad theme that links these disparate cases is the role of reallocation and
misallocation..
2. The pre-Great Recession slowdown in U.S. productivity growth
For understanding the pre-GFC slowdown, a crucial issue is what was happening at the
“global frontier” of knowledge? For this purpose, we take the United States to be at the

9
frontier,9 and analyze its experience in recent decades. We update industry estimates from
Fernald (2014a) that show that that the slowdown after 2003 or 2004 was heavily (though not
solely) concentrated in information-technology-intensive business services. Thus, the slowdown
at the frontier was plausibly a “return to normal”—marking an end (or pause) in a phase of
exceptional, broad-based gains from the production and use of information technology. There is,
of course, a wide range of uncertainty about what the future holds. But the U.S. experience
provides a benchmark for what should be possible for other countries, as well.
Fernald (2014a) examines in detail the “rise and fall” of exceptional U.S. labor
productivity and TFP growth that was shown in Figure 2. As he reports, formal break tests find a
statistically significant speedup in the mid-1990s and slowdown in the early- to mid-2000s; exact
break dates depend on which series is used, and range from 2003:Q4-2006:Q1. In all cases, the
2000s break dates are prior to the GFC, and confidence intervals typically exclude the GFC.
In the U.S. case, unlike the others shown in Figure 2, productivity growth since the Great
Recession is not much different than growth in the period leading up to the Great Recession.
Indeed, there is no additional break detectable during the Great Recession. Of course, even apart
from measurement, there is no shortage of reasons why a financial crisis might cast a “long
shadow” on productivity growth. For example, a financial crisis like the Great Recession might
affect the level or growth rate of economy-wide innovation because of credit constraints on
innovative firms,10 the degree of productivity-improving reallocation,11 misallocation, or other
9 Taking the U.S. as the frontier is conventional. The OECD (2015), which focuses on diffusion and
misallocation, takes a different perspective and analyzes the “global frontier” of firms in detailed industries. Nevertheless, OECD (2015) and Andrews et al (2015, p.15) find relatively little evidence of misallocation for the U.S. Although U.S. firms are not necessarily at the “global frontier” of knowledge, the distribution of firm size is more allocatively efficient, in that more productive firms are larger. See also Bartelsman et al (2013).
10 See Liu and Wang (2014). 11 See Petrosky-Nadau (2013).

10
channels. Prescott and Ohanian (2014) focus on the possible adverse effects of regulations that
have gone into effect since 2008.
But the fact that the U.S. slowdown predated the Great Recession suggests that, in the
United States at least, these factors are probably modest relative to the substantial pre-Great-
Recession slowdown in TFP growth.
2.2. An easing in the IT revolution?
A plausible hypothesis for the United States, at the frontier, is that the pace of
technological change associated with information technology slowed. This section updates
industry estimates from Fernald (2014a), who finds evidence consistent with that hypothesis. He
finds that the pre-Great-Recession slowdown was in sectors that produce information technology
(IT) or that use IT intensively.
Faster TFP growth in producing IT products can, conceptually, raise aggregate TFP and
labor productivity growth through several channels (see Basu, Fernald, Oulton, and Srinivasan,
BFOS, 2003). Most directly, it raises aggregate TFP growth by raising TFP growth in the
industries that produce IT products. The resulting declines in the relative price of investment
goods should then affect capital deepening by IT-using sectors. In a neoclassical framework, this
raises labor productivity growth, but not TFP growth, in those sectors.
However, considerable literature for the United States finds that other industries also
showed an increase in measured TFP growth in the late 1990s or early 2000s (e.g., BFOS and
Bosworth and Triplett, 2006). We also find that result below.
One potential channel for declining IT prices to affect measured TFP in IT-using
industries is if those firms also use more intangible capital that is complementary to IT. Indeed,
many authors argue that IT fosters complementary innovations, such as business reorganization
11
to take advantage of an improved ability to manage information and communications.12 In
retailing, for example, IT led firms to innovate in how they manage sales, inventories, and supply
chains; the Internet is an extreme example, in that it made possible completely new ways of
doing business. In addition, reallocation towards higher-productivity establishments amplified
the effects, as new or existing firms that were particularly adept at using new technologies (and
thus more productive) grew, while less capable establishments exited.13 In valve manufacturing,
Bartel, Ichniowski, and Shaw (2007) find that IT led to a change in business strategies to focus
on product customization rather than large commodity runs. Implementing this change required
changes in worker skills as well as in management and human-resource practices. More broadly,
Brynjolfsson and Hitt (2000) and others highlight the lags associated with complementary
managerial and organizational innovations.
The intangible story is essentially one of mismeasurement of the production function:
We don’t observe the intangible investment (unmeasured output), or the services of the
intangible capital (unmeasured input). When intangible investment is rising quickly, measured
productivity growth is likely to be held down (since resources are diverted from observed
production to intangible investment). With a lag, measured productivity growth is likely to be
boosted by the services of the intangible capital.
A second indirect channel is possible externalities from observing other firms.
In either case, the point is that cheaper IT capital can have a major effect if firms figure
out new (potentially radically new) ways to use their other inputs more productive ways. These
12 Van Reenen et al (2010) review the evidence on complementary intangible evidence with a focus on
firm-level evidence. Earlier examples include Brynjolfsson and Hitt (2000). 13 See Doms (2004) and Foster, Haltiwanger, and Krizan (2006). Fernald and Ramnath (2004) provide a
brief case study of how Walmart used IT to raise productivity.

12
arguments are the growth-accounting application of the idea that IT has had a broad-based and
pervasive effect on the economy through its role as a “general purpose technology” (GPT).14
For a wide swath of the economy, improved ability to manage information and
communications has certainly led to changes in how firms do business. But it was unclear a
priori how long the transformative, explosive opportunities would last.
Basu, Fernald, Oulton, and Srinivasan (BFOS, 2003) discuss how to map these indirect
GPT effects to conventional growth accounting. They model a tight link between accumulating
IT capital and intangible organizational capital. Intangible capital leads to interesting dynamics
for measured TFP, because it involves both unobserved investment (i.e., output) and unobserved
capital (i.e., input).15 The BFOS model implies that, as in the data, measured TFP should have
surged, temporarily, in the early 2000s. The reason is that growth in IT capital—and, by
assumption, intangible capital—skyrocketed in the late 1990s but slumped in the early 2000s.
That pattern implies that in the 1990s, firms were increasingly diverting resources to producing
unmeasured/intangible output. But in the early 2000s, those resources returned to producing
measured output—boosting measured productivity for a time.16
Fernald (2014a) examines the broader implication that, regardless of the specific model,
the measurement effects are associated with the use of IT. We update those estimates using BLS
industry data on U.S. TFP. These data run from 1987-2013 (see the data appendix).
14 See, e.g., Greenwood and Yorokoglu (1997), Brynjolfsson and Hitt (2000), Basu, Fernald, Oulton, and
Srinivasan (2003), and Brynjolfsson and McAfee (2014). 15 Even better than inferring intangible investment would be to measure it. Corrado, Hulten, and Sichel
(2006) discuss broader measures of intangible investment and ways to measure them. A large literature has since extended their measures, including (for regrettably short periods) at an industry level; see Corrado et al (2014).
16 The online appendix to Fernald (2014a) discusses the BFOS model in more detail. In the Fernald (2014b) quarterly TFP dataset, IT capital (information processing and software) grew 16 percent/year from 1995:Q3-2000:Q4, but only 8 percent/year from 2000:Q4-2004:Q4. (The IT-capital share of total income actually edged up slightly, but remained between 6 and 7 percent throughout.) Van Reenen et al. (2010) report substantial evidence for the IT-linked-intangibles story in micro data.
13
A challenge in that specification is to decide which industries are IT-intensive. Fernald
(2014a) based his identification on the average share of value added (from 1987-2011) that was
paid to IT capital. The BFOS model suggests that it should, instead, be based on the contribution
of IT capital to growth (the share multiplied by the IT-capital growth rate). (Fernald found that
these measures were highly correlated so it didn’t make much difference).
These measures nevertheless have their shortcomings. For example, by either of these
measures, wholesale trade is IT intensive whereas retail trade is not. But retail trade has clearly
been transformed by information technology—and the growth of online commerce is just one
direct manifestation of that. Also, the sample period and data vintage can matter. Fernald found
that petroleum refining is IT-intensive. But in the updated BLS data used here, petroleum
refining has a high IT share early in the sample but not later.
For this reason, we focus here on a highly correlated, but slightly different split: Market
services versus other. We define those industries below.
Figure 4 decomposes U.S. business-sector TFP growth into industry sources. The height
of the bars shows TFP growth for the time-periods shown. Cyclical factors from the Great
Recession are probably not important by 2013; but, given our pre-recession focus, we
concentrate on the period through 2007. (Fernald, 2014a, argues that cyclical factors were not a
primary driver of productivity trends from 2004-2007.) That said, the main conclusions are
robust to considering the entire 2004-2013 period.
There were “unusual” features of the mid-2000s—with the housing boom and subsequent
bust; excesses in the financial sector; and surging commodity prices—affected productivity. To
see this if these factors affected productivity, one slice of the data focuses on the “bubble”
sectors of the mid-2000s, that is, construction, real estate, finance, and natural resource

14
industries. (Relative to Fernald, 2014a, we also include petroleum refining in this sector, since
its productivity growth is both highly variable and is sensitive to oil prices and idiosyncratic
factors.) The contribution of these industries to overall TFP fell—becoming negative—from
2000-2004 to 2004-2007. But the contribution of the remaining ¾ of the economy fell even
more, as shown by the bars that lie above zero.
These non-bubble sectors are divided into three mutually-exclusive pieces: IT producing,
market services, and non-market services (the residual). As the figure shows, the TFP slowdown
after 2004 is especially concentrated in industries that produce IT or else in market services. The
contribution of IT producers was inordinately high in the late 1990s, accounting for over half of
overall TFP growth in this period—even though they account for only 6 percent of the economy.
Much of that surge reflected gains in hardware production, in part because competition within
the semiconductor industry led to the faster introduction of new chips. In the 2000s, the pace of
TFP gains in IT production eased and its share in GDP declines a bit (see also Byrne, Oliner, and
Sichel, 2013). Hence, the direct contribution of IT-producing industries fell.
In the early 2000s, the contribution of market services industries especially bulged. We
define this group as wholesale and retail trade, transportation, information, and business services.
(We exclude IT-producing software publishers. Most studies would also include finance, which
we considered a bubble sector.) After 2004, that market services group where the TFP
contribution fell most sharply. These industries are also much more IT-intensive than the “non-
market services” group. (Can add data or a chart)
That pattern is consistent with the view that benefiting from IT takes substantial
intangible organizational investments that, with a lag, raise measured productivity. By the mid-

15
2000s, the “low-hanging fruit” of IT-based innovation had been plucked.17 For example,
industries like retailing may have already have been substantially reorganized, after which the
gains from further innovation might have been more incremental than transformative.
Of course, the non-market-services group also shows a slowdown after 2004. Thus,
although the IT-intensive market services show the greatest slowdown, it is also accurate to say
that the slowdown in TFP growth is relatively broadbased across industries. (After 2007, TFP
growth was maintained mainly by the bubble sectors, which could also be somewhat
concerning…)
2.3. It’s not just mismeasurement of digital goods
A common rejoinder to the weak productivity statistics—in the U.S. and perhaps
elsewhere—is the challenges of measurement. As a Wall Street Journal article put it, it could be
that “…the U.S. doesn’t have a productivity problem, it has a measurement problem” (Aeppel,
2015). The article cites Google chief economist Hal Varian as a strong proponent of this view.
In other words, perhaps productivity growth has stayed strong but we’ve just gotten
worse at measuring it? One challenge is that the quality of existing goods and services is
changing all the time. A second challenge is that there are always new goods.
The quality-adjustment problems are not new, and economists and statisticians have
analyzed it extensively. As Wasshausen and Moulton (2006) discuss, virtually all price indices
are “designed to measure price change holding quality constant.” Hedonic adjustment, which is
17 See also Gordon (2014) and Cowen (2011).

16
applied to just over 20 percent of the items in nominal GDP (as of the early 2000s), is one
method that conditions on characteristics using a regression.
Nevertheless, the statistical methods require a lot of data and resources. So careful
quality adjustment is not always possible. Shapiro and Wilcox (1997) described the field of
quality adjustment as “house to house” combat in the area of national accounting. You need to
do the analysis product by product. And so, though statistical agencies work very hard to capture
price changes for conceptually similar goods over time, the concern is that they’re behind the
curve.
This is the view expressed by Google (Aeppel, 2015), Goldman Sachs (2015), Feldstein
(2015) and others. These observers point especially to three things.18
• First, equipment prices have plausibly fallen faster than measured in the accounts. Byrne, Oliner, and Sichel (2013) point to changes in how Intel prices semiconductors that lead traditional matched-model methods of adjusting for quality change to understate the pace of price declines. (Presumably, prices have also fallen faster in the final goods these chips are embedded in.) Byrne (2015) argues that the mix of equipment produced in the United States has shifted away from general-purpose computers towards specialized equipment. In those areas, the hand-to-hand battles have not been fought as intensively.
• Second, software is critically important, but the national accounts adjusts only about half of software for quality change (Fraumeni and Moulton, 2001).
• Third, they point to the high value of the “free” digital products that users obtain from the Internet: Facebook, Google searches, entertaining cat videos, and so forth.19
Together, the argument is that there’s much more of an increase in output and
productivity than is measured in the statistics. The first two points, if quantitatively
important, imply that true GDP is growing faster because the true, inflation- and quality-
adjusted amount of hardware and software is growing more quickly than measured.
18 See Goldman Sachs (2015) and Feldstein (2015), http://www.wsj.com/articles/the-u-s-underestimates-
growth-1431989720. 19 These products are not completely ignored in the accounts but they do not show up in consumption. The
value is measured in terms of advertising sales by Google, Facebook, and so forth. That advertising revenue is, in turn, considered the purchase of an intermediate service by firms.

17
Although these points have validity, we are skeptical that they can explain a broadbased
slowdown in the pace of innovation after 2003 or 2004.
First, and most important, we’ve always had a bias from mismeasurement, and it’s not at
all clear it’s gotten worse. If we miss ½ a percent of GDP growth a year now, and we missed ½
a percent of GDP growth before 2004, then mismeasurement alone doesn’t influence the
magnitude of the slowdown in labor productivity.
In the 1990s and early 2000s, a lot of work looked at missing quality improvement, and
the problem of new goods, and the fact that consumers had an explosion of new varieties. The
biases were always estimated to be large at the time. For example, VCRs, cell phones, and other
products were added to consumer indices a decade or so after they appeared, and when their
prices had already fallen by 80 percent or so. (Gordon, 20xx?) . The explosion in consumer
choice, and the possibilities for so-called mass customization, were documented in the 1990s.
In the mid-1990s, the so-called Boskin Commission estimated that omitted quality
change was worth at least ½ percent per year. Some academic research found even larger effects
(e.g., Bils and Klenow, 199x). So again, the issue is not whether there’s bias. The question is
whether it’s larger than it used to be.
Finally, in some narrow (but important) areas you can look directly at “quality”.
Specifically, there are quantitative measures of semiconductor chip performance that do not rely
on national accounting data. Kortum and Pillai (2014) find that chip performance accelerated in
the mid-1990s, around the time IT production showed faster TFP growth. But after 2003, the
acceleration ended--chip performance improved more slowly. This slower pace has continued
through at least 2013.

18
Second, the new mismeasurement problems that people highlight are, by and large,
narrowly focused—specialized hardware, software, and digital goods. But the slowdown in
productivity growth is broad based.
In terms of specialized equipment and software, they are only a few percent of the
economy, and they’re no larger than they were in the late 1990s and early 2000s.20 [Note that
Byrne and Pinto observe that for many computer items where deflation may be off, the effect on
GDP is small because of the high share that is imported.] And the missing free consumer goods
are basically in entertainment.
Most of what we spend money on is the same old stuff—shelter, food, clothing, cars,
gasoline. They don’t raise new problems for the statistics.
More subtly, to the extent the mismeasurement comes from understating real growth of
capital investment (equipment and software), it raises labor-productivity growth but actually
reduces TFP growth. The reason output grows more quickly in this case is because true investment
is growing faster than measured. But that, in turn, boosts capital input growth as well. Indeed, in
steady state, the increase in capital growth equals the increase in investment growth. In the data,
capital’s share in production, Ks , exceeds the investment share in output, Is (this is also a
condition for dynamic efficiency). Hence, aggregate TFP growth would actually slow modestly.21
Of course, the slower pace of aggregate TFP growth would be distributed differently.
There would of course be a faster pace of TFP growth in the production of equipment and software
goods. That implies that TFP growth outside of that production would be even slower than is
20 Add numbers to this, with references 21 In the adjustment to steady state, measured TFP might rise for a time. In simulations using the quarterly
TFP code for Fernald (2014b), the adjustment to steady state occurs quickly, since specialized equipment and software depreciate relatively fast. So the reduction in measured TFP appears quickly after the increase in investment growth.

19
already measured. Intuitively, this happens because output growth in those areas doesn’t change,
but capital-input growth is more rapid.
Thus, if capital-goods mismeasurement has gotten worse, that exacerbates the problem
discussed in Section 2.2 that the slowdown in TFP growth was broadbased.
To conclude, we are not yet persuaded that growing mismeasurement can substantially
change the fact that there was a broadbased slowdown in U.S. total factor productivity growth.
First, we don’t know that mismeasurement has gotten worse, let alone substantially so. Second,
even if it has, the growing mismeasurement is likely to be centered in a relatively narrow segment
of the economy whereas the TFP slowdown was broadbased. Third, growing mismeasurement of
capital goods would actually exacerbate the slowdown in economy-wide TFP. In the rest of the
paper, we proceed as if the statistics are consistent over time.
3. Labor- and product-market rigidities in Europe
Given the role of information technology in explaining U.S. productivity trends, it is
natural to interpret the divergence as reflecting an inability of Continental Europe to benefit
completely from that cluster of innovations.
In particular, continental Europe didn’t get the same productivity benefits as the U.S. and
U.K. after 1995. ICT diffusion in the US settled at a higher level than in the UK, and in the UK
than in the Euro Area or, say, continental Europe. The lag of ICT diffusion in continental
Europe is considerable, as raised by numerous studies.22 Numerous researches provide also
explanations for these international differences in ICT diffusion, including the level of post-
22 See Schreyer (2000), Colecchia and Shreyer (2001), Pilat and Lee (2001), van Ark et al. (2008), Timmer et al.
(2011), Cette and Lopez (2012), Cette, Clerc and Bresson (2015).

20
secondary education among the working age population as well as labor and product market
rigidities. For example, an efficient use of ICT requires a higher degree of skilled labor than the
use of other technologies. The required reorganization of the firm for effective ICT adoption can
be constrained by strict labor market regulations. Moreover, low levels of competitive pressure,
resulting from product market regulations, can reduce the incentive to exploit the most efficient
production techniques. Empirical analyses have confirmed the importance of these factors.23
Among others, Cette and Lopez (2012) show, through an econometric approach on a country
panel dataset, that the US benefits from the highest level of ICT diffusion because of a higher
level of post-secondary education among the working age population and less restrictive product
and labor market regulations. Cette, Lopez and Mairesse (2013) show also that market rigidities
lower ICT diffusion and R&D spending.
From a wider perspective, Bourlès et al (2013) look at cross-country/cross-industry panel,
and find that product market regulations in upstream (supplying) industries has significantly held
back TFP growth in recent decades. Cette, Lopez and Mairesse (2014) also on a
country*industry panel that, in continental Europe, labor and product market regulations which
are tighter than in the US and the UK contribute to lower TFP. Haltiwanger, Scarpetta, and
Schweiger (2014) find that strict hiring and firing regulations tend to reduce the pace of job
reallocation. Garicano, Lelarge, and Van Reenen (2012) find that steep nonlinearities in French
labor costs for firms above 50 employees has major effects on firm size and productivity.
Figure 2 shows that: i) Productivity growth increases from the mid 1990s in the US and
decreases elsewhere, slightly so in the UK and in a larger extend in continental European
countries. The US increase is explained by an increase of the ICT capital deepening and of the
23 See Aghion et al. (2009), Guerrieri et al. (2011) and Cette and Lopez (2012) who use country-level panel data, as
well as Cette et al. (2013) who employ sectoral-level panel data.

21
TFP contributions and the decrease elsewhere is explained by a decrease of the non-ICT capital
deepening and the TFP contributions; ii) Productivity growth decreases from the mid 2000s in all
countries, except in Spain where the collapse of the low productivity construction sector has a
mechanical positive impact on productivity; iii) The US and the UK benefited more than
continental Europe countries from ICT capital deepening across all the different sub periods; iv)
Productivity growth is higher in the US than other countries during the sub-period 1995-2004,
except for the UK where ICT diffusion is also large during these years, and during the sub-period
2004-2013 except in Spain; v) In the last two sub periods 1995-2004 and 2004-2013, TFP
growth is particularly low in Italy and in Spain.
These observations suggest strongly that, from the mid 1990s on, the four European
continental countries suffer from low ICT diffusion and low productivity gains, which could be
due, as showed by the literature mentioned above, to more stringent regulations on the labor and
the product market. They also suggest that from the mid 1990s, TFP growth in Italy and Spain
was incredibly low (and sharply negative in Italy). The next section discusses the role of capital
flows and low real interest rates in the periphery.
4. Increasing misallocation in peripheral Europe
This section focuses on the so-called periphery of the euro area: i.e. parts of the euro area
where, due to the nominal convergence required to adopt the euro, nominal and real interest rates
have collapse the most. As shown in Figure 5 and 6, interest rates fell by much larger magnitudes
in Italy and Spain than in France, Germany or the UK. Italian and Spanish nominal rates fell
from 12% in 1996 to around 5% when the euro started to exist in 1999. This is twice the decline
of their French and German counterpart. Italian real rates fell from 8% to below 2% percent from

22
2001 to 2006. Due to higher inflation, Spanish real interest rate remained on a declining trend
from 1995 to 2005 reaching -1%.
Such drops in real interest rate reflect abundant capital flows into debt that investors
considered to be safe because it was issued in euros. From 1999 to 2008, the non-financial
corporation increased their debt from 50% of GDP to 78% in Italy and 113 % in Spain. In France
and Germany, where the drop of real interest rates was much smaller, corporate debt increased
by only 10% of GDP, from 50% to 60% over the same period.
One possible reason why productivity diverged across euro area member states is that the
tsunami of capital flows into the periphery was poorly allocated. For one, rapid capital inflows
tend to increase the share of non-tradables in GDP (Kalantzis, 2014; Benigno et al., 2015) that
include more services than manufacturing. As a result, a change in composition can lower
aggregate productivity. For instance, construction has reached a very large fraction of Spanish
GDP in the run up to the crisis, as foreign capital financed its nearly 10% current account deficit
in the years around 2005.
We first test this hypothesis through simple VARs that include either labor productivity
or TFP and the real interest rate. Given that the real interest rate should, in the long run, respond
to changes in productivity, we focus on the effects or shocks to the real interest rate on top of
their reaction to past and contemporaneous innovation to our productivity indicator. In VAR
language, we order the real interest rate last in our specification so that we constrain productivity
to react to the shocks on real interest rate with one lag.
Our first specification uses quarterly labor productivity, defined as the growth rate of
GDP divided by total employment, and the real interest rate reported in Figure 6. The sample
23
period is from 1985 to 2015Q1 for the Euro area, France Spain, the UK and the US, and, due to
limited availability of the data, from 1992 to 2015 Q1in Italy and Germany.
Figure 7 and 8 report the impulse responses and the historical decomposition of this bi-
variate VAR for the euro area economy. As shown in the second column of Figure 7, a positive
shock to real interest rates triggers a significant increase in the growth of productivity that peaks
about two years after the shock. The sharp fall in the real interest rate of the euro area, which has
largely been driven by Italy and Spain, appear to explain the downward trend in the growth of
labor productivity between 1995 and 2007 (Figure 8 and 9).
The positive impact of shocks to the real interest rate on labor productivity also shows at
the country level in Italy, France, Spain, the UK and Germany and for specifications that include
either GDP among the endogenous variables in the VAR. The contribution of this shock to the
downward trend of labor productivity is also striking in most countries (see Figure 9 and Figures
A3) from 1995 to 2007. The only exception is Germany, where in fact, real interest rates fell by
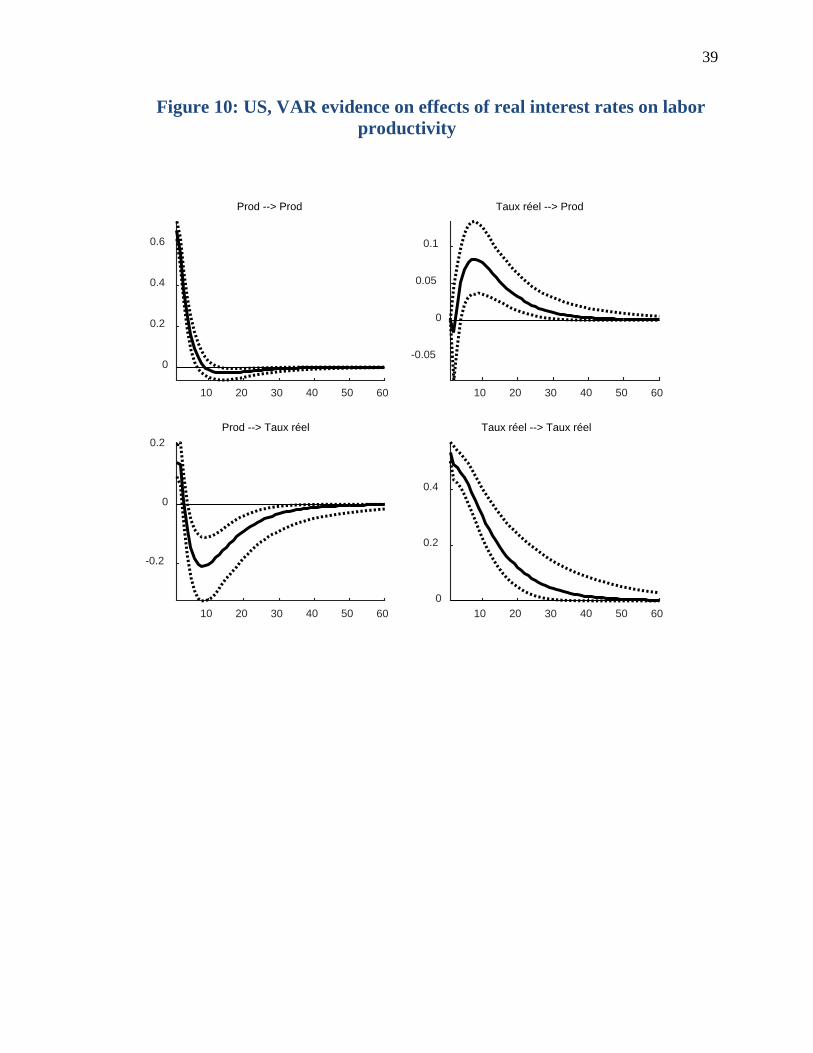
much less than in the rest of the euro area. Turning to the US, we obtain that the contribution of
the real interest rate to declining growth in labor productivity starts only around 2000.
Our second specification uses annual data on labor productivity growth and TFP growth
from Bergeaud, Cette and Lecat (2014) and the real interest rate. Data are available from 1990 to
2013 for 13 OECD countries. As shown in Table 1, changes in real interest rates are correlated
with changes of similar signs of both measures of productivity one year later. This significant
effect of real rates on productivity also holds for a sample that does not include the great
recession.
Altogether, both the time series VAR evidence and the panel data regression fail to reject
the hypothesis that “abundant capital”, which we proxy by a decrease in the long-term real

24
interest rate triggers a fall in productivity. This channel has had the largest effect in Italy and
Spain where, indeed, from the mid 1990’s to the mid 2000’s real interest rates declined the most.
5. What about the Global Financial Crisis?
[And, possibly, the UK]
6. Conclusions
[Placeholder]
In advanced economies, productivity growth was slowing prior to the Great Recession.
The big picture is that, in the United States, there was an exceptional burst of technological
change in the second half of the 1990s and early 2000s. But that exceptional pace ended prior to
the Great Recession. Other countries didn’t keep up with that frontier, but fell away at a varying
rate.
• What does this say about the prospects going forward? What does it say about
interpreting the post-2008 experience?
• An important lesson is the need for flexibility in labor- and product-market institutions.
An open question is whether European institutions will cause continued divergence;
whether institutional reforms will promote convergence; or whether one should settle for
stasis. At least at the margins, fostering innovation and supporting the ability of firms
and workers to benefit from the generation of new ideas are likely to be positive for
future growth.

25
Data appendix
Bureau of Labor Statistics multifactor productivity (MFP) data and industry capital data were downloaded from http://www.bls.gov/mfp/mprdload.htm (accessed August 9, 2015). The data include factor payments for different types of capital, including payments for IT and software capital as a share of income. The industry classification system is NAICS.
Bubble sectors are finance, insurance, and real estate (NAICS 52, 53); construction (23); agriculture (11); mining (21); and petroleum refining (324). This is the same list as in Fernald (2014a) with the addition of petroleum refining. Fernald (2014a) classified petroleum refining as part of the IT-intensive sector.
IT-producing industries are Computer and Electronic Products (NAICS 334), Information and Data Processing Services (518, 519) and Computer Systems Design and Related Services (5415).
We define market services in the BLS data are defined as
• Wholesale and retail trade (NAICS 42, 44-45); • Transportation (48, 49) • Information excluding publishing (51 excluding 511 and 516 (publishing) • Business services—e.g., legal, professional, scientific, management administrative,
excluding computer systems and design (NAICS 54-56, excluding 5415)
This listing of market services intentionally excludes the bubble sector of finance (which is usually considered a business service) as well as the IT-producing information and computer services (software and computer systems integration) sector.

26
References
Acemoglu, Daron and David Autor, 2012. “What Does Human Capital Do? A Review of Goldin and Katz’ The Race between Education and Technology.” Journal of Economic Literature 50(2), pp. 426-463.
Aeppel, Timothy (2015). “Silicon Valley Doesn’t Believe U.S. Productivity Is Down.” Wall Street Journal, July 16, 2015. http://www.wsj.com/articles/silicon-valley-doesnt-believe-u-s-productivity-is-down-1437100700
Andrews, Dan, Chiara Criscuolo, and Peter N. Gal (2015). "Frontier firms, technology diffusion and public policy: Micro evidence from OECD countries." Manuscript, OECD.
Bartelsman, Eric, 2013. "ICT, Reallocation and Productivity," European Economy - Economic Papers 486, Directorate General Economic and Monetary Affairs (DG ECFIN), European Commission.
Benigno, Gianluca, Converse, Nathan and Fornaro, Luca, (2015). "Large capital inflows, sectoral allocation, and economic performance," Journal of International Money and Finance, Elsevier, vol. 55(C), pages 60-87.
Bergeaud, A., Gilbert Cette, and Remy Lecat (2014). "Productivity trends from 1890 to 2012 in advanced countries." Working papers 475, Banque de France.
Bourlès, Renaud, Gilbert Cette, Jimmy Lopez, Jacques Mairesse, Giuseppe Nicoletti (2013). “Do product market regulations in upstream sectors curb productivity growth? Panel data evidence for OECD countries.” Review of Economics and Statistics 95 (5), 1750-1768
Brynjolfsson, Erik and Andrew McAfee, 2014. The Second Machine Age: Work Progress, and Prosperity in a Time of Brilliant Technologies. New York: W. W. Norton & Company.
David Byrne and Eugenio Pinto (2015). “The recent slowdown in high-tech equipment price declines and some implications for business investment and labor productivity.” FEDS Notes, March 26, 2015.
Cette, Gilbert, Jimmy Lopez (2012). “ICT demand behaviour: an international comparison.” Economics of Innovation and New Technology, 21, pp. 397–410.
Cette, Gilbert, Jimmy Lopez, and Jacques Mairesse (2013). "Upstream product market regulations, ICT, R&D and productivity," Working papers 441, Banque de France.
Comin, Diego and Mark Gertler, 2006. “Medium-Term Business Cycles.” American Economic Review, vol. 96(3), pages 523-551, June.
Corrado, Carol, Jonathan Haskel, Cecilia Jona-Lasinio, and Massimiliano Iommi (2014). “Intangibles and industry productivity growth: Evidence from the EU.” Manuscript,
Corrado, Carol, Charles Hulten, and Dan Sichel (2006).
Cowen, Tyler, 2011.“The Great Stagnation: How America Ate All The Low-Hanging Fruit of Modern History, Got Sick, and Will (Eventually) Feel Better.” Penguin Group US, 2011.
Crafts, Nicholas and Kevin O’Rourke (2013)
Dabla-Norris et al, 2015. “The New Normal…” IMF Manuscript.

27
Daly, Mary, John G. Fernald, Fernanda Nechio, and Oscar Jorda (2013). “Output and Unemployment Dynamics.” Manuscript.
Davis, Steven and John Haltiwanger, 2014. "Labor Market Fluidity and Economic Performance.” Manuscript, 27 October 2014.
Fernald, John. 1999. "Roads to Prosperity? Assessing the Link Between Public Capital and Productivity." American Economic Review 89, pp. 619-638.
Fernald, John. 2014a. “Productivity and Potential Output Before, During, and After the Great Recession.” NBER Macroeconomics Annual 2014.
Fernald, John, 2014b. “A Quarterly, Utilization-Adjusted Series on Total Factor Productivity.” FRBSF Working Paper 2012-19 (revised April 2014).
Fernald, John. and Charles Jones. 2014. “The Future of U.S. Economic Growth.” AEA Papers and Proceedings, May 2014.
Fernald, John and Bing Wang, 2015. “The Rise and Fall of Exceptional Productivity Growth.” FRBSF Economic Letter.
Feroli, Michael (2015a). “Do Androids Dream of Electric Growth?” J.P Morgan Economic Research Note, June 11, 2015.
Feroli, Michael (2015b). “IT Prices—A Technical Issue of Fundamental Importance.” J.P Morgan Economic Research Note, August 20, 2015.
Garicano, Luis, Claire Lelarge, and John Van Reenen (2012). “Firm Size Distortions and the Productivity Distribution: Evidence from France.” Manuscript.
Gordon, Robert J., 2014. “The Demise of U.S. Economic Growth: Restatement, Rebuttal, and Reflections.” NBER WP 19895, February.
Haltiwanger, John, Stefano Scarpetta, Helena Schweiger (2014). “Cross country differences in job reallocation: The role of industry, firm size and regulations.” Labour Economics, Vol 26 (January), pages 11-25. doi:10.1016/j.labeco.2013.10.001
Hatzius, Jan and Kris Dawsey (2015). “Doing the Sums on Productivity Paradox 2.0.” Goldman Sachs U.S. Economics Analyst, Issue No: 15/30 (July 24).
Hassan, Fadi and Gianmarco I.P. Ottaviano (2013). “Productivity in Italy: The great unlearning.” VOX-EU, November 30. http://www.voxeu.org/article/productivity-italy-great-unlearning
Kalantzis,Yannick (2014). "Financial fragility in small open economies: firm balance sheets and the sectoral structure," Working papers 505, Banque de France, forthcoming in the Review of Economic Studies.
Kortum, Samuel and Unni Pillai (2014). “Comment.” NBER Macroeconomics Annual 2014, Vol. 29, No. 1 (2014) , pp. 52-59. The University of Chicago Press. http://www.jstor.org/stable/10.1086/680581
International Monetary Fund, 2015. World Economic Outlook, Chapter 3. April.
Inklaar, Robert (2015).

28
Inklaar, Robert and D.S. Prasada Rao (2014). “Cross-country income levels over time: did the developing world suddenly become much richer?” GGDC Research Memorandum 151.
Jones, Charles, 2002. "Sources of U.S. Economic Growth in a World of Ideas" American Economic Review, March 2002, Vol. 92 (1), pp. 220-239.
Jorgenson, Dale W., Mun S. Ho, and Kevin J. Stiroh (2008). "A Retrospective Look at the U.S. Productivity Growth Resurgence." Journal of Economic Perspectives, 22(1): 3-24.
Müller, Ulrich K. and Mark W. Watson, 2014. “Measuring Uncertainty about Long-Run Predictions.” Manuscripts.
OECD (2015). “The Future of Productivity.”
Reifschneider, Dave, William Wascher, and David Wilcox, 2013. “Aggregate Supply in the United States: Recent Developments and Implications for the Conduct of Monetary Policy.” FEDS Working Paper 2013-77.
Sedlacek, Petr and Vincent Sterk, 2013. “The Growth Potential of Startups over the Business Cycle.” Manuscript, University College London.
Tett, Gillian (2015). “Productivity paradox deepens Fed’s rate-rise dilemma.” Financial Times, August 20, 2015. http://www.ft.com/intl/cms/s/0/159496e4-4739-11e5-b3b2-1672f710807b.html#axzz3lgxteSJ3.
Tiffin, Andrew (2014). “European Productivity, Innovation and Competitiveness: The Case of Italy.” IMF Working Paper WP/14/79.
Van Reenen, John, Nicholas Bloom, Mirko Draca, Tobias Kretschmer, Raffaella Sadun, Henry Overman, and Mark Schankerman, 2010. “The Economic Impact of ICT.” Research report, SMART N. 2007/0020.
Wasshausen, David and Brent Moulton (2006). “The Role of Hedonic Methods in Measuring Real GDP in the United States.” BEA Papers, Bureau of Economic Analysis, http://EconPapers.repec.org/RePEc:bea:papers:0067.

29
Table 1: Effects of real interest rates on productivity
Labor productivity growth TFP growth1990-2013 1990-2013Coefficient Std dev. T stat P (T Stat) Coefficient Std dev. T stat P (T Stat)
Lag dep 1 .0800284 .0690342 1.16 0.264 .1067375 .0443946 2.40 0.030Lag dep 2 -.0787487 .0474508 -1.66 0.118 -.0880085 .0465373 -1.89 0.078
Lag real rate 1 .3261072 .0676781 4.82 0.000 .3769308 .0621712 6.06 0.000Lag real rate 2 -.0239866 .0512817 -0.47 0.647 -.0443684 .0526379 -0.84 0.413
338 observations, R2=.16 338 observations, R2=.211990-2007 1990-2007Coefficient Std dev. T stat P (T Stat) Coefficient Std dev. T stat P (T Stat)
Lag dep 1 .0356817 .0962397 0.37 0.716 .0854934 .067889 1.26 0.227Lag dep 2 -.0935328 .0492813 -1.90 0.077 -.075184 .0609506 -1.23 0.236
Lag real rate 1 .1308041 .0728723 1.79 0.093 .13744 .0627506 2.19 0.045Lag real rate 2 .0369266 .0569252 0.65 0.526 .0465515 .0632294 0.74 0.473
222 observations, R2=.04 222 observations, R2=.10The sample includes Australia, Belgium, Canada, Finland, France, Germany, Italia, Japan, the Netherlands, Norway, Portugal, Spain, Switzerland the UK and the US. Productivity data are from Bergeaud, Cette and Lecat (2014). Real rates are constructed as 10 year government bond interest rate minus current CPI inflation, both series coming from datastream.

30
Figure 1: TFP Divergence in Advanced Economies

31
Figure 2: Growth accounting for GDP per hour, major European economies
Notes: Bars sum to GDP per hour. Source is Bergeaud, Cette, and Lecat (2014).

32
Figure 3: Conditional Convergence and Divergence

33
Figure 4: Contribution to U.S. TFP growth by industry subgroup
Notes: Aggregate TFP growth based on BLS industry data is decomposed into four mutually exclusive categories as shown. “Bubble sectors” are construction, finance, real estate, agriculture, mining, and petroleum refining. “Market services” are wholesale and retail trade, transportation, information, and business services. In terms of size, from 1995-2000, IT production was 6 percent of business-sector value added; bubble sectors were 24 percent; and market services and non-market services were both 35 percent. See Fernald (2014a) for further details. Source: BEA, BLS, and authors’ calculations.

34
Figure 5: Nominal interest rates in Europe

35
Figure 6: Real interest rates in Europe

36
Figure 7: Euro area, VAR evidence on effects of real interest rates on labor productivity
10 20 30 40 50 60
0
0.2
0.4
0.6
Prod --> Prod
10 20 30 40 50 600
0.1
0.2
Prod --> LT Real
10 20 30 40 50 60
0
0.1
0.2
LT Real --> Prod
10 20 30 40 50 600
0.2
0.4
0.6
LT Real --> LT Real

37
Figure 8: Historical decomposition of Euro Area labor productivity, based on the VAR
1987 1993 1998 2004 2009-5
0
5Historical decomposition of Prod (Choleski)
dL ProductivityLT RealData
1987 1993 1998 2004 2009-5
0
5
10Historical decomposition of Growth (Choleski)
dL ProductivityLT RealData

38
Figure 9: Historical decomposition of Euro Area labor productivity, based on the VAR
1987 1993 1998 2004 2009 2015-5
0
5FRANCE
1993 1995 1998 2001 2004 2006 2009 2012 2015-5
0
5GERMANY
dL Productivity
LT Real
Data
1987 1993 1998 2004 2009 2015-5
0
5SPAIN
1993 1995 1998 2001 2004 2006 2009 2012 2015-5
0
5ITALY
39
Figure 10: US, VAR evidence on effects of real interest rates on labor productivity
10 20 30 40 50 60
0
0.2
0.4
0.6
Prod --> Prod
10 20 30 40 50 60
-0.2
0
0.2Prod --> Taux réel
10 20 30 40 50 60
-0.05
0
0.05
0.1
Taux réel --> Prod
10 20 30 40 50 600
0.2
0.4
Taux réel --> Taux réel

40
Figure 11: Historical decomposition of US labor productivity, based on the VAR
1982 1987 1993 1998 2004 2009 2015 2020-4
-2
0
2
4Historical decomposition of US Prod (Choleski)
1982 1987 1993 1998 2004 2009 2015 2020-5
0
5
10Historical decomposition of US Taux réel (Choleski)
dL Productivity
LT Real
Data