Embed Size (px)
Citation preview

The potential of energy
citizens in the European
Union

1 September 2016 3.J00 - The potential of energy citizens in the European Union
Delft, CE Delft, September 2016
This report is prepared by:
Bettina Kampman
Jaco Blommerde
Maarten Afman
Publication code: 16.3J00.75
Renewable energy / Consumers / Producers / Households / Cooperation / Demand-response /
Capacity / Prognoses
Client: Greenpeace European Unit, Friends of the Earth Europe, European Renewable Energy
Federation (EREF) and REScoop.
CE publications are available from www.cedelft.eu
Further information on this study can be obtained from the contact person, Bettina Kampman.
© copyright, CE Delft, Delft
The potential of energy
citizens in the European
Union
CE Delft
Committed to the Environment
Through its independent research and consultancy work CE Delft is helping build a sustainable
world. In the fields of energy, transport and resources our expertise is leading-edge. With our
wealth of know-how on technologies, policies and economic issues we support government
agencies, NGOs and industries in pursuit of structural change. For 35 years now, the skills and
enthusiasm of CE Delft’s staff have been devoted to achieving this mission.

2 September 2016 3.J00 - The potential of energy citizens in the European Union
Content
Summary 3
1 Introduction 5 1.1 Project objectives and scope 6
2 Methodology 7 2.1 Introduction 7 2.2 Wind power in 2015 8 2.3 Wind power in 2030 and 2050 9 2.4 Solar power in 2015 10 2.5 Solar power in 2030 and 2050 11 2.6 Investment potential households in renewable energy 12 2.7 Stationary batteries 13 2.8 Electric boilers 14 2.9 Electric vehicles 15 2.10 Deduplication energy citizen households 16
3 Investments and cost impacts 18
4 Results 20
5 Conclusions and recommendations 25
References 26
Annex A Assumptions 30
3 September 2016 3.J00 - The potential of energy citizens in the European Union
Summary
With an increasing share of renewable energy sources (RES) in the European
Union (EU), the role of energy consumers as active participants in the energy
system is bound to expand, as the developments in an increasing number of
EU Member States demonstrate. A growing number of households, public
organizations and small enterprises are likely to produce energy, supply
demand-side flexibility or store energy in times of oversupply. So far,
however, the extent of this prosumer potential in the EU is unknown.
Global and EU-wide decarbonisation scenarios typically model increasing RES
capacities, but do not go into the details of how this is achieved, and what
role prosumers, also referred to as energy citizens, could play in these
developments.
This study therefore aims to create more insight into the potential of energy
citizens in the EU: how many energy citizens could there be in 2030 and 2050
throughout the EU and what is their potential contribution to renewable
energy production and demand side flexibility?
The main result of this project is an Excel workbook that contains the detailed
quantitative findings of this study. This report provides the background
information to these data, describing the context of the study and the
methodology used. The study was commissioned by Greenpeace, Friends of the
Earth Europe, European Renewable Energy Federation (EREF) and REScoop.
Project objectives The main objective of this study is to assess the following, for a number of
different categories of energy citizens:
the potential installed renewable energy capacity;
the potential of renewable energy generation;
the potential capacity for demand side flexibility (incl. storage).
Based on these data, the total number of energy citizens this represents will
be derived.
The study distinguishes between four energy citizen categories: individuals or
households producing energy individually, individuals or households producing
energy collectively, public entities and small enterprises. The renewable
energy sources investigated were solar photovoltaic (PV) and wind energy,
demand side flexibility focussed on the potential for electric vehicles,
e-boilers and stationary batteries. Data are estimated for today, in 2030 and
2050, at EU and Member State level.
Main conclusions and recommendations The potential for European households (individually or via energy collectives),
public entities and small enterprises to become an energy citizen and to
actively contribute to the future energy system is very significant.
We estimate that about 83% of the EU’s households could potentially become
an energy citizen and contribute to renewable energy production, demand
response and/or energy storage, which amounts to about 187 million
households. About half of the households, around 113 million, may have the
potential to produce energy; even more could provide demand flexibility with
their electric vehicles, smart e-boilers or stationary batteries. For (many)
other results, we refer to the Excel workbook that was developed during the
course of this study.

4 September 2016 3.J00 - The potential of energy citizens in the European Union
A calculation methodology and calculation tool was developed to estimate the
potential of various energy citizen categories in 2030 and 2050, for the
technical options investigated. The calculations are based as much as possible
on available data, using a transparent methodology that is based on, in our
view, sound reasoning. However, as the research on this topic is still limited,
as is the data on the current situation, the findings are subject to many
uncertainties. It is therefore recommended to follow up this study with a more
in-depth assessment of the calculation methodology and findings of this study,
to further enhance the robustness of the results and to determine the key
drivers for these developments.
It is also recommended to further develop data gathering about energy citizens
and their contribution to the energy system. Other issues that would be
interesting to explore further are how this energy citizen potential can be
realised, and how a future with a large number of energy citizens compares to
a less decentralized development of a sustainable energy future, in terms of,
for example, cost, energy security and social and economic effects.
5 September 2016 3.J00 - The potential of energy citizens in the European Union
1 Introduction
With an increasing share of renewable energy in the EU, the role of consumers
as active participants in the energy system, as energy producers and/or
suppliers of demand side flexibility or energy storage, is bound to increase, as
the developments in an increasing number of EU Member States demonstrate.
Many households, public entities and SMEs have become electricity producers,
by installing solar PV on their roofs or by participating in community initiatives
for wind turbines. Projects are implemented to use electric vehicles for
storage of renewable electricity produced nearby, and various cities and
communities are actively pursuing the goal of becoming self-sufficient and
reliant on renewable energy only, encouraging their inhabitants to be actively
involved in the developments. With a population of more than 500 million,
about 216 million households and around 20 million small enterprises
(< 50 employees), there is clearly a huge potential of active energy citizens,
or prosumers, in the EU1.
The reduced cost of renewable energy as well as government support creates
opportunities for households and other parties to invest in renewable energy
sources (RES) and thereby reduce fossil fuel use. Options for citizens to store
energy during times of oversupply and adapt their demand to the variable
energy generation profile of wind and solar energy are being developed.
Unlocking their technical potential for RES generation, flexible demand and
storage will reduce cost of the future renewable energy system: reduce grid
investments and backup power generation, use their investment capacities,
etc. At the same time, it creates public support for the energy transition.
So far, however, there is no overall picture of the extent of the energy citizen
potential in the EU. Global and EU-wide decarbonisation scenarios typically
model increasing RES capacities, but do not go into the details of how this is
achieved, and who will be involved. This study, commissioned by Greenpeace,
Friends of the Earth Europe, European Renewable Energy Federation (EREF)
and REScoop, therefore aims to create more insight in the potential of energy
citizens in the EU: how many energy citizens could there be in 2030 and 2050
throughout the EU and what is their potential contribution to renewable
energy production and demand side flexibility?
The potential estimated in this study assumes that policy and regulatory
barriers are removed over time, and that the national grids, distribution
networks and electricity markets are developed in parallel with the growth of
renewable energy production, demand side flexibility and storage options.
Clearly, significant policy efforts and investments will be needed to realise
this potential.
1 The terms energy citizen and prosumers are often used in parallel, both indicating
individuals, households, public or private companies that move from being only energy
consumers to also produce energy, or actively take part in the energy system by providing
flexible demand or energy storage, in response to the growing share of variable (and partly
decentralized) RES production.

6 September 2016 3.J00 - The potential of energy citizens in the European Union
It is furthermore important to note that the findings of this study are subject
to many uncertainties. The research on this topic is still limited, as is the data
on the current situation. However, the calculations are based as much as
possible on available data, using a transparent methodology that is based on
sound reasoning.
The main result of this project is an Excel workbook that contains the detailed
findings (data) of this study. This report aims to describe the context of the
study and the methodology used. Some illustrative results are presented in
Chapter 4, whereas conclusions and recommendations are provided in the final
chapter.
1.1 Project objectives and scope
The main objective of this study is to assess the following, for different
categories of energy citizens:
1. The potential installed renewable energy capacity.
2. The potential of renewable energy generation.
3. The potential capacity for demand side flexibility (incl. storage).
4. The total number of prosumers or energy citizens this represents.
The study distinguishes between the following types of energy citizens:
1. Individuals or households producing energy individually.
2. Individuals or households producing energy collectively through
organisations such as cooperatives or associations.
3. Public entities (incl. cities and municipal buildings, schools, hospitals,
government buildings).
4. Small enterprises (< 50 staff).
The number of households, public entities and small enterprises that could be
involved in energy production, demand flexibility and energy storage is
estimated for today, in 2030 and 2050, both at the EU level and at Member
State level. The Greenpeace Energy [R]evolution scenario was used as a
framework for the study. One of the key characteristics of this scenario is that
it assumes that the global energy supply is 100% sustainable in 2050.
The study focusses on electricity options, both for energy generation and for
demand side flexibility and storage options. It includes the technologies that
are currently expected to provide the largest potential contribution to the
energy system:
For renewable energy production, solar photovoltaic (solar PV) and wind
power production are included.
To determine the potential of future flexible demand and storage options,
stationary batteries, smart electric boilers and electric vehicles are
assessed.
In addition, some insight is provided on the investments and cost benefits of
these developments. However, whereas the four questions above are answered
quantitatively, this issue is assessed qualitatively only (see Chapter 3).

7 September 2016 3.J00 - The potential of energy citizens in the European Union
2 Methodology
2.1 Introduction
To derive the quantitative estimates of this study, different calculation
methods were developed for each renewable energy source (RES) and
flexibility demand option. These methods are visualised as schematics in
Paragraph 2.2 to Paragraph 2.10. For RES, wind and solar photovoltaic (PV)
were taken into account. For demand side flexibility, stationary batteries,
electric boilers and electric vehicles were analysed. The last schematic shows
the calculation method that was derived to estimate the total number of
energy citizen households that own one or more of these technologies.
The colouring applied in the schematics in the following paragraphs indicate
the type and origin of the data, and use the structure as depicted in the
coloured legend below. The numbers in brackets indicate the data source, and
refer to the reference list at the end of this report.
Figure 1 Legend of schematics
An example block is shown in Figure 2. The grey upper part indicates a result
whereas the orange bottom part indicates the scope of the data. In this case
the result is the number of energy citizens which are defined per energy
citizen type, for all three years investigated and per Member State.
Figure 2 Example block in schematics
All the calculation methods are elaborated in the Excel workbook where the
same colour coding as in Figure 1 is applied.
A comprehensive overview of the variables used for the calculations is
included in Annex A of this report. It should be noted that a significant share
of these variables is coded yellow, indicating that these are the author’s
estimates.
Number of energy
citizens
All Member States
2015-2030-2050
Energy citizen
types

8 September 2016 3.J00 - The potential of energy citizens in the European Union
2.2 Wind power in 2015
Figure 3 Schematics of the calculation for wind power in 2015
To determine the potential for wind power, the energy citizen groups
households collectively (A) and micro and small enterprises (B) are analysed.
Public entities and individual households owning wind power are currently very
scarce and are therefore ignored in this analysis.
A. The data available on collectives was limited. New Member State data that
becomes available can be added to the model and will automatically
improve the estimates. In the current calculations the average of the
Netherlands and France is used when the specific variable is not available
for a certain Member State.
As a starting point the number of collectives per Member State is split into
wind and solar collectives based on the average division of the Netherlands
and France.
W in d p o w e r
c a p a c it y (G W ) a n d
g e n e ra t io n (T W h )
[6 ,8 ]
A ll M e m b e r S ta te s
N u m b e r o f
c o lle c t iv e s [7 ]
N L , B E , H R , D K , F I,
F R , D E , G R , IE , IT ,
L U , N L , P T , E S , S E ,
G B
C o lle c t iv e w in d
p o w e r c a p a c it y
(G W ) a n d
g e n e ra t io n (T W h )
A ll M e m b e r S ta te s
N u m b e r o f e n e rg y
c it iz e n s in w in d
e n e rg y c o lle c t iv e s
A ll M e m b e r S ta te s
C o lle c t iv e w in d
p o w e r c a p a c it y
(G W ) a n d
g e n e ra t io n (T W h )
N L , F R
O th e r M e m b e r
S ta te s sa m e
a v e ra g e p e r
c o lle c t iv e a s N L ,
F R
N u m b e r o f
m e m b e rs in
c o lle c t iv e s
N L , F R
O th e r M e m b e r
S ta te s sa m e
a v e ra g e p e r
c o lle c t iv e a s N L ,
F R
S h a re w in d p o w e r
o w n e d b y m ic ro
a n d sm a ll
e n te rp r ise s .
W in d p o w e r
c a p a c it y (G W ) a n d
g e n e ra t io n (T W h )
m ic ro a n d sm a ll
e n te rp r ise
A ll M e m b e r S ta te s
N u m b e r o f m ic ro
a n d sm a ll
e n te rp r ise e n e rg y
c it iz e n s w in d
A ll M e m b e r S ta te s
S iz e o f in s ta lla t io n p e r
m ic ro a n d sm a ll
e n te rp r ise
D iv is io n so la r a n d
w in d
N L , F R
D iv is io n so la r/
w in d b a se d o n
a v e ra g e o f N L , F R
M ic ro a n d sm a ll e n te rp r ise s
C o lle c t iv e s
A
B

9 September 2016 3.J00 - The potential of energy citizens in the European Union
For both solar and wind, the number of collectives per Member State is
multiplied with the following variable (which is based on the average of
the Netherlands and France if no data is available for the Member State)
to get to the desired end results:
the average installed capacity per collective is used to calculate the
installed capacity per Member State;
the average electricity generation per collective is used to calculate
the electricity generation per Member State;
the number of members per collective is used to calculate the number
of energy citizens per Member State.
B. The currently installed capacity and electricity generation per Member
State is used as an input. This is then limited by an estimate of the
fraction that is owned by micro and small enterprises (mainly farmers).
As a last step this outcome is divided by the average size of installation per
micro and small enterprise resulting in the number of energy citizens.
2.3 Wind power in 2030 and 2050
Figure 4 Schematics of the calculation for wind power in 2030 and 2050
W in d p o w e r
c a p a c it y (G W ) a n d
g e n e ra t io n (T W h )
E [R ] O E C D E u ro p e
[2 0 ]
C o lle c t iv e w in d
p o w e r c a p a c it y
(G W ) a n d
g e n e ra t io n ( T W h )
A ll M e m b e r S ta te s
N u m b e r o f e n e rg y
c it iz e n s in w in d
e n e rg y c o lle c t iv e s
A ll M e m b e r S ta te s
T e c h n ic a l p o te n t ia l
fo r o n sh o re w in d
[1 8 ]
2 7 M e m b e r S ta te s
In s ta lle d o n sh o re
w in d a c c o rd in g to
E [R ]
A ll M e m b e r S ta te s
N u m b e r o f e n e rg y
c it iz e n s a n d
c a p a c it y in s ta lle d
m ic ro a n d sm a ll
e n te rp r ise s
A ll M e m b e r S ta te s
S h a re w in d p o w e r
o w n e d b y m ic ro
a n d sm a ll
e n te rp r ise s .
E s t im a te d
in v e stm e n t p o te n t ia l
h o u se h o ld s
A ll M e m b e r S ta te s
S h a re o n sh o re [2 7 ]
S h a re
c o lle c t iv e w in d
A
B
C
O E C D E u ro p e to E U 2 8
A v e ra g e
in s ta lla t io n s iz e
p e r m e m b e r o f
c o lle c t iv e
P o w e r c a p a c it y
(G W ) a n d
g e n e ra t io n (T W h )
m ic ro a n d sm a ll
e n te rp r ise s
A ll M e m b e r S ta te s
A v e ra g e
in s ta lla t io n s iz e
p e r m ic ro a n d
sm a ll e n te rp ise
C o st s o f w in d
p o w e r W
W

10 September 2016 3.J00 - The potential of energy citizens in the European Union
A. The technical potential for onshore wind as published by the European
Environmental Agency is taken as a starting point. This potential is then
limited by the amount of wind energy needed in the Energy Revolutions
2015 scenario2 and limited by the share that is currently located onshore.
B. The amount of wind power that will be installed by collectives is
determined by the investment potential of households (see Section 2.6)
and the cost of wind power. This investment potential is divided among
solar on own roof, collective wind and collective solar. The installed
capacity can now be divided by the average installation size per member
of the collective, to calculate the number of energy citizens.
C. The share of wind power that may be installed by micro and small
enterprises is calculated using an estimate of the share of wind owned by
this energy citizen group.
2.4 Solar power in 2015
Figure 5 Schematics of the calculation for solar power in 2015
2 Note that the Energy Revolution scenario only provides data for OECD Europe, not for EU28
which is the focus of this study. To arrive at an EU28 figure, the data are corrected using the
difference in population of OECD Europe compared to EU28.
S o la r p o w e r
c a p a c it y (G W ) a n d
g e n e ra t io n (T W h )
[4 ]
A ll M e m b e r S ta te s
S o la r p o w e r
c a p a c it y (G W ) a n d
g e n e ra t io n (T W h )
A ll M e m b e r S ta te s
E n e rg y c it iz e n
t y p e s
N u m b e r o f e n e rg y
c it iz e n s
A ll M e m b e r S ta te s
D iv is io n s iz e s o f
in s ta lla t io n s
[1 7 ]
A ll M e m b e r S ta te s
A v e ra g e s iz e o f
in s ta lla t io n
S e e c o lle c t iv e s W in d 2 0 1 5
S h a re o f in s ta lle d
c a p a c it y
E n te rp r ise s a n d
P u b lic e n t it ie s
A
C
B
E n e rg y c it iz e n
t y p e s
E n e rg y c it iz e n
t y p e s
W
W

11 September 2016 3.J00 - The potential of energy citizens in the European Union
A. The solar PV installed capacity and electricity generation from
Eur’Observer is used as a basis, and is divided into different sizes of
installations. The smallest size is assigned to the household’s category
while the larger installations are partly assigned to micro and small
enterprises and public entities through an estimate of their share.
B. The number of energy citizens is calculated by dividing the installed
capacity by an estimate of the average size of the installations each
energy citizen type owns.
C. The data of the collective solar PV is calculated using the methodology for
the collectives as described in Section 2.2.
2.5 Solar power in 2030 and 2050
Figure 6 Schematics of the calculation for solar power in 2030 and 2050
For the estimates of solar PV in 2030 and 2050, the calculations make a
distinction between building based and ground based solar PV.
A. The technical potential for solar PV on rooftops is calculated using the
floor area of the different types of buildings from Eurostat combined with
building and solar PV characteristics found in literature.
S o la r p o w e r
c a p a c it y (G W ) a n d
g e n e ra t io n (T W h )
[E n e rg y
R e v o lu t io n s ]
O E C D E u ro p e
L a n d c o v e r [1 4 ]
2 7 M e m b e r S ta te s
N u m b e r o f e n e rg y
c it iz e n s
A ll M e m b e r S ta te s
B u ild in g b a se d
so la r p o w e r
c a p a c it y (G W ) a n d
g e n e ra t io n (T W h )
A ll M e m b e r S ta te s
e n e rg y c it iz e n ty p e s
B u ild in g s to c k
d iv id e d in to
h o u se s , p u b lic a n d
c o m m e rc ia l
b u ild in g s [1 2 ]
2 7 M e m b e r S ta te s
T e c h n ic a l p o te n t ia l
ro o f to p s
h o u se h o ld s , p u b lic
a n d c o m m e rc ia l
(T W h )
A ll M e m b e r S ta te s
S h a re o f ro o f u se d
U se d ro o fto p s o f
h o u se s , p u b lic a n d
c o m m e rc ia l
b u ild in g s in
a c c o rd a n c e w ith
E [R ] (T W h )
A ll M e m b e r S ta te s
L a n d c o v e r u sa b le
fo r g ro u n d b a se d
so la r p o w e r
A ll M e m b e r S ta te s
G ro u n d b a se d
c o lle c t iv e so la r
p o w e r c a p a c it y
(G W ) a n d
g e n e ra t io n (T W h )
A ll M e m b e r S ta te s
In s ta lle d c a p a c it y p e r
m e m b e r o f c o lle c t iv e
g ro u n d b a se d
B u ild in g a n d P V
c h a ra c te r is t ic s [9 ]
S e le c t io n o f la n d
E n te rp r ise s a n d
P u b lic e n t it ie s
E s t im a te d
in v e stm e n t p o te n t ia l
h o u se h o ld s
A ll M e m b e r S ta te s
E s t im a te d
in v e stm e n t p o te n t ia l
h o u se h o ld s
A ll M e m b e r S ta te s
B u ild in g b a se d
G ro u n d b a se d
S h a re b u ild in g
b a se d P V
S h a re
c o lle c t iv e P V
S o la r p o w e r
c a p a c it y (G W ) a n d
g e n e ra t io n ( T W h )
[E n e rg y
R e v o lu t io n s ]
O E C D E u ro p e
H o u se h o ld s a n d
c o lle c t iv e s
A
B
C
D
A v e ra g e P V
in s ta lla t io n s iz e
E
F
G
O E C D E u ro p e to E U 2 8
O E C D E u ro p e to E U 2 8
E n e rg y c it iz e n
t y p e s
E n e rg y c it iz e n
t y p e s
W
W

12 September 2016 3.J00 - The potential of energy citizens in the European Union
B. This potential is limited by the total solar PV capacity needed according to
the Energy Revolutions scenario (see also Footnote 2). This outcome is
divided between ground and building based solar PV using an estimate of
the share of each of these.
C. The estimated investment potential (see Section 2.6) is limited by the
share that is allocated to solar PV on single family buildings.
D. For the energy citizen categories micro and small enterprises and public
entities the share of available roof that they may use to install solar PV is
estimated.
E. Both C and D are first combined into the total installed capacity and
electricity generation. They are then used to calculate the number of
energy citizens using an estimate of the average solar PV installation size
per energy citizen type.
F. For ground based application of solar PV the land cover from Eurostat is
used as an input3. This surface per Member State is limited by the selection
of land. Once again this surface is limited by the amount needed for the
Energy Revolutions scenario. The share of investment potential of
households allocated for collective solar PV is split between building and
ground based. Using the price of solar PV the installed capacity and
electricity generation is calculated.
G. By dividing the output of F by the estimate of the installed capacity per
member of collective, the number of energy citizens that collectively
invest in ground based solar PV is calculated.
2.6 Investment potential households in renewable energy
Figure 7 Schematics of the calculation of the investment potential of households in renewable energy
3 The data source for land cover is the LUCAS survey which defines 9 types of land cover of
which 'bare land' was used for this study. The definition of bare land is ‘Areas with no
dominant vegetation cover on at least 90% of the area or areas covered by lichens.’’. This
also includes bare agricultural land but only a very small fraction of the bare land is being
used for PV in our calculations.
E u ro b a ro m e te r
[2 1 ]
A ll M e m b e r S ta te s
S e le c t io n o f
to p ic s
N u m b e r o f
h o u se h o ld s [2 ]
2 0 1 5 -2 0 3 0 -2 0 5 0
A ll M e m b e r S ta te s
N u m b e r o f
h o u se h o ld s th a t
w ill w a n t to in v e st
A ll M e m b e r S ta te s
2 0 1 5 -2 0 3 0 -2 0 5 0
A v e ra g e sa v in g ra te
1 9 9 5 -2 0 1 5 [2 3 ]
A ll M e m b e r S ta te s
N o rm a liz a t io n
M in a n d m a x
a m o u n t a
h o u se h o ld w ill
in v e st p e r y e a r
In v e stm e n t
p o te n t ia l
h o u se h o ld s
A ll M e m b e r S ta te s
2 0 1 5 -2 0 3 0 -2 0 5 0
A
B
C
d d

13 September 2016 3.J00 - The potential of energy citizens in the European Union
A. The Eurobarometer contains statistics on which topics concern citizens the
most. By selecting the relevant topics, the share of households that will
want to invest in renewable energy is estimated.
B. The total amount this group can invest is limited by multiplying their
normalized average savings rate between 1995 and 2015 with an estimated
minimal and maximum amount each household will invest yearly.
C. By multiplying the number of households that will want to invest by the
amount calculated in B, the investment potential per country is
calculated.
2.7 Stationary batteries
Figure 8 Schematics of the calculation for stationary batteries
A. In this calculation the number of installed stationary batteries is expressed
as a share of solar PV installations calculated in Paragraph 2.5. This share
is expressed using an S-curve adoption rate with two values for 2030 and
2050. Since the current number of stationary batteries is negligible, no
value is calculated for 2015.
N u m b e r o f e n e rg y
c it iz e n s P V
A ll M e m b e r S ta te s
O u tp u t so la r
S -c u rv e a d o p t io n
b a t te ry s to ra g e a t
P V lo c a t io n s
2 0 3 0 -2 0 5 0
S to ra g e c a p a c it y
p e r b a t te ry
(k W h / k W p )
2 0 3 0 -2 0 5 0
N u m b e r o f
b a t te r ie s
A ll M e m b e r S ta te s
2 0 1 5 -2 0 3 0 -2 0 5 0
T o ta l d e m a n d s id e
f le x ib il it y s to ra g e
(G W h )
A ll M e m b e r S ta te s
2 0 1 5 -2 0 3 0 -2 0 5 0
N u m b e r o f e n e rg y
c it iz e n s
A ll M e m b e r S ta te s
2 0 1 5 -2 0 3 0 -2 0 5 0
In s ta lle d c a p a c it y
P V (G W p )
A ll M e m b e r S ta te s
O u tp u t so la r
F le x ib il it y p o w e r
(G W )
A ll M e m b e r S ta te s
2 0 1 5 -2 0 3 0 -2 0 5 0
C h a rg in g / d isc h a rg in g
p o w e r (k W / k W h )
A
B
C
E n e rg y c it iz e n
t y p e s
E n e rg y c it iz e n
t y p e s
E n e rg y c it iz e n
t y p e s
E n e rg y c it iz e n
t y p e s
E n e rg y c it iz e n
t y p e s
E n e rg y c it iz e n
t y p e s
E n e rg y c it iz e n
t y p e s

14 September 2016 3.J00 - The potential of energy citizens in the European Union
B. The total demand side flexibility storage of these stationary batteries is
calculated by multiplying the number of batteries by the storage amount
needed per kWp of solar PV installed.
C. This storage capacity is multiplied by the charging/discharging power to
get to the flexibility power (GW).
N.B. In this calculation the number of installed stationary batteries is directly
linked to the number of energy citizens with a solar PV installation.
The motivation for this is that the batteries are most beneficial for those
citizens that generate their own energy, since the batteries then enable them
to store any excess electricity for later consumption or sale. If the battery is
only used to speculate on the electricity prices, the value added will be lower.
2.8 Smart electric boilers
Figure 9 Schematics of the calculation for electric boilers
N u m b e r o f e le c t r ic
b o ile r s 2 0 0 4 [2 2 ]
2 2 M e m b e r S ta te s
T o ta l d e m a n d s id e
f le x ib il it y s to ra g e
(G W h )
A ll M e m b e r S ta te s
2 0 1 5 -2 0 3 0 -2 0 5 0
N u m b e r o f e n e rg y
c it iz e n s
A ll M e m b e r S ta te s
2 0 1 5 -2 0 3 0 -2 0 5 0
S -c u rv e e le c t r ic
b o ile r s
A v e ra g e
s to ra g e
c a p a c it y o f
e le c t r ic b o ile r
(k W h )
2 0 1 5 -2 0 3 0 -2 0 5 0
O th e r M e m b e r
S ta te s b a se d o n
a v e ra g e
S -c u rv e sm a rt
a d d it io n to b o ile r s
2 0 1 5 -2 0 3 0 -2 0 5 0
T o ta l d e m a n d s id e
f le x ib il it y p o w e r
(G W )
A ll M e m b e r S ta te s
2 0 1 5 -2 0 3 0 -2 0 5 0
A v e ra g e
e le c t r ic p o w e r
E -b o ile r (k W )
A
B
C
D
s

15 September 2016 3.J00 - The potential of energy citizens in the European Union
A. Data on the number of electric boilers in 2004 for 22 Member States is used
as a primary input. The number of electric boilers in the other Member
States is estimated using the average share of households with an electric
boiler in these 22 Member States.
B. The number of electric boilers in 2004 is expected to grow over time, to
estimate this growth rate an S-curve adoption rate is applied. Current
boilers are not ‘smart’, though, i.e. they are not yet equipped to provide
demand flexibility. An S-curve adoption rate is therefore also used to
determine the share of these boilers that will be enhanced with smart
abilities so it can be used for flex demand. The output with both these S-
curves applied, is the number of energy citizens.
C. To calculate the total demand side flexibility storage (GWh), the amount
of smart electric boilers is multiplied by their average storage capacity.
D. To calculate the total demand side flexibility power (GW), the number of
smart electric boilers is multiplied by the average electric power of the
electric boilers.
2.9 Electric vehicles
Figure 10 Schematics of the calculation for electric vehicles
N u m b e r o f E V s in
2 0 1 5 [2 9 ]
A ll M e m b e r S ta te s
S -c u rv e a d o p t io n
ra te
2 0 3 0 -2 0 5 0
N u m b e r o f E V s
A ll M e m b e r S ta te s
2 0 1 5 -2 0 3 0 -2 0 5 0
N u m b e r o f e n e rg y
c it iz e n s
A ll M e m b e r S ta te s
2 0 1 5 -2 0 3 0 -2 0 5 0
T o ta l d e m a n d s id e
f le x ib il it y s to ra g e
(G W h )
A ll M e m b e r S ta te s
2 0 1 5 -2 0 3 0 -2 0 5 0
S h a re a v a ila b le
fo r f le x (% )
A v e ra g e b a t te ry
s to ra g e c a p a c it y o f
E V (k W h )
2 0 1 5 -2 0 3 0 -2 0 5 0
S h a re p r iv a te ,
p u b lic a n d m ic ro
a n d sm a ll
e n te rp r ise s
T im e E V is
p lu g g e d in (% )
P o p u la t io n a n d
n u m b e r o f
h o u se h o ld s [1 ,2 ]
A ll M e m b e r S ta te s
2 0 1 5 -2 0 3 0 -2 0 5 0
N u m b e r o f E V s p e r
o w n e r
P a sse n g e r c a rs p e r
1 ,0 0 0 in h a b ita n t s
[2 8 ]
A ll M e m b e r S ta te s
N u m b e r o f c a rs
2 0 3 0
A ll M e m b e r S ta te s
A
B
C
D
E
T o ta l d e m a n d s id e
f le x ib il it y p o w e r
(G W )
A ll M e m b e r S ta te s
2 0 1 5 -2 0 3 0 -2 0 5 0
C h a rg in g /
d isc h a rg in g
p o w e r (k W / k W h )
F
E n e rg y c it iz e n
t y p e s
E n e rg y c it iz e n
t y p e s
E n e rg y c it iz e n
t y p e s
E n e rg y c it iz e n
t y p e s
E n e rg y c it iz e n
t y p e s
E n e rg y c it iz e n
t y p e s
s

16 September 2016 3.J00 - The potential of energy citizens in the European Union
A. The number of cars in total and per household is calculated using the
Eurostat statistics for the population, number of households and number of
passenger cars per 1,000 inhabitants. In the model it is assumed that the
current number of cars will stay the same. By applying an estimated
adoption rate, the number of electric vehicles (EVs) is estimated for 2030
and 2050.
B. For 2015 the current number of EVs is known, this number per Member
State is further processed the same for all three time frames.
C. The total number of EVs is split into the different energy citizen types
using an estimate based on literature.
D. By dividing the number of EVs by an estimate for the number of cars per
type of energy citizen, the number of energy citizens per type is
calculated. For households this is estimated using the statistics from A and
an estimate for the percentage of households that have one car or more.
E. To calculate the total demand side flexibility storage the number of EVs is
multiplied by the average battery capacity, the percentage of time the EV
is plugged in and the share of the battery capacity available for flex. It is
assumed that all EVs (or their charging installations) are equipped with
smart charging capabilities4.
F. This is again multiplied by the charging and discharging power to calculate
the flexible power potential.
2.10 Deduplication energy citizen households
To arrive at the total number of energy citizen households, the number of
households that were calculated in the previous section (i.e. the number that
produce energy, or own specific demand flexibility options) need to be
deduplicated since the same household can have multiple technologies
applied. Three different totals are calculated:
the potential number that have demand response capacity;
the potential number of energy citizens that produce energy;
the number of energy citizens that have both.
The number of energy citizen households that have demand response
capability is calculated as followed:
A. As a basis the number of households that have an electric boiler is used.
Added to this the share of households with an electric vehicle multiplied
with the number of households that don’t have an electric boiler.
B. As a last step the share of households that have a stationary battery is
multiplied with the number of households that don’t have an electric
boiler or an electric vehicle. This results in the total number of households
that can offer demand response.
4 This seems to be a reasonable assumption as EVs are still at the beginning of market uptake,
their technical development is still very much ongoing and smart charging is an issue that has
a lot of attention.
17 September 2016 3.J00 - The potential of energy citizens in the European Union
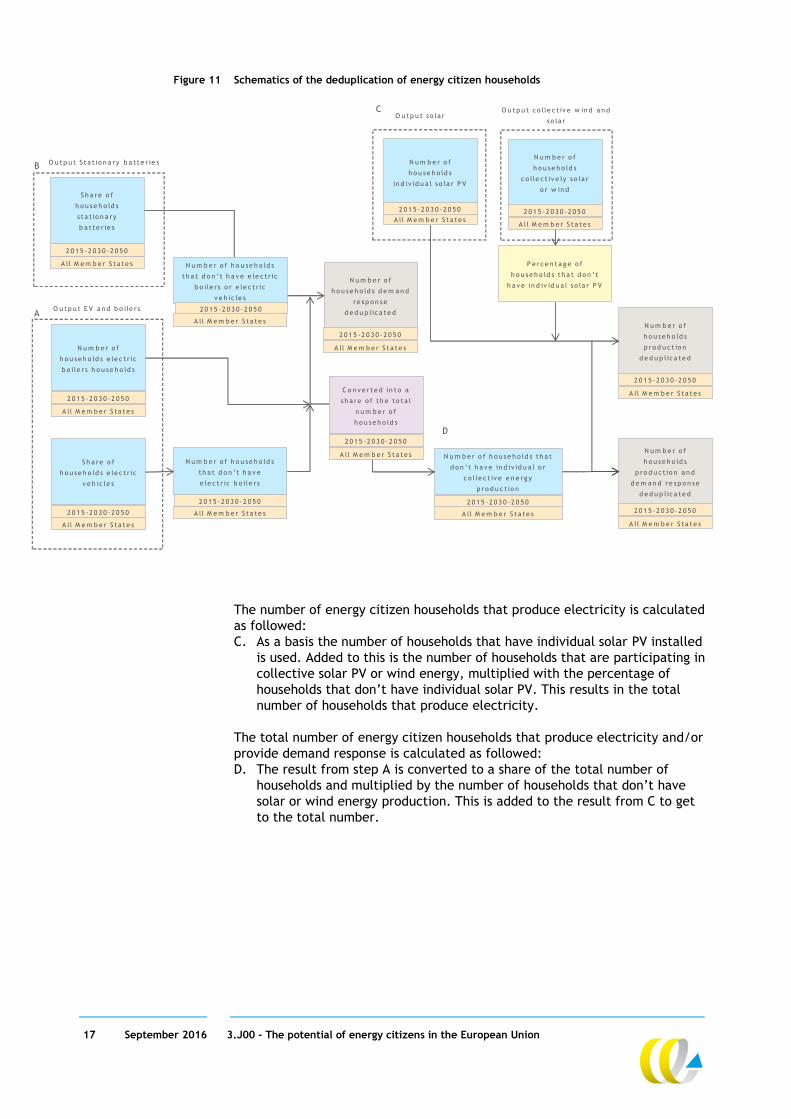
Figure 11 Schematics of the deduplication of energy citizen households
The number of energy citizen households that produce electricity is calculated
as followed:
C. As a basis the number of households that have individual solar PV installed
is used. Added to this is the number of households that are participating in
collective solar PV or wind energy, multiplied with the percentage of
households that don’t have individual solar PV. This results in the total
number of households that produce electricity.
The total number of energy citizen households that produce electricity and/or
provide demand response is calculated as followed:
D. The result from step A is converted to a share of the total number of
households and multiplied by the number of households that don’t have
solar or wind energy production. This is added to the result from C to get
to the total number.
N u m b e r o f
h o u se h o ld s
in d iv id u a l so la r P V
A ll M e m b e r S ta te s
2 0 1 5 -2 0 3 0 -2 0 5 0
N u m b e r o f
h o u se h o ld s
c o lle c t iv e ly so la r
o r w in d
A ll M e m b e r S ta te s
2 0 1 5 -2 0 3 0 -2 0 5 0
N u m b e r o f
h o u se h o ld s e le c t r ic
b o ile r s h o u se h o ld s
A ll M e m b e r S ta te s
2 0 1 5 -2 0 3 0 -2 0 5 0
N u m b e r o f
h o u se h o ld s
p ro d u c t io n a n d
d e m a n d re sp o n se
d e d u p lic a te d
A ll M e m b e r S ta te s
2 0 1 5 -2 0 3 0 -2 0 5 0
S h a re o f
h o u se h o ld s
s ta t io n a ry
b a t te r ie s
A ll M e m b e r S ta te s
2 0 1 5 -2 0 3 0 -2 0 5 0
S h a re o f
h o u se h o ld s e le c t r ic
v e h ic le s
A ll M e m b e r S ta te s
2 0 1 5 -2 0 3 0 -2 0 5 0
O u tp u t S ta t io n a ry b a t te r ie s
O u tp u t so la r
O u tp u t E V a n d b o ile r s
B
A
P e rc e n ta g e o f
h o u se h o ld s th a t d o n ’ t
h a v e in d iv id u a l so la r P V
O u tp u t c o lle c t iv e w in d a n d
so la r
C
N u m b e r o f
h o u se h o ld s
p ro d u c t io n
d e d u p lic a te d
A ll M e m b e r S ta te s
2 0 1 5 -2 0 3 0 -2 0 5 0
N u m b e r o f
h o u se h o ld s d e m a n d
re sp o n se
d e d u p lic a te d
A ll M e m b e r S ta te s
2 0 1 5 -2 0 3 0 -2 0 5 0
N u m b e r o f h o u se h o ld s th a t
d o n ’ t h a v e in d iv id u a l o r
c o lle c t iv e e n e rg y
p ro d u c t io n
N u m b e r o f h o u se h o ld s
th a t d o n ’ t h a v e e le c t r ic
b o ile r s o r e le c t r ic
v e h ic le s
A ll M e m b e r S ta te s
N u m b e r o f h o u se h o ld s
th a t d o n ’ t h a v e
e le c t r ic b o ile r s
2 0 1 5 -2 0 3 0 -2 0 5 0
A ll M e m b e r S ta te s
2 0 1 5 -2 0 3 0 -2 0 5 0
A ll M e m b e r S ta te s
2 0 1 5 -2 0 3 0 -2 0 5 0
D
C o n v e rte d in to a
sh a re o f th e to ta l
n u m b e r o f
h o u se h o ld s
A ll M e m b e r S ta te s
2 0 1 5 -2 0 3 0 -2 0 5 0
s

18 September 2016 3.J00 - The potential of energy citizens in the European Union
3 Investments and cost impacts
The focus of this study was on estimating the potential of energy citizens,
looking at indicators such as renewable energy production capacity, energy
storage capacity and total number of energy citizens in the EU and its Member
States. The economic impacts of these developments – to society as a whole,
to the energy citizens themselves or to other stakeholders – were not assessed,
even though they are without doubt one of the key drivers or barriers to these
developments.
Since this assessment would require detailed and complex modelling, it was
decided not to include it in the scope of this study. Nevertheless, to provide
some insight into the economical aspects of energy citizen developments, the
following contains a brief outline of the key mechanisms that may be
expected.
The large-scale emergence of energy citizens is part of a much larger and
profound transition of the energy system. Energy companies will invest in large
scale on- and off-shore wind parks, industry will implement a range of demand
side flexibility options such as power to heat and power to products. Power to
gas and power to liquid plants might emerge and energy infrastructure needs
to be adapted to the new situation. And, last but not least, government
authorities (EU and national) will need to modify energy market regulations
and adapt their legal, regulatory and probably also fiscal framework. All these
developments will impact future electricity price and price fluctuations.
Determining the cost and benefits of energy citizens within these complex and
still uncertain developments would require a thorough assessment of potential
developments in the system, including a detailed modelling exercise of a
number of feasible scenarios.
For example, demand side flexibility of energy citizens can have a clear
economic value, most notably:
It can reduce peak loads on grids.
It reduces the need for backup capacity in times of low RES production.
Flexibility allows the energy citizen to benefit from periods of low
electricity price in times of high solar and wind generation.
However, the extent of this benefit depends significantly on what other
flexibility and storage measures are implemented by the other actors in the
system, on the local grid character, on interconnection capacity
developments, etc.
As another example, the cost savings that can be achieved through a wind
energy cooperation will depend on, inter alia, the electricity price that is
received for the wind energy generated. Since the amount of wind generated
electricity will increase significantly over the coming years, the risk increases
that the price will be low in times of high wind speeds – unless there are
sufficient options in place to reduce these price fluctuations, such as demand
side flexibility, storage and interconnections.

19 September 2016 3.J00 - The potential of energy citizens in the European Union
Clearly, developing the potential of energy citizens requires investments and
generates significant societal, environmental and economic benefits. However,
it will also save the need for other investments in RES, demand side flexibility
and storage, which would also create benefits. To assess the net cost, the
economic benefits and cost of the developments analyzed in this study should
therefore be compared against other scenarios for a 100% renewable energy
system, or to a well-defined reference scenario.

20 September 2016 3.J00 - The potential of energy citizens in the European Union
4 Results
As explained in the introductory chapter, the main result of this project is a
comprehensive Excel spreadsheet which contains all quantitative results of this
project. From these data, quite a number of different cross sections can be
made, since the data differentiate between a number of categories of energy
citizens, assess different technologies and indicators, for different years and
EU Member States.
In the following, a number of graphs are shown that illustrate the range of
data produced and show some key results. These results are produced using
the methodology described in Chapter 2, with the assumptions listed in the
Annex to this report.
Figure 12 shows the potential number of EU energy citizens for the various
technologies assessed, in 2050. With the assumptions used, we estimate that
about 115 million EU households will have an electric vehicle in 2050, 70
million may have a smart electric boiler, 60 million may have solar PV on their
roof and 42 million may have stationary batteries on their premises. Another
64 million households could participate in renewable energy production
through an energy collective.
Some of these households will have more than one of these technologies, so
using the deduplication methodology described in the previous chapter we
arrive at an estimated total of 187 million EU households that may contribute
to renewable energy production, demand response and/or energy storage in
2050. This is about 83% of the total number of EU households.
About half of all EU households, around 113 million, may produce energy,
either individually or through a collective. About 161 million can potentially
provide flexible demand services with an EV, (smart) electric boiler or
stationary batteries. A large share of the households that could have demand
flexibility could also be an energy producer.
We furthermore estimate the potential number of small enterprises that can
actively participate in the energy system in 2050 to be 5 to 6 million, the
potential number of public entities about 400 thousand.

21 September 2016 3.J00 - The potential of energy citizens in the European Union
Figure 12 Number of energy citizens for the various technologies assessed, potential to 2050 for the
EU28
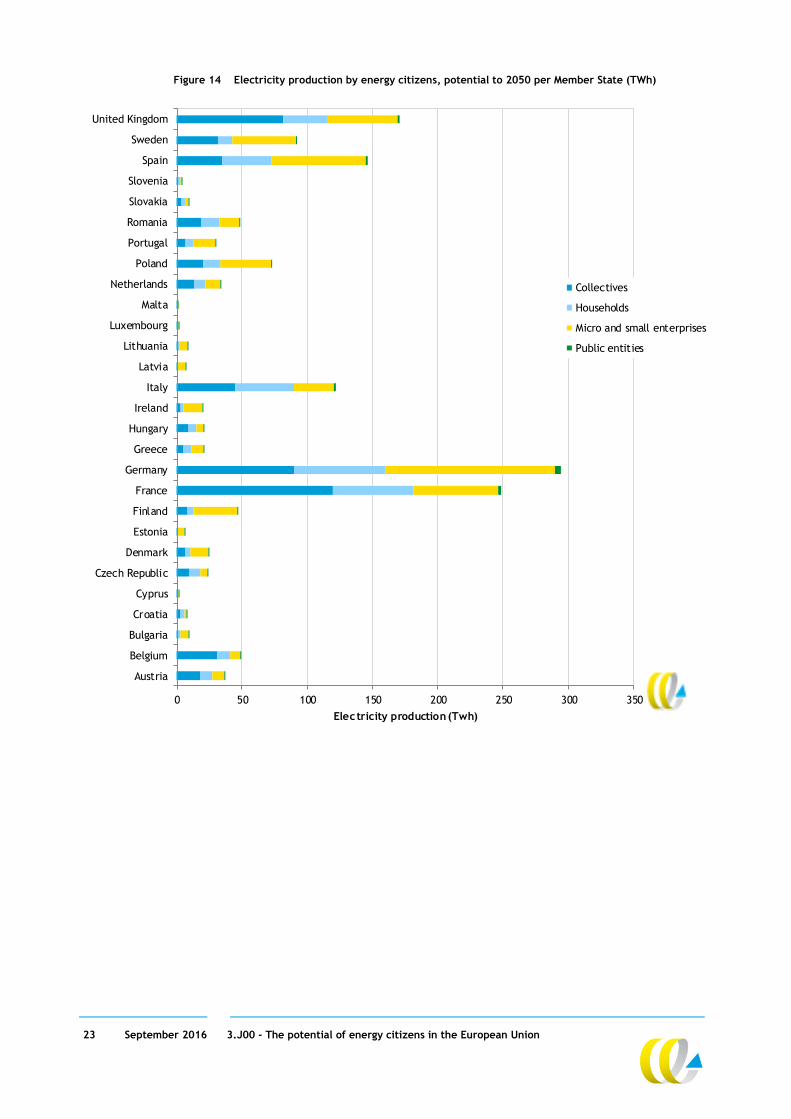
The following graphs show some more results, on:
The potential electricity production by energy citizens in 2050, per
category (Figure 13) and per Member State (Figure 14);
The potential development of energy storage by energy citizens over time
(Figure 15).
0
20.000.000
40.000.000
60.000.000
80.000.000
100.000.000
120.000.000
140.000.000
Electricboilers
Electricvehicles
Solar Stationarybatteries
Wind
Nu
mb
er
of e
nerg
y c
itiz
ens
Public entities
Micro and small enterprises
Households
Collectives

22 September 2016 3.J00 - The potential of energy citizens in the European Union
Figure 13 Estimated potential for electricity production by the various energy citizen categories, in 2050
for the EU28 (TWh)
0
100
200
300
400
500
600
700
800
900
1.000
Solar Wind
Ele
ctr
icit
y p
rod
uct
ion (T
Wh)
Public entities
Micro and small enterprises
Households
Collectives
23 September 2016 3.J00 - The potential of energy citizens in the European Union
Figure 14 Electricity production by energy citizens, potential to 2050 per Member State (TWh)
0 50 100 150 200 250 300 350
Austria
Belgium
Bulgaria
Croatia
Cyprus
Czech Republic
Denmark
Estonia
Finland
France
Germany
Greece
Hungary
Ireland
Italy
Latvia
Lithuania
Luxembourg
Malta
Netherlands
Poland
Portugal
Romania
Slovakia
Slovenia
Spain
Sweden
United Kingdom
Electricity production (Twh)
Collectives
Households
Micro and small enterprises
Public entities

24 September 2016 3.J00 - The potential of energy citizens in the European Union
Figure 15 Potential energy storage by energy citizens, estimates for 2015, 2030 and 2050 (GWh)
0
2.000
4.000
6.000
8.000
10.000
12.000
2015 2030 2050
En
erg
y s
tora
ge (G
Wh)
Stationary batteries
Electric vehicles
Electric boilers

25 September 2016 3.J00 - The potential of energy citizens in the European Union
5 Conclusions and recommendations
The potential for European households, energy collectives, public entities and
small enterprises to actively contribute to the future energy system is clearly
very significant. We estimate that about 83% of the EU’s households could
potentially become an active participant, which amounts to about 187 million
households. These energy citizens could produce renewable electricity, adapt
electricity demand to renewable energy production or store energy at times of
oversupply.
A calculation tool was developed to estimate the potential of various energy
citizen categories in 2030 and 2050 (households, public entities etc.), looking
at a number of different technical options. This resulted in a range of data on
the potentials, in terms of number of energy citizens, renewable energy
capacity or production, etc. The main results can be found in the Excel file
that accompanies this report.
The data and knowledge on the role of energy citizens, both now and in the
future, is still very limited. Consequently, the results in this study depend on a
large number of assumptions, estimates and methodological choices, and the
uncertainties are significant. However, the calculations were based on existing
data as far as possible, and the methodology developed is as much as possible
based on well-founded reasoning. The resulting data can therefore be seen as
a first assessment of the potential of energy citizens in the EU.
The main objective of this study was to produce estimates for the potential
number of energy citizens and their contribution to the energy system.
It is recommended to follow up this study with a further assessment of the
data, and of the calculation methodology. A sensitivity analysis of the various
assumptions and variables may be useful to further test the robustness of the
methodology used, and to determine and analyse the key drivers for these
developments. It is also recommended to further develop data gathering about
energy citizens, and increase research on these potential future
developments.
Other issues that could be explored further are how this potential for
European households, energy collectives, public entities and small enterprises
to actively contribute to the future energy system can be realised, and how a
future with a large number of energy citizens compares with a more
centralized development of a sustainable energy future.

26 September 2016 3.J00 - The potential of energy citizens in the European Union
References
1. Population
The Council of the EU, 2015. Council Decision (EU, Euratom) 2015/2393.
Official Journal of the European Union, Volume L332, p. 133.
2. Population Projections
Eurostat, 2014a. Main scenario - Population on 1st January by age and sex.
[Online]
Available at:
http://appsso.eurostat.ec.europa.eu/nui/show.do?dataset=proj_13npms&lang
=en
[Accessed 2016].
3. Number of households
Eurostat, 2016. Number of private households by household composition,
number of children and age of youngest child (1 000). [Online]
Available at:
http://appsso.eurostat.ec.europa.eu/nui/show.do?dataset=lfst_hhnhtych&lan
g=en
[Accessed 2016].
4. Solar installed capacity and production
Eurobserv'er, 2016a. Photovoltaic Barometer. [Online]
Available at: www.eurobserv-er.org/pdf/photovoltaic-barometer-2016-en/
[Accessed 2016].
5. Building Stock
BPIE, ongoing. BPIE Data Hub for the energy performance of buildings. [Online]
Available at: www.buildingsdata.eu
[Accessed 2016].
6. Wind Installed capacity
EWEA, 2016. Wind in power 2015 European statistics, s.l.: The European Wind
Energy Association (EWEA).
7. Number of cooperatives
RESCoop, 2016. Policy Makers-Facts and figures. [Online]
Available at: https://rescoop.eu/facts-figures-0
[Accessed 2016].
8. Windpoduction
Eurobserv’er, 2016b. Wind Energy Barometer. [Online]
Available at: www.eurobserv-er.org/pdf/wind-energy-barometer-2016-en
[Accessed 2016].
9. Technical Potential
Defaix, P., Stark, W. v., Worrell, E. & Visser, E. d., 2012.
Technical potential for photovoltaics on buildings in the EU27. Solar Energy,
86(9), pp. 2644-2653.

27 September 2016 3.J00 - The potential of energy citizens in the European Union
10. IEA PVPS Trends 2015 - Irradiation per country
IEA-PVPS, 2015. Trends 2015 in Photovoltaic applications: survey Report of
Selected IEA Countries between 1992-2014, s.l.: International Energy Agency
(IEA).
11. Solar Resource and Photovoltaic Electricity Potential in EU-MENA Region
Juraj Beták, Šúri, M., Cebecauer, T. & Skoczek, A., 2012. Solar Resource and
Photovoltaic Electricity Potential in EU-MENA Region, Bratislava: SolarGIS.
12. BPIE buildings data
BPIE, ongoing. BPIE Data Hub for the energy performance of buildings. [Online]
Available at: www.buildingsdata.eu
[Accessed 2016].
13. Landuse Eurostat
Eurostat, 2016a. Database: Land cover and landuse. Landscape (LUCAS).
[Online]
Available at: http://ec.europa.eu/eurostat/web/lucas/data/database
[Accessed 2016].
14. DGRV Statistics on collectives in Germany
DRGV, 2014. Energiegenossenschaften : Ergebnisse der Umfrage des DGRV und
seiner Mitgliedsverbände, Berlin: DGRV – Deutscher Genossenschafts- und
Raiffeisenverband e.V.
15. Statistics on collectives in the Netherlands
Hier opgewekt, 2015. Lokale energie monitor editie 2015 Resultaten en impact
van een beweging, tussenrapportage. [Online]
Available at:
www.hieropgewekt.nl/sites/default/files/u8/pdf_hier_opgewekt_monitor_def
_0.pdf
[Accessed 2016].
16. GMO Solar PV Segmentation
File: GMO_Data_on_segmentation.xlsx Source file obtained from Greenpeace.
17. Europe’s onshore and offshore wind energy potential 2009
EEA, 2009. Europe’s onshore and offshore wind energy potential.
An assessment of environmental and economic constraints, Copenhagen:
European Environment Agency (EEA).
18. Statistics on collectives in France
Groupement Médiation & Environnement, 2016. Quelle intégration territoriale
des énergies renouvelables participatives? : Quelle intégration territoriale des
énergies renouvelables participatives?, Angers Cedex: l‟ADEME.
19. Energy Revolutions data
File: Energy Revolutions-Standard reports summary.xlsx Source file obtained
from Greenpeace.
20. Eurobarometer : Public opinion in the EU
TNS opinion & social, 2015. Public Opinion in the European Union, first results.
Standard Eurobarometer 83/Spring, Brussels: European Commission,
Directorate-General for Communication.

28 September 2016 3.J00 - The potential of energy citizens in the European Union
21. MEErP Preparatory Study on Taps and Showers
EC, JRC, 2014. MEErP Preparatory Study on Taps and Showers. Task 3 report:
Users (version 2), Working document for the 2nd Technical Working Group
meeting, Brussels: European Commission (EC).
22. Household saving rate Eurostat
Eurostat, 2016b. Products Datasets: Household saving rate. [Online]
Available at: http://ec.europa.eu/eurostat/web/products-datasets/-
/tsdec240
[Accessed 2016].
23. Companies size class analysis number of FTE and Value added Eurostat
EC, Eurostat, 2015. Eurostat Statistics Explained: Business economy - size class
analysis. [Online]
Available at: http://ec.europa.eu/eurostat/statistics-
explained/index.php/Business_economy_-_size_class_analysis
[Accesssed 2016].
24. Companies size class number of companies
Eurostat 2016c. Annual enterprise statistics by size class for special aggregates
of activities (NACE Rev. 2). [Online]
Available at:
http://appsso.eurostat.ec.europa.eu/nui/show.do?dataset=sbs_sc_sca_r2&lan
g=en
[Accessed 2016]
25. Companies size class number of companies
26. Costs of Wind Energy
NREL, 2014. 2014 Cost of Wind Energy Review, Golden (US): National
Renewable Energy Laboratory (NREL).
27. Division onshore and offshore EWEA Annual statistics
EWEA, 2016. Wind in power 2015 European statistics, s.l.: The European Wind
Energy Association (EWEA).
28. Passenger cars per 1,000 inhabitants.
Eurostat, 2014b. Passenger cars per 1,000 inhabitants. [Online]
Available at: http://ec.europa.eu/eurostat/en/web/products-datasets/-
/ROAD_EQS_CARHAB
[Accessed 2016].
29. ICCT Pocketbook passenger cars statistics 2014 (p.42)
ICCT, 2015. European Vehicle Market statistics; Pocketbook 2014,
Berlin: International Council on Clean Transportation Europe (ICCT).
30. Share of passenger cars
Ricardo Energy & Environment; TEPR, 2015. Ex-post Evaluation of Directive
2009/33/EC on the promotion of clean and energy efficient road transport
vehicles, Final Report, Brussels: European Commission (EC), Directorate-
General for Mobility and Transport.
31. Share of cars owned by enterprises in NL
VNA, 2013. Zicht op zakelijke (auto)mobiliteit: Overzicht van de belangrijkste
bevindingen, Bunnik: Vereniging van Nederlandse Autoleasemaatschappijen
(VNA).

29 September 2016 3.J00 - The potential of energy citizens in the European Union
32. Share of |Households without a car in NL
CBS, 2015. Huishoudens in bezit van auto of motor; huishoudkenmerken.
[Online]
Available at:
http://statline.cbs.nl/Statweb/publication/?DM=SLNL&PA=81845NED&D1=1,3&
D2=a&D3=0-2,13-31&D4=l&HDR=T,G1&STB=G3,G2&VW=T
[Accessed 2016].
33. OECD Countries
OECD, 2016. Members and Partners. [Online]
Available at: www.oecd.org/about/membersandpartners/
[Accessed 2016].
34. OECD Europe countries
OECD, 2013. Glossary of Statistical Terms: OECD-Europe. [Online]
Available at: https://stats.oecd.org/glossary/detail.asp?ID=1884
[Accessed 2016].
35. Populations
http://data.worldbank.org/indicator/SP.POP.TOTL
36. Solar PV data households NL
De Groene Krant, 2015. Forse toename geregistreerde huishoudens met
zonnepanelen. [Online]
Available at: http://groenecourant.nl/zonne-energie/forse-toename-
geregistreerde-huishoudens-met-zonnepanelen/
[Accessed 2016].
37. Czech Republic energy data 2015ERÚ, 2016.
Roční zpráva o provozu ES ČR 2015, Praha: Oddělení statistiky a sledování
kvality ERÚ.

30 September 2016 3.J00 - The potential of energy citizens in the European Union
Annex A Assumptions Table 1 Solar PV
E[R] OECD Europe E[R]-scenario
[20]
2030 2050
Installed capacity (GW) 305 555 Capacity and generation in Energy Revolution scenario.
Electricity generation (TWh/y) 337 647
Average size of installation
(kWp)
2015 2030 2050
Households 4 5 6 Average size of installation for different energy citizens
groups. For households very typical, size increases due
to efficiency improvements up to 2050. For SME, public
entities provisional estimates.
SME 25 30 35
Public entitites 25 30 35
Per member of collective 1,3 2 2,5
2015 [9] 2030 [9] 2050 Conversion efficiency improves over time due to
technology learning.
Note: rough estimate for 2050. Average efficiency of PV modules
installed
15,80% 19,70% 23,60%
Performance ratio [9] 80% Factor representing conversion losses (inverter) and
other system losses.
Number of floors per building
type
Single family dwellings [9] 2 These figures are needed to calculate roof surface area
for PV.
Multi-family average of low- and
high-rise [9]
5,75
Commercial buildings 4
Public buildings 4
Solar suitable area [9] 40% Factor to correct for obstacles on roof (windows, heat
exchangers, chimneys, etc.).
2030 2050
Investment costs 1 kWp
(2015 Euro)
€ 800 € 500 Indicative costs, needed to calculate energy citizen
capacity based on savings rate.
Share of commercial grade PV
installations (10-250kWp) on roofs
of micro and small enterprises
40% Provisional figure that is needed to attribute some solar
PV capacity to micro and small enterprises and public
entities. We have tried to find some literature backing
up these shares but that is very difficult. The share is
assumed to be the same in all years. Share of commercial grade PV
installations (10-250kWp) on roofs
of public entities
20%
Building
based
Ground
based
Share of installed capacity (2030
and 2050)
80% 20% Estimate.

31 September 2016 3.J00 - The potential of energy citizens in the European Union
Table 2 Wind
E[R] OECD Europe E[R]-scenario
[20]
2030 2050
Installed capacity (GW) 325 510 Capacity and generation in Energy Revolution
scenario.
Electricity generation (TWh/y) 819 1.426
Share onshore in Europe [27] 92% We have to assume a share of wind
onshore/offshore to translate the Greenpeace
figures.
2030 2050
Investment costs 1 kW (2015 Euro) € 900 € 700 Indicative costs, e.g. needed to calculate energy
citizen capacity based on investment potential
Share of wind power owned by
micro and small enterprises
(mainly farmers)
30% Provisional figure that is needed to attribute
some wind generation to small enterprises
(mainly farmers). We have tried to find some
literature backing up these shares but that is
very difficult. The share is assumed to be the
same in all years.
2015 2030 2050
Average installed capacity at
farmer (MW)
0,5 1 1,5 Provisional figures to assess the number of energy
citizens (farmers and collectives)
Capacity per member of collective
(kW)
8,3 10 13
Table 3 Electric boilers
2015 2030 2050
E-boilers added in comparison to
2004
3% 7% 15% Estimates of growth of E-boiler thanks to electrification and excess
renewable electricity. The implied S-curve of technology adoption
results in total electric boiler capacity being growing from 30% in 2004
to a level of 45% in 2050.
2015 2030 2050 As of yet, all boilers are 'dumb', at best they switch on during off-peak
hours. Due to smart grid technology, they can be steered to be price
responsive and complement renewable electricity grid infeed. We
assume 100% of boilers to be 'smart' by 2050, with an implied S-
curve/exponential growth in the number of smart appliances in the next
35 years.
Adoption rate smart addition to
E-boilers
0% 30% 100%
Energy capacity average E-boiler
(kWh)
11,5 Indicative (conservative) assessment, corresponds to what can be easily
stored in an average E-boiler of say 200 litres.
Electric power E-boiler (kW)
@230 V
2,0 An average electric capacity of 2 kW per boiler is in line with current
technology.

32 September 2016 3.J00 - The potential of energy citizens in the European Union
Table 4 Stationary batteries
2030 2050
Adoption battery storage at PV locations 20% 70% For this study we assume that grid connected batteries are
only placed at energy citizens that employ solar PV because
the incentive is the strongest for them e.g. to prevent the
waste of energy due to e.g. solar PV curtailment. We assume
the solar PV capacities to be growing so fast that the grid
cannot keep up, increasing being a bottleneck after 2030 in
many locations. Also we expected storage technology to
improve over time, meaning we assume an exponential
growth rate that approaches 70% market adoption in 2050.
2030 2050
Storage capacity per PV capacity (kWh/kWp) 3 4 The figure reflects the assumption that the storage size
reflects the approximate daily peak production that cannot be
directly used in summertime.
Charging/discharging power (kW/kWh) 0,30 Charging/discharging capacity reflects charging and
discharging to the level of entire storage drained/charged in
3 hours time, which is reasonable.
Table 5 Electric vehicles
2030 2050 These are provisional estimates of the
share of EVs in the EU vehicle fleet for
individual transportation. These figures are
very ambitious, current sales figures must
increase profoundly to meet 20% in 2030.
To move from fossil fuels to carbon
transport, we will have to use high share of
electric personal transport, however.
EV share in fleet 20% 80%
Households Micro and
small
enterprises
Public
[30]
Other
enterprises
The share of households and other energy
citizen groups have been derived from the
current status quo of vehicle ownership
(Dutch data), assumed to be applicable to
future years as well. Share of fleet per energy citizen
type
89% 5% 1% 5%
Number of cars per owner 2 50 Provisional estimate.
2015 2030 2050
Average battery capacity EV
(kWh)
45 60 100 Provisional estimate of battery capacity.
We assume a technology development that
works in two areas - price reduction and
footprint reduction. Both of these
developments allow manufacturers to
increase the storage capacity and range of
the average EV.
Charging/discharging power
(kW/kWh)
0,10 We assume that average peak charging and
discharging of the capacity is done in 10
hours. We obviously chose a lower figure
than fast charging, because of grid
constraints.

33 September 2016 3.J00 - The potential of energy citizens in the European Union
Share of time plugged in 50% Provisional figure.
Share of capacity available for
flex
80% Provisional figure, we don't want every kWh
storage to be allotted to the market
(people want a minimum transport distance
to be able to e.g. go to a hospital at all
times).
Share of households without a
car [32]
28,5% Average of NL is used for EU28 due to
missing data.
Table 6 Investment potential
Min Max Provisional figure for the investment
potential per MS. We assume that
investment depends on the average
savings rate of EU countries. The savings
rate is normalised and used to calculate an
investment potential from households for
solar PV/wind in the different member
states, where the lower end of the
investment amount specified is allotted to
the EU countries with the lowest
households savings rate, and the higher
figure to the EU country with the highest
savings rate, with the other MS falling in
between.
Maximum investment per household
per year (Euro)
100 500
2030 2050 We assume that as the energy transition is
further shaped and the effects of climate
change are being felt more and more, that
the awareness of the population growths
and consequently also the amount that
consumers will want to invest can grow,
with the indicated figures.
Growth in share of citizens that will
want to invest in either solar PV on
own roof, or in collective
50% 100%
Share of investment potential for solar
on roofs of single family buildings
(upper limit)
50% We assume that the investment potential
of households is first allocated to install
solar PV on own roofs since this is
financially more attractive in multiple MS
compared to collective energy (due to
subsidies, energy tax and VAT).
Wind
collective
Solar
collective
The remaining investment potential is split
among wind collectives and solar
collectives. We assume there is no
preference between the two. Division of remaining investment 50% 50%

34 September 2016 3.J00 - The potential of energy citizens in the European Union
Table 7 General
EU28 population compared to OECD Europe
[1, 33, 34, 35]
-10% This factor indicates the difference
between the OECD Europe and EU28
population. It is used to translate the
Energy Revolutions OECD Europe outcomes
to EU28.
Share of collective energy citizen
households that have also invested in their
own PV
20% We expect that most collective solar PV
and wind is owned by households that
didn't have the possibility to install solar
PV on their own roof.


