Embed Size (px)
Citation preview

+ The Potential for CO2
Reduction of Energetically
Used Landscape
Conservation Materials
and Green Waste in the
County Marburg-
Biedenkopf, Germany
A Thesis submitted to
the Faculty of Engineering Cairo University and Kassel
University
in Partial Fulfillment of the Requirements for the Degree of
Master of Science
in
RENEWABLE ENERGY AND ENERGY EFFICIENCY
Prepared by
Renée Bradford Britton
Kassel University,
Kassel, Germany
Faculty of
Engineering, Cairo
University, Giza,
Egypt
+ Order of Presentation
I. Introduction
II. Energetic use of biomass in Germany
III. Determination of green waste utilization
IV. Determination of the potentials of green waste
V. Development considerations
VI. Transferability of the concept to the Jamaican context.
VII. Conclusion
VIII. References
2
Bradford-Britton March 2013

+ I. Introduction Definitions
Energetically used green waste: Extraction and conversion of the contained
energy to useful forms such as heat and power.
Green waste and landscape conservation material (GWLCM): Leaf material, old bedding, wood and non-
woody prunings grass clippings, garden, park, hedge and verge waste, of a kind that is not particularly cultivated for the express use in energy conversion.
Not considered is: kitchen and food waste, tree stumps, tree roots, agricultural crop residue, forestry residue
3
Bradford-Britton March 2013

+ III. Significant sources of green waste and
landscape conservation material
Bradford-Britton March 2013
4

+ I. Introduction
I.3 Problem Statement
The full potential of bio-waste material including
GWLCM is mostly underutilized.
5
Bradford-Britton March 2013

+ I. Introduction I.4 Relevance
Traditional methods of waste disposal are
unsustainable
Dwindling fuel quantities threaten energy security
in countries around the world
Risk of air, soil and ground water contamination,
increased health risks to plant, animal and human
health, ecosystem destruction, etc.
Early initiatives provide smooth transition from
traditional energy sources to alternate sources
with little to no disruption to economies.
Increased energy security
6
Bradford-Britton March 2013

+ I. Introduction I.5 Methodology
Literature review
Legislation
Technology
Biomass trends
Power utilities
Waste management authorities
Field visits
Quantitative assessments of gathered data
7
Bradford-Britton March 2013

+ I. Introduction
I.6 Constraints
Language barrier in obtaining information directly
related to Landkreis Marburg Biedenkopf (LMB)
German- English translations needed
Access to information regarding the Jamaican
case study.
8
Bradford-Britton March 2013
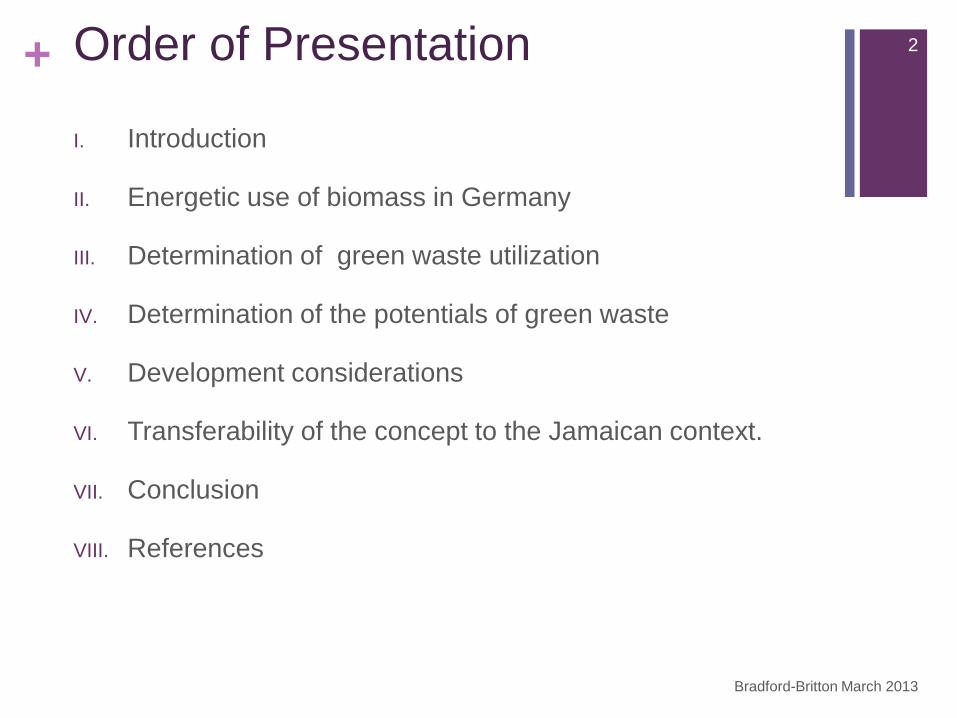
+ II. Energetic use of biomass in
Germany II.1 Contribution of Biomass in Germany?
Approximately 71.7% of total renewables
contribution
Approximately 7.7% of overall final
consumption
Heat and power production from biomas includes
sewage and landfill gas and the biogenic fraction
of waste.
9
Bradford-Britton March 2013

+
Coal, oil, natural gas, nuclear
89,1%
0,0%
Biomass 7,7%
Wind 1,5%
Other 0,9%
Hydro 0,8%
Renewable energy sources
11%
Final Energy Consumption Germany 2010
Source: Bioenergy in Germany: Facts and
Figures 2012
10
Bradford-Britton March 2013

+
Biofuels 13%
Biomass electricity)
13%
Biomass (heat) 45% Hydropower
7%
Wind power 14%
Solar thermal
2%
Geothermal 2%
Photovoltaics 4%
Supply from Renewables- Germany 2010
Source: Bioenergy in Germany: Facts and
Figures 2012
11
Bradford-Britton March 2013

+ II. Energetic use of biomass in
Germany II.2 Major conversion technologies for biomass
currently used
12
Bradford-Britton March 2013

+
Anaerobic Digestors
Source http://www.renewable-energy.uk.net/biogas/definition_digestor.htm
II.3 Main technology used for treating green waste
Bradford-Britton March 2013
13
Mass Burn Incinerators Refuse Derived Fuel Incinerators
Fluidized Bed Incinerator

+ III. Determination of green waste
utilization III.1 Benefits
Energetic benefits :
Power
Heat
Material benefits :
Compost
Recycling plant nutrients
Products for improving soil functions
Carbon sequestration
14
Bradford-Britton March 2013

+ III. Determination of green waste
utilization
III.2 Incentives
Subsidies
Tax waivers and reductions
Right of access
Tariffs and bonuses
Bradford-Britton March 2013
15
Tariff structure for electricity from biomass. Substrates:
Biogas (excl. bio-waste fermentation and small manure
installations) and solid fuel installations
Bio-waste
Fermentation
Installations 5) (Section
27a)
Small
Manure
Installations (Section 27
b)
Rated Average Annual Capacity
Basic Tariff
Substance Tariff Class
I 2)
Substance
Tariff Class
II 3)
Gas Processing
Bonus
(Section
27c(2))
[kWel] [ct/kWh]
≤ 75 4) 14.3 6 8 ≤ 700
standard
cubic meter
(scm)/h: 3
16 256)
≤ 150 ≤ 1,000 scm/h: 2 ≤
1,400 scm/h:
1
≤ 500 12.3
≤ 750 11 5 8 / 6 4)
14
≤ 5,000 11 4
≤ 20,000 6 - -
Source: Tariffs, degression and sample calculations pursuant to the new Renewable Energy Sources Act
(Erneuerbare-Energien- Gesetz - EEG) of 4 August 2011 ('EEG 2012')

+ III. Determination of green waste
utilization
III.3 Challenges to utilization:
Low energy content
Inconsistent supply based on growing season
Conversion technology not optimized for
substrates
Logistics
Bradford-Britton March 2013
17

+ IV. Determination of the potentials
of green waste
18
Bradford-Britton March 2013
IV.1 Carbon Dioxide Emissions Saving Development (CdESD) Tool
Based on Handbook of Electric Power Calculations & Dr. A. Kaupp “5 Steps to tons of CO2 mitigated”
Phyllis database Research Center of the Netherlands (ENC )
Creates various scenarios of biomass substrates and fossil fuels
Supports decision making
User friendly
Flexible

+ IV.2 Sample of formulas used in model
Bradford-Britton March 2013
19
Cost of fuel $/MJ= ($cost/tonne)/[(1000
kg/tonne)(heating value MJ/kg)]
Total heat input to boiler= (fuel kg/h)(fuel heating
value MJ/kg)= MJ/h
Net generating-unit power output (kW)= output from
generator kW - electric loads of plant auxiliaries kW
Net Heat Rate of the Generating Unit (MJ/kWh)=
(Total heat input to boiler MJ/h)/(Net power output of
generating unit kW)=

+ IV.3 Sample of carbon emissions formulas
Maximum Carbon Emission (kg)= Fuel carbon content (%)* 3.6667
Total Residue (kg)= Ash content /[1- remaining carbon fraction (%)]
Remaining Carbon (kg)= Remaining Carbon fraction* Total residue
Actual Carbon emissions (kg)=Max. Carbon emissions – Remaining Carbon
The factor 3.6667 is derived from the stochiometric equation that 1 kgmol of Carbon weighs 12 kg and generates 1 kgmol of CO2 weighing 44 kg (1 atom Carbon- 12 g/mol 2 atoms Oxygen- 32g/mol)
Bradford-Britton March 2013
20
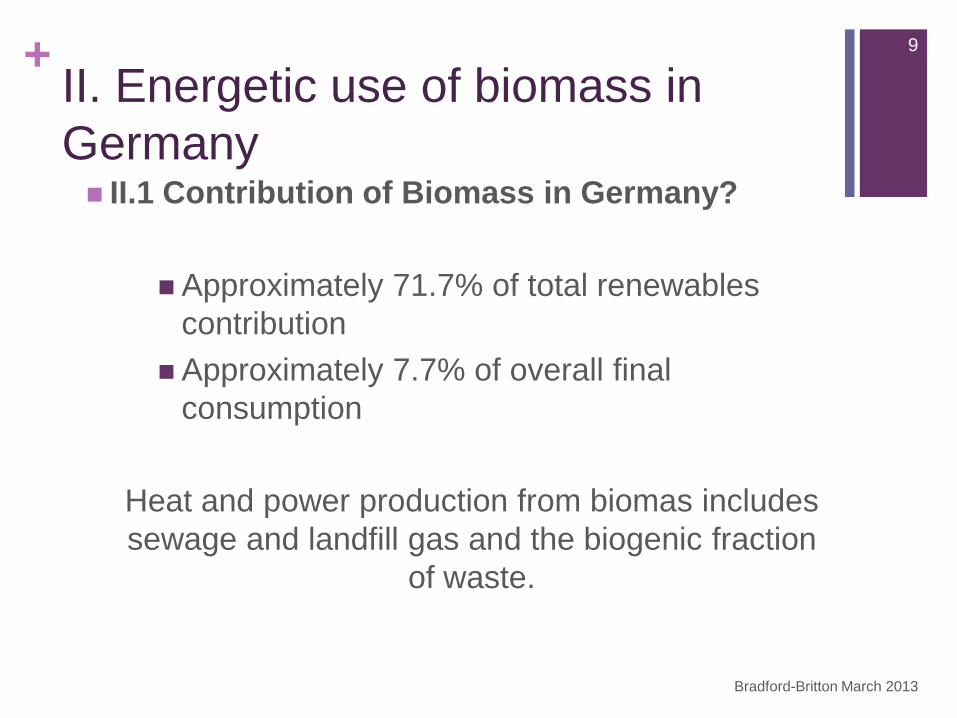
+ IV.4 Cycles assumed in model
Bradford-Britton March 2013
21
Rankine Cycle Organic Rankine Cycle
Source: http://www.orcycle.be/index.php/en/orctheorie

+
Bradford-Britton March 2013
22

+ V. Determination of the potentials of
green waste
V.2 Scenario LMB Coal vs Grass/Plant
Composite
Based on 2MW power plants
Bradford-Britton March 2013
23
5100
5200
5300
5400
5500
5600
5700
Low Average High
Coal 5573,025 5687,077 5499,821
Composit G/P 5358,553 5690,593 5698,715
To
nn
e C
O2
Scenario LMB CO2 Emissions Comparison

+
Bradford-Britton March 2013
24
Low; 25,05
Average; 31,733
High; 37,044
Low; 16,357
Average; 19,509
High; 21,962
0 0,5 1 1,5 2 2,5 3 3,5
Scenario LMB: Heating Value Comparison (MJ/kg)
Coal Composit G/P

+
Bradford-Britton March 2013
25
0
2000
4000
6000
8000
10000
12000
Energy Content per tonne Fuel
Actual Energy Yeild
10290
3438,146
6100,556
1132,416 kW
h/t
on
ne f
uel
Scenario Comparison- Energy Potential
Base Case Green Waste

+ Top Level Results Scenario: Coal, High vs Plant/Grass Composite, High
1 tonne fossil fuel=
3438.146 kWh= 3.138 tonnes CO2 emitted
1 tonne green fuel=
1132.416 kWh= 3.969 tonnes CO2 emitted
Bradford-Britton March 2013
26

+
Bradford-Britton March 2013
27
0
200
400
600
800
1000
1200
1400
x 1
00000
kW
h
Potential Energy Recovery from Waste Digestion
Actual Yield (kWhth) Total Potential Energy Yield (kWh)

+
Bradford-Britton March 2013
28

+ V. Development considerations
Bradford-Britton March 2013
29
Logistics
Collection
Sorting & distribution
Supply availability
Incentives
Energy content
Magnitude of scale
Future price of material
Available technology

+ VI. Transferability of the concept to the
Jamaican context.
Good potential
Early stages in renewable energy and waste
management sectors
Plans for upgrading facilities
Guiding documents being drafted
Incentives
Political will
Not ready for this type of energy use
30
Bradford-Britton March 2013

+ VII. Conclusion
Good potential for CO2 emissions reduction
Best used in summer and growing seasons
Best used by waste management sector
Early investors may benefit
Loses economic edge with increased green fuel price
Bradford-Britton March 2013
31

+
Thank you for your
attention
For further information contact:
Renée Bradford-Britton
Email:
Bradford-Britton March 2013
32

+ VIII. References
Bioenergy in Germany: Facts and Figures January 2012 Federal Ministry of Food, Agriculture and Consumer Protection publisher Fachagentur Nachwachsende Rohstoffe e.V. (FNR) OT Gulzow · Hofplatz 1 · 18276 Gulzow-Pruzen · Germany
HANDBOOK OF ELECTRIC POWER CALCULATIONS H. Wayne Beaty McGraw-Hi l l Copyright © 2001, ISBN 0-07-136298-3
International Environmental Technology Center, Solid Waste Management, December 2005, Chapter 13.
Waste to Energy Technology Research Report July 2007 MORA Associates Leonard Wagner
Methane Digesters for Fuel Gas and Fertilizer with Complete Instructions For Two Working Models by L. John Fry
Rankine Cycle images http://www.orcycle.be/index.php/en/orctheorie
Discussion image https://ctools.umich.edu/access/content/user/angelaas/Public%20Portfolio%20Files/clipart_of_15186_sm_2.jpg
Solution image http://www.brainleadersandlearners.com/wp-content/uploads/2011/03/solution.jpg
Two way arrow image http://www.clker.com/clipart-91026.html
Bradford-Britton March 2013
33