Embed Size (px)
Citation preview

The potential for centralized photovoltaic systems in Sweden
REBECCA KARLSSON
EVA NILSENG
Master of Science Thesis Stockholm, Sweden 2016

Solceller för centraliserad elproduktion i Sverige
REBECCA KARLSSON EVA NILSENG
Examensarbete Stockholm, Sverige 2016

The potential for centralized photovoltaic systems in Sweden
Rebecca Karlsson Eva Nilseng
Master of Science Thesis INDEK 2016:47 KTH Industrial Engineering and Management
Industrial Management SE-100 44 STOCKHOLM

Solceller för centraliserad elproduktion i Sverige
Rebecca Karlsson Eva Nilseng
Examensarbete INDEK 2016:47 KTH Industriell teknik och management
Industriell ekonomi och organisation SE-100 44 STOCKHOLM

Master of Science Thesis INDEK 2016:47
The potential for centralized photovoltaic systems in Sweden
Rebecca Karlsson
Eva Nilseng
Approved
2016-06-16
Examiner
Pär Blomkvist Supervisor
Saara Hollmén Commissioner
Vattenfall Vind AB Contact person
Elisabet Wahlstedt
Abstract Considering the long term target set by the Swedish government of having an energy system based exclusively on renewable sources, the potential for different renewable sources need to be investigated. When analyzing the sources used for electricity production in Sweden today, solar PV represents a very small share. This relatively small share also mainly consists of grid-connected distributed PV systems, and to analyze the possibilities of making solar energy a larger share in the electricity production in Sweden this study will focus on grid-connected centralized PV farms. The main purpose of the study is to identify the potential for grid-connected centralized PV systems for large scale production in Sweden. This will include an identification of the most important key factors influencing the profitability, an investment calculation to be aware of the profitability, a prediction of the future development of the PV industry in Sweden and lastly the main challenges that the PV industry is facing. To conduct this study a collaboration with Vattenfall Vind AB has been made, where a case study based on three specific locations has been implemented when analyzing both the profitability and the key factors. These three cases are based on places where Vattenfall has existing wind farms or has assigned for upcoming ones. These areas could be seen as a potential benefit since the company already has started to inspect the land area, and that wind and PV farms might be able to share necessities such as infrastructure. The results of the study mainly indicate that the PV industry most likely will continue develop and grow, but the profitability of investing in grid-connected centralized PV farms does not look promising today or in the next coming years. This mainly due to low prices for electricity and uncertainties in the future development of the financial support policy. The location is also very important for this type of installation. There are places in southern Sweden with enough insolation, but these areas can be seen as limited. To make solar energy a larger share of the electricity production in Sweden in a profitable way today, more investments should be made in grid-connected distributed PV systems rather than grid-connected centralized PV farms. PV farms for large scale production might though be more profitable in the future when the prices for modules and inverters will decrease further and when the spot price increases. Key-words: Grid-connected centralized PV systems, profitability PV farms, PV industry, large scale production, PV in Sweden, key factors, main challenges.

Examensarbete INDEK 2016:47
Solceller för centraliserad elproduktion i Sverige
Rebecca Karlsson
Eva Nilseng
Godkänt
2016-06-16
Examinator
Pär Blomkvist Handledare
Saara Hollmén Uppdragsgivare
Vattenfall Vind AB Kontaktperson
Elisabet Wahlstedt
Sammanfattning Med hänsyn till det långsiktiga mål som satts upp av den svenska regeringen gällande att ha ett energisystem som uteslutande består av förnybara energikällor, behövs en undersökning genomföras gällande potentialen för olika typer av förnybara källor i Sverige. Genom att utvärdera vilka energikällor elproduktion består av i Sverige idag, blir det tydligt att solceller står för en mycket liten andel. Dagens solcellssystem består i sin tur av en dominerande andel nätanslutna distribuerade system, och för att analysera möjligheterna till att utöka andelen solenergi i elproduktionssystemet kommer denna analys att fokusera på nätanslutna centraliserade solcellsparker. Det huvudsakliga syftet med studien är att identifiera potentialen för nätanslutna centraliserade solcellssystem för storskalig elproduktion i Sverige. Detta inkluderar en identifiering av de nyckelfaktorer som påverkar lönsamheten, investeringsberäkningar som ska undersöka lönsamheten av investeringen och även en analys över hur den framtida utvecklingen av solcellsindustrin i Sverige kommer utvecklas och vilka utmaningar som industrin står inför. För att genomföra studien har ett samarbete gjorts med Vattenfall Vind AB, där en casestudie inkluderats baserad på tre specifika platser som framförallt använts vid lönsamhetsberäkningarna och vid identifieringen av nyckelfaktorer. Caseplatserna är belägna vid befintliga vindkraftsparker eller där parker planeras byggas. Områdena kan ses som fördelaktiga då Vattenfall redan påbörjat eller genomfört inspektioner av de aktuella platserna, samt att vind- och solcellsparker eventuellt kan dela på vissa nödvändigheter så som infrastruktur. Resultaten från studien indikerar framförallt att solcellsindustrin troligen kommer fortsätta utvecklas och växa, men lönsamheten i att investera i nätanslutna centraliserade solcellsparker ser inte lovande ut idag eller inom de närmsta åren. Detta beror framför allt på de låga elpriserna och osäkerheterna i den framtida utvecklingen av det ekonomiska stödsystemet. En annan mycket viktig del för denna typ av installation är placeringen. Det finns platser i södra Sverige som har tillräckligt bra solinstrålning, men områden kan ses som begränsade. För att solenergin på ett lönsamt sätt ska anta en större andel inom elproduktionen i Sverige så bör mer investeringar i dagsläget göras i nätanslutna distribuerade system istället för centraliserade solcellsparker. Solcellsparker avsedda för storskalig elproduktion kan däremot bli mer lönsamma i framtiden då modulpriserna sjunker och elpriser höjs. Nyckelord: Nätanslutna centraliserade solcellssystem, lönsamhet solcellsparker, solcellsindustrin, storskalig elproduktion, solceller i Sverige, nyckelfaktorer, viktigaste utmaningarna.

Foreword and acknowledgements This report presents a master thesis project written for the department of Industrial Engineering and Management at KTH, The Royal Institute of Technology in Stockholm, Sweden. The project has been conducted during the spring 2016. The master thesis project has included meetings with a lot of inspiring and important persons for the study, who have contributed with both knowledge and support valuable for our project. First we would like to thank our three supervisors at Vattenfall, Elisabet Wahlstedt, Staffan Snis and Tobias Lundberg, for all the great support during our project and for giving us the opportunity to conduct our master thesis at Vattenfall. We would also like to thank all the employees at Vattenfall who have contributed to knowledge and shown interest in our study through interviews and meetings. Secondly, we would like to thank our supervisor at KTH, Saara Hollmén, who has contributed to expertise for the thesis report and helped us with guidance during the entire project. All meetings conducted during the spring has been a great support for us. Lastly, we want to express our appreciation for all valuable knowledge and inputs we have got from external persons outside Vattenfall and KTH. Your participation in interviews have contributed to a lot of expertise regarding the topic of the master thesis. Many thanks to all of you for participating and supporting our study!
Rebecca Karlsson and Eva Nilseng
Stockholm, June 2016

List of abbreviations AC – Alternating Current BoS – Balance of System CAPEX – Capital Expenditure DC – Direct Current FiT – Feed-in Tariff FCF – Free Cash Flow IRR – Internal Rate of Return kV – kilo Voltage kW – kilo Watt kWh – kilo Watt hour LCA – Life Cycle Assessment LCOE – Levelized Cost of Energy LTS – Large Technical Systems MW – Mega Watt MWh – Mega Watt hour NPV – Net Present Value NWC – Net Working Capital OAT – One-at-a-time OPEX – Operational Expenditure PPA – Power Purchase Agreement PR – Performance Ratio PV – Photovoltaics and Present Value RES – Renewable Energy Sources VAT – Value-Added Tax WACC – Weigthed Average Cost of Capital Wp – Watt peak

Table of content 1.INTRODUCTION..................................................................................................................1
1.1BACKGROUND....................................................................................................................................11.2PROBLEMFORMULATION..................................................................................................................31.3PURPOSE............................................................................................................................................31.4RESEARCHQUESTIONS.......................................................................................................................31.5DELIMITATIONS..................................................................................................................................41.6CONTRIBUTION..................................................................................................................................41.7DISPOSITION......................................................................................................................................4
2.METHOD.............................................................................................................................72.1METHODOLOGICALAPPROACH.........................................................................................................72.2RESEARCHDESIGN.............................................................................................................................7
2.2.1Pre-study....................................................................................................................................82.2.2Collectionofliterature,theoreticalconceptsandpublications.................................................82.2.3Interviews...................................................................................................................................92.2.4Fieldtrips..................................................................................................................................102.2.5Casestudyandcalculations......................................................................................................102.2.6Dataanalysis.............................................................................................................................11
2.3QUALITYOFRESEARCH....................................................................................................................112.3.1Validity......................................................................................................................................122.3.2Reliability..................................................................................................................................122.3.3Generalizability.........................................................................................................................13
3.LITERATUREREVIEWANDTHEORETICALCONCEPTS.........................................................153.1POTENTIALFORCENTRALIZEDPVSYSTEMSINEUROPE..................................................................153.2DESCRIPTIONOFPV,FROMCELLLEVELTOFARMLEVEL................................................................16
3.2.1TypesofPVtechnologies..........................................................................................................173.2.2PVsystems................................................................................................................................183.2.3Layoutandspacing...................................................................................................................18
3.3THEORETICALCONCEPTS.................................................................................................................193.3.1Capitalbudgeting......................................................................................................................203.3.2Levelizedcostofelectricity(LCOE)...........................................................................................223.3.3Sensitivityanalysisasacapitalbudgetingtool.........................................................................233.3.4Investmentdecisions................................................................................................................233.3.5Economiesofscale...................................................................................................................243.3.6Largetechnicalsystem.............................................................................................................25
4.THEPVINDUSTRYINTHESWEDISHCONTEXT...................................................................274.1LOCATIONFORPVFARMSINSWEDEN............................................................................................27
4.1.1Insolation..................................................................................................................................274.1.2Powerpriceareas.....................................................................................................................284.1.3Landconditions.........................................................................................................................29
4.2FINANCIALSUPPORTPOLICY............................................................................................................304.2.1DirectcapitalsubsidyforPV.....................................................................................................304.2.2Theelectricitycertificatesystem..............................................................................................314.2.3Guaranteesoforigin.................................................................................................................334.2.4Powerpurchaseagreement.....................................................................................................34
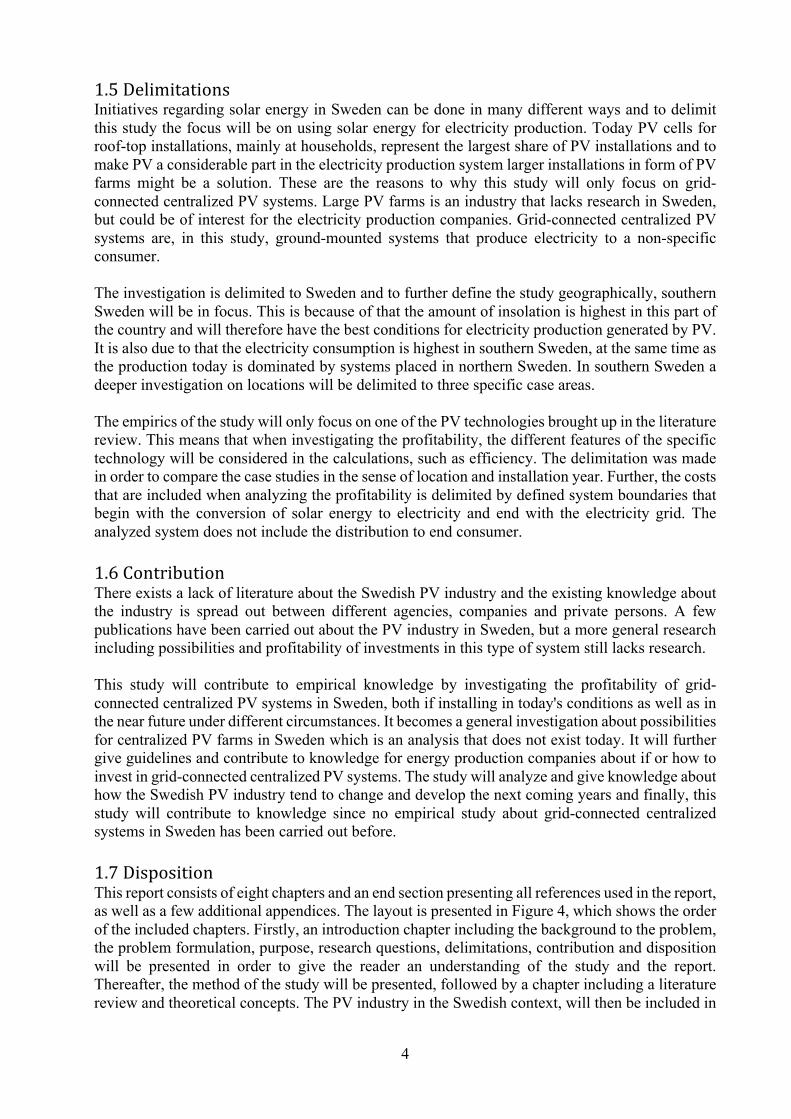
4.3THEELECTRICITYMARKET................................................................................................................344.3.1Themeritordereffect..............................................................................................................36
4.4GRIDASPECTSANDTHEENERGYSYSTEMATLARGE.......................................................................374.5DEVELOPMENTOFTHEPVINDUSTRY..............................................................................................38
4.5.1Existinggrid-connectedcentralizedPVsystems.......................................................................39

4.5.2Thefutureforgrid-connectedcentralizedPVsystems............................................................42
5.DESCRIPTIONOFTHEINVESTMENTMODELFORTHREESWEDISHLOCATIONS..................455.1THEINVESTMENTMODEL................................................................................................................45
5.1.1Insolation..................................................................................................................................465.1.2Productionassessment.............................................................................................................485.1.3Revenues..................................................................................................................................515.1.4Expenditures.............................................................................................................................525.1.5WACC&inflationrate...............................................................................................................56
5.2SENSITIVITYANALYSIS......................................................................................................................56
6.RESULTSANDANALYSIS....................................................................................................596.1RQ1:HOWHASTHEPVINDUSTRYBEENDEVELOPEDDURINGTHEPASTDECADESANDWHEREISITHEADING?..........................................................................................................................................596.2RQ2:HOWPROFITABLEISITTOINVESTINGRID-CONNECTEDCENTRALIZEDPVFARMSINSWEDEN?...............................................................................................................................................60
6.2.1ProfitabilityofCase1................................................................................................................606.2.2ProfitabilityofCase2................................................................................................................616.2.3ProfitabilityofCase3................................................................................................................636.2.4ProfitabilityinsouthernSweden..............................................................................................64
6.3RQ3:WHICHARETHEKEYFACTORSINFLUENCINGTHEPROFITABILITY?.......................................656.4RQ4:WHATWILLBETHEMAINCHALLENGESINTHENEARFUTURECONSIDERINGTHEDEVELOPMENTOFTHEPVINDUSTRY?..................................................................................................67
7.DISCUSSION......................................................................................................................717.1DISCUSSIONWITHREGARDSTOTHESUBRESEARCHQUESTIONS..................................................717.2ADDITIONALAREASOFDISCUSSION................................................................................................73
8.CONCLUSIONSANDSUGGESTIONSFORFURTHERRESEARCH............................................758.1CONCLUSIONS..................................................................................................................................758.2SUGGESTIONSFORFURTHERRESEARCH.........................................................................................76
APPENDIX1..........................................................................................................................86
APPENDIX2..........................................................................................................................94

List of figures FIGURE1–ELECTRICITYPRODUCTIONINSWEDENIN2015. 1FIGURE2–PEAKOPERATINGTIMESFORWINDANDSOLARTHROUGHOUTAYEAR. 2FIGURE3–THECUMULATIVEINSTALLEDPVPOWERIN2014. 2FIGURE4–THEDISPOSITIONOFTHESTUDY. 5FIGURE8–PVCELLS,MODULESANDARRAYS.. 16FIGURE7–ILLUSTRATINGTHEINTER-ROWSPACINGBETWEENTHEMODULES,WHERETHEPARAMETERSARE
DEFINEDASΒ=MODULETILTINGANGLE,R=INTER-ROWSPACING,L=MODULELENGTHANDΑ=LOWESTHEIGHTOFTHESUNTOAVOIDSHADING,ALSOMENTIONEDASSOLARALTITUDEANGLE. 18
FIGURE15–SKETCHOFTHESYSTEMBOUNDARIES. 24FIGURE5–GLOBALRADIATIONMAPOVERSWEDEN. 28FIGURE6–THEFOURPOWERPRICEAREASINSWEDEN. 29FIGURE9–THEAMOUNTOFISSUEDELECTRICITYCERTIFICATESFORSOLARPOWERDURINGTHEYEARS2003-
2015. 32FIGURE10–THEQUOTALEVELSFROM2003TO2035. 33FIGURE11–ELECTRICITYCERTIFICATEPRICES(SEK)WITHAMONTHBASIS. 33FIGURE12–THEDEVELOPMENTOFTHEELECTRICITYSPOTPRICEOVERTIME. 35FIGURE13–CHANGESOFTHECONSTITUENTELEMENTSTHATCREATESTHEELECTRICITYPRICEFORTHEEND
CONSUMER. 36FIGURE14–HOWSUPPLYANDDEMANDDECIDETHEELECTRICITYPRICEFORTHENORDICELECTRICITYMARKET.
37FIGURE16–THEINSTALLEDPVCAPACITYINSWEDENDURING2002TO2014. 39FIGURE17–THEDIVISIONOFINSTALLEDCAPACITYOFPVIN1992,2007AND2014. 39FIGURE18–SOLARFARMINARVIKACALLEDMEGA-SOL. 40FIGURE19–THEMEGAWATTPARKLOCATEDOUTSIDEVÄSTERÅS. 41FIGURE20–THEGLOBALIRRADIANCEONAHORIZONTALSURFACEFORCASE1. 47FIGURE21–THEGLOBALIRRADIANCEONAHORIZONTALSURFACEFORCASE2. 47FIGURE22–THEGLOBALIRRADIANCEONAHORIZONTALSURFACEFORCASE3. 48FIGURE23–THEDEVELOPMENTOFTHEPERFORMANCERATIOSINCE1992UNTIL2010. 50FIGURE24–THERESULTSFORCASE1INCLUDINGTHETHREEDIFFERENTSCENARIOSFORTHEELECTRICITYSPOT
PRICE. 60FIGURE25–THERESULTSFORCASE2INCLUDINGTHETHREEDIFFERENTSCENARIOSOFTHEELECTRICITYSPOT
PRICE. 62FIGURE26–THERESULTSFORCASE3INCLUDINGTHETHREEDIFFERENTSCENARIOSOFTHEELECTRICITYSPOT
PRICE. 63FIGURE27–THESENSITIVITYANALYSISFORCASE1. 66FIGURE28–THESENSITIVITYANALYSISFORCASE2. 66FIGURE29–THESENSITIVITYANALYSISFORCASE3. 67FIGURE30–ILLUSTRATINGTHEREVERSESALIENTSANDSALIENTSINTHEPVINDUSTRY. 69

List of tables TABLE1–NUMBEROFHOURSWITHOUTSHADOWFORDIFFERENTSOLARALTITUDEANGLES(PANELSFACING
SOUTH). 19TABLE2–OVERVIEWOFDIRECTCAPITALSUBSIDYFROM2009. 31TABLE3–DESCRIPTIONOFTHEINVESTMENTMODELINCLUDINGFOURDIFFERENTMETHODS. 46TABLE4–THEMODULEPROPERTIESUSEDWHENCALCULATING. 49TABLE5–COSTOFCAPEX. 52TABLE6–THECOSTBUILD-UPOFBOS. 54TABLE7–THECAPEXUSEDINTHEINVESTMENTMODEL. 54TABLE8–LANDLEASECOSTDEPENDINGONSOILTYPES. 56TABLE9–THEVALUEFORNPV,IRR,THEPAYBACKPERIOD,LCOEADJUSTEDANDLCOENEUTRALINCASE1. 61TABLE10–THEVALUESFORNPV,IRR,THEPAYBACKPERIOD,LCOEADJUSTEDANDLCOENEUTRALINCASE2. 62TABLE11–THEVALUEFORNPV,IRR,THEPAYBACKPERIOD,LCOEADJUSTEDANDLCOENEUTRALINCASE3. 64TABLE12–RESULTSOFPROFITABILITYINTHETHREECASESWITHDIFFERENTSCENARIOS. 65

1
1. Introduction This introduction chapter will present the background of the studied phenomenon. It will also include the problem formulation, the purpose of the study and the research questions. Lastly, the delimitations and the expected contribution will be highlighted, followed by a description of the disposition of the report. 1.1BackgroundOne of the greatest global challenges today is the climate change. To create a sustainable future, renewable energy sources (RES) have a crucial role to play. Today there exists an ongoing discussion in all countries about how to face this challenge by utilizing more RES. (Söder, 2013) For instance, the joint plan to reduce the world’s carbon emissions that was recently created during the world climate conference COP21 in Paris 2015. The plan included, inter alia, a target to limit the temperature rise below 1.5°C. (Regeringen, 2015a) Sweden is already one of the leading countries in Europe when it comes to RES, but there is still progress to make (Jönsson, 2015). This along with the governmental long term target of having an energy system based exclusively on RES and with EU-commission’s hopes on Sweden to become a role model for the rest of the European countries regarding the shift to RES. (Regeringen, 2015b; Jönsson, 2015) The main challenge is to make the renewable energy system reliable in the sense that it could produce energy when needed. This since a renewable system will have an increased amount of fluctuating sources, such as wind and solar power. (Söder, 2013) When looking at the Swedish electricity production in year 2015 the main energy source is hydropower, which almost adds up to half of the total production, as shown in Figure 1. The share of hydropower is followed by 34% nuclear, 10% wind, 9% CHP and only 0.07% solar power. (Svensk Energi, 2016d; Stridh, 2016a)
Figure 1 – Electricity production in Sweden in 2015. (Data from Svensk Energi, 2016d and Stridh, 2016a)
To be able to achieve the target of creating a system based solely on RES the share of sources shown in previous graph will change in the future. There are already actions taken that indicate that this will be the case in the near future. For instance, that nuclear reactors were shut down earlier than planned. (TT, 2015) When more nuclear reactors will be shut down it is evident that the share of RES, or other energy sources, in the electricity production need to increase (if not import of energy is considered). It is a challenge of how to balance the system and which energy sources to extend. When looking at the RES, it can be seen that the opportunities to increase the share of hydropower in the electricity production are small, it is not possible to rely on an even
47%
10%
34%
9%
Electricityproduction2015Sweden
Hydropower Wind Nuclear CHP Solar
0.07%

2
larger share from this source in the electricity production (Vattenfall, 2015). The second largest RES in the electricity production division is wind power, which has great potential in Sweden and is growing fast, but it is highly dependent on the weather and can have strong fluctuations in its production. Consequently, wind power has to be complemented with another energy source to regulate the production flow. (Jönsson, 2015) Solar power is a RES which is still quite unused for electricity production in Sweden compared to other countries. However, southern Sweden has roughly the same insolation as in central Europe, which indicates potential for solar installations in Sweden. (Ericsson & Simm, 2009) This potential could also be observed in terms of a growing industry for solar power aimed for electricity production and between 2010 to 2015 the installed capacity has increased rapidly. (Lindahl, 2014; IEA PVPS, 2016) Solar power is though, like wind power, highly dependent on the weather, but solar and wind have their peak operating times at different intervals of the day and year as shown in Figure 2. In the summer when the sun shines brightest, the wind speeds are low and in the winter, when less sunshine is available, the wind is strong. (Energy.gov, u.d.)
Figure 2 – Peak operating times for wind and solar throughout a year. (Adapted from Hanam, et al., 2007)
Installed photovoltaic (PV) capacity can be either grid-connected or off-grid systems, and the grid-connected systems are centralized or distributed systems. The latest published figures on the division of PV systems in Sweden was published in 2014 and in this year the total installed cumulative solar capacity was 79.4 MW. Out of this, 66.14 MW was grid-connected distributed, and only 3.79 MW was grid-connected centralized systems, as shown in Figure 3. The figure shows that PV systems are promising in Sweden, but it mainly consists of single-home roof-top installations, and only to a small extent of centralized systems. (Lindahl, 2014)
Figure 3 – The cumulative installed PV power in 2014. (Data from Lindahl, 2014)
3,79
66,14
8,58 0,890
10203040506070
Grid-connectedcentralized
Grid-connecteddistributed
Off-griddomestic
Off-gridnon-domestic
CumulativeinstalledPVpowerinMW2014

3
To utilize solar energy to a larger extent and to make it a considerable part of the electricity production in Sweden, one way could be for electricity production companies to invest in grid-connected centralized PV systems. Vattenfall is one of these electricity production companies and has the target to increase their RES for electricity production. Since grid-connected centralized PV systems still are unusual in Sweden it could be an opportunity for Vattenfall to invest in this system. 1.2ProblemformulationThe main problem is that Sweden needs to create a new energy system for electricity production in order to achieve the governmental long-term target of having a system that is entirely based on RES. Solar energy as a source for electricity production needs to be investigated to be aware of its potential and how it could take part of achieving the governmental target. Further, what types of PV systems, i.e. grid-connected centralized, grid-connected distributed and so on, needs to be investigated in order to know the potential in each system. If the potential for grid-connected PV systems is investigated in particular, knowledge would be gained to what extent this system could take part in the electricity generation and thereby contribute to achieving the long-term governmental target. By understanding what key factors that affects the profitability of grid-connected centralized PV systems, it is possible to identify how solar PV farms could be installed by energy production companies in Sweden and if it is economically feasible. Since grid-connected centralized PV systems for large scale production would be relatively new in Sweden, research needs to be done about what technology to use, where to make the installations and if an installation would be profitable. In addition, if considering how the key factors could evolve in the future a long term investment focus is included. 1.3PurposeThe main purpose of this study is to identify the potential for grid-connected centralized PV systems for large scale production in Sweden. By analysing the profitability of installing centralized PV farms at three specific locations with different insolation, land conditions and installation year, the potential can be identified. Key factors influencing the profitability will be included to become aware of the sensitivity of the analysis. To be able to include long term aspects of the investment, the development of the PV industry in Sweden will be analysed, as well as the development of the key factors and their future impact. 1.4ResearchquestionsIn order to achieve the purpose, the following general research question has been formulated. What are the possibilities to utilize solar energy for electricity production generated by grid-connected centralized photovoltaic farms in Sweden? The main research question has been divided into the following four sub research questions:
• How has the photovoltaic industry been developed during the past decades and where is it heading? • How profitable is it to invest in grid-connected centralized photovoltaic farms in Sweden? • Which are the key factors influencing the profitability? • What will be the main challenges in the near future considering the development of the photovoltaic
industry?
4
1.5DelimitationsInitiatives regarding solar energy in Sweden can be done in many different ways and to delimit this study the focus will be on using solar energy for electricity production. Today PV cells for roof-top installations, mainly at households, represent the largest share of PV installations and to make PV a considerable part in the electricity production system larger installations in form of PV farms might be a solution. These are the reasons to why this study will only focus on grid-connected centralized PV systems. Large PV farms is an industry that lacks research in Sweden, but could be of interest for the electricity production companies. Grid-connected centralized PV systems are, in this study, ground-mounted systems that produce electricity to a non-specific consumer. The investigation is delimited to Sweden and to further define the study geographically, southern Sweden will be in focus. This is because of that the amount of insolation is highest in this part of the country and will therefore have the best conditions for electricity production generated by PV. It is also due to that the electricity consumption is highest in southern Sweden, at the same time as the production today is dominated by systems placed in northern Sweden. In southern Sweden a deeper investigation on locations will be delimited to three specific case areas. The empirics of the study will only focus on one of the PV technologies brought up in the literature review. This means that when investigating the profitability, the different features of the specific technology will be considered in the calculations, such as efficiency. The delimitation was made in order to compare the case studies in the sense of location and installation year. Further, the costs that are included when analyzing the profitability is delimited by defined system boundaries that begin with the conversion of solar energy to electricity and end with the electricity grid. The analyzed system does not include the distribution to end consumer. 1.6ContributionThere exists a lack of literature about the Swedish PV industry and the existing knowledge about the industry is spread out between different agencies, companies and private persons. A few publications have been carried out about the PV industry in Sweden, but a more general research including possibilities and profitability of investments in this type of system still lacks research. This study will contribute to empirical knowledge by investigating the profitability of grid-connected centralized PV systems in Sweden, both if installing in today's conditions as well as in the near future under different circumstances. It becomes a general investigation about possibilities for centralized PV farms in Sweden which is an analysis that does not exist today. It will further give guidelines and contribute to knowledge for energy production companies about if or how to invest in grid-connected centralized PV systems. The study will analyze and give knowledge about how the Swedish PV industry tend to change and develop the next coming years and finally, this study will contribute to knowledge since no empirical study about grid-connected centralized systems in Sweden has been carried out before. 1.7DispositionThis report consists of eight chapters and an end section presenting all references used in the report, as well as a few additional appendices. The layout is presented in Figure 4, which shows the order of the included chapters. Firstly, an introduction chapter including the background to the problem, the problem formulation, purpose, research questions, delimitations, contribution and disposition will be presented in order to give the reader an understanding of the study and the report. Thereafter, the method of the study will be presented, followed by a chapter including a literature review and theoretical concepts. The PV industry in the Swedish context, will then be included in

5
chapter four that describes aspects for PV farm installations in Sweden as well as the existing industry and the future for grid-connected centralized PV farms. Chapter five explains the investment model used to calculate the profitability of the three cases analyzed in the study. After going through these five chapters, the result and an associated analysis will be presented in chapter six followed by a discussion in chapter seven, bringing up, inter alia, uncertainties in made assumptions and the outcome of the results. Lastly, chapter eight will present conclusions according to the purpose and the general research question stated in chapter one. Chapter eight will also include suggestions for further research, which is based on areas that the researchers have found crucial to include and could be relevant to investigate in a further study.
Figure 4 – The disposition of the study.

6

7
2. Method This chapter presents the method used to conduct the study of centralized PV systems in Sweden. A case study approach is chosen and includes evaluations of installing centralized PV systems at three different geographical locations in Sweden. Initially the methodological approach is described in this chapter, followed by the research design with its chosen methods. Lastly, the quality of research in terms of validity, reliability and generalizability is discussed. 2.1MethodologicalapproachAn inductive approach is chosen due to the characteristics of the research area. Inductive research is a study that develops theory based on observations from a real context, where specific instances could issue in general conclusions. Since this approach allows the researcher to distinguish general patterns based on specific observations, it is considered as an approach that moves from the individual to the general. (Collis & Hussey, 2014) The inductive approach was chosen for this study due to that it requires up-to-date information and data gathered from an empirical reality. Further, the area under study is not a well-researched area for the Swedish industry, which implies that there are few concepts to test. The main purpose of the study is to identify the potential for grid-connected centralized PV systems for large scale production in Sweden. This is carried out through a case study approach by evaluating the solar PV potential at three different locations in Sweden. A case study is suitable to use when investigating a single phenomenon taking place in its real settings to be able to advance the understanding of the particular phenomenon (Cousin, 2005). Further, it is a suitable approach when the focus is on a contemporary phenomenon. (Farquhar, 2012) Based on these aspects, a case study becomes appropriate to use for the particular area under study. When starting a case study the first step is to choose a suitable case (Collis & Hussey, 2014). The final locations that were selected as cases were appropriate since they were assigned for upcoming or already existing wind projects by Vattenfall. This could be seen as a potential benefit since the company already had started inspecting the land area. Further, costs could potentially be cut in a combination due to the share of certain costs, leading to a better possibility for the solar PV farms to become profitable. These locations were also suitable with regards to solar conditions and where spread at different locations in southern Sweden. These cases represent generalized cases for locations with similar insolation. 2.2ResearchdesignAn iterative approach has been used during the study, where problem formulation, purpose and research questions have been revised throughout the process as knowledge has been obtained. (Blomkvist & Hallin, 2015) These have been discussed in consultation with supervisors at the company, but also with support from the supervisor at the university. A common theme when deciding the scope of the study has been to investigate the potential for the use of solar PV in Sweden. However, in which context and how this would be carried out have fluctuated during the process. In the beginning of the process a pre-study was carried out in order to grasp an overview of the PV industry at large and in Sweden. This helped to understand the mechanisms in the PV industry and existing PV technologies. The pre-study consisted of a wide literature research and two interviews, which were held with people researching about solar energy and are in this report named as Interviewee 4 and Interviewee 5. This initial search provided the researchers with a foundation of knowledge about the current situation of solar energy in Sweden, but also in other European countries. This was important to have in mind during the rest of the study to receive a

8
comprehensive view of the potential for solar PV in Sweden. When a broad perspective had been received the literature review and the collection of important knowledge started to be formed. This part was written partly in parallel to the data collection and a section called theoretical concepts was added to the chapter called “literature review and theoretical concepts” that included concepts and theories needed to be able to investigate the profitability of the three cases and to identify key factors as well as the existing challenges in the PV industry. Field trips also composed an important part of the process in order to gain both overall and detailed knowledge. Several discussions with the supervisors at the company led to the decision of investigating three specific locations. Furthermore, reading as well as interviews and meetings with people having experience in solar PV projects contributed to a deeper understanding of what to consider when installing a solar PV farm. When sufficient knowledge had been gained, investment models for the three selected locations could be developed. The investment models were based on an already existing model at Vattenfall. In the end, final formulations of the problem, purpose and research questions could be defined. These were formulated in a way that could be beneficial for Vattenfall at the same time as they could fulfill academic requirements. 2.2.1Pre-studyThe research began with a pre-study to receive an overview of the existing industry of solar PV in Sweden, important concepts and knowledge in Vattenfall's strategies and existing projects. The pre-study consisted of interviews with PhD students, meetings with supervisors at Vattenfall as well as a wide research for literature and documentations within the topic. The outcome of this pre-study formed the basis of the problem and purpose of the study. The first stage in the pre-study was to search for general literature about the PV industry as well as for articles and reports about solar PV in Sweden in order to grasp an understanding of the existing industry and how the solar PV technology functions. When basic knowledge had been gained, two interviews were held with PhD students researching about solar PV systems at KTH; they are in this study called Interview 4 and Interview 5. These interviews were focusing on the potential for solar PV in Sweden, European countries that have advanced more than Sweden when it comes to solar PV and lastly the existing PV technologies. The interviews were semi-structured, meaning that the interviews were organized around a few themes documented in an interview guide (Blomkvist & Hallin, 2015). This interview type was chosen to be able to control what topics to include at the same time as it allowed the researcher to explore the subject field widely. The interviewees were selected after recommendations from the supervisor and an examiner at KTH. To get an even better understanding of the topic, the researchers were observers at three meetings and two presentations at Vattenfall regarding solar energy and the electricity market in Sweden. The involvement in these meetings and presentations contributed to knowledge in how a project at Vattenfall is structured and conducted. The project description from Vattenfall was not completely formed in the beginning of the project, which led to that the meetings with the supervisors at Vattenfall became a part of the pre-study. The project description was thereby discussed and formed together in parallel with the other pre-study activities. 2.2.2Collectionofliterature,theoreticalconceptsandpublicationsIn this study a literature review has been conducted in order to gain better knowledge of the existing research in the area of centralized PV systems and its potential. The focus areas in the literature review are information about the potential for PV generally in Europe, the PV technology and lastly the layout and spacing of a PV farm. The main part of the literature review was

9
performed in the beginning of the study, but additional literature search was carried out in parallel with other activities during the entire project. This chapter also consists of a part called theoretical concepts which covers the concepts and theories that will be used when investigating the profitability of the three cases, the key factors influencing the profitability of a PV farm and the main challenges of the PV industry. These are thus used to be able to answer sub research question two, three and four. The part about theoretical concepts was developed after the main part of the literature research to help analyzing the findings. The theoretical concepts consist of capital budgeting, levelized cost of electricity, sensitivity analysis as a capital budgeting tool, investment decisions, economies of scale and large technical systems. To receive an overview of the Swedish PV industry and PV installations in a Swedish context, articles and reports written by key individuals regarding solar PV in Sweden were collected and analyzed as well as other publications from websites and conference proceedings. The findings from this research was then collected in chapter four which was divided into five areas. Articles and reports were then grouped into each focus area and a deeper study of these areas was carried out. Due to that the use of solar energy for electricity production is a rather new area in Sweden, the collected findings from written material is highly relevant and only a few years old. However, the amount of sources about the PV industry in Sweden is quite limited or very spread out, but the existing reports written by key persons in Sweden are newly updated and covers a large amount of information. The literature, theory and remaining written materials has mainly been conducted from search engines such as Google Scholar, KTH Primo and Scopus, but also websites and it consists of articles, reports and other published documents. The following keywords were used when searching for suitable knowledge: photovoltaics, crystalline solar cells, thin-film, mono-crystalline, poly-crystalline, ground-mounted solar PV, fixed PV systems, potential for PV systems, PV industry, PV farms, PV farms layout, module spacing, solar conditions, insolation Sweden, solar farms in Sweden, power price areas, global radiation, subsidies, direct capital subsidy, power purchase agreement, electricity certificate, guarantees of origin, electricity price and spot price, merit order effect, electricity grid, smart-grid, capital budgeting, levelized cost of electricity, economies of scale and large technical systems. 2.2.3InterviewsEven though many relevant articles and reports exist, many people possess contemporary knowledge that cannot yet be found in written documents. Therefore, the interviews became one of the primary sources for data collection in this study. To include as many perspectives as possible regarding grid-connected centralized PV farms in Sweden, interviews were held with key persons in Sweden with both overall knowledge about solar PV as well as detailed knowledge in certain areas. The interviews have had different characters depending on the objective of the interview and on the interviewees. The interviewees have been researchers, consultants, employees at Vattenfall and other actors within the industry of solar PV. The first interview that was held after the pre-study was an unstructured interview with an employee at Vattenfall. The objective of this interview was to gain an understanding of the electricity certificate system. An unstructured interview was chosen with the intention to be an open interview with only an overarching topic. This choice was made based on the fact that unstructured interviews are suitable for interviews in the beginning of a study (Blomkvist & Hallin, 2015). The following three interviews held were semi-structured interviews and the interviewees were with one person deeply involved in the PV industry in Sweden which is called Interviewee

10
1, one person called Interviewee 3 with very solid knowledge about land lease agreements and another person working at Vattenfall with knowledge about the current PV offers at the company which in this study is called Interviewee 7. The aim of these interviews was to gain knowledge about the current PV industry in Sweden and aspects related to PV installations. The researchers also wanted to collect thoughts and experience from the interviewed persons regarding PV technologies in Sweden and its potential in the future. The semi-structured interviews were mainly held when knowledge within a specific area of the main topic was needed. These interviews have been a substantial part of the study and interviews were chosen because there was an interest in developing deep knowledge and understanding about the phenomenon and finding new dimensions of the studied subject (Blomkvist & Hallin, 2015). All interviews ranged from 40 minutes to 1.5 hour depending on the characteristics of the interview topic. Except interviews, other forms of data collection were made during the study. Contact with consultants active in the solar PV industry in Sweden were performed in form of meetings. The consultants are in this study called Interviewee 3 and Interviewee 6. The meetings were more open than the interviews and consisted of a discussion rather than an interview with questions and answers. Meetings of this kind have been conducted several times during the project with three different persons who possess knowledge in different areas suitable for the study. Through these meetings deep knowledge was gathered and reliable inputs were collected since these persons have real experience from appropriate situations. Shorter meetings have also been conducted with employees at Vattenfall regarding the three cases used in the study. These meetings have mainly been held to collect information about the actual location of the three cases. 2.2.4FieldtripsField trips to one existing solar PV and two wind farms were performed to be able to see farms in its real context. The aim of visiting a solar PV farm was to gain better understanding of the connection between the solar panels and the electricity grid, as well as to find out how the different components interact with each other. It also contributed to a better understanding of how large a solar panel really is and how much space that is needed for a large PV farm. The field trip enabled the researchers to ask questions and have a discussion with people responsible for the PV farm and the guide at the field trip to the Megawatt Park in Västerås is in this study named as Interviewee 2. The field trips were thus a combination of real observations and interviews with important key persons acting within the industry of large scale PV installations in Sweden. The objective of the field trips to two existing wind farms was to see the installation in its real context, to get an idea of the park size and to understand the connection between the wind turbine and the electricity grid. This was mainly carried out to identify which aspects to consider in a potential combination with a PV farm. In particular, what existing parts that could be utilized both by wind and solar and thereby decrease the capital expenditures for a PV farm installation. 2.2.5CasestudyandcalculationsTo be able to answer the second sub research question about profitability for grid-connected centralized PV systems in Sweden, calculations needed to be conducted for the three different cases. These calculations were based on an existing model from Vattenfall, with some modifications. The aim of this investment calculations was to conduct results in form of NPV, IRR, payback period and LCOE for each investment, and these parameters will be explained further in chapter 3. The choice of having three cases with different geographical locations and different operating years also contributed to the possibility to compare the three cases to each other in order to see the impact of these parameters.

11
The calculations also include a sensitivity analysis that will help answering the third sub research question about what key factors that have great impact of the profitability. In this analysis eight parameters have been chosen based on which ones that are likely to deviate from its reference value. The sensitivity analysis will then show which key factors that are actually influencing the profitability. The three cases chosen are in this study called Case 1, Case 2 and Case 3 and are future potential PV farms combined with existing or upcoming wind farms located at different places in southern Sweden. Case 1 is located on the east side of Vättern and the area consists exclusively of woodland. The first operating year of this PV farm is planned to be in year 2021. Case 2 is located at the west coast and is planned to have its first operating year in 2016. This area consists of woodlands and a few fields. Case 3 is located in an area consisting exclusively of woodland and is located at the west side of Vättern. The first operating year of the PV farm in Case 3 is planned to be in year 2019. 2.2.6DataanalysisA large portion of data used in this study has been collected through interviews and field trips. The analysis of the collected data in terms of interviews and field trips has been different depending on the method used. What has been similar to both methods is that when analyzing the findings, the researchers have considered the fact that the responses may be biased depending on what position and opinions each interviewee has. The methods for data analysis of interviews and field trips will be explained further below. InterviewsTo analyze the collected data from the interviews a document was created and designed to divide the collected data into a few important categories. To be able to use correct data, all interviews where recorded and listened through to get a clear picture what was said. The categories chosen were based on four main areas, PV technology, location and insolation, financial support policy and the current and future development of the PV industry. After each interview the collected data were divided into these four areas, and a joint document with the same division was then created to compile all completed interviews. Each category was analyzed to find similarities and differences between the interviewees’ statements. FieldtripsThree field trips were performed during the project and all of these were structured similarly, and the data collected where analyzed in similar ways. Notes were taken during the entire visits to be able to collect all relevant information. After each field trip, a discussion was carried out between the researchers to collect and analyze all information given during the visit. The information irrelevant for the study was removed and a final document with all relevant findings was created. 2.3QualityofresearchWhen discussing the quality of a scientific work there are mainly two concepts to consider, called validity and reliability. These two concepts relate to various aspects of quality. (Blomkvist & Hallin, 2015) Validity refers to if the scientific work studies what it tends to do and to what extent the study measures what the researcher wants it to measure. It can thus be expressed as the correlation between the theoretical and the actual definition. Reliability, on the other hand, expresses the accuracy of the measurements. It also states to what extend another researcher could reach the same results if repeating the same study. (Collis & Hussey, 2014) Another concept that also can be used to express the quality of a research is generalizability. This concept refers to which extent the findings of the research can be adopted to other cases (Collis & Hussey, 2014).

12
How these three concepts have been considered in this study will be explained in separate sections below. 2.3.1ValidityTo increase the validity of this study a few actions have been implemented during the project. To make sure the study includes what it actually intends to study, the purpose has been supported by a research question and four clear sub research questions. Based on this, relevant topics included in the literature review could easily be selected. According to Blomkvist and Hallin (2015) validity is achieved when the literature review is about the subject field presented in the problematization, purpose and research questions. The reports and articles used as sources in the literature review and in chapter four have also been studied critically, which increase the validity further. However, considering that the authors of the documents could have been influenced by companies or other parties during interviews and meetings, which contributes to biased reports, the validity could have been decreased. To reach high validity it is also important that the theory presented in the study are used in the analysis (Blomkvist & Hallin, 2015). This has been taken into account by constantly linking the literature and theoretical concepts chapter to the analysis part. By doing this, only relevant literature and theory are presented in the study. By using an iterative approach, the problematization, purpose and research questions have constantly been revised, which contributes to higher validity in the sense that these paragraphs are consistent with the methods for data collection and the content of the final discussion. The interviews held during the study have mostly been semi-structured, meaning that quite open questions have been asked. This might decrease the validity of the study in some cases when the interviewees interpreted the meaning of the question. That could result in answering the wrong question and therefore the interviewee would provide the researchers with data and information that the study does not tend to include. However, to increase the validity of the interviews and to avoid misunderstandings between the researchers and the interviewees, a clear presentation of the purpose and background of the study was presented to the interviewees both through email and as an introduction during the interview. 2.3.2ReliabilityThe reliability of a study is a measure of the repeatability of the study, which means that a high reliability refers to a study that is easy to repeat for another person and which then gives similar results. (Collis & Hussey, 2014) The reliability of this study is increased in the sections including literature, theory and publications, since the sources used for all collected information are presented in each paragraph. In the end of the report a clear reference list is presented alphabetically which makes it easy to find all information about the original source. This clear manner of presenting references contributes to high probability of developing the same findings if the same research was performed by another researcher. The interviews performed in the study might though have decreased the reliability, since semi-structured and unstructured interview tend to lower the reliability of a study and this is the type of interviews used in the research process. These open interviews contribute to possibilities of very wide, long and developed answers from the interviewees, which might not be the same every time the questions are asked. One answer could also lead to supplementary questions that can differ a lot between different cases. To increase the reliability of the semi-structured interviews the interview guides for each of these interviews have been attached in Appendix 1. This makes it easier for other researchers to find out what questions that have been asked during the different

13
interviews and thus contributes to a higher level of repeatability. The reliability has further been increased by recording each interview to be able to go back and listen to the interviews again afterwards. Open questions can often lead to long answers and discussions that are hard to write down as notes during the interview. To be able to make a correct analysis of the interview it is an advantage to have the interviews recorded. 2.3.3GeneralizabilityThe study is quite generalized for all electricity production companies in Sweden in the sense that the purpose of the study and the defined research questions are not specified only for Vattenfall. The main purpose is to identify the potential for grid-connected centralized PV systems for large scale production in Sweden, which contributes to a generalized result useful for many operators within the solar PV industry in Sweden. All sub research questions supporting the research question are also generalized and not specific only for Vattenfall. The cases used when calculating the profitability can be seen as relatively general, where the main difference between different cases would be the insolation. The cases performed during the study and the conclusions drawn from these can therefore be seen as generalizable.

14

15
3. Literature review and theoretical concepts This chapter presents a brief literature review and the theoretical concepts used in the study. A brief literature review was motivated since the study focuses on empirical findings. The literature review includes existing studies in the area of centralized PV systems from a broad perspective and tends to act as a basis for further understanding of the PV industry in Sweden. It starts by highlighting studies that have been made regarding PV installations in Europe with the main focus on Germany. In addition, it will include existing knowledge about PV technologies as well as which parameters to consider in the layout and spacing of a PV farm. The theoretical concepts, on the other hand, covers the concepts and theories used in order to answer the sub research questions and mainly the sub research questions two, three and four. 3.1PotentialforcentralizedPVsystemsinEuropeThe PV technology has for a long time be seen as not being commercial competitive, but due to the maturity of the technology and declining production cost, its competitiveness compared to conventional energy sources has increased. (Karakaya & Sriwannawit, 2015) The European market had a dominant growth of PV installations in 2011. It accounted for 74% of the world’s new PV installations and in 2012 that same figure was around 55%. The price reduction of the PV technology and the increased electricity prices helped to drive this change. (EPIA, 2013a) However, PV installations are now noticed globally, where China, Japan and the USA were the largest markets in both 2014 and 2015. In 2015 these markets represented two-thirds of the additional installed capacity. (IEA, 2016) Despite declining production cost, the current prices for a larger megawatt PV park cannot yet compete with older fossil fuels and nuclear power when comparing LCOE values (see section 3.2.2 about the metric LCOE). (Fraunhofer ISE, 2016) To overcome this, one of the European countries that increases their renewables through several types of policy actions is Germany. Germany has increased its PV installations through their Renewable Energy Act 2014, which includes fixed values, i.e. feed-in tariffs (FiTs), when purchasing and selling PV electricity. (Fraunhofer ISE, 2016) Germany is one of the European countries that is commonly known for applying a FiT policy and their FiT regime has been important for achieving their high renewable electricity goals. (Fulton & Capalino, 2012) The FiT for PV electricity is decreasing though. This since larger systems reached grid-parity (i.e. able to compete with conventional sources in the matter of electricity generation costs) already in 2011 and small roof-top installations reached it in 2012. Only smaller systems below a certain size are guaranteed FiTs. Since 2016 systems smaller than 100 kW are eligible for the FiT, while larger systems over 100 kW have to sale their electricity directly to the market. (Fraunhofer ISE, 2016) Germany recently initiated larger systems in form of auctions. Three pilot auctions were taking place for ground-mounted systems in 2015. The three systems added up to 500 MW altogether. (IEA, 2016) However, it seems harder for PV plants to bring reasonable rates of return in Germany. This could be noticed by the drop in installed capacity three years in a row; -57% in 2013, -42% in 2014 and -30% in 2015. This drop is due to policy makers that for instance are excluding some larger systems from remuneration. (Fraunhofer ISE, 2016) In other countries other alternatives for funding larger systems are found. For instance, in Austria one successful project has been made for larger PV systems, ranging from several 100 kW to some MW systems. This project was called “citizen’s for solar power plants”, where the citizens crowdfunded the project, i.e. became owners to the modules and received an annual interest rate. (IEA, 2016) What could hamper the potential for centralized PV systems in Europe is the identified fact in several studies that micro-production of electricity has a number of advantages, both from a technical and a consumption point of view. Micro-production could be seen advantageous since

16
there is no need for transmission of electricity and neither consideration to grid balance. (Fraunhofer ISE, 2016; EPIA, 2013b) In addition, it could be seen as a benefit for the end consumer since it lowers the electricity bill (IEA, 2016). Another identified benefit is that it could be a new competitive advantage for the European market. From having a system where dynamics have been gained by enhancing returns under a system based on FiTs, a more competitive market could now be formed and result in first-market experience in applications for micro-production. In fact, micro-production of PV electricity has already been promoted in several European countries, such as Germany and Italy. Similar incentives have been made in these two countries, both have been via economic remunerations. (EPIA, 2013b) 3.2DescriptionofPV,fromcellleveltofarmlevel PV is the technology of direct conversion of sunlight to generate electricity. This process occurs at an atomic level and starts naturally for certain types of materials. The materials that possess this photo electronic effect are called semi-conductors and absorb photons from the light, which result in a release of electrons within the material. (SEIA, u.d.) To create electricity from these free electrons, the electrons need to be captured to create an electric current. (NASA Science, u.d.) PV cells are also called solar cells and one single solar cell is small, around 450 cm2, and produces about 1-2 W (Solar energy net, u.d.). To be able to power electrical devices or to create electricity for the grid, the power output needs to be increased. This becomes possible by electrically connect a number of solar cells to create a larger unit called photovoltaic module. These modules can then be wired together in order to create an even larger unit, a solar array. (NASA Science, u.d.) The modules are then interconnected either in series and/or in parallel and the relation between solar cells, modules and solar arrays is shown in Figure 5.
Figure 5 – PV cells, modules and arrays.
The electricity produced by PV modules or arrays is direct-current, and to be able to convert the electricity to alternate-current electricity the system needs an inverter. Another part that usually is included in solar systems are structures that point the solar cells to the sun. (Energy.gov, 2013) The great advantages with solar PV cells are that the energy source, the sun, is completely free, they emit no sound and there are no pollution or emissions during operation. How they are manufactured et cetera can be discussed, but is not included in this study, i.e. life cycle assessment (LCA) is not considered. The efficiency however, is lower from PV cells than from other energy sources such as wind and hydropower. The efficiency of the existing PV modules on the Swedish market today is between 7-20% and an important aspect to consider concerning efficiency is that the temperature has a large impact. With increasing module temperature, the efficiency will be

17
lower, which implies that good ventilation around the modules should be taken into account. (Pellby & Larsson, 2015) The efficiency for (silicon based) modules typically decreases with 0.45 %/°C. (Stridh, 2016c) 3.2.1TypesofPVtechnologiesDifferent types of technologies for solar PV exist, but many of them are still in the research stage. Only a few technologies exist on the market today. (Ericsson & Simm, 2009) All PV technologies can be divided into four groups; multi-junction cells & single-junction GaAs, crystalline Si cells, thin-film technologies and emerging PV (Krothapalli, 2014). Out of these four, the most common ones that will be explained further in this section are the crystalline and the thin-film solar cells, where crystalline constitutes by far the largest market share on the Swedish market today (Pellby & Larsson, 2015). CrystallineSicellsCrystalline Si cells, made from silicon, are generally the most efficient PV cells and are called crystalline due to the structure of atoms that are organized in a crystal pattern. Silicon is a finite material, but is available in such large quantities that the access of material would not be a problem. (Ericsson & Simm, 2009) Crystalline Si cells can be divided into two subgroups called polycrystalline and monocrystalline. These two types are in many aspects very similar to each other and have almost identical properties, but there are differences and the greatest difference is the crystal structure of the materials. (Pellby & Larsson, 2015) Monocrystalline is the most prominent type of crystalline cells and consist of high-purity silicon ingots. Of these cylindrical ingots four sides are cut out to create a silicon wafer. This process gives the monocrystalline cells its characteristic look, at the same time as it optimizes the performance and lowers the costs. Monocrystalline cells have a higher grade of silicon than polycrystalline cells, and are therefore more efficient. The efficiency of a monocrystalline cell is typically around 15-20%. The high rate of silicon does not only bring positive effects like higher efficiency, it also contributes to higher cell costs. (Energy Informative, 2015) In appearance, the difference between monocrystalline cells and polycrystalline cells is that polycrystalline does not have the rounded corners like monocrystalline cells. Polycrystalline cells are perfectly rectangular with no rounded edges. The simpler solution contributes to lower costs of the solar cells, but the lower amount of silicon entails a lower efficiency. The efficiency of polycrystalline solar cells are typically around 13-16%. Since the efficiency is lower, more space are required to produce the same amount of power as a monocrystalline solar panel. (Energy Informative, 2015) Thin-filmcellsThin-film solar cells are also called the second-generation solar cells and are made from amorphous silicon or non-silicon materials. These type of solar cells use thin layers, only a few micrometers thick, of semiconductor materials. (NREL, 2014) The efficiency for thin-film solar cells are typically around 7-13 % depending on the technology. Advantages with thin-film solar cells, compared to crystalline cells, are that mass-production is simple which lowers the prices, they are not as sensitive to high temperatures and shading. In addition, their homogenous appearance makes them look more appealing. The disadvantages however, are that they tend to degrade faster than crystalline cells and they require a lot of space, which contributes to higher costs for PV-equipment. (Energy Informative, 2015)

18
3.2.2PVsystemsWhen building a ground-mounted solar PV farm two types of systems can be used, either fixed mounted modules or tracking devises. (Green Rhino Energy , u.d.) Each of these two systems will be explained further below. FixedmountedFixed mounted modules means that the solar modules always point at the same direction. The modules are then mounted such that they face the best angle. (Green Rhino Energy , u.d.) This means that no moving parts exist, which lowers both the maintenance of the system as well as the installation and operational costs. Fixed mounted modules are less efficient than tracking devices, but requires less space. (Ontario solar farms, u.d.) Tracking devices Ground-mounted solar PV farms can also use tracking platforms, meaning that the array follows the daily movement of the sun. By using tracking devices, the solar insolation can be maximized which results in increased efficiency. However, these kind of systems are much more expensive to install and maintain than the fixed mounted modules. (BRE, 2013) Different types of tracking modules exist on the market today and the platform can tilt the surface along either one or two axes. (Green Rhino Energy , u.d.) 3.2.3LayoutandspacingWhen installing a PV farm, the layout of the modules needs to be taken into consideration in order to achieve a high energy production yield. The inter-row spacing between the modules is one important aspect to take into account. This since if the modules are placed too close the risk of shading could be decisive for the energy production yield and under-performing systems. (Diehl, 2015) The module spacing is defined by the distance from one front edge of a module to another. The required distance between the modules to avoid shading depends on the size of the modules, the module tilting angle and the lowest height of the sun to avoid shading, which is shown in Figure 6.
Figure 6 – Illustrating the inter-row spacing between the modules, where the parameters are defined as β=module tilting angle, r=inter-row spacing, l=module length and α=lowest height of the sun to avoid shading, also mentioned as solar altitude angle.
(Adapted from Stridh, 2016c)

19
The inter-row spacing increases when the tilting angle rises and when the sun height decreases. It is often a tradeoff between how much the modules should be tilted and the inter-row spacing. (Green, 2011) To be able to calculate the inter-row spacing the solar altitude angle (α) must be known and is set by at what height shading ought to be avoided, where the sun height depends on the time of day. The optimal inter-row spacing could be calculated manually, but there also exist different computer software programs that could calculate the most beneficial spacing. (Energytrust.org, 2009) The available land area for the solar farm is often the limiting factor when deciding at which solar height shading should be avoided. If a certain number of panels are placed on a limited land area the sun height is restricted to a certain interval. (Green, 2011) The chosen solar altitude angle may not give shading in the summer, but during the winter when the sun stands lower shading occurs. The used solar altitude angle at PV farms in Sweden differs between different cases. The chosen solar altitude angle and tilting angle have resulted in inter-row spacing between 4.7 to 9.33 meters. At a layout in Arvika a solar altitude angle of 9.87° and a tilting angle of 45° were used, which resulted in an inter-row spacing of 9.33 meters. In contrast, at a layout in Heby a solar altitude angle of 12° and a tilting angle of 30° were used and created an inter-row spacing of 6.3 meters. In many procurements a solar altitude angle of 18° and a module tilting angle of 30° is used. These different layouts with various solar altitude angles have resulted in different amounts of days without any shading. From the 27th of October shading will occur during whole days for a solar altitude angle of 18°, whilst an angle of 12° and 9.87° shading starts from 16th and 25th of November respectively. Consequently, smaller solar altitude angles result in more days without shading during winter time. Table 1 summarizes the amount of hours without shading for different solar altitude angles. (Stridh, 2016c)
Table 1 – Number of hours without shadow for different solar altitude angles (panels facing south). (Data from Stridh, 2016c)
3.3TheoreticalconceptsThe main focus of this section will be on capital budgeting, but it will also include the metric LCOE and the usage of a sensitivity analysis. Further, this section will include important factors to include when making investment decision and also the concept about economies of scale. These concepts and theories are used in this study when estimating the profitability of the three cases and when defining the key factors affecting the profitability, thus when answering sub research question two and three. Lastly, to be able to analyze the main challenges as stated in sub research question four, the theory of large technical systems (LTS) will be presented.
Solaraltitudeangel
Date 9.87° 12° 18°
2016-10-01 08:36am 07:58am 06:01am
2016-10-27 05:46am 04:50am 0
2016-11-16 02:51am 0 0
2016-11-25 0 0 0

20
3.3.1CapitalbudgetingCapital budgeting is the concept used when describing the process of analyzing investment opportunities. It shows which investments to accept and which ones to refuse. There exist different methods when determining an investment opportunity. The net present value (NPV) rule, the internal rate of return (IRR) rule and the payback rule will now be described. NPVruleThe NPV rule is the most accurate method to use. The NPV is a method to value future cash flow that an investment will generate. When using the NPV rule, the first step is to forecast the earnings and costs. Based on these, the project’s future cash flow can be estimated, which in turn can be discounted and lastly used in order to compute the project’s NPV. (Berk & DeMarzo, 2014) This will be described next in accordance to how Berk & DeMarzo (2014) describes it. Firstly, step one when calculating the NPV is to forecast the earnings. The future earnings are determined by first looking at how much they are expected to change due to the investment. In other words, the specific earnings that the investment would generate. The potential earnings that the investment would generate is calculated by the following. Firstly, the expected operating earnings before interest and taxes (EBIT) are calculated by subtracting the operating expenses and deprecation from the expected revenue. Thereafter, the estimated taxes are subtracted in order to receive earnings after taxes. These calculations are made for every year throughout the whole lifetime with the use of Equation (1).
𝑈𝑛𝑙𝑒𝑣𝑒𝑟𝑒𝑑𝑛𝑒𝑡𝑖𝑛𝑐𝑜𝑚𝑒 = 𝐸𝐵𝐼𝑇 ∗ 1 − 𝜏7
= 𝑅𝑒𝑣𝑒𝑛𝑢𝑒𝑠 − 𝐶𝑜𝑠𝑡𝑠 − 𝐷𝑒𝑝𝑟𝑒𝑐𝑖𝑎𝑡𝑖𝑜𝑛 ∗ (1 − 𝜏7) (1) The term depreciation is used in Equation (1). This is a term that describes that the investment cost is divided into fractions over the whole lifetime and is then called depreciation. The deprecation can be calculated in different ways. The easiest method is called straight-line depreciation, where the cost is divided equally over the whole lifetime. However, it is allowed to have higher depreciations during earlier years of an assets lifetime. This is preferable since it contributes positively to the company’s cash flow. A company wants to use the most accelerated method for tax benefits, which will lead to an acceleration of the tax savings and a rise of the present value. (Berk & DeMarzo, 2014) The term 𝜏7 is also used in Equation (1) and this is the marginal corporate tax rate. In Sweden the corporate tax rate is currently 22%. (Skatteverket, 2016) The second step when calculating the NPV is the determination of the free cash flow. Cash flow needs to be calculated since earnings, that was calculated in step one, is just a measure of performance and cannot be used to fund new investments or pay salaries. For that, cash is needed. To be able to analyze the effect of a specific project on the firm’s cash flow the term free cash flow (FCF) is used. FCF is determined by the following equation,
𝐹𝐶𝐹 = 𝑅𝑒𝑣𝑒𝑛𝑢𝑒𝑠 − 𝐶𝑜𝑠𝑡𝑠 − 𝐷𝑒𝑝𝑟𝑒𝑐𝑖𝑎𝑡𝑖𝑜𝑛 ∗ 1 −𝜏7 +𝐷𝑒𝑝𝑟𝑒𝑐𝑖𝑎𝑡𝑖𝑜𝑛 − 𝐶𝐴𝑃𝐸𝑋 −∆𝑁𝑊𝐶, (2)
where the first part comes from Equation (1). Then depreciation is added back since it is not a cash expense and therefore it should not be included in the cash flow forecast. This is followed by that the capital expenditure (CAPEX), paid in year 0, is subtracted. The last term ∆𝑁𝑊𝐶 expresses the change in working capital, where working capital expresses the difference between current assets and current liabilities and includes cash, inventory, receivables and payables. An increase

21
in NWC is an investment. This means that it decreases the available cash and thus the free cash flow. An increase of NWC in year t is defined as
∆𝑁𝑊𝐶I = 𝑁𝑊𝐶I − 𝑁𝑊𝐶IJK. (3)
The ∆𝑁𝑊𝐶 is calculated for all years in the forecast. The last step in order to determine the NPV is to discount the cash flows. Future cash flow is discounted in order to see what it is worth in today’s value. In other words, it considers the time value of money, i.e. that money is less valuable in the future. To be able to discount the cash flow a discount rate is needed. The WACC rate is often used as discount rate. This since it includes the cost of capital, meaning how the firm is financed. WACC is calculated according to
𝑟MN77 =O
OPQ𝑟O +
QOPQ
𝑟Q, (4) where E = market value of equity D = market value of debt rE = equity cost of capital rD = debt cost of capital There exist two different types of WACC, real and nominal, with the main difference that the nominal WACC is adjusted for the inflation rate. The relation between the nominal and real WACC could be expressed with the Fisher equation, which follows
(1 + 𝑅RST) = (1 + 𝑅UVNW)(1 + 𝑖), (5) where Rnom is the nominal WACC, Rreal is the real WACC and i is the inflation rate. (Hathaway, 2005)
With the use of WACC as discount rate the NPV can lastly be calculated in accordance to
𝑁𝑃𝑉 𝐹𝐶𝐹 = YZY[(KPU)[
.RI\K (6)
All the free cash flows that are generated every year are discounted and summed up in order to receive the NPV. The cumulative cash flow can also be calculated and this is made in order to see the effect of the cash flow. The cumulative cash flow is calculated by summing up the cash flow from year t with the cash flow from previous years (t–1). This is made for each year throughout the whole lifetime. The accumulated cash flow then shows if the investment will generate any profit. IRRdecisionruleEven though the NPV gives a more reliable view of the investment, other additional methods can be used. One of these is the IRR rule. This rule is applied to single projects within a company. The calculated IRR expresses the return on the project, which means that a higher profitability calls for a higher IRR. The investment decision is based on the sufficiency of the calculated IRR. In other words, the decision is based on if IRR is higher or lower than the required rate of return. When the calculated IRR meets the requirements on the rate of return an investment is made (with the proviso that there are no other aspects hindering the investment.) (Berk & DeMarzo, 2014)

22
There are some drawbacks of the IRR rule. For instance, it is rarely suitable to compare different alternatives since it only focuses on the IRR. This is often the case when comparing alternatives with different lifetime; a shorter project with a higher IRR could be chosen instead of a longer project with a lower IRR, which may have other important long-term aspects. Consequently, the IRR rule should only be considered for single projects and not for comparing different alternatives. (Rönnberg, 2015) Furthermore, there could occur difficulties when calculating the IRR. These situations could be when there exist multiple solutions to the IRR or when the IRR does not have a solution at all. If these situations occur when calculating, the IRR is simply not suitable to apply. When using the IRR rule caution should be taken into consideration to avoid earlier mention pitfalls. (Berk & DeMarzo, 2014) The IRR is calculated by setting the NPV equal to zero, as shown in Equation (7)
𝑁𝑃𝑉 = YZY(KP])[
RI\K = 0, (7)
where FCF is the free cash flow, i the IRR and t is the year. PaybackruleThe simplest form when analyzing an investment is the payback rule. To apply the payback rule, you look at how long time it will take for the future cash flows to exceed the initial investment. This calculated time is called the payback time. If the payback time is shorter than the projects lifetime, the investment is usually accepted. (Berk & DeMarzo, 2014) The payback rule is neither as reliable as when looking at the NPV. This since it ignores how the project is financed, i.e. the cost of capital, and also the time value of money. (Berk & DeMarzo, 2014) 3.3.2Levelizedcostofelectricity(LCOE)The levelized cost of electricity (LCOE) has become a widely used measure in order to identify cost-effective energy production technologies. It is an easy metric to use when comparing cost efficiency of different energy generation technologies. (Ouyang & Lin, 2014) According to NREL (Short, et al., 1995), LCOE is explained by the total cost of a technology expressed in euros per kilowatt-hour of electricity that is generated over its whole lifetime and is calculated in accordance to Equation (8).
𝐿𝐶𝑂𝐸 = aSINW7SbIScVUW]dVI]TVaSINWNTSeRISdfUSge7VgVRVUhiScVUW]dVI]TV
=jk
(lmn)kokpl
qk(lmn)k
okpl
, (8)
wherethedifferentparametersaredefinedasfollows,Cn=Totalcostincludinginvestment,operation&maintenance (andfuelcost)inyearn.Qn=Energygeneratedinyearn.r=discountrate.N=expectedlifetimeofinvestment. In this report LCOE will be used in two different ways. One LCOE that will be used exactly as Equation (8), will be called LCOEneutral. This LCOE aims to give the possibility to compare PV

23
with other technologies. In addition, it aims to compare the calculated value in this study with other research. The other LCOE that will be used considers the financial support policy and will be called LCOEadjusted. This is carried out through subtracting the revenues generated from the direct capital subsidy. The LCOEadjusted will be used when comparing the costs with the electricity spot price and will then be a method to analyze the profitability. The calculated LCOEneutral will be compared to a report written by Energikommissionen (2016), where the level of LCOE for PV farms in Sweden is around 101 €/MWh. Further, it is mentioned that wind has a LCOE of about 56 €/MWh and hydropower has a LCOE of about 50 €/MWh. (Energikommissionen, 2016) 3.3.3SensitivityanalysisasacapitalbudgetingtoolA sensitivity analysis is a capital budgeting tool. It is used to break down the made assumptions in the investment calculation. By conducting a sensitivity analysis, an understanding is gained of how the calculated result changes when the underlying assumptions are being varied. It is useful in investment decisions since it allows to pinpoint the effects of errors in the investment calculation. Furthermore, a sensitivity analysis identifies the assumptions that affect the most, which helps to discover the most critical economical aspects when carrying out a project. (Berk & DeMarzo, 2014) There are different ways to conduct a sensitivity analysis. A basic method is to use one-at-a-time (OAT), with the single focus on correlation between input and output. It is carried out by varying one parameter at a time while keeping the rest of the parameters fixed. (Rönnberg, 2015) All included assumptions for each parameter are set at best and worse conditions. (Berk & DeMarzo, 2014) 3.3.4InvestmentdecisionsMany different parameters may lay in the basis of whether an investment is made or not, and one of these parameters is the IRR. If the IRR is greater than the value of WACC for the project, the project should be accepted. This indicates a positive NPV and can therefore suggest a profitable investment. If IRR should be lower than the WACC the project should in contrast be rejected. As a conclusion of this, all projects with a positive NPV and an IRR greater than the WACC should be funded. (Jeffery, u.d.) Usually, IRR has a value of about 7-10 % for solar PV installations in Europe for large scale electricity production. (Solar Energy Partners, u.d.) The IRR can also be discussed through different perspectives, depending on the level of risks and uncertainties for an investment. If the investment tends to have high risks or uncertainties, the IRR needs to be higher to carry out the investment. For PV investments in Sweden typically uncertainties, which can lead to that future savings will be less than expected, can be the price of electricity, decreased capital subsidies, the number of hours of sunshine, snow conditions and technical breakdowns. Uncertainties like these can cause worse results than shown in an investment calculation and can thereby go from being profitable to non-profitable. To avoid this situation a higher IRR can be required to make a positive investment decision. (Swedish Energy Agency, 2016a) The payback time for a solar PV investment is long, which can be another aspect contributing to a higher requirement of the IRR. (Swedish Energy Agency, 2016a) When comparing different projects and making investment decisions out of these, the project with a good IRR and the shortest payback time are most often selected. (Jeffery, u.d.)

24
The time for investments is another aspect to consider when making investment decisions. An investment five years from now can be much more profitable than an investment today. The equipment used today can in the future compete with both more efficient and cheaper equipment. This means that even though an investment might be profitable today, it can be better to wait a few more years to get an even more profitable and safe investment. (Swedish Energy Agency, 2016a) 3.3.5EconomiesofscaleThe concept economies of scale describe the cost advantage that is reached with a higher production. (Arcos & Alvarez de Toledo, 2009) Economies of scale is included in this study to be able to analyze if there are any potential scale effects in grid-connected centralized PV systems. There exists some research about scale effects of energy power plants and also for PV in particular. In a study conducted by NREL (2015) in the Sunshot initiative, there exist some large scale effects for US PV installations. In particular, for utility PV systems, defined in the study as systems larger than 5 MW, a cost reduction of 10-11% is noticed in size expansions between 5 MW to 180 MW. Half of the price reduction is noticed between 5 MW to 20 MW, but beyond 20 MW the effect is diminishing. The costs that are included are defined as overnight capital costs, meaning the costs that will occur if the plant is built overnight. Despite this fact, the systems that came online in 2014 in the US did not have any noticed large scale effects when analyzing the reported prices. This was mainly due to specific location issues and due to that the larger systems had a delay between the time the power purchase agreement (PPA) was executed and the project was completed. PPA is a concept that will be described in chapter four. Further, the study only analyzes the system cost and not the cost for the transmission and distribution of electricity. This is something that Farrell (2015) strongly emphasizes when he is questioning the economies of scale for solar energy. According to Farrell, the scale effects are less or not at all apparent when looking at the whole chain, i.e. from the production of energy to the transmission of electricity reaching the end consumer. However, it should be noted that the Farrell has the consumer's perspective in focus. This part is not analyzed in this study since it is not within the system boundaries that has been set in the delimitation of this study. The system boundaries are illustrated in Figure 7. The figure explains that the system is delimited and begins at the conversion of solar energy to electricity and ends with the grid. The parts that are outside of the system is the distribution of electricity to end consumer.
Figure 7 – Sketch of the system boundaries.

25
3.3.6LargetechnicalsystemLarge technical systems (LTS) is a theory created by Thomas P. Hughes and was developed in order to analyze the dynamics of change in technological systems. This theory will be used in this study to be able to identify and analyze the challenges in the development of the PV industry in Sweden. This will later be analyzed in accordance to the set system boundaries as defined in Figure 7. Technical systems are based on sociological aspects and they are shaping the society. The systems are complex and large. They include physical components such as transformers and transmission lines. However, they also include different types of organizations like investment banks and utility companies. The theory is including both technological and sociological aspects; they could not be handled in silo since they are correlated. All components, physical or non-physical, in the system interact with each other. If one component is removed or changed it will affect all other components taking part in the system. (Hughes & Mayntz, 1988) If looking at the whole PV industry as a large technical system, it includes physical components such as PV modules, inverters and transformers. Further, it includes several organizations, inter alia, utility companies, NordPool spot market, electricity trading companies and the end consumers. In addition, the Swedish government is affecting the system by their regulations. All these different components interact in a complex way that include both technological and sociological aspects. From the production of electricity until it has reached the end consumer, several organizations and other components have an impact along the way. The systems can transform in different ways depending on different factors that are taking part in the system. To be able to describe the transformation of a system in accordance to Hughes (1983) the concepts, reverse salient, critical problem and salient, are used. First, reverse salient describes that there exists a component that does not harmoniously follow the other components in a system. It is an analogy with the military, where similarities could be drawn to an advancing battle line; some parts are coherent with other sections in the front but has fallen behind. Reverse salient could be described as laggards of a transformation and could arise from the inside of the system, its environment or some kind of (complicated) combination of these. The concept reverse salient insinuates the need for focused action if the expansion or development of the system will proceed. The result of a reverse salient is that whole enterprises will be hindered from evolving. Technological developments often occur when attempts are made to correct for reverse salient. Inventors and engineers often approach these kind of challenges as seeing the reverse salient as a number of critical problems, whose solutions would bring the system back on track. Lastly, in contrast to reverse salient, the concept salient is a component in the system that is in the forefront and could be seen as the driver of the transformation. These components are more developed in the system by for instance being more efficient or more economical.

26

27
4. The PV industry in the Swedish context After receiving an overview of PV from cell level to farm level and the theoretical concepts used to be able to conduct the results of the study, this chapter will now focus on the PV industry in Sweden. It will start by explaining locations for PV farms in Sweden followed by the existing financial support policy. Thereafter, the electricity market in Sweden will be presented as well as grid aspects and the energy system at large. Lastly, the development of the PV industry in Sweden will be highlighted which will form the basis of answering sub research question one. 4.1LocationforPVfarmsinSwedenWhen planning for a PV farm installation it is important to consider what location that is most suitable for the installation. The most important location aspects to consider when investing in a solar PV farm in Sweden are the insolation on the specific place, in which power price area the installation will be placed and what type of land the chosen area has. These aspects will be described in more detail below. 4.1.1InsolationSince PV farms are driven by the incident radiation from the sun it is important to find a place with satisfactory radiation. Global radiation is used to describe the total amount of solar radiation that hits a horizontal surface. The global radiation consists of two different types of radiations called direct and diffuse radiation. Direct radiation is the solar radiation that travels on a straight line from the sun directly to the surface of the earth. Diffuse radiation however, is sunlight that strikes the surface of the earth, but has been absorbed, scattered or reflected by molecules and particles in the atmosphere such as clouds, water vapor or dust. This results in that the solar radiation depends on both the weather, the position on the globe and the season of the year. (Lindahl, 2014) Sweden possesses good conditions for solar energy with about 1000-2000 hours of sunshine each year. A more common way to express the solar conditions is to present it in amount of insolation from the sun. This is given by the amount of power that is produced by the sun per unit area during a specific time. The insolation in Sweden is about 1000kWh/m2 per year in the south and about 800kWh/m2 per year in the north. This shows that the insolation increases the farther south in Sweden the location is. (Windon, u.d.) Figure 8 shows that the highest insolation can be found on the coast of southern Sweden and on the islands Öland and Gotland. (SMHI, 2014)

28
Figure 8 – Global radiation map over Sweden. (SMHI, 2014)
The insolation varies every year due to natural fluctuations. However, since the mid 80’s and until 2005 the annual insolation has increased with about 8%. The curve flattened after year 2005 and was kept more or less constant until today. Future scenarios created by Landelius at SMHI, indicate that the insolation will decrease the next-coming 50 years compared to today’s levels. The optimistic scenario (rcp45) and pessimistic scenario show a decrease of around -2% to -9% and -2% to -12% respectively. (Landelius, 2016) 4.1.2PowerpriceareasSweden is divided into four different power price areas which can be seen in Figure 9. These four areas represent different prices for electricity depending on how much electricity that is produced and consumed in each area. The majority of all the hydropower plants are located in northern Sweden, which contribute to a large amount of produced electricity. However, a quite low share of the Swedish population lives there which makes the consumption of electricity much lower in this part of the country and contributes to an excess amount of electricity in northern Sweden. In southern Sweden the opposite situation occurs; the consumption is larger than the production of electricity, which contributes to a shortage of electricity and thus a higher electricity price. (Swedish Energy Markets Inspectorate, 2016) One challenge with this mismatch between electricity production and consumption in northern and southern Sweden is that the electricity network lacks sufficient capacity to transport the electricity from north to south during certain times of the year. One of the consequences of the price difference between the four power price areas is higher revenues for those choosing to invest in electricity production plants in southern Sweden instead of in northern Sweden. (Swedish Energy Markets Inspectorate, 2016)

29
The division into these four power price areas was made in November 2011 due to that Svenska kraftnät, who runs the Swedish national grid, was reported to the European Commission for periodically limiting exports of electricity to Denmark. The consequence of this was that the European Commission demanded Svenska kraftnät to handle their transmission constraints in the national grid better in order to avoid discrimination between users in other parts of Europe. The result of this became the division into the four power price areas. (Swedish Energy Markets Inspectorate, 2016)
Figure 9 – The four power price areas in Sweden. (Adapted from Swedish Energy Market Inspectorate, 2016)
4.1.3LandconditionsLand conditions refers to what type of land different types of areas consist of. According to Lantmäteriet, who is the authority in charge of mapping Sweden, land can be divided into nine different types. These nine types of areas are lakes and larger rivers, forest, cultivated land, populated areas, marshes, mountains, blocky ground, bare mountains, and other open land. (Lantmäteriet, u.d.) When planning for an installation of a large scale PV farm the type of land needs to be considered both due to economic reasons and due to knowledge about what the land would be used for if a PV farm would not be built. A large scale PV farm requires large areas, around 4 hectares for 1 MW if looking at the existing centralized PV farms in Sweden. It can therefore be seen as waste of land to occupy such a large surface for PV installations when they instead could be placed on for example roof-tops. This was raised by several interviewees, for instance Interviewee 1. To avoid exposing large land areas that could be used for arable, pasture or woodland, solar installations could advantageously be placed at landfill areas unusable for agriculture or buildings. Landfill areas like this could be disused dumps, unused industrial areas, marshes or hilly areas where agriculture does not work. Since solar PV installations do not require a specific type of land, these landfill areas would advantageously be used for PV farms. (Windon, 2015)

30
When installing PV farms in Sweden the most common way of land use will be to lease the land required for the installations. Important to know then is the value of different types of land, which indicates that cropland is the land type with the highest value, followed by farmland and pastures. (Jordbruksverket, 2013) According to Interviewee 3 the different land types also have different values depending on its location. Generally, lease costs are much higher in southern Sweden than in the North. 4.2FinancialsupportpolicyIn order to increase the investments in PV systems the support policy stipulated by the Swedish government plays an important role. There exist different types of financial support policies in Sweden that could benefit centralized PV electricity production. (Lindahl, 2014) The financial support policy consists of the direct capital subsidy, the electricity certificate system and guarantees of origin and these will be addressed next. The concept PPA will also be described. 4.2.1DirectcapitalsubsidyforPVIn 2006 the first type of direct capital subsidy for PV systems was introduced and lasted until 2008. However, this direct capital subsidy was only valid for public buildings. (Lindahl, 2014) In mid-2009 a direct capital subsidy was introduced for grid connected PV systems that was open for all actors. (Sveriges Riksdag, 2015) At first the subsidies launched in 2009 were planned to be valid for the end of 2011, but was extended until 2012 and then even longer until 31st of December 2016 with a total budget of 210 million SEK for the years 2013-2016. An additional amount of 50 million SEK was required to be added in the end of 2014 since the previous fund of 210 had ran out by then. (Lindahl, 2014) The current government included in their budget an increase of the direct capital subsidy of 225 million SEK for 2016 and then 390 million SEK every year for 2017-2019. (Swedish Energy Agency, 2016e) The subsidy introduced in 2009 allowed a maximum of 60% cost coverage and 55% for large businesses (depending on the availability of financial means). (Sveriges Riksdag, 2015) This percentage has been decreased gradually since then. It was first decreased to 45% in year 2012 and further to 35% in 2013. (Lindahl, 2014) From the beginning of 2015 the subsidies cover a maximum of 30% for companies installation expenditures and 20% for others. In addition to the percentage there is a maximum upper limit of 1.2 million SEK for the subsidy. Table 2 summarizes the direct capital subsidy system since 2009. Furthermore, the eligible costs have a maximum of 37 000 SEK (VAT not included) for every installed kW of electricity peak effect and the installation has to be carried through before the end of 2016 in order to benefit from the current levels of the direct capital subsidy for PV. (Swedish Energy Agency, 2015b) In the Swedish regulation 2014:1582 (that adjusted the previous regulation 2009:689), a PV system is delimited to where it is connected to the electricity grid. (The Swedish government, 2014)

31
Table 2 – Overview of direct capital subsidy from 2009. (Swedish Energy Agency, 2016c)
2009-2011 2012 2013-2014 20152016(until31May)
2017-2019
Maximumcoverageofinstallationcost
55%companies60%others
45% 35%30%
companies20%others
30%companies20%others
UppercostlimitperPVsystem(SEK)
2000000 1500000 1300000 1200000 1200000
Totalnumberofapplications
1725 1354 5118 2496 720
Allowedapplications
546 617 1857 752 542
Disbursedapplications
321 415 1575 820 206
Budget(SEK) 212000000 60000000 210000000 50000000
225000000
1170000000
Disbursedfunds(SEK) 114301404 78346201 148918248 78007756 15644112
The current system cannot keep up with the amount of applications that are received. This could be deduced from Table 2, which describes that there is a gap between the numbers of received applications and allowed applications. From 2009 until the end of 2015 the number of received applications was 10 693, whereas the number of supported applications during the same period was 3 772. (Lindahl, 2014) The waiting time for decisions about the receiving of direct capital subsidy system is around 2 years if applying today. (Swedish Energy Agency, 2016a) 4.2.2TheelectricitycertificatesystemThe electricity certificate system is a market-based support system for RES, including PV. It was implemented in year 2003 in Sweden, but from the 1st of January 2012 Norway joined the system and today it is a common market where both Sweden and Norway could trade electricity certificates. (Swedish Energy Agency, 2015d) The electricity certificate system has the objective to increase the production of electricity generated from renewable sources by supporting the producers. There is a common target for Norway and Sweden to increase the renewable electricity production with 28.4 TWh from 2012 to 2020, where Sweden should achieve 15.2 TWh and the rest of 13.2 TWh should be achieved by Norway. This common target of 28.4 TWh was a raise with 2 TWh from an earlier set target (26.4 TWh) and it was Sweden alone that was assigned to achieve the raise of 2 TWh. In 2015 a financial national target for Sweden was also set and this included a target to finance 30 TWh of new renewable electricity production between 2002 and 2020. (The Swedish Government, 2015) The fact that the system is market-based results in that the electricity producers could sell the certificates on an open market, where the price of the certificates is set in agreement with the buyer and seller. The willingness to buy the certificates is created by a quota. The buyers have a quota obligation, which means that they are obliged to buy a certain amount of certificates. As a

32
consequence, the certificates give an additional income for the electricity producers and thus incentivize the production of electricity generated from RES. (Swedish Energy Agency, 2015a) The actors with quota obligations are the following in Sweden:
• Electricity consumers producing their own power. If the consumed electricity is greater than 60 MWh annually and if the plant producing the power has an installed output of 50 kW minimum
• Power suppliers • Electricity consumers that uses electricity bought on the Nordic market • Power-intensive industries which have been registered by the Swedish Energy Agency
(Swedish Energy Agency & Norges vassdrags- og energidirektorat, 2014)
The electricity producers receive a certificate for every MWh of renewable electricity they produce. In order to receive a certificate, the Swedish Energy Agency has to approve the plant where the electricity is produced. It has to fulfill the requirements of producing electricity from some of the RES written in the law. New plants brought into operation have the rights of receiving certificates for a 15 years’ period, but only until the end of 2035. (Swedish Energy Agency, 2015a) Svenska kraftnät is responsible for handing out the Swedish certificates to the electricity producers. The certificates are only available in electronical format and is collected in a system account called Cesar in Sweden and NECS in Norway. The actors who are quota obligated also have an account in these systems and at the end of March all quota obligated should have a sufficient amount of certificates in their account to cover their specific quota. Moreover, they should hand in a tax return to the Swedish Energy Agency, reporting how much electricity they are obliged to purchase. By the 1st of April all certificates are annulled and if there is a lack of certificates they have to pay a quota fee. (Swedish Energy Agency, 2015a) In order to have control of the certificate system and to make sure that market works as wanted, inspection of the system happens from time to time. Then the Swedish Energy Agency, inter alia, adjust the quota obligations curve. The last inspection happened in 2015 and the next-coming will occur in 2017. (Swedish Energy Agency, 2016d) Energy sources that are eligible for the certificates are wind power, some small hydro power, some biofuels, solar, geothermal, wave and peat. (Swedish Energy Agency, 2015a) The amount of electricity certificates issued for solar has increased during the years as shown in Figure 10. In year 2015 the certificates for solar added up to 24 518, which represented 0.1% of the total amount of certificates. (Swedish Energy Agency Cesar, 2016)
Figure 10 – The amount of issued electricity certificates for solar power during the years 2003-2015. (Data from the Swedish
Energy Agency Cesar, 2016)
010002000300040005000
2003-05-…
2004-01-…
2004-09-…
2005-05-…
2006-01-…
2006-09-…
2007-05-…
2008-01-…
2008-09-…
2009-05-…
2010-01-…
2010-09-…
2011-05-…
2012-01-…
2012-09-…
2013-05-…
2014-01-…
2014-09-…
2015-05-…
2016-01-…
Electricitycertificatesforsolarpower
Amountofelcertificates

33
When it comes to the quota levels they differ every year as seen in Figure 11, and in 2016 the level is 23.1% (Swedish Energy Agency, 2015c)
Figure 11 – The quota levels from 2003 to 2035. (Data from Swedish Energy Agency, 2015c)
The prices for the electricity certificates are currently low compared to the levels of previous years, shown in Figure 12. In the beginning of 2016 (January-February) the electricity certificate price added up to 145-161.1 SEK.
Figure 12 – Electricity certificate prices (SEK) with a month basis. (Data from Svensk Kraftmäkling)
4.2.3GuaranteesoforiginThe guarantees of origin were introduced in December 2010 and is also a form of electronic document that concerns electricity producers and suppliers. (Lindahl, 2014) The main objective is to secure the origin of electricity, which thereby gives the electricity customers the possibility to choose electricity suppliers from an environmental perspective. Similar to the electricity certificates, the producers receive a guarantee for every MWh they produce, which then can be sold on an open market. The buyers are electricity suppliers that want to sell the type of electricity that the producers generate. When the electricity suppliers have bought the guarantees of origin and sold the electricity to the customers the guarantees of origin are annulled. This in order to secure that the amount of sold electricity equals the amount of produced electricity. (Swedish Energy Agency, 2015f) The guarantees of origin is attempted for all types of power generation and applying for them is voluntary. (Lindahl, 2014)
0%5%
10%15%20%25%30%35%
Quotalevels
Quota
050
100150200250300350400
2006-01-01
2006-06-01
2006-11-01
2007-04-01
2007-09-01
2008-02-01
2008-07-01
2008-12-01
2009-05-01
2009-10-01
2010-03-01
2010-08-01
2011-01-01
2011-06-01
2011-11-01
2012-04-01
2012-09-01
2013-02-01
2013-07-01
2013-12-01
2014-05-01
2014-10-01
2015-03-01
2015-08-01
2016-01-01
Electricitycertificateprice
Certificateprice

34
4.2.4PowerpurchaseagreementPower purchase agreement (PPA) is a financial mechanism that can be used by state or local government entities in order to promote RES, such as solar power and is used all over the world. It is a long-term contract, referred to as a PPA, where the buyer, that could be a municipality in Sweden, agrees to purchase 100% of the electricity produced by the system owner. The PPAs often range from 15 to 20 years. There exist various forms of PPAs. In general, a PPA exists of a system owner that takes care of the design, permitting, financing and installation of the farm, which takes place at a customer’s property at little or no cost. The system owner is often a third-party owner (which is why a PPA often is mentioned as a third-party ownership) that assists with financial capital for the project in exchange for tax benefits. The system owner sells the generated electricity to a buyer. The electricity is sold at a fixed rate and is often lower than the utility’s retail rate for electricity. In sum, the system owner receives revenues from electricity sales as well as benefit from tax incentives. One of the main advantages of a PPA is that it avoids unpredictable price fluctuations, since the agreement includes a fix price for the electricity. (NREL, 2009) 4.3TheelectricitymarketIn year 1996 the electricity market was deregulated. This meant that the price for electricity was set on a free market where competition between the electricity producers could occur. This free market is called Nord Pool spot market. However, the price for the electricity grid was not included. Due to this deregulation the end costumer could choose electricity supplier but not grid owner. In other words, there is still a monopoly for the grid, which is own by grid companies (often energy producers). Each one decides for their own geographical area and the grid price affecting the electricity price is set by the grid owner. Nevertheless, there is an organization, called the Swedish Energy Markets Inspectorate, that makes sure that the grid prices do not run away and become unreasonable. (Mälarenergi, 2015) The electricity used in Sweden is both produced in Sweden and overseas, meaning that some of the electricity is imported. (Nord Pool, u.d.b) The electricity that is produced in the northern countries is traded on Nord Pool. Around 90% of the electricity produced in Sweden is sold directly to Nord Pool. (Svensk Energi, 2016a) Nord Pool is a common market for northern electricity producers and suppliers (except Island). (Mälarenergi, 2015) Estonia, Latvia and Lithuania are also part of the market since 2010-2013. As all markets, the spot price on Nord Pool depends on the supply and demand. If there is a surplus of electricity the spot price goes down and if the energy power plants are not able to produce as much electricity as requested the price goes up. (Nord Pool, u.d.b) The price is decided in accordance to the producers’ bids and the suppliers’ desires on the price. In detail, the electricity producers hand in their bids the day before, at 12 am at the latest. They specify how much they want for their electricity in terms of SEK per MWh and also in what power price area the bid concerns. Svenska kraftnät has estimated the amount of electricity that could be transmitted between the different power price areas as well as neighboring countries. The suppliers of electricity then send in their bids of what they are willing to pay for the electricity. Lastly, the price for electricity is set in every power price area, on a level that production and consumption of electricity correspond. The electricity can also be transmitted between areas with low prices to areas with equal or higher prices. Since the price is set several hours before it is produced and consumed other systems exist that can regulate for potential changes on an intra-day and hourly basis. (Söder, 2013) There are several taxes and fees that the producers of electricity have to pay. These are included in different ways and differs depending on the type of technology. One general tax is the property tax. The tax rate differs between the different technologies. However, there exists some exceptions. For instance, producers that have PV farms up to 144 kW are allowed an exemption from the property tax under the circumstance that it is not a concessionary grid. (Svensk Energi, 2016b)

35
Regarding the electricity spot price, it has fluctuated during the last years, which is shown in Figure 13. The figure illustrates that the price has went down during the last years.
Figure 13 – The development of the electricity spot price over time. (Data from Nord Pool, u.d.a)
The gap in year 2011 exists since there was no data available for this year and could probably be due to the transition to the four power price areas (SE1-SE4). There exist many additional factors that affect the levels of the electricity spot price. Among these is the price for fossil energy, including the cost for fuel and the emission allowances. (Söder, 2016) These prices for fossil energy affect the Swedish price since Sweden is part of a Nordic market with linkages to Europe. (Dalakraft, u.d.) Söder (2016) brings up that recent changes that have been made affect the electricity market and thus the electricity spot price. These changes have also an effect on forecasts of the price. One major change is the current debate of nuclear power plants and their power tax. In earlier forecasts the nuclear power plants were seen as fully functional, but now that is not the case; some nuclear reactors have been shut down (2015), which could not be foreseen just a few years ago. What will happen with the nuclear reactors in the future will impact the price and it is discussed in the report what effect shut downs of nuclear reactors will have. Probably it will, according to Söder, have an increase of the price due to decrease of production and increase of import. However, there could be other factors that will have the opposite effect. For instance, that the electricity grid is extended between the North and the European mainland where some countries (UK, Germany, Denmark) have an increase use of energy sources with low variable costs and a decrease use of fossil fuels with low variable costs, which push down the price. (Söder, 2016) This effect is called the merit order effect and will be addressed in the next chapter. The electricity spot price that the producers are depended on should not be confused with the electricity price that the end consumer eventually pays. For the end consumer, the electricity price has three different parts affecting the electricity cost. These three parts consist of, the actual electricity price (i.e. the electricity spot price, with emission allowances included), the electricity grid and last taxes and fees, which includes the cost for electricity certificates. (Svensk Energi, 2016c) The amount of taxes in the electricity price has tripled after the deregulation. (Svensk energi, 2015) The changes of the different components forming the electricity price is shown in Figure 14.
150200250300350400450500550600
2001
2002
2003
2004
2005
2006
2007
2008
2009
2010
2011
2012
2013
2014
2015
SEK/MWh
Years
SE
SE1
SE2
SE3
SE4
Electricityspotprice

36
Figure 14 – Changes of the constituent elements that creates the electricity price for the end consumer. (Adapted from Svensk
Energi, 2016c)
4.3.1ThemeritordereffectDuring the last years when RES have increased, the electricity spot price has been forced down, which is explained by the merit order effect. (Appunne, 2015) In an energy only market, i.e. a market that is broadly defined as where payment is made only for the energy and associated services, not for the installed capacity (compare capacity market) (Harvard, 2005), the merit order effect is explained by the reduction of prices due to a growth of RES. At a given time, the power stations with the lowest variable cost set the beginning point and the most expensive power producers used to satisfy the need for energy set the electricity spot price. (IEA, u.d.; Appunne, 2015) RES such as wind and solar, have very low variable costs. This since the variable costs mostly consist of fuel cost, a cost that wind and solar do not have (their “fuel” is wind and sun, which is free). This means that RES push the conventional power stations down the curve as well as lowering the electricity spot price. Conventional sources are vulnerable to this change, since they cannot compete at lower prices and are being threatened to be pushed out of the market if more RES will increase. (Appunne, 2015) The electricity spot price is set when demand and supply is being met. Every hour an auction process takes place that matches the energy demand with the bid given by electricity producers. Power stations with lowest variable cost, i.e. RES, are used first and if needed, bids from more expensive stations are received in order to meet the energy demand. The electricity spot price is set on the Nordic market where the production of hydro, wind, nuclear and CHP decide the price. Figure 15 shows how supply and demand is being met. The steps displayed in the graph illustrate the power stations different variable costs. (Swedish Energy Markets Inspectorate, 2014)
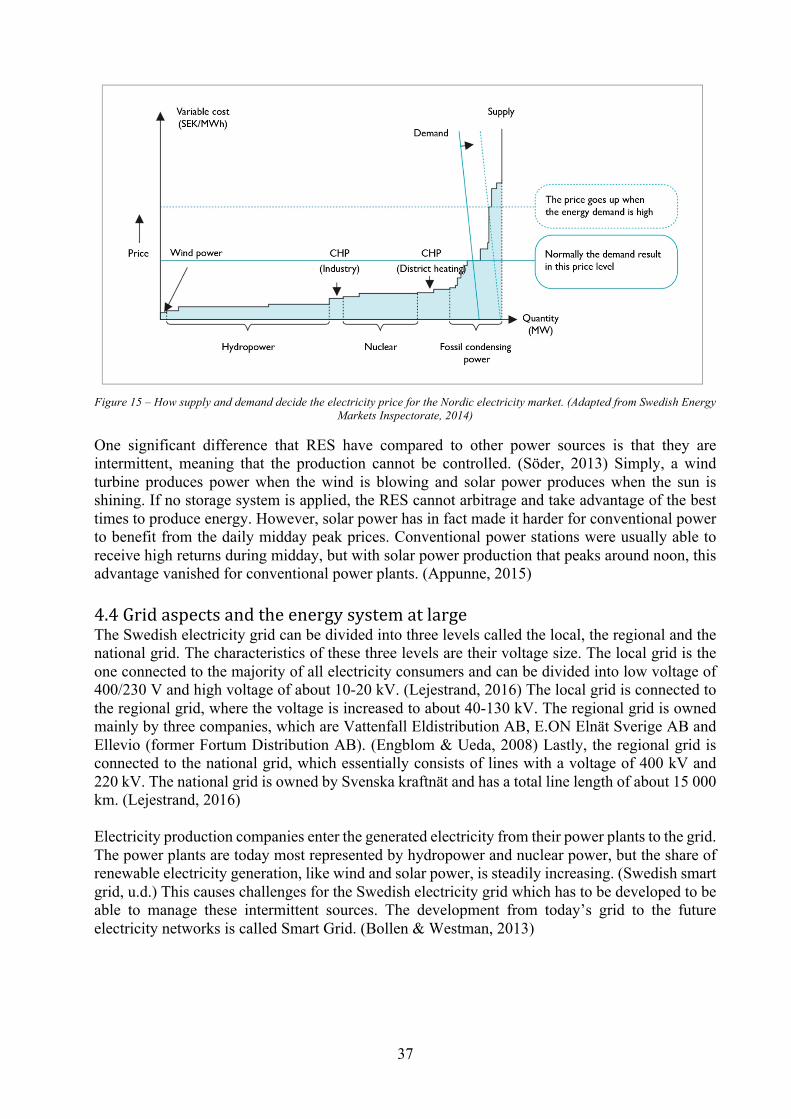
37
Figure 15 – How supply and demand decide the electricity price for the Nordic electricity market. (Adapted from Swedish Energy
Markets Inspectorate, 2014)
One significant difference that RES have compared to other power sources is that they are intermittent, meaning that the production cannot be controlled. (Söder, 2013) Simply, a wind turbine produces power when the wind is blowing and solar power produces when the sun is shining. If no storage system is applied, the RES cannot arbitrage and take advantage of the best times to produce energy. However, solar power has in fact made it harder for conventional power to benefit from the daily midday peak prices. Conventional power stations were usually able to receive high returns during midday, but with solar power production that peaks around noon, this advantage vanished for conventional power plants. (Appunne, 2015) 4.4GridaspectsandtheenergysystematlargeThe Swedish electricity grid can be divided into three levels called the local, the regional and the national grid. The characteristics of these three levels are their voltage size. The local grid is the one connected to the majority of all electricity consumers and can be divided into low voltage of 400/230 V and high voltage of about 10-20 kV. (Lejestrand, 2016) The local grid is connected to the regional grid, where the voltage is increased to about 40-130 kV. The regional grid is owned mainly by three companies, which are Vattenfall Eldistribution AB, E.ON Elnät Sverige AB and Ellevio (former Fortum Distribution AB). (Engblom & Ueda, 2008) Lastly, the regional grid is connected to the national grid, which essentially consists of lines with a voltage of 400 kV and 220 kV. The national grid is owned by Svenska kraftnät and has a total line length of about 15 000 km. (Lejestrand, 2016) Electricity production companies enter the generated electricity from their power plants to the grid. The power plants are today most represented by hydropower and nuclear power, but the share of renewable electricity generation, like wind and solar power, is steadily increasing. (Swedish smart grid, u.d.) This causes challenges for the Swedish electricity grid which has to be developed to be able to manage these intermittent sources. The development from today’s grid to the future electricity networks is called Smart Grid. (Bollen & Westman, 2013)

38
Smart Grid is a broad concept with different definitions, and the definition from ERGEG, European Regulators’ Group for Electricity and Gas, (2009) appears as follows:
ʺSmart Grid is an electricity network that can cost efficiently integrate the behaviour and actions of all users connected to it. Generators, consumers and those that do both, in order to ensure economically efficient, sustainable power systems with low losses and high levels
of quality and security of supply and safetyʺ. One of the challenges of the grid is the increasing production of electricity from renewable intermittent sources. At a low amount of these sources it will not have any impact on the grid, but at a certain point new investments in the power system will be needed. This limit is called hoisting capacity and indicates the maximum amount of electricity production that can be connected without the need to invest in grid. (Bollen & Westman, 2013) 4.5DevelopmentofthePVindustryWhen it comes to PV installations in Sweden, IEA-PVPS Sweden publishes a national survey every year that investigates the current number of installations. According to Lindahl (2014), author of the survey and interviewee of this study, PV installations consisted in the very beginning of small off-grid systems used mostly for holiday cottages, marine applications and caravans. This off-grid segment still constitutes a part of the Swedish PV installations and increases slightly each year, but since year 2007 the capacity of grid-connected installations has provided a greater proportion than the installed off-grid systems each year. The annual increase in installed grid-connected capacity has been significantly higher than the annual installed capacity of off-grid systems, which has resulted in that today’s PV installations consist of seven times more installed grid-connected capacity than off-grid capacity which is shown in Figure 17. Furthermore, the survey describes that the PV market in Sweden can be divided into four different sub-markets depending on type of installations. The first division is between grid-connected systems or off-grid systems. Grid-connected are systems connected to the utility grid and could further be divided into distributed or centralized systems. Distributed grid-connected systems represents the majority of the Swedish PV industry today and consists mostly of roof-top installations on households or other large buildings. These systems first provide the own household or industry with the demanded electricity and then sends out the surplus on the utility grid. The grid-connected centralized systems on the other hand, serves a large consumption of electricity since everything produced are sent out to the utility grid. When discussing off-grid systems, which are systems not connected to the utility grid, this could also be divided into two areas called off-grid commercial and off-grid domestic. The difference between these two areas is that commercial systems refers to small subsystems such as radio masts, while domestic are systems for private use such as electricity production for households or marine applications. Ever since year 1992 there have been an annual increase in installed PV capacity in Sweden, but the trend has not been continuous during the years until today. As shown in Figure 16, the annual installed capacity between 1992 and 2005 was quite small, and the installed capacity consisted almost entirely of off-grid domestic systems. From year 2006 the annual installed capacity started to increase, which happened in the context of an introduction of a new direct capital subsidy program. This program introduction was the start for grid-connected PV systems in Sweden and contributed to an increase in installed capacity until year 2008 when the program ended. When this subsidy program ended, a gap was created with no existing supports for PV installations. The gap existed until mid-2009 when a new subsidy program was introduced and as displayed in Figure 16 the lack of support system in year 2009 contributed to a decrease in the annual installation rate. However, ever since the new support system that is open for all actors was introduced the annual

39
installed capacity has increased a lot. During the year 2012 the total budget for direct capital subsidy was 60 million SEK and between the years 2013-2016 the budget was increased to 210 million SEK, with an additional amount of 50 million SEK in year 2014 and a budget of 225 million SEK in 2016. (Lindahl, 2014) This budget has then been increased further by the current government to be 390 million SEK every year between 2017-2019 (Swedish Energy Agency, 2016e). This presentation of the budgets for direct capital subsidy during the last years indicates a clear relation between increased budget and installed capacity of PV in Sweden.
Figure 16 – The installed PV capacity in Sweden during 2002 to 2014. (Data from Lindahl, 2014)
Interviewee 1 also states that the change in total installed PV capacity has been great the past few years, but there has also been a significant change in division between the four sub-markets. Figure 17 shows the division in installed capacity between the four sub-markets in year 1992, 2007 and 2014. The development indicates that the percentage of off-grid systems have decreased, while the percentage of grid-connected have increased significantly from being almost nonexistent in year 1992 to, by far, dominate the market in 2014.
Figure 17 – The division of installed capacity of PV in 1992, 2007 and 2014. (Based on Lindahl, 2014)
4.5.1Existinggrid-connectedcentralizedPVsystemsThe latest published figure of the total cumulative capacity for grid-connected centralized systems is 3.79 MW at the end of year 2014. The two largest solar PV farms in Sweden in the beginning of 2016 were Mega-Sol in Arvika and the Megawatt Park in Västerås. The remaining capacity of grid-connected centralized PV systems consists of several smaller PV installations.
0102030405060708090
1992
1993
1994
1995
1996
1997
1998
1999
2000
2001
2002
2003
2004
2005
2006
2007
2008
2009
2010
2011
2012
2013
2014
Cumulative installedPVcapacity,MW

40
Mega-SolArvikaIn February 2015 the PV farm in Arvika, called Mega-Sol, was inaugurated. Mega-Sol consists of fixed ground-mounted PV modules and has a total power of 1.04 MW. Mega-Sol is owned by Arvika Kraft AB and the park is built by Windon. The farm is located on waste land consisting of marshland and uses an area of 4 hectares. The entire farm consists of 4 080 modules, 17 inverters, 3 700 meters DC cabling and 1 630 connectors. During the first day of running, the park produced 95% of its total capacity and the annual production is supposed to be more than 1 000 000 kWh. What is unique for this park is that 92% of the content in the park is produced in Sweden. Both the frames, the solar panels and all the other accompanying material such as cables are purchased from Swedish manufacturer. This contributes to values such as more jobs in Sweden and a declaration of good quality. (Windon, 2015) A picture of the park is displayed in Figure 18.
Figure 18 – Solar farm in Arvika called Mega-Sol. (Windon, 2015)
The total investment cost for the Mega-Sol park in Arvika was 13 700 000 SEK, which is equal to 1 410 953 €/MW*, and the calculation made for this investment assumed that the project would receive a direct capital subsidy of 1 200 000 SEK. Arvika Kraft AB has a plan of selling shares of the park to Arvika Fastighets AB, Arvika Fjärrvärme AB and Arvika Teknik AB to consume some of the produced electricity themselves and to be able to balance their lowest consumption with the production for the same time. (Rönning, u.d.) The revenues from Mega-Sol are calculated to be 40 000 SEK annually, and depends on the supply of electricity to the local grid and sales of electricity certificates. Arvika Kraft AB also considers annual cost reductions in form of no energy taxes for the electricity that is consumed by themselves, reduced costs for produced electricity that is consumed by Arvika Kraft AB and electricity certificates. The total cost reduction then results in 750 000 SEK. Annual costs of the system are 770 000 SEK and includes depreciation, loan interest and lastly operation and maintenance. Out of these, depreciation stands for 390 000 SEK and are based on a total lifetime of the modules and frames of 30 years. Annual costs for loan taxes and security fees are 330 000 SEK. The last factor included in annual costs is operation and maintenance, which includes oversight of the facility of two hours every week. This results in a cost of 50 000 SEK annually. (Rönning, u.d.) *The currency is converted 2016-05-19 with the exchange rate 1 Euro = 9.34 SEK (Valuta.se, 2016)

41
Lastly, it should be mentioned that this project has had some problems with module thefts. The planned operation start was delayed due to a theft of 137 modules. A security company was then hired to monitor the park. (von Schultz, 2015) TheMegawattParkVästeråsThe construction of the Megawatt Park in Västerås was introduced in year 2013 and in February 2014 the park was inaugurated. It was at that time the largest PV plant in Sweden and the second largest in the Nordic region. The total installed power of the park is 1.03 MW and it consists of 91 2-axis solar tracker and ten research systems including freestanding 2-axis solar trackers, freestanding 1-axis solar trackers, freestanding fixed mounted with 19-degree tilt, freestanding fixed mounted with 41-degree tilt and fixed mounted on roof with 19-degree tilt. Each of the research systems are available with and without power optimizer. The land of the park was classified as waste land and the total area is 4.8 hectares. The distance between the solar trackers is 25 meters in west-east direction and 20 meters in the south-north direction. This results in some shading which leads to a loss of about 3-4% per year. The owner of the park is Kraftpojkarna, electricity distributor is Mälarenergi Elnät AB, buyer of the solar electricity is Mälarenergi AB and lastly, Mälardalens University has been project leaders of the PV farm project. (Stridh, 2016c) The park is shown in Figure 19.
Figure 19 – The Megawatt Park located outside Västerås. (Stridh, 2016b, p. 10)
The entire park includes 50 kilometers of cables and consists of a 10.7 kV transformer to be able to connect the park to the grid of 10kV. The Megawatt Park is connected to Mälarenergi’s grid and the grid connection fee was 500 000 SEK for the entire park. (Stridh, 2016c) An agreement has been concluded saying that Mälarenergi will buy all produced electricity from the park according to a 15 years long contract. (Stridh, 2016b) Based on an evaluation of the Megawatt Park, the investment costs of a turnkey PV system with a size of a few hundred kW to 1 MW, is estimated to be around 12 000 SEK/kW for a fixed mounted system and around 18 000 SEK/kW for a PV farm with tracking devices. Further, an annual OPEX of 1% of the investment cost has been used. (Stridh, 2016c) The entire cost of the Megawatt Park is estimated to 22 000 000 SEK, equal to 2 287 761 €/MW*, which includes the building, ground works and connection to the grid. There were difficulties in obtaining loans for the investment, due to the fact that the banks did not dare to invest in one, from their view, such a new technology. Twelve banks were asked before one of them accepted their request. (Stridh, 2016b) *The currency is converted 2016-05-19 with the exchange rate 1 Euro = 9.34 SEK (Valuta.se, 2016)

42
The 2-axis solar trackers generated a yield of 1 230 - 1 370 kWh/kW, with 31- 40% higher annual production during the months March to October compared to the fixed mounted PV modules with an optimal inclination angle. One conclusion made from this Megawatt Park is though that it today is more profitable to make fixed mounted installations than using solar trackers, due to the far higher cost for investment, operation and maintenance for solar tracker systems. (Stridh, 2016c) A drawback with the fixed mounted modules compared to the 2-axis trackers, which the Megawatt Park in Västerås has experienced according to Interviewee 2, is though that this modules are easier to steal. During a summer night year 2014, 39 modules from three of the fixed mounted systems were stolen. (Stridh, 2016b) 4.5.2Thefutureforgrid-connectedcentralizedPVsystemsThe interest for grid-connected centralized PV systems seems to increase and there are now some PV installation projects that are planned to be built in Sweden. One grid-connected centralized system that is planned to be built is in Varberg. It will be a 2.7 MW ground-mounted system, and will thereby become the largest built in Sweden. According to Interviewee 6, there are now signs showing that this park will soon be built. Further installations of PV will partly depend on that the cost for PV modules will decrease in the future, which is often mentioned in literature and by people involved in the business. An analysis created by Fraunhofer Institute for Solar Energy Systems ISE (2015) shows that solar power will soon even be the cheapest form of electricity in many regions in the world. Even the most pessimistic scenario, without consideration to technology breakthroughs, expects a substantial cost reduction. The Fraunhofer Institute’s analysis is for large scale PV and the estimations of the future module prices are based on the PV learning curve, which is created by means of historical data. The historic experience curve since 1980 shows that a duplication of produced modules leads to a reduction of the module price by around 20%. Based on this figure and with some regulations taken, the used learning curve in the analysis varies between 19 and 23% and for the pessimistic scenario a learning rate of 10% is used. However, Interviewee 1 and Interviewee 2, mentioned that the limiting factor now is the anti-dumping duties on imports of solar cells and panels from China, which was introduced in 2013 since the low Chinese module prices caused harm to the European PV manufacturers. This means that the prices for solar modules cannot be less than a certain amount (around 0,53 €/Wp in 2016). When it comes to the estimations of future BoS costs in the analysis, they are based on discussions with experts at workshops and resulted in three scenarios with the numbers of 24, 30 and 35% in year 2050. In terms of price it is a reduction from 340 €/kWp to values between 120 and 210 €/kWp in 2050. The analysis further concludes that the solar power cost expects to be 4-6 euro ct/kWh in Europe by 2025 and reaching 2-4 euro ct/kWh in 2050, but it depends on the annual sunshine. These numbers for large scale PV in the future result in cheaper values than for other conventional systems in Europe, which often range between 5-10 euro ct/kWh. One aspect to consider is the fact that solar energy is an intermittent energy source, which will have a limiting factor on the amount of solar energy that can be used in the power system and in turn on the amount of PV that could be installed in Sweden. In a study made by Söder (2013) it is analyzed how the Swedish power system is affected by an increased integration of RES. The study investigates the current electricity consumption (for year 2011) and how it interacts with the production of RES, which is needed in order to understand the need for regulating power (such as hydropower) and the ability to handle peak load hours. The study further investigates different kinds of RES integrations in the power system. The different examples that is analyzed are all

43
based on an integration of 55 TWh of wind and solar power, but with some differences. The amount of 55 TWh is what the power system includes in total of intermittent energy. One example analyzes an RES integration of 45 TWh wind and 10 TWh of solar power, which equals a capacity of 10 657 MW of solar power. Another example investigates an integration of 55 TWh wind and solar, but they are restrained to only form 75% of the electricity consumption. It also exists one example where nuclear power is totally deprecated and the power system exists of RES solely. The main requirement on the power system is that production occurs at the same time as the consumption. This to be able to maintain the same frequency in the electricity grid. The conclusions made from the study by Söder (2013) are several. One conclusion is that the electricity consumption varies a lot more on an hourly basis than the wind power production in Sweden, which is an important factor to consider in order to understand the need for regulating power. The last example where nuclear power is totally deprecated, shows that the production could be sufficient for many weeks during the year when looking at the power balance. However, it occurred some hours when there was a surplus and a shortfall of production. In detail, there existed a surplus of 3 TWh electricity and a shortfall of 2.4 TWh during hours with high and low production of wind and solar. The other simulations with different preconditions also indicate that there will occur hours when the electricity consumption is higher than the electricity production or vice versa. However, there are different alternatives that could be considered in order to handle these hours of excess or shortfalls of electricity. To handle hours with a surplus of production there is mainly three solutions according to the study. Firstly, solar and wind farms could simply be shut off so that they do not produce when they are not needed. This option could though be seen as the cost for the plants increases. Secondly, the surplus of electricity could be exported if there exists a market that allows it. Thirdly, to use the surplus electricity for district heating in electric boilers. However, most of the surplus energy from wind and solar is produced during summer when there is a low demand for district heating, so it is not possible to use all of the surplus energy for this purpose. Further, to be able to handle times with shortfalls of electricity import or usage of the power reserve could be considered. Another option to handle these hours could be to adjust the consumption of electricity. For instance, by rewarding the consumers if they do not use electricity during peak load hours. This study is also extended in a later version, with the main difference that it considers the four power price areas and the transmission capacity between these with an energy system existing of 60 TWh wind and solar power. These large implementations of RES are supposed to happen far into the future when much could have happened. Therefore, more studies have to be made that considers many potential scenarios. (Söder, 2014)

44

45
5. Description of the investment model for three Swedish locations To analyze the profitability of installing centralized PV farms in Sweden, an investment model has been developed. In this chapter the investment model will be explained, and the chosen parameters for the three cases will be presented. In the end of the chapter the use of a sensitivity analysis of the investment will be explained, which is used to be able to find the key factors influencing the profitability. 5.1TheinvestmentmodelThe investment model is developed to analyze the profitability of installing centralized PV farms in Sweden today and in the near future. The model is presented in Table 3 and is based on four different methods, NPV, IRR, discounted payback period and LCOEadjusted. These methods and their criteria of profitability will together create a good basis for investment decisions. A factor called LCOEneutral will also be included to be able to compare the costs of PV farms to other technologies. All figures presented in the investment model are based on an annual period and all costs and revenues are presented in Euros. NPV is, as mentioned earlier, the most reliable method to use in order to conclude if an investment is profitable or not. It presents the difference between the present value of cash inflows and outflows, and will thereby give a clear indication of whether the investment is profitable or not in form of positive or negative values. When the NPV is presented, the IRR will be calculated by the same formula as the NPV, but by replacing the value of NPV by zero. The calculated IRR then expresses the return of the project, meaning that a high value of IRR indicates a good return of the investment. After knowing if the investment is profitable or not, and what return it will give, the next step is to use the Pay-back method. This method is included in order to roughly find out how long time it will take for the investment to pay off. The expected lifetime of the solar farm will here be put in relation to the payback time to see if the investment will pay off before it is obsolete. In this study a module lifetime of 25 years is used. This since the suppliers of PV modules usually give a power warranty of 25 years. (Elforsk, 2014) The LCOEadjusted method is used to be able to found out what level the electricity spot price needs to be to reach profitability. Finally, the LCOEneutral method is used to be able to compare cost efficiency of different electricity production technologies. This investment model is applied for the three cases located in the south of Sweden. The investment decisions for each case are based on the criteria of each parameter in the investment model, presented in Table 3. A summary will then present in what scenarios investments should be made and when it should be avoided for each of the three cases.

46
Table 3 – Description of the investment model including four different methods.
Method Criteria Description
NPV NPV>0ToreachprofitabilitytheNPVhastobelargerthan0
IRR IRR>WACCThevalueofIRRhastobelargerthantherateofWACCtomakeaprofitableinvestment
Discountedpaybackperiod
Discountedpaybackperiod<Expectedlifetime
ThediscountedpaybackperiodofaninvestmenthastobeshorterthantheexpectedlifetimeofaPVfarm
LCOEadjustedLCOEadjusted<Averageelectricityspotprice
ThevalueofLCOEadjustedneedstobelowerorequaltotheelectricityspotpricetocovertheexpenses
The four methods mentioned needs different input parameters to present results, and all these parameters have been divided into five categories in the investment model. The categories are insolation, production assessment, revenues, expenditures and last WACC & inflation rate. Each of these will be explained further below. 5.1.1InsolationThe insolation for different locations differs between both years, months and days, and it is not possible to know exactly the amount of insolation each year during the entire lifetime of a solar farm. In this study the assumed value of the insolation for the three cases will be an average figure on what the insolation has been for the specific locations between 2002 and 2015. The years are chosen due to the fact that the amount of insolation has been quite invariable during this period. According to Landelius (2016) the insolation will most likely decrease the next coming 50 years with percentages of -2% to -12%. However, the decrease of insolation is most noticeable in the northern parts of Sweden. These changes are neglected due to the fact that they are estimated as small in a perspective of 50 years and due to that this study is made for the southern parts of Sweden. The historical data of the annual insolation since year 2002 is taken from SMHI’s data base STRÅNG. To find correct data for all cases the coordinates for each location are needed. The figures presented in STRÅNG give the global irradiance, which is the radiation received on a surface horizontal to the ground. However, the solar panels will have an inclination angle of 45°, which means that the figures from STRÅNG has to be multiplied with a factor of 1.12 which is assumed to be the multiplying factor between a horizontal plane and 45° inclination according to SolEl-Programmet Elforsk. The collected global irradiance for the three cases is shown in the following figures, Figure 20-22. The minimum, maximum and average value each month is shown throughout the years 2002-2015. The minimum and maximum value is included in order to provide an indication of how much the global irradiance has varied every month throughout the years. The average value then gives an idea of the typical global irradiance each month.

47
Figure 20 displays the global irradiance for Case 1, which is located on the east side of Vättern. An average value of 1 104 kWh/m2 annually has been used when calculating the profitability of this case.
Figure 20 – The global irradiance on a horizontal surface for Case 1.
The global irradiance for Case 2 is illustrated in Figure 21. This case is located near the west coast and the annual average insolation is assumed to be 1 077 kWh/m2 for Case 2.
Figure 21 – The global irradiance on a horizontal surface for Case 2.
020406080
100120140160180200
Insolatio
nkW
h/m^2
GlobalirradiationCase1
Averagevalue Maximumvalue Minimumvalue
020406080
100120140160180200220
Glob
alirradiancekW
h/m^2
GlobalirradiationCase2
Minimumvalue Maximumvalue Averagevalue
48
The global irradiance for the last case is illustrated in Figure 22. This case is located on the west side of Vättern and the average insolation is assumed to be 1 057 kWh/m2 annually.
Figure 22 –The global irradiance on a horizontal surface for Case 3.
All three cases have similar variations throughout the year, with little irradiance in the first and last months of the year. This influenced the choice of solar altitude angle, which affects when shading will occur. A solar altitude angle that creates shading in November-February may not have major effect on the production due to the lack of global irradiance during these months. 5.1.2ProductionassessmentProduction assessment includes the characteristics of the modules, the expected park power, land area and annual energy yield. The adopted figures for these parameters and the motivations will be explained separately into respective paragraphs. ModulesThe modules chosen for all three cases in this study are standard monocrystalline PV panels consisting of 60 cells. The dimension of the panel is 1.6 x 1 meters and each panel has a module power of 265 Wp. All panels will be standing on height, which means they will be 1 meter wide and 1.6 meter high if they are placed completely vertical. A common concept used when calculating properties for PV modules are the panel yield. This is the effect per area and is calculated by dividing the module power by the area of one module.
0,0020,0040,0060,0080,00
100,00120,00140,00160,00180,00200,00
Glob
alirradiancekW
h/m^2
GlobalirradianceCase3
Minimumvalue Maximumvalue Averagevalue

49
In this study the panel yield is 166 Wp/m2. All properties of the modules are summarized in Table 4.
Table 4 – The module properties used when calculating.
Moduleproperties
Numberofcells 60
Panelsize(m) 1.6x1
Modulepower(W) 265
Panelyield(W/m2) 166
Another aspect to include is that the efficiency of the module decreases with time. In order to include this effect an annual degradation rate of 0.4% is used in the model. This figure was chosen due to that the degradation varied between 0.3-0.5% when it was measured for PV systems in the last decade. (Vartiainen, et al., 2014) ExpectedparkpowerThe park power is in this study chosen to be equal to the economically optimal plant size to get the most out of the direct capital subsidy. The economically optimal park size is an equation depending on CAPEX and the direct capital subsidy, which calculates at what plant size a maximum amount of the direct capital subsidy will be received. When the expected park power is known it is possible to calculate the amount of modules required by dividing the total park power with the power of each module. LandareaLand area refers to the area occupied by the PV modules and thereby the total area of the PV farm. To be aware of the size of this area, the inter-row spacing between the panels have to be known. The inter-row-spacing was calculated according to Figure 6 with a solar altitude angle of 10°, a module tilt angle of 45° and a module length of 1.6 meter. This resulted in an inter-row spacing of 4.7 meters. By this calculation the space needed for each module is known, which means that the required area for each installed Watt can be calculated. In this study it resulted in 28 482 m2/MW. The calculations for this is shown in Appendix 2. If multiplying the calculated number of required size per watt with the total park power, the area occupied by modules will be known. PerformanceratioPerformance ratio (PR) is the relation between the actual and the target yield of a PV system. It measures how effectively a PV installation converts the collected sunlight to AC electricity and depends both on the PV system and on the weather. The value of PR has increased over the years as shown in Figure 23.

50
Figure 23 – The development of the performance ratio since 1992 until 2010. (Reich, et al., 2012, p. 718)
As mentioned, the performance ratio depends on the weather conditions. In a study analyzing the PR of 100 German PV systems it was conducted that the PR increased in systems located in cool climates. Some of these systems could reach as much as 90% or higher. (Reich, et al., 2012) This shows that the PR strongly depends on the climate and leads to the fact that the PR fluctuates with season. These changes could range between -/+10% of PR. In order to include these fluctuations of the PR, a weather-corrected PR could be considered as described in a study of NREL (2013). This PR corrects for the weather conditions correlated to the module temperature. In particular, it corrects for factors as ambient temperature, wind and irradiance. It does not include factors as soiling and snow coverage. This study gives an average value of a weather-corrected PR of 84%. This could be compared to an authentic PR value from the Megawatt farm outside Västerås that had a PR value between 84,3-85,1% for their roof-top based system (no existing data for their market based systems), which indicates that the NREL value could be applicable for Swedish systems. The NREL study further shows an increase of PR by 1.7 percentage on locations with a wind speed of 3 m/s. This is a wind speed that most definitely occur at wind farms. With all this in mind, a PR of 85.7% is used in this study. It is based on the weather-corrected PR on 84 % but is further adjusted with a factor of 1.7 percentage. This since all PV systems are located on wind farms with windy conditions.
AnnualenergyyieldWhen the land area and the total park power is known, the next step is to find out what the potential production and the annual energy yield of the park will be. The potential production is the maximum production of the park during one year, if no losses are included and it is full production at all time. This is calculated by multiplying the total park power with the number of hours in a year. This is then the maximum theoretical energy yield of the system. Maximum production at all time is though not possible, and therefore the annual energy yield is calculated to find the expected production of the system during a year expressed in kWh. The method used to calculate this consists of an equation depending on four variables, which are the total module area, the panel yield, the irradiation on the inclined plane and the performance ratio. By multiplying these variables with each other, the annual energy yield is found.

51
5.1.3RevenuesThe revenues of a centralized PV system consist of the electricity spot price, the direct capital subsidy, the electricity certificate price and guarantees of origin. These can vary greatly from year to year and it is difficult to predict the level of the electricity spot price, electricity certificate prices and the guarantees of origin in the future. ElectricityspotpriceThe forecast of the electricity spot price includes large uncertainties and in this study three scenarios of the future electricity spot price have been used, which includes growth in the price of 1, 3 or 5 % per year. These three cases are based on two different sources that have made some predictions of how the price of electricity could develop in the future. Modity is one of these sources that has made a forecast of the electricity spot price up until year 2023 which indicates on an increase of 2.55% each year. Aspects included in this forecast is the closure of German nuclear power plants, and also the Finnish new nuclear power plant from 2016. The scenario of a 2.55% increase in electricity spot price also considers an increased production of electricity from renewable sources. What the prognosis does not include is any adjustment in the price of emission allowances. If this was included it would most likely results in an even larger annual increase of the electricity spot price. (Bodin, 2013) Another forecast is made by Profu which have stated four possible scenarios where the price of electricity increases by about 1.3-5% annually, depending on choice of scenario, between year 2015 and 2040. Profu consider themselves to have very good knowledge of how the electricity market's long-term development is shaped and what factors that are most important for electricity prices. In their analysis of the future electricity spot price they have, inter alia, considered an increased integration of the European markets and the effect of that the existing power plants fall for the age limit and that new capacity will be added. (Unger, 2014) A combined analysis of these sources formed the basis for the chosen scenarios of 1, 3 and 5 % annual increase of electricity spot price which is used in this study. The sources and predictions of the future electricity spot prices are further assumed to be a general average value for Sweden and do therefore not take into account the different price areas. All three cases investigated in this study are located in price area three which according to historically data from Nordpol spot price indicates to have a price 0.0906% higher than the average (Nord Pool, 2015). This means that the electricity spot price has been multiplied by a factor of 1.000906 each year. ElectricitycertificatepriceThe second part of the revenues is the annual income for electricity certificates. A forecast of this income do also include high uncertainties and could therefore contribute to errors in the results. Aktiefokus (2011) has made a forecast of the electricity certificate prices until year 2035, which consists of a basic scenario and four other possible outcomes. Out of these five scenarios, an average value has been used in the investment model of this study. That results in an annual decrease of about 1.4% between year 2016 and 2021. Thereafter the prices decrease with around 50% between 2021-2022. After this large decrease, a period of 1.5% annual increase of the electricity certificate price will occur until 2035. (Aktiefokus, 2011) In the last period, from year 2035 till 2040, the value equals zero since the current electricity certificate system is only eligible until 2035. DirectcapitalsubsidyThe direct capital subsidy is in Case 1 and 3 planned to be received in year one. However, in Case 2, which is planned to start operating in year 2016, this subsidy is supposed to be received in year two due to the queue times. The long queues existing right now will probably not make it possible

52
to receive the subsidy already in year one since the queues are around 2 years. The direct capital subsidy is further calculated as 30% of CAPEX, with a maximum value of 130 820 Euros. 5.1.4ExpendituresAll expenditures of a centralized PV farm installation have in this study been divided into four categories called CAPEX, OPEX, land lease cost and other cost inputs. Each of these expenditure categories will be presented and explained in more detail below. CAPEXCAPEX is the expenditure of new investments and occurs during the first year of the estimated lifetime of a centralized PV farm. It can be divided into three categories, where the first one is the cost for the modules, the second one is cost of inverter and the third category is called Balance of System (BoS). In this study figures for CAPEX is mostly based on a study conducted by Agora Energiewende (2014), which has summarized all the costs for building a PV farm in 2014. According to the Agora study, the total CAPEX between the categories could be expressed in accordance to Table 5, which indicates that the modules account for the majority of the costs.
Table 5 – Cost of CAPEX.
CAPEX €/kWp
Modules 550
Inverters 110
BoS ~340
TotalCAPEX 1000
The third category called BoS includes costs for infrastructure, grid connection, DC cabling, planning/permitting, transformer, switch gear, mounting structure and lastly installation. It is in BoS that potential cost savings could be made when combining the PV farm with an already existing wind farm. In order to identify in what areas there could exist potential cost savings, the different categories in BoS have been analyzed in more detail. In the Agora study it is assumed that the categories in BoS include the following costs. The subcategory infrastructure includes all the initial cost for preparing the infrastructure to the PV farm. For instance, fencing and road work. The cost is associated with labor cost and is very site-specific. However, there exist a general figure of 40 €/kWp, which has been used in this study. Grid connection refers to the cost needed to connect the inverters to the access point of the distribution grid. It includes the cabling and infrastructure work that is needed. However, what is not included is the transformer and switchgear. These are included in separate subcategories that will be described further on. The grid connection cost is around 60 €/kWp. DC cabling includes mostly costs for material and covers the cost for all the cables that are needed between the modules and the inverter. The cost is around 50 €/kWp. Planning & permitting usually adds up to 35 €/kWp. It includes, inter alia, the cost for receiving a permit as well as other planning and documentation work.

53
Transformer refers to the transformer that needs to be in place to increase the voltage to around 12-36 kV. A general price for a transformer is around 20 €/kWp. The cost for the transformer could vary a lot between different plants depending on the distance to the grid connection point. However, a general price was used since the study only evaluates the possibilities of installing a PV system at a certain location and does not show exact costs if installing the PV system. A switch gear is also required at a PV plant in order to make the transmission of electricity safe, for instance shut off when needed. The cost for the switch gear is around 5 €/kWp. Mounting structure includes the physical parts needed in order to keep the modules in place over the whole lifetime. However, this subcategory does not include the installation of these structures. Installation of structures is included in the subcategory named installation. The cost for mounting structure adds up to 75 €/kWp according to Agora Energiewende and is used in this study. Installation includes the assembly of the mounting structure, the installation of the modules on the mounting structure and last the work necessary to connect the modules to the inverters. The costs in this subcategory is mainly made up by labor cost and is usually around 50 €/kWp. The potential synergies gained when combining a PV farm with an existing wind farm are mainly identified in the subcategories infrastructure and grid connection. When it comes to infrastructure, there will already exist some roads. If a solar farm will be located close to an existing wind farm, infrastructure will already exist. The largest parts that will need to be built are the roads to the PV installations (and perhaps fencing). The cost savings for infrastructure that is assumed in a combination with wind is 37.5 % of the subcategory infrastructure, which results in 25 €/kWp. Further, in the subcategory grid connection the main cost that could be saved is the grid connection fee and some AC cabling that already exist due to the wind turbines. It is assumed that the current agreement between the electricity producer and grid owner could manage an increased transmission of electricity due to that wind and solar power will generate electricity during different times of the day. Thus, the allowed capacity that could be transferred to the grid included in the current agreement will be enough. It is assumed that the cost savings are 50 % of the grid connection costs. This leads to the value 30 €/ kWp. All the different costs used in the model for the BoS is shown in Table 6. The values in brackets show potential savings when combining the solar farm with an existing wind farm.

54
Table 6 – The cost build-up of BoS.
*Total BoS cost with consideration to cost savings through a combination with wind power plant. In addition to the cost presented in Table 6 logging is a cost that has been added by the researchers themselves in Case 1 and Case 3 that are located in areas with vegetation. To be able to build the PV farm the total land lease area needs to be cleared from forest and other vegetation. The total land lease area refers to the area that will be occupied by the modules as well as the area around the farm that needs to be removed to avoid shading effects. The cost for this subcategory was discussed with a consultant, mentioned as Interviewee 3 in this study, who had experience of logging in wind projects. According to Interviewee 3, this logging entails a cost of around 20 000-40 000 SEK/hectare depending on the density of the forest. A quantity quotation of 0.109 € = 1 SEK gives 2 180 - 4 360 €/hectare. In this study a mean value of 3 270 €/hectare has been used to cover the cost for logging. As shown in Table 7, the total CAPEX, without consideration to logging, that has been used in the investment models is 950 €/kW if the investment is made in 2016. This value considers potential cost savings in a combination with wind power plant. The savings have been made in BoS’s subcategories infrastructure and grid connection. This saving adds up to 5 % of total CAPEX.
Table 7 – The CAPEX used in the investment model.
CAPEXestimations €/kWp
Modules 550
Inverters 110
BoS 290
TotalCAPEX 950*
*Logging not included
In order to ensure that these costs are realistic the researchers have been in contact with one person working with PV calculations in the company but in another country. Furthermore, to make sure that the costs are eligible for Swedish installations, there have been discussions with a consultant, called Interviewee 6, which has around 10 years of experience about PV installations in Sweden.
BoSsubcategory Costin€/kWp
Infrastructure 40(25)
Gridconnection 60(30)
DCcabling 50
Planning&permitting 35
Transformer 20
Switchgear 5
Mountingstructure 75
Installation 50
TotalBoScost 290*

55
One aspect to consider when calculating CAPEX of an investment is the investment year. Prices for PV modules will most likely decrease in the future and CAPEX will then be lower if investing in five years from now compared to today. According to Agora Energiewende (2014), CAPEX will decrease by 1.4% per year in a pessimistic scenario and by 3% in an optimistic scenario. Based on this source, an annual decrease of 2.2% is used in calculations in this study, which is the average number of the pessimistic and optimistic scenario. The decrease of CAPEX is included in the cases that have their interment year later than 2016. However, the earlier mentioned anti-dumping duties on imports that was mentioned are not considered as a limiting factor on the cost reduction. This since they would probably be regulated in the future as the market prices decrease. OPEXOPEX is the operating expenditures including mainly maintenance of the system in the case of a centralized PV system. In this study OPEX is estimated to be 10 000 €/MW annually. This value was chosen with basis of the OPEX used in the study PV LCOE in Europe 2014 written by Vartiainen, et al. (2014), but with some reduction made. The study uses a value of 20 000 €/MW for 1 MW PV ground-mounted (as well as for other systems) and 15 000 €/MW for 50 MW ground-mounted systems. The study further describes that the OPEX constantly decreases. Since the study was written in 2014 it was motivated to reduce the value for OPEX. Further, the OPEX varies a lot between different countries. To be able to ensure that the OPEX was eligible for a Swedish PV farm this value was discussed with a consultant, addressed as Interviewee 6 in this study. Interviewee 6 even mentioned that an OPEX value of 10 000 €/MW could be seen as too high for a Swedish PV farm. Further contact was reached to discuss the choice of OPEX. This contact was an employee at Vattenfall that had experience from a PV project in England. The costs that are assumed to be included in OPEX is based mainly on discussions with persons at Vattenfall. Corrective maintenance is one post that is included in OPEX. Corrective maintenance includes the cost that arises if a component needs to be changed, both in terms of labor work and spares. Preventive maintenance is also included, which are commitments made to avoid unnecessary expenses. Further, security is also covered in the OPEX cost. The security work could exist of video surveillance or visits to the park. This is not entirely specified, but some kind of security system is needed. This since ground-mounted systems are very easy to steal, which is proven by the fact that both the park in Arvika and the park in Västerås have been victims of theft. LandleasecostLand lease cost is the cost of getting the right to utilize the land area with the aim of producing electricity from a grid-connected centralized PV system. This cost consists, in this study, of an annual percentage of the production revenues of 3%. To provide the landowner with an annual payment of this type is the most common way of land lease payment for power generation plants. This value was chosen based on discussions with employees at Vattenfall. It is the same value that was used for wind power in its early stages of the technology implementation. The payment should during the entire lifetime of the PV farm give the landowner a value that corresponds to the value of the exploited land. The value of a land area differs depending on the geographical location and the type of land.

56
Table 8 presents approximate costs for three different types of locations and land types used in this study. These figures have been collected from Interviewee 3.
Table 8 – Land lease cost depending on soil types.
Fixedlandleasecost SEK/hectare
ForestsouthernSweden 100000
ForestnorthernSweden 60000
Farmland 200000
OthercostinputsThis category of expenditures includes costs for insurances, replacement of inverters, decommissioning cost, taxes and depreciations. Cost for insurances are calculated as a percentage of CAPEX and is in this study set to be 0.5% of CAPEX. The inverters have shorter lifetime than the PV modules and needs to be replaced after 15 years. This results in a cost year 15 equal to 7% of CAPEX, which is based on a cost reduction development for inverters. The decommissioning costs have been assumed to be equal to the residual value of the PV farms, which results in that this value has no significance for the calculations. The company tax rate used in the study is set to 22%, based on figures from Skatteverket, as describe in chapter 3.2.1The depreciations have been calculated with a higher pace in the beginning of the lifetime. This accelerated method of depreciations has been used since it gives tax benefits. 5.1.5WACC&inflationrateThe WACC rate used in the model is based on a real WACC of 5%. This real WACC was chosen since it was used in a report called PV LCOE in Europe (2014). The WACC was suitable for this study since it is not specific to any company. Normally the WACC could differ between companies and a rate of 5% could be seen as an average value; the rate could be lower for municipalities since they could have more beneficial loans, but could also be higher in companies with increased requirements on return. In addition, the WACC reflects the risk of an investment and sometimes a rate of 5% could be considered as low. However, it could be seen as high for PV systems for domestic production. In order to include the inflation in the model the nominal WACC was calculated with the Fisher equation (Equation 5). The nominal WACC was then used in the model when calculating. An inflation rate of 2% was used. This since it is a value that the Swedish National Bank is aiming for. Lastly, to be able to consider the impact WACC has on the investment it is included in the sensitivity analysis. This will provide an analysis of the risk that the investment will have. 5.2SensitivityanalysisA sensitivity analysis is included to be able to find out what key factors that influences the profitability, and to what extent changes in each key factor affect the result. The sensitivity analysis is based on seven factors which all have a tendency to deviate from the value set as a basic figure in the investment calculation. The factors used are changes in production, CAPEX, OPEX, electricity spot price scenario, lack of investment support, land lease and WACC. This sensitivity analysis is based on changes in NPV, due to that changes in all seven factors have an impact on this result.

57
The production does mainly consist of properties of the modules, the performance ratio and the insolation. There are thus several factors that can contribute to changes in the production, and in the sensitivity analysis of this study a change of -/+ 10% has been analyzed. The same interval of -/+10% has also been used when analyzing the sensitivity of CAPEX and OPEX. Three scenarios of possible future outcomes of the electricity spot price have been used in the study, as mentioned earlier. The average scenario with an annual increase of 3% has been used as the base scenario in the sensitivity analysis. The direct capital subsidy is included in the sensitivity analysis to be able to see the impact of the result if no direct capital subsidy would be received. Note that this parameter is not varied in percentage as earlier parameters, the situation is rather that the investment gets full support or none at all. The last two factors, land lease and WACC, are analyzed with a change of -/+ 2 in percentages. This due to that both parameters vary within a range of about 4-5% in comparable situations and investments. The average value for both land lease and WACC has been used as the base scenario of this study. The sensitivity analysis will, in the results chapter, be presented as a graph showing the change in NPV for all the seven factors. The changes for each factor are presented as bars in the graph which will give a clear picture of the sensitivity of each factor and shows the relation between them.

58

59
6. Results and analysis In this section the result of the study will be presented in combination with an analysis, and it will be divided into four areas based on the four sub research questions. Firstly, results gained for how the PV industry has developed and where it is heading will be described. Secondly, the output from the investment models for the three cases will be presented and will show results for how profitable grid-connected centralized PV systems are in Sweden. Thirdly, the outcome of the sensitivity analysis will show which the key parameters influencing the profitability are. Lastly, the main challenges that has been identified in this study will be brought up. 6.1RQ1:HowhasthePVindustrybeendevelopedduringthepastdecadesandwhereisitheading?For this sub research question, results for how the PV industry has been developed in terms of installed capacity and the division between the different subsystems will first be presented. The development of the different types of PV technologies will further be included. Then the results gained for where the industry is heading will lastly be presented. When looking at the installed capacity of PV overall it can be seen that it has increased a lot during the last two decades, especially the past few years. It is also shown that the division between the four different subsystems has changed over time. In 1992 the major subsystem was off-grid domestic (73%), whereas in 2014 the largest part was made up by grid-connected distributed systems (83%). When it comes to grid-connected centralized PV system it did not have a share of the installed capacity until later. In year 2014 its share was 5%. In Sweden there exist two large PV farms of around 1 MW each, one in Arvika and one outside Västerås. The PV technologies that are used vary depending on application area. According to Interviewee 1, the PV technology that is most used in Sweden when it comes to larger installations is crystalline Si cells. Further, monocrystalline cells are chosen in favor of polycrystalline due to higher efficiency (13-20% compared to 13-16%). One technology that has had a fast growing efficiency curve during the last years is the thin-film cell. However, this technology is more suitable in building material rather than PV farms, according to Interviewee 1. This mainly due to that thin-film still has lower efficiency than monocrystalline (7-13% compared to 13-20%). In addition, the largest advantage of the thin-film cell is the thickness of the cells, which is an attribute that is not desirable in PV farms but in architecture. Hence, the thin-film cells are better suited for building integrations than in PV farms. These results about different PV technologies laid the foundation to use monocrystalline Si cells in the investment models. When it comes to where the development of the PV industry is heading in the future the result differs. Most of the interviewees believed that the grid-connected centralized systems will not increase that much in the future. They meant that Sweden has a lot of unused rooftop areas that could be used for PV installations. Further, some of them also meant that PV installations will consist more of distributed systems, where the costumers become prosumers (both producers and consumers). They argue that this is due to the fact that own produced electricity would be more cost beneficial for the consumer and that the losses would be smaller if the electricity is not transmitted far distances. On the other hand, the number of grid-connected centralized systems has in fact increased during the last years and it will soon be built a large PV farm in Varberg, which then will become the largest in Sweden. Hence, these new installations of grid-connected centralized systems could imply something different than what the interviewees of this study argue for. Furthermore, a Fraunhofer Institue analysis concludes that solar power will be cheaper than conventional systems in the future, reaching a cost of 2-4 euro ct/kWh in 2050.

60
6.2RQ2:Howprofitableisittoinvestingrid-connectedcentralizedPVfarmsinSweden?The profitability of a grid-connected centralized PV farm is in this study presented in terms of NPV, IRR, discounted payback period and LCOEadjusted. A graph showing revenues, expenditures and the accumulated discounted cash flow will be presented for each case and the results are divided into three separate graphs depending on the different scenarios of the electricity spot price. Each case is presented one by one, and lastly a concluding result of the question will be presented. 6.2.1ProfitabilityofCase1Case 1 is located at the east side of Vättern and will be combined with a wind farm that is planned to start operating in year 2021. The investment subsidy is expected to be received in year one, due to that shorter waiting times are expected this year and the possibility to apply for the support far in advance of the construction work. The annual energy yield of this park in the first year, before degradation, is calculated to be 486 MWh which results in 957 MWh/MW. Figure 24 presents the results of investing in Case 1, and as the black line shows, this case will have a payback time shorter than the estimated lifetime of the farm in only one out of three scenarios. As the figure displays, the investment appears as a large expenditure during the first year and the green bar in the first year represents the investment subsidy. In year 15 the cash flow decreases due to replacement of all inverters.
Figure 24 – The results for Case 1 including the three different scenarios for the electricity spot price.

61
To better see if an investment in Case 1 would be profitable or not, Table 9 has been constructed showing the value of NPV, IRR, discounted payback time, LCOEadjusted and LCOEneutral. This table shows that a positive value of NPV will appear only for Scenario 5%, while the scenarios of 1% and 3% increase in electricity spot price will both result in a negative NPV for an investment in Case 1. The IRR is greater than WACC for Scenario 5% and equal to it in Scenario 3%. The discounted payback periods are quite long and as mentioned earlier one scenario, Scenario 5%, shows a payback period shorter than the expected lifetime of the PV farm. Two values that does not change between the three scenarios is the LCOEadjusted and LCOEneutral. These parameters do not consider revenues and will therefore result in a constant figure for all three scenarios.
Table 9 – The value for NPV, IRR, the payback period, LCOEadjusted and LCOEneutral in Case 1.
NPV(€) IRR(%)Paybackperiod
(years)LCOEadjusted(€/MWh)
LCOEneutral(€/MWh)
Scenario1% -41750 5.1 >25 80 102
Scenario3% -426 7.0 >25 80 102
Scenario5% 54043 8.9 20 80 102
6.2.2ProfitabilityofCase2The second case is a PV farm implemented in combination with an already existing wind farm located on the west coast. This PV farm is therefore planned to be built in year 2016. The investment subsidy is planned to be received in year two due to the queues existing today, and the annual energy yield, excluding degradation, will be 429 MWh or in other terms 933 MWh/MW. In Figure 25 the annual costs and revenues during 25 years are presented for the three different scenarios of the future development of the electricity spot price. If looking at the black line, representing the accumulated discounted cash flow, it shows that investments in this case only will be profitable if the electricity spot price will have an annual increase of 5% and even then the margins of reaching profitability are low.

62
Figure 25 – The results for Case 2 including the three different scenarios of the electricity spot price.
Table 10 presents the value of NPV, IRR, discounted payback period, LCOEadjusted and LCOEneutral for Case 2 in the three different scenarios. An analysis of this result shows that the investment only has a positive NPV in Scenario 5%. This is also the only scenario which results in a value of IRR higher than WACC and a payback period equal to estimated lifetime of the farm. The LCOEadjusted and LCOEneutral values are almost constant in the three scenarios, due to that this value does not include any revenues.
Table 10 – The values for NPV, IRR, the payback period, LCOEadjusted and LCOEneutral in Case 2.
NPV(€) IRR(%)
Paybackperiod(years)
LCOEadjusted(€/MWh)
LCOEneutral(€/MWh)
Scenario1% -81931 3.3 >25 91 115
Scenario3% -47086 5.2 >25 91 115
Scenario5% 2546 7.1 25 92 115

63
6.2.3ProfitabilityofCase3The last case, Case 3, is located on the west side of Vättern and is planned to have its first operating year in 2019. This is the year when the combined wind farm is planned to start operating. The PV farm will have an annual energy yield of 445 MWh and will produce 916 MWh/MW. The investment subsidy is planned to be received in year one, and the investment, CAPEX, is presented as a red bar during the first year. As shown in Figure 26, this case is quite similar to Case 1 in the sense that Scenario 5% result in an accumulated discounted cash flow that crosses the x-axis within the time period of 25 years, while Scenario 1% never reaches a positive value of the accumulated discounted cash flow.
Figure 26 – The results for Case 3 including the three different scenarios of the electricity spot price.
Table 11 summarizes the results for Case 3 and presents that LCOEadjusted has a value of 84-85 €/MWh and LCOEneutral has a value of 109 €/MWh for all three scenarios. NPV results in positive figures for Scenario 5%, while Scenario 1% and 3% result in negative NPV values. Scenario 1% and Scenario 3% give an IRR lower than WACC and a payback period longer than the expected lifetime of the PV farm which results in a non-profitable scenario. However, Scenario 5% results in IRR higher than WACC and payback times shorter than the expected lifetime.

64
Table 11 – The value for NPV, IRR, the payback period, LCOEadjusted and LCOEneutral in Case 3.
NPV(€) IRR(%)Paybackperiod
(years)LCOEadjusted(€/MWh)
LCOEneutral(€/MWh)
Scenario1% -56059 4.4 >25 84 109
Scenario3% -18711 6.3 >25 85 109
Scenario5% 30366 8.0 22 85 109
6.2.4ProfitabilityinsouthernSwedenIf summarizing the three cases, which are all located in southern Sweden, it shows that profitability can be reached in this part of Sweden if the electricity spot price turns out to be like Scenario 5%. However, if the electricity spot price only will have an annual increase of 1% or 3% it might be difficult to find a profitable case for grid-connected centralized PV farms in southern Sweden. LCOEadjusted results in a value of about 80-92 €/MWh, which indicates at what level the electricity spot price, including electricity certificates, needs to be to cover all the expenditures. However, this value has included the direct capital support which means that a lack of this support requires an even higher price of electricity than presented in these figures. Compared to Energikommissionen’s (2016) estimations of a LCOEneutral of about 101 €/MWh for PV farms, the calculated values of LCOEneutral in this study are higher for all the three cases. Case 1 results in a LCOEneutral of 102 €/MWh, while Case 2 and Case 3 indicates a LCOEneutral 115 €/MWh and 109 €/MWh respectively. The value in Case 1 is thereby quite similar to the one estimated by Energikommissionen, while Case 2 and Case 3 are higher. By analyzing the results from the three cases, it is shown that the best figures are received in cases where the investment is made a few years into the future, when CAPEX has decreased and when the electricity spot price probably has increased. Best profitability will therefore be received in Case 1 that is planned to be built in year 2021. Table 12 presents a summary of all cases and all scenarios, and indicates if an investment should be made or not with consideration to profitability. The red boxes indicate a non-profitable case, while the green boxes indicate cases where profitable could be reached. If the box is yellow, the value is just on the verge of being profitable or not. LCOEadjusted will get a green box if the electricity spot price during the 25 years’ period exceeds the value of LCOEadjusted. What can be stated from this table is that there exist more non-profitable scenarios than profitable scenarios in this study.

65
Table 12 – Results of profitability in the three cases with different scenarios.
Scenario1% Scenario3% Scenario5%
Case1
NPV -41750 -426 54043
IRR 5.1 7.0 8.9
Discountedpaybackperiod
>25 >25 20
LCOEadjusted 80 80 80
Case2
NPV -81931 -47086 2546
IRR 3.3 5.2 7.1
Discountedpaybackperiod
>25 >25 25
LCOEadjusted 91 91 92
Case3
NPV -56059 -18711 30366
IRR 4.4 6.3 8.0
Discountedpaybackperiod
>25 >25 22
LCOEadjusted 84 85 85
The cases have also been adapted to have an optimal park size with respect to the upper cost limit for the direct capital subsidy. The cases investigated in this study turn out to have optimal park sizes at 508kWp, 460kWp and 486kWp for Case 1, Case 2 and Case 3 respectively. At these park sizes the maximum direct capital subsidy will be received. If building larger farms than the calculated optimal size, the investment support will still be at the same level which means that the cost per installed MW will be higher. This gives that if the size would exceed the optimal park size, profitability would be even harder to reach. 6.3RQ3:Whicharethekeyfactorsinfluencingtheprofitability?To find out what key factors that influenced the profitability, and to what extent they could affect the result, a sensitivity analysis was made for Case 1, Case 2 and Case 3. The sensitivity analysis is based on changes in the NPV. The factors that can fluctuate to any larger extent and which are chosen to be included in the sensitivity analysis are the annual production, CAPEX, OPEX, the different forecasts of the electricity spot price, the lack of direct capital subsidy, land lease and WACC. The sensitivity of these factors has been tested in a sensitivity analysis for all three cases, and the base scenario is assumed to be the electricity spot price scenario of 3% annual increase. Figure 27 shows the sensitivity analysis for Case 1, which displays that a lack of direct capital subsidy is the factor that affects the results the most. WACC is the factor with the second highest sensitivity and can affect the result both positive and negative. Changes is production, CAPEX
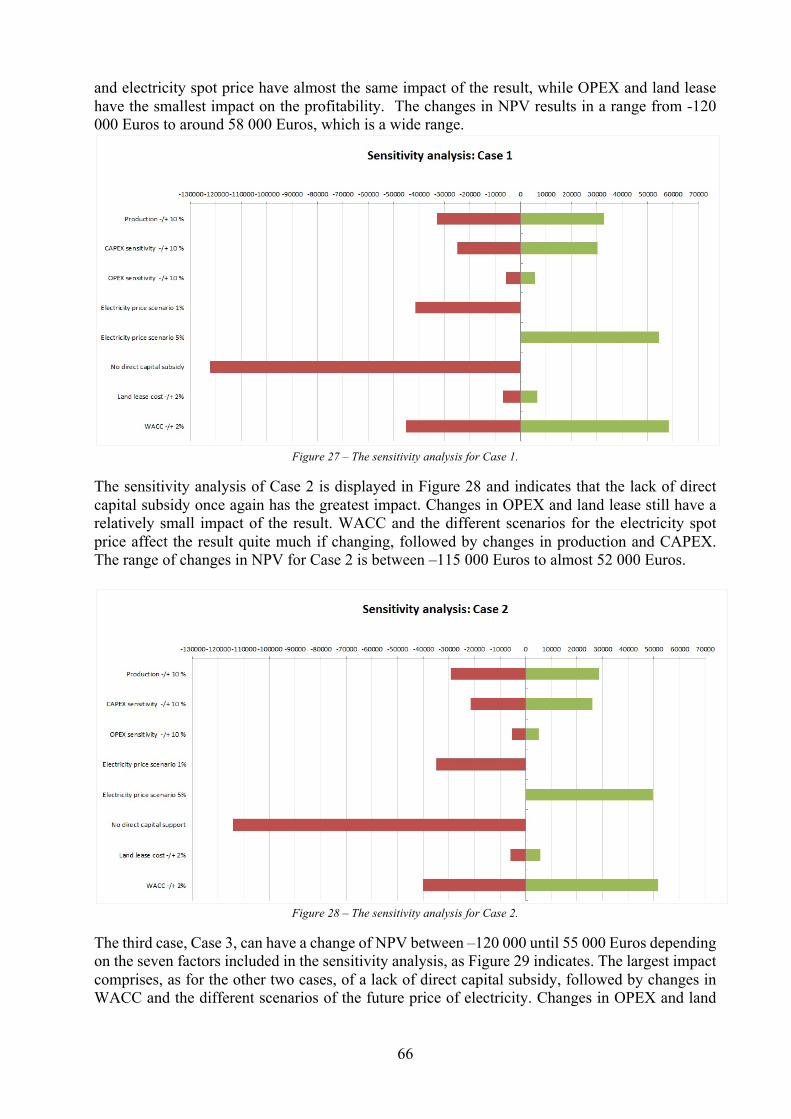
66
and electricity spot price have almost the same impact of the result, while OPEX and land lease have the smallest impact on the profitability. The changes in NPV results in a range from -120 000 Euros to around 58 000 Euros, which is a wide range.
Figure 27 – The sensitivity analysis for Case 1.
The sensitivity analysis of Case 2 is displayed in Figure 28 and indicates that the lack of direct capital subsidy once again has the greatest impact. Changes in OPEX and land lease still have a relatively small impact of the result. WACC and the different scenarios for the electricity spot price affect the result quite much if changing, followed by changes in production and CAPEX. The range of changes in NPV for Case 2 is between –115 000 Euros to almost 52 000 Euros.
Figure 28 – The sensitivity analysis for Case 2.
The third case, Case 3, can have a change of NPV between –120 000 until 55 000 Euros depending on the seven factors included in the sensitivity analysis, as Figure 29 indicates. The largest impact comprises, as for the other two cases, of a lack of direct capital subsidy, followed by changes in WACC and the different scenarios of the future price of electricity. Changes in OPEX and land

67
lease have as in the other two cases a relatively small impact of the result compared to the other factors included in the sensitivity analysis.
Figure 29 – The sensitivity analysis for Case 3.
The sensitivity analysis of the three cases indicates that the key factor influencing the results the most is by far a lack of direct capital subsidy. This factor is followed by four other factors which also can be called key factors, and these are WACC, the production, CAPEX and the different scenarios of the future electricity spot price. Changes in OPEX and land lease also affect the result, but to less extent than the other factors and will therefore not be identified as key factors in this study. As shown in Figure 27, 28 and 29 changes in production has great impact of the profitability compared to some of the other factors, and since the production partly depends on the insolation, the location for a PV farm is very important to be able to make a good investment. CAPEX also has great impact in all three cases, and changes in CAPEX mostly depends on the installation year because of the decreasing prices. The lack of direct capital subsidy affects the result to a very large extent in all three cases, which indicates that this support is very important for investments in grid-connected centralized PV farms. The two factor that affects the results the most after the lack of direct capital subsidy, if changing, is WACC and the electricity spot price, but changes in these two factors are difficult to control. 6.4RQ4:WhatwillbethemainchallengesinthenearfutureconsideringthedevelopmentofthePVindustry?The main challenges for the development of the PV industry can be analyzed from different perspectives. The main aspects to consider are the technological aspects and the economical aspects. Therefore, the result for the fourth sub research question will be presented with consideration to technological and economical aspects. Nevertheless, some additional aspects will shortly be concerned in the end of the section. The challenges will be analyzed with the basis in Hughes theory about reverse salient, salient and critical problem. First the reverse salient and salient will be considered and then the chapter will end with the critical problem. One reverse salient that has been identified is the grid capacity. There lays a challenge in how the grid will handle an increased amount of intermittent energy. This could be seen as a reverse salient since it is lagging behind the current efficiency and current cost development of PV cells. Today the PV cells have reached a higher efficiency which makes them beneficial for locations with lower

68
insolation and the cost for the PV cells is constantly decreasing. These two factors could therefore be seen as salient. Regarding the electricity grid, investments will be required at some level or before the hoisting capacity has been reached to be able to handle a larger amount of RES. The development of smart grids is thus highly relevant if the grid should be able to handle an increased share of RES. This since it could integrate the consumers’ behavior and make the use of electricity more efficient both in economical and sustainable terms. Smart grids will be a solution for making the supply of electricity more reliable. Perhaps the situations when shortfall occurs, as described in the study of Söder, smart grids could be part of the solution. This since smart grids could help to include the consumers’ behavior in the system, which is the solution to this problem described by Söder. Furthermore, another reverse salient is how to balance the power system so that the same amount of consumed electricity is supplied by the electricity producers to the grid. The study conducted by Söder (2013) investigates this phenomenon and shows that an increased amount of intermittent energy puts higher demand on regulating power. The balance of production and consumption correlates to the fact that the power system has to be reliable even if a larger share of RES is included. The simulations carried out by Söder indicates that it is possible to increase the share of intermittent sources in the power system and still be able to handle the power balance. In his last example, including an introduction of 55 TWh of wind and solar power and where nuclear power is totally deprecated, the power balance is almost entirely maintained except for some hours when the production of wind and solar energy is extraordinary high or low. However, further studies have to be made in this topic. For instance, in order to simulate other constituents of RES in the power system and also in order to see if hydropower is able to regulate its production with such high pace as required. Moreover, another reverse salient is the financial support policy due to many reasons. Firstly, due to that there lays a huge uncertainty in the financial support policy. Both considering the direct capital subsidy and the electricity certificate system, where the direct capital subsidy could decrease or be phased out and the electricity certificate system could be phased out. Without the financial support policy, grid-connected centralized PV is not profitable if they are installed today or in the next coming years. Secondly, due to that the application process for the direct capital subsidy is not efficient since the queues are very long. Another possible limiting factor regarding the electricity certificate system is that demand and supply of certificates is regulated manually. This could hinder the growth of RES, since if the share would rise very quickly the quota levels would be too low which would result in low certificate prices. One additional challenge that ought to be considered is the current mapping of insolation carried out by SMHI. The current mapping has low quality, which leads to uncertainty when making investments. In other words, this could be seen as an additional reverse salient since it could hinder investments in PV farms due to unreliability in insolation. Figure 30 illustrates and summarizes the identified reverse salient and salient in the PV industry.

69
Figure 30 – Illustrating the reverse salients and salients in the PV industry.
To summarize, the critical problems, which solutions could favor the development of the PV industry in Sweden, are to invest in the grid so it could handle an increased amount of RES. Moreover, further research has to be made on how to balance an RES power system and the financial support policy needs to be developed in order to decrease uncertainty and increase flexibility in the system. Also, more detailed data on insolation ought to be mapped in order to increase the certainty in investments.

70

71
7. Discussion This chapter includes a discussion on the results and analysis presented earlier. It is divided into two sections, where the first section is structured in accordance to the sub research questions as the result and analysis chapter. The second chapter includes additional areas of discussion that could not be directly tied to a specific research question. 7.1DiscussionwithregardstothesubresearchquestionsThe first sub research question of this study includes how the PV industry has been developed and where it is heading. It is always hard to predict the future and regarding the PV industry it is perhaps even harder since there lays a great number of uncertainties in many factors. Several of the interviewees mentioned that they believed that the largest increase of PV systems will be noticed in distributed systems rather than centralized systems. This study focuses only on grid-connected centralized systems, but to be able to fully answer this first sub research question, the potential for these other systems ought to be analyzed as well. Perhaps other systems, such as distributed systems, have such great potential that it could outweigh the development of grid-connected centralized system in the long run. For instance, if the interviewees’ beliefs will become reality, where distributed systems will have the main production of solar energy, it will affect the need of power from centralized systems and thus the future of grid-connected centralized systems. In short, to justify the answer to this sub research question all other systems ought to be investigated to the same extent as grid-connected centralized systems are in this study. When it comes to the second sub research question that includes the profitability of centralized PV farms, the result shows that there exist places in the south of Sweden where it is profitable to utilize solar energy. However, it depends on how profitability is defined. When saying that the cases are profitable in this study, it is based on that IRR is larger than WACC and further that the value of NPV is positive. Nevertheless, it lays great uncertainty for Swedish investors when it comes to PV farms and then it could be discussed if these cases really are seen as profitable. As described earlier in chapter 3, a higher IRR could be required in order to avoid pitfalls when uncertainties could make investments non-profitable. On the other hand, it could be discussed if pilot projects really have to be profitable for large utility company in the beginning. Perhaps they could accept non-profitable projects in the beginning as long as future projects will be profitable. New projects could be an opportunity to collect knowledge about the technology and how projects should be formed, rather than contribute to revenues. Another possibility could be that utility companies start projects by reaching out to land owners and close permit agreements, but without continuing the project any further. Then they will be prepared if grid-connected centralized systems will become more profitable in the future. The previous discussed uncertainties mainly find expression in the unreliable future of the electricity spot price and the support policy. It should be observed that the current design of the direct capital subsidy program will probably not be valid for as long time as the investment models estimate. Since there are no clear directions on how the system will look in the future it was calculated with the current direct capital program. To include this uncertainty, the direct capital subsidy was part of the sensitivity analysis. When looking at the bars in the sensitivity analysis for all cases it is shown that the direct capital subsidy has large impact if no subsidy would be received at all. However, this will probably not be the case in the near future. When looking at the direct capital subsidy program historically, it is seen that the cost coverage in percentage has been lowered since the introduction with a diminishing reduction; from a 10 percentage decrease between 2011 to 2012 as well as 2012 to 2013, but between 2014 and 2015 the decrease was only 5 percentages. Hence, the program will not be removed at once, it will rather be a slow phase-out. Assume that a reduction of 5 percentages annually will continue, the current direct capital subsidy

72
that has a cost coverage of 30% will be non-existent in year 2022. And note further that all cases in this study are planned to be installed before this year (latest 2021). In other words, the capital subsidy will probably not be entirely removed before the installations that are considered in this study, rather the cost coverage will be lower. There is a strong argument in favor of future PV installations in Sweden and that is the CAPEX development. Many reports predict a rapid reduction of CAPEX in the future. In this study a decrease of 2.2% annually was used, which is considerable fast and the benefits that this will bring on the profitability is important to consider in investments. The impact of the CAPEX development is strongly evident when looking at the three cases; when looking at the NPV value, Case 2 that is installed in 2016 is far from being profitable while the other cases that are installed later are closer to being profitable. CAPEX was also identified as one of the key factors influencing the profitability that was identified in the sensitivity analyses. However, what could hinder the fast development of CAPEX is the anti-dumping duties on imports of solar panels. It should be noted that the CAPEX development used in the investment models is without regards to the anti-dumping duties. However, these anti-dumping duties will probably decrease in the future as European manufacturers could reduce the prices for their manufactured modules. As mentioned earlier, CAPEX is one of the key factors identified and therefore it is part of answering the third sub research question. In addition to CAPEX the production is another identified key factor. By this, it can be concluded that the choice of location is important, since the insolation affects the production to a large extent. Sweden has locations with good insolation, but these areas can be seen as quite limited and will mostly be found on the coast of southern Sweden, the islands Öland and Gotland and also in areas around the big lakes Vättern and Vänern. As Sweden is a very elongated country, the climate can differ a lot from different locations in the country. This contributes to the fact that it is difficult to answer a question about if grid-connected centralized PV systems are profitable in Sweden or not. It might be profitable in southern Sweden, but not in the north. Considering the fourth sub research question, including the main challenges of the PV industry in the future, one of the reverse salients that has been identified is the financial support policy. There lays a great uncertainty for investors due to that they do not know how the future support policy will be designed. One system that could make the uncertainty decrease for investors is PPA’s. Perhaps municipalities could agree with investors to purchase all the produced electricity. Then the investors would know what their incomes will be, i.e. a certain amount per every produced kWh. This will also reduce the uncertainty for investors regarding the future of the electricity spot price. Some types of PPA’s are already existing in Sweden for grid-connected centralized systems, e.g. the Megawatt Park in Västerås where Mälarenergi agreed to buy all the produced electricity for 15 years. What can motivate municipalities or other governmental entities to purchase the electricity is that consumers desire solar power. Another motivating factor could be that it helps to achieve the long term target that the Swedish government has of having an energy system that is 100% based on RES. Regarding the financial support policy, it should be noted that only the direct capital subsidy system and the electricity certificates were included in the model. The guarantees of origin were not included since they are not that frequently used and it is also very unclear how much revenue these will give. The price is set between seller and buyer, which leads to that the price varies a lot between different agreements. The guarantees of origin are therefore not included, but could be seen as an additional benefit that is not taken into consideration. Speaking about uncertainty, the forecasts of the electricity spot price includes a lot of different factors creating uncertainties for the future electricity spot price. One thing that is not included in the forecasts used in this study is the debate about nuclear power plants in Sweden, which Söder

73
brings up as one of the factor that could affect the electricity spot price. The fact that nuclear reactors were shut down in 2015 and that more nuclear reactors will be shut down is not considered in the two forecasts that have been used in this report. It should be noted that similar fast changes are hard to predict and are perhaps even harder in today’s fast changing energy market. So, it does not only exist uncertainties in the financial support policy, it also exists (perhaps extraordinarily) uncertainties in the future electricity spot price. 7.2AdditionalareasofdiscussionWhat should be noted is that the size of the parks is based on optimal park size (around 500 kW), which is the size that is most beneficial with consideration to the current direct capital subsidy program. These sizes are fairly small seen from the perspective of a large utility company, such as Vattenfall. Larger utility companies tend to invest in few but larger parks and not the other way around. In the future larger installations will probably be considered by utility companies and to include this aspect, the study has briefly investigated if there are any large scale effects in PV projects. It has been identified such benefits in collected research for utility companies. The study by NREL identifies that the scale effects are most apparent in a size expansion of 5 MW to 20 MW. These sizes could be considered as very large installations if comparing with what is investigated in this study. Nevertheless, in the future when knowledge about PV projects has been gained within Vattenfall these sizes could be realistic and then the large scale effects will be important in investments. However, the study that has investigated economies of scale is looking at US systems. It can therefore be discussed if this will be the case for Swedish systems. Perhaps it is not directly applicable, but it at least indicates that these effects could be achieved for Swedish systems. Further, an area of discussion is the safety of a PV farm. Both Mega-Sol in Arvika and the Megawatt Park in Västerås have had problems with theft of their PV modules. This mostly refers to fixed mounted modules since these are easier to steal due to that they are installed at a relatively low height and they have easier mounting structures. The possession of a security system will therefore be essential for a PV farm to avoid thefts of modules. This might be a great concern for the owners of a PV farm who have invested large capital in their farm. Especially, it will be important aspects if the budget is tight to be able to make a profitable investment. An advantage of placing PV farms in Sweden could be that the insolation is relatively good in southern Sweden at the same time as the temperature is quite low. This due to the fact that high insolation is required to be able to produce electricity from PV modules at the same time as the efficiency is lowered with increasing cell temperatures. An increasing cell temperature of one degree contributes to 0.45% losses in efficiency. High insolation in combination with low temperatures would therefore benefit PV farms. If combining the PV farms with wind farms, the cell temperatures could decrease even more due to the windy location. Locations with high insolation also often coincides with location with great wind conditions, at least if concentrating the analysis to southern Sweden. This study only consists of an analysis of grid-connected centralized systems, thus no other types of PV installations are included to any larger extent. The results thereby show the possibilities of investing in grid-connected centralized PV farms, but not in relation to for example grid-connected distributed PV systems. Many argues that Sweden has a lot of roof-tops pointed at south with optimal inclination angle, which therefore would be optimal for PV installations. Further they argue that roof-tops would be the place for PV installation, since this type is both more profitable and it does not require a large share of land area that could be used for something else. Instead of felling trees to be able to create an area optimal for PV farms, it might be better to place them on roof-tops. Grid-connected distributed PV systems might though be a better solution for making

74
solar energy a larger part of the electricity production system. If implementing PV modules at a large amount of roof-tops, including on facilities such as industries and office buildings, and connecting these systems to the grid, this could be a more profitable solution that might be able to generate a quite large amount of electricity if implemented to a larger extent. An outcome of this would then be that even though there would be possibilities for grid-connected centralized PV farms in Sweden, it might not be the best possible solution. A final discussion area is the investment model used in this study, which affect the trustworthiness of the study. The investment model is newly made and therefore it could still exist some undetected sources. Further, the insolation used in the model is on annual basis, which could lead to that the revenues are overestimated. This since the electricity spot price is normally lower during summer time when the production is very high for solar energy. When calculating on an average annual basis this could lead to misleading results. So, a monthly basis would perhaps give more trustworthy results. Then further discussion could be made on the choice of parameters in the model. Some parameters have already been discussed, but what has not been brought up earlier are the assumptions made for the PR value and the potential cost savings when combining PV plants with wind power plants. Firstly, regarding the choice of the PR value it was developed based on a study that had compiled the PR value for 100 German PV farms. This value was further increased due to the placement on a windy location. What is not considered in the PR value is soiling and snow coverage. Since there could occur periods where the modules are covered in snow in Sweden, snow coverage is a factor that could decrease the production significantly. However, the chosen PR value was compared to the Megawatt Park, which had a similar PR value and included soiling and snow coverage since it was an authentic value. The choice of the PR value could be made more trustworthy. For instance, further consideration could be taken to the different case locations. The PR value could also be made more reliable by using other methods as comparison tools, e.g. computer software or through calculations. It could also be discussed how much effect the wind really has on ground level, perhaps it does not blow as much on low heights. Secondly, there is the choice for cost savings in a potential combination with wind power plants. These cost savings were set in the category infrastructure, including savings for road work, grid connection fee and AC cabling. These savings were estimated by the researchers of this report and if they would exist in reality is not that investigated. There have though been interactions with a consultant involved in a project that calculated on cost savings in a combination of wind and solar plants, but if that will be the case in the end, when the project is finished, is not certain.

75
8. Conclusions and suggestions for further research In this last chapter the main conclusions will be presented. The results, analysis and discussion have been built up around the sub research questions. Based on these, this last chapter will summarize the earlier findings through presenting the main conclusions that have been drawn regarding the general research question. The section will lastly close with suggestions for further research. 8.1ConclusionsThe purpose of this study was to identify the potential for grid-connected centralized PV systems for large scale production in Sweden. To be able to achieve this purpose, the general research question What are the possibilities to utilize solar energy for electricity production generated by grid-connected centralized PV farms in Sweden? was formulated. Further, sub research questions were stated in order to help reaching the following main conclusions for the general research question. The main conclusions are based on the findings during this study and the results from the three cases are not extraordinary and can therefore be generalized for other cases with similar insolation. The conclusions are summarized in bullet points presented below.
• According to the assumptions made in this study, grid-connected centralized PV systems are not profitable today with an electricity spot price development lower than an annual increase of 5%.
• The uncertainties are too large to invest in grid-connected centralized PV farms today. These uncertainties are mainly:
o The future development of the direct capital subsidy o The electricity spot price o The future development of CAPEX in Europe, considering the anti-dumping duties
• There exist possibilities for utilizing PV for electricity production in southern Sweden with respect to the insolation and the ambient temperature.
• The PV industry is growing and the interest for solar PV is growing, which increases the possibilities for future PV installations.
• Cost savings can be achieved by combining centralized PV farms with existing wind farms.
Based on the stated conclusions, it will be difficult to make profitable investments in grid-connected centralized PV farms today and in the next few years, due to that an increase in electricity spot price of 5% annually from today and 25 years ahead will most likely not be the case. What can be seen is though that the potential to reach profitable investments increases in the future, and it could therefore be interesting for electricity production companies to invest in centralized PV systems later on. Investments in knowledge about this industry would therefore be advisable to include in organizations like Vattenfall and also to create larger portfolios with potential projects for PV farms to be able to invest in a centralized PV farm when it reaches a profitable stage. The focus regarding the PV industry in Sweden should today and in the near future, based on this study, be on grid-connected distributed PV systems. These systems demonstrate greater possibilities for profitable investments, and the investment for each system is much smaller. The insolation in southern Sweden in combination with the expected reduction of module prices and increased electricity spot prices, are parameters that indicates a possible future for grid-

76
connected centralized PV systems, even though it is quite uncertain. If a reliable financial support policy with a long-term focus also would be developed, it would support investment decision even further. The Swedish market is just not quite there yet! 8.2SuggestionsforfurtherresearchThe investigation made in this study is mainly based on three cases located in southern Sweden, and to generalize this study further, more cases would be included to create a more solid portfolio of potential PV farm installations in Sweden. To get even more specific figures and results for each potential investment, a deeper investigation of each case and location should be made. The study now contains some general figures that can be modified if looking more specific into one case. Solar energy is an intermittent energy source, and to be able to make this source more reliable for electricity production, storage systems could be investigated. Electricity from the sun will mostly be produced during the day and particularly during sunny days, when the consumption might be relatively low. An area of further research could therefore be to investigate the possibilities of storage for grid-connected centralized PV systems. It would be interesting to know what type of storage that could suit this type of production, if the technology exists and what role storage will have for PV farms in the future. Batteries are still quite expensive, but maybe this could be a technology that can be supported by capital subsidies or maybe the cost for batteries will decrease drastically in the near future and thereby make it possible to include storage solutions in PV installations to a larger extent than today. The investment model that has been used when analyzing the profitability is based on an annual basis, which could have led to overestimated results. Therefore, a suggestion for further research could be to analyze the profitability of grid-connected centralized PV systems on a monthly basis. During the study, the researchers have also found a challenge with the energy balance in the Swedish energy system. A suggestion for further research could therefore be to analyze how the division of different energy sources should look like in Sweden to get an optimal system. If investing in PV farms to a larger extent, it would be investigated how much solar energy that could be included in the Swedish energy system. If electricity production companies, such as Vattenfall, will decide to invest in grid-connected centralized PV farms for large scale production of electricity, each farm would probably need to be larger than the sizes calculated for in the three cases of this study. It would therefore be of great interest to investigate the profitability for PV farms with a park size larger than the optimal size according to the direct capital support. Included in this would be a deeper analysis of the large scale effects. To make complete investment calculations of these large scale effects, the factors that may be affected by large scale installations needs to be identified as well as their significance.

77
References Agora Energiewende, 2014. Current and future cost of photovoltaics, Freiburg: Fraunhofer-Institue for Solar Energy Systems (ISE). Aktiefokus, 2011. [Online] Available at: http://www.aktiefokus.se/2011/11/elmarknaden-del-6-elcertifikatsystemet-subventioner-till-fornyelsebar-el/ [Accessed 04 05 2016]. Appunne, K., 2015. Setting the power price: the merit order effect. [Online] Available at: https://www.cleanenergywire.org/factsheets/setting-power-price-merit-order-effect [Accessed 31 03 2016]. Arcos, A. & Alvarez de Toledo, P., 2009. An analysis of the Spanish electrical utility industry: Economies of scale, technological progress and efficiency. Energy Economics, 30 January, pp. 473-481. Berk, J. & DeMarzo, P., 2014. Corporate Finance. 3rd edition ed. Harlow: Pearson Education Ltd. Blomkvist, P. & Hallin, A., 2015. Method for engineering students. 1 ed ed. Lund: Stundentlitteratur AB. Bodin, M., 2013. Vilka stora förändringar påverkar elpriserna på sikt?, s.l.: Modity. Bollen, M. & Westman, O., 2013. Utmaningar för det smarta elnätet, Ludvika: STRI. BRE, 2013. Planning guidance for the development of large scale ground mounted solar PV systems, Cornwall: BRE National Solar Centre. Collis, J. & Hussey, R., 2014. Business Research a practical guide for undergraduate and postgraduate students. 4 ed. ed. Hampshire: Palgrave Macmillan Higher Education. Cousin, G., 2005. Case Study Research. Journal of Geography in Higher Education, 29(3), pp. 421-427. Dalakraft, n.d. Elpriset. [Online] Available at: https://www.dalakraft.se/elmarknaden/elpriset [Accessed 18 05 2016]. Diehl, A., 2015. Determining Module Inter-Row Spacing. [Online] Available at: https://www.civicsolar.com/resource/determining-module-inter-row-spacing [Accessed 10 03 2016]. Elforsk, 2014. El från nya och framtida anläggningar 2014, s.l.: Elforsk. Energikommissionen, 2016. Promemoria om kostnader för nya elproduktionsanläggningar i Sverige, s.l.: Energikommissionen.

78
Energy Informative, 2015. Which Solar Panel Type is Best? Mono vs. Polycrystalline vs Thin film. [Online] Available at: http://energyinformative.org/best-solar-panel-monocrystalline-polycrystalline-thin-film/ [Accessed 26 02 2016]. Energy.gov, 2013. Photovoltaic System Basic. [Online] Available at: http://energy.gov/eere/energybasics/articles/photovoltaic-system-basics [Accessed 24 02 2016]. Energy.gov, n.d. Hybrid wind and solar electric systems. [Online] Available at: http://energy.gov/energysaver/hybrid-wind-and-solar-electric-systems [Accessed 01 03 2016]. Energytrust.org, 2009. Calculating Inter-Row Spacing. [Online] Available at: http://energytrust.org/trade-ally/updates-and-events/InsiderNewsletter/insider-pdfs/100304_solarprofessional_article.pdf [Accessed 10 03 2016]. Engblom, O. & Ueda, M., 2008. Representativa testnät för svenska eldistributionsnät, Stockholm: Elforsk. EPIA, 2013a. Global market outlook for photovoltaics 2013-2017, Brussels: European Photovoltaic Industry Association. EPIA, 2013b. Self consumption of PV electricity, Brussels: European Photovoltaic Industry Association. Ericsson, S. & Simm, J., 2009. Solcellsmarknaden i Sverige - En studie av hur faktorerna produkt, politik och kund ineragerar och påverkar denna marknad, Uppsala: Uppsala Universitet. European Commission, 2016. Renewable Energy. [Online] Available at: https://ec.europa.eu/energy/en/topics/renewable-energy [Accessed 18 02 2016]. European Regulators' Group for Electricity and Gas, 2009. Position paper on smart grids - An ERGEG public consultation paper, s.l.: ERGEG. Farquhar, J. D., 2012. Case Study Research for Business. 1 ed ed. London: SAGE Publications Ltd. Farrell, J., 2015. Questioning solar energy economies of scale, 2014 Edition. ILSR, 20 08. Fraunhofer ISE, 2016. Recent Facts about Photovoltaics in Germany, Freiburg: Fraunhofer Institute for Solar Energy Systems ISE. Fraunhofer-Institute for Solar Energy Systems (ISE), 2015. Current and Future Cost of Photovoltaics, Freiburg: Agora Energiewende.

79
Fulton, M. & Capalino, R., 2012. The German Feed-in Tariff: Recent Policy Changes, New York: Deutsche Bank Group. Green Rhino Energy , n.d. Ground-mounted Systems. [Online] Available at: http://www.greenrhinoenergy.com/solar/technologies/pv_tracking.php [Accessed 24 02 2016]. Green, P., 2011. How do you space a ground-mounted array?. [Online] Available at: https://www.civicsolar.com/resource/how-do-you-space-ground-mounted-array [Accessed 10 03 2016]. Hanam, B., Lee, A. & Yee Loong, K., 2007. University of Waterloo. [Online] Available at: https://uwaterloo.ca/systems-design-engineering/current-undergraduate-students/courses/workshop-projects/fourth2008/optimization-vanadium-flow-battery-systems-solar-and-wind [Accessed 16 March 2016]. Harvard, 2005. An energy-only market for resource adequacy in the midwest ISO region, Cambridge: Harvard Kennedy School. Hathaway, N., 2005. Valuation errors from nominal and real cash flows, Melbourne: Capital Research. Hughes, T. P., 1983. Networks of power – Electrification in Western society, 1800-1930. 2 ed. Baltimore and London: The Johns Hopkins University Press. Hughes, T. P. & Mayntz, R., 1988. The development of large technical systems. 1 ed. Frankfurt: Westview Press. IEA, 2016. PVPS Annual report 2015, s.l.: International Energy Agency. IEA, n.d. The merit order effect, s.l.: IEA PVPS. Jeffery, M., n.d. Return on Investment Analysis, s.l.: Northwestern University . Jordbruksverket, 2013. Arrendepriser på åkermark, jordbruksmark och betesmark åren 2007-2012. [Online] Available at: https://jordbruketisiffror.wordpress.com/2013/02/21/arrendepriser-pa-akermark-jordbruksmark-och-betesmark-aren-2007-2012/ [Accessed 29 03 2016]. Jönsson, M., 2015. Šefčovič: Sverige bör leda ny energiunion. [Online] Available at: http://sverigesradio.se/sida/artikel.aspx?programid=83&artikel=6278120 [Accessed 24 03 2016]. Jönsson, M., 2015. Vindkraft. [Online] Available at: http://www.svenskenergi.se/Elfakta/Elproduktion/Vindkraft/ [Accessed 29 02 2016]. Karakaya, E. & Sriwannawit, P., 2015. Barriers to the adoption of photovoltaic systems: The state of the art. Renewable and Sustainable Energy Reviews, 11 7, pp. 60-66.

80
Krothapalli, A., 2014. Lecture in Renewable, Solar Energy – An Introduction. Stockholm, Royal Institute of Technology. Landelius, T., 2016. Solstrålningen i Sverige om 50 år. [Online] Available at: http://www.energimyndigheten.se/globalassets/forskning--innovation/konferenser/solforum/presentationer/tomas-landelius--solinstralningen-i-sverige-om-50-ar.pdf [Accessed 21 04 2016]. Lantmäteriet, n.d. Innehåll i GSD-terrängkartan, raster. [Online] Available at: https://www.lantmateriet.se/sv/Kartor-och-geografisk-information/Kartor/Terrangkartan/GSD-Terrangkartan-raster/innehall-i-gsd-terrangkartan-raster1/ [Accessed 29 03 2016]. Larsson, F., 2015. Sveriges största solcellspark får vänta. Hallands Nyheter, 06 08. Lejestrand, A., 2016. Elnätet - nära 14 varv runt jorden, s.l.: Svensk energi. Lindahl, J., 2014. National Survey Report of PV Power Applications in Sweden, St. Ursen: IEA . Mälarenergi, 2015. Så fungerar elmarknaden. [Online] Available at: https://www.malarenergi.se/sv/privat/kunskapsbanken/el-och-elsakerhet/sa-fungerar-elmarknaden/ [Accessed 11 03 2016]. NASA Science, n.d. How do photovoltaics work?. [Online] Available at: http://science.nasa.gov/science-news/science-at-nasa/2002/solarcells/ [Accessed 24 02 2016]. Nord Pool, 2015. nordpoolspot. [Online] Available at: http://www.nordpoolspot.com/Market-data1/Elspot/Area-Prices/ALL1/Yearly/?view=table [Accessed 4 may 2016]. Nord Pool, u.d.a. Elspot prices. [Online] Available at: http://www.nordpoolspot.com/Market-data1/Elspot/Area-Prices/SE/Yearly/?view=table [Accessed 11 03 2016]. Nord Pool, u.d.b. The power market. [Online] Available at: http://www.nordpoolspot.com/How-does-it-work/ [Accessed 11 03 2016]. NREL , 2015. Photovoltaic system pricing trends, Denver: U.S. Department of Energy. NREL, 2009. Power purchase agreement checklist, Colorado: NREL. NREL, 2013. Weather-Corrected Performance Ratio, Oak Ridge: s.n.

81
NREL, 2014. Solar Photovoltaic Technology Basics. [Online] Available at: http://www.nrel.gov/learning/re_photovoltaics.html [Accessed 26 02 2016]. Ontario solar farms, n.d. Grount Mounted Solar PV Systems. [Online] Available at: http://www.ontariosolarfarms.com/ground-mounted-solar.html [Accessed 25 02 2016]. Ouyang, X. & Lin, B., 2014. Levelized cost of electricity (LCOE) of renewable energies and required subsidies in China. Energy Policy, Issue 70, pp. 64-73. Pellby, O. & Larsson, A., 2015. Solceller på den svenska marknaden, Kalmar: Linnéuniversitet . Regeringen, 2015a. Klimatavtal klubbat i Paris. [Online] Available at: http://www.regeringen.se/pressmeddelanden/2015/12/klimatavtal-klubbat-i-paris/ [Accessed 09 05 2016]. Regeringen, 2015b. Mål för förnybar energi. [Online] Available at: http://www.regeringen.se/regeringens-politik/energi/fornybar-energi/mal-for-fornybar-energi/ [Accessed 01 03 2016]. Reich, N. H. et al., 2012. Performance ratio revisited: is PR > 90% realistic?. Progress in photovoltaics: research and photovoltaics, 20(6), pp. 619-825. Rönnberg, A., 2015. Evaluation and Sensitivity Analysis of Cost Calculations in the ThermoEconomic Modeling of CSP Plants, Stockholm: KTH. Rönning, L., n.d. Mega-sol i Arvika, Arvika: Arvika Kraft AB. SEIA, n.d. Photovoltaic (Solar Electric). [Online] Available at: http://www.seia.org/policy/solar-technology/photovoltaic-solar-electric [Accessed 24 02 2015]. Short, W., Packey, D. J. & Holt, T., 1995. A manual for the economic evaluation of energy efficiency and renewable energy technologies, Colorado: NREL. Skatteverket, 2016. Belopp och procentsatser. [Online] Available at: https://www.skatteverket.se/foretagorganisationer/sjalvservice/svarpavanligafragor/beloppochprocentsatser/foretagbeloppfaq/hurmycketbetalaraktiebolagekonomiskaforeningarideellaforeningarochstiftelseriinkomstskatt.5.18e1b10334ebe8bc8000118066.html [Accessed 14 04 2016]. SMHI, 2014. Normal global instrålning under ett år. [Online] Available at: http://www.smhi.se/klimatdata/meteorologi/stralning/normal-globalstralning-under-ett-ar-1.2927 [Accessed 29 03 2016].

82
Solar energy net, n.d. How photovoltaic cells work. [Online] Available at: http://solarenergy.net/solar-power-resources/how-photovoltaic-cells-work/ [Accessed 24 02 2016]. Solar Energy Partners, n.d. Investment overview. [Online] Available at: http://solarenergypartners.co.uk/investment-overview [Accessed 29 04 2016]. Stridh, B., 2016a. Solel knappt 0,1% av Sveriges elproduktion. [Online] Available at: http://bengtsvillablogg.info/2016/03/31/solel-knappt-01-av-sveriges-elproduktion/ [Accessed 16 05 2016]. Stridh, B., 2016b. Sveriges första MW-solcellspark och dess forskningssystem – En systembeskrivning, Eskilstuna Västerås: Mälardalens högskola. Stridh, B., 2016c. Utvärdering av Sveriges första MW-solcellspark, Eskilstuna Västerås: Mälardalens Högskola. Sweden, 2016. Energy use in Sweden. [Online] Available at: https://sweden.se/society/energy-use-in-sweden/ [Accessed 18 02 2016]. Swedish Energy Agency & Norges vassdrags- og energidirektorat, 2014. Annual Report - The Norwegian-Swedish Electricity Certificate Market, s.l.: Energimyndigheten & Norges vassdrags- og energidirektorat. Swedish Energy Agency Cesar, 2016. Statistik elcertifikat. [Online] Available at: https://cesar.energimyndigheten.se/WebPartPages/IssuingPage.aspx [Accessed 11 03 2016]. Swedish Energy Agency, 2015a. Elcertifikatsystemet – ett stödsystem för förnybar elproduktion. [Online] Available at: http://www.energimyndigheten.se/globalassets/fornybart/elcertifikat/om/faktablad-om-elcertifikatsystemet.pdf [Accessed 24 02 2016]. Swedish Energy Agency, 2015b. Investeringsstöd. [Online] Available at: http://www.energimyndigheten.se/fornybart/solenergi/stod-till-solceller/investeringsstod/ [Accessed 24 02 2016]. Swedish Energy Agency, 2015c. Kvotnivåer. [Online] Available at: http://www.energimyndigheten.se/fornybart/elcertifikatsystemet/kvotpliktiga/kvotnivaer/ [Accessed 30 03 2016]. Swedish Energy Agency, 2015d. The Electricity Certificate System. [Online] Available at: http://www.energimyndigheten.se/en/Sustainability/The-electricity-certificate-system/ [Accessed 24 02 2016].

83
Swedish Energy Agency, 2015f. Ursprungsgarantier. [Online] Available at: http://www.energimyndigheten.se/fornybart/ursprungsgarantier/mer-om-ursprungsgarantier/ [Accessed 25 02 2016]. Swedish Energy Agency, 2016a. Delredovisning av uppdraget att ta fram ett förslag till strategi för ökad användning av solel, Eskilstuna: Swedish Energy Agency. Swedish Energy Agency, 2016b. Fördelning av solcellsstöd per län. [Online] Available at: http://www.energimyndigheten.se/fornybart/solenergi/stod-till-solceller/investeringsstod/fordelning-av-medel-per-lan/ [Accessed 30 03 2016]. Swedish Energy Agency, 2016c. Fördelning av solcellsstöd per län 2009-pågående. [Online] Available at: http://www.energimyndigheten.se/fornybart/solenergi/stod-till-solceller/investeringsstod/manadsrapport-for-solcellsstod/ [Accessed 30 03 2016]. Swedish Energy Agency, 2016d. Kontrollstation 2017 för elcertifikatsystemet. [Online] Available at: http://www.energimyndigheten.se/fornybart/elcertifikatsystemet/om-elcertifikatsystemet/kontrollstation-2017/ [Accessed 30 03 2016]. Swedish Energy Agency, 2016e. Stöd till solceller. [Online] Available at: http://www.energimyndigheten.se/fornybart/solenergi/stod-till-solceller/ [Accessed 29 03 2016]. Swedish Energy Markets Inspectorate, 2014. Så sätts ditt elpris. [Online] Available at: http://www.energimarknadsinspektionen.se/Documents/Publikationer/fakta_och_informationsmaterial/Sa_satts_ditt_elpris.pdf [Accessed 31 03 2016]. Swedish Energy Markets Inspectorate, 2016. Elområden. [Online] Available at: http://www.energimarknadsinspektionen.se/sv/el/elmarknader-och-elhandel/handel-med-el/elomraden/ [Accessed 08 03 2016]. Swedish smart grid, n.d. Aktörer på elmarknaden, s.l.: Swedish smart grid. Svensk energi, 2015. Konsumentprisets delar - halva kostnaden politiskt beslutad. [Online] Available at: http://www.svenskenergi.se/Elfakta/Elmarknaden/Konsumentprisets-delar/ [Accessed 11 03 2016]. Svensk Energi, 2016a. Elbörsen Nord Pool. [Online] Available at: http://www.svenskenergi.se/Elfakta/Elmarknaden/Elborsen-Nord-Pool-Spot/ [Accessed 25 04 2016]. Svensk Energi, 2016b. Elpriser och skatter. [Online] Available at: http://www.svenskenergi.se/Elfakta/Elpriser-och-skatter/ [Accessed 11 03 2016].

84
Svensk Energi, 2016c. Konsumentpriser och skatter. [Online] Available at: http://www.svenskenergi.se/statistik/statistik_i_bilder/Diagram-och-tabeller-konsument-elpriser-och-elskatter-i-Sverige-och-Norden.pdf [Accessed 11 03 2016]. Svensk Energi, 2016d. Kraftläget i Sverige. [Online] Available at: http://www.svenskenergi.se/Global/Statistik/Tidigare%20kraftl%c3%a4gen/Kraftl%c3%a4get-Sverige-veckorapport-vecka-2016-01.pdf [Accessed 29 02 2016]. Svensk Kraftmäkling, n.d. SKM Elcertificate price history (SEK). [Online] Available at: http://www.skm.se/priceinfo/history/ [Accessed 02 04 2016]. Sveriges Riksdag, 2015. Förordning (2009:689) om statligt stöd till solceller, Stockholm: Regeringskansliet Miljö- och energidepartementet. Söder, L., 2013. På väg mot en elförsörjning baserad på enbart förnybar el i Sverige: En studie om kraftsystemets balansering: Version 3.0, Stockholm: Royal Institute of Technology. Söder, L., 2014. På väg mot en elförsörjning baserad på enbart förnybar el i Sverige En studie om behov av reglerkraft och överföringskapacitet Version 4.0, Stockholm: Royal Institute of Technology. Söder, L., 2016. På väg mot en elförsörjning baserad på enbart förnybar el i Sverige: En analys av lämplig marknadshantering Version 1.0, Stockholm: Royal Institute of Technology. The Swedish government, 2014. Svensk författningssamling. [Online] Available at: http://rkrattsdb.gov.se/SFSdoc/14/141582.PDF [Accessed 09 05 2016]. The Swedish Government, 2015. Avtal mellan konungariket Sveriges regering och konungariket Norges regering om ändring av avtal om en gemensam marknad för elcertifikat, s.l.: The Swedish government. TT, 2015. Ringhals stänger två reaktorer. SvD Näringsliv, 15 10. Unger, T., 2014. Analys av långsiktig elprisutveckling för långsiktig planering och investering, s.l.: Profu. Valuta.se, 2016. valuta.se. [Online] Available at: http://www.valuta.se/ [Accessed 19 May 2016]. Vartiainen, E., Massan, G. & Breyer, C., 2014. PV LCOE in Europe 2014-30, Brussels: Photovoltaic technology platform.

85
Vattenfall, 2013. Vattenkraft i framtiden. [Online] Available at: http://corporate.vattenfall.se/om-energi/el-och-varmeproduktion/vattenkraft/vattenkraft-i-framtiden/ [Accessed 29 02 2016]. Vattenfall, 2015. Vattenkraft. [Online] Available at: https://corporate.vattenfall.se/om-oss/var-verksamhet/var-elproduktion/vattenkraft/ [Accessed 09 05 2016]. Windon, 2015. Solpark och större installationer. [Online] Available at: http://www.windon.se/solpark.html [Accessed 29 03 2016]. Windon, n.d. Solenergi och solinstrålning. [Online] Available at: http://www.windon.se/solenergi.html [Accessed 08 03 2016]. von Schultz, C., 2015. Ny Teknik. [Online] Available at: http://www.nyteknik.se/energi/storsta-svenska-solcellsparken-i-drift-6395439 [Accessed 11 May 2016]. InterviewsInterviewee 1 – Johan Lindahl, Swedish representative of IEA-PVPS. Interviewee 2 – Employee at Kraftpojkarna and guide at the Megawatt Park in Västerås. Interviewee 3 – Consultant with knowledge in land agreements. Interviewee 4 – PhD student at the Energy Department at KTH. Interviewee 5 – PhD student at the department of Industrial Economics and Management at KTH.
Has for example conducted research about photovoltaic systems in Germany. Interviewee 6 – Consultant in the solar industry in Sweden. Interviewee 7 – Employee at Vattenfall with knowledge about their current offerings in PV.

86
Appendix 1 Interview guidelines.
Interview–Interviewee1(Interview was held in Swedish)
When we contacted you we had not specified our study that much. Now we have chosen to investigate the potential for large scale PV farms in Sweden and how profitable they are for utility companies in Sweden.
The technology Solar cells
1. We have seen that there exist mono crystalline, poly crystalline and thin-film solar cells. What are the major advantages and disadvantages for these?
2. Do you believe that these will be used in the future and if so, which? Or will a new technology be commercialized?
3. How do you the price development for solar cells will evolve the next coming years? Will the prices continue to decrease? If this is the case, why is it pointing in that direction?
4. We have interpreted that thin-film will become more efficient in the future, is that correct? Could you estimate when?
5. We have read that the crystalline solar cells have environmental impact, is that correct? In that case, if a larger amount of crystalline solar cells is produced, is this an aspect to consider and choose thin-film instead for instance?
Systems
6. What do you think about solar trackers, could they be profitable in the future in Swedish solar farms? Perhaps they are not profitable today due to high investment costs, but in the future when the cost could have decreased?
Placement
7. What parameters should be taken into account when deciding the location for a solar farm?
8. Do you believe that there exist synergies if combining solar and wind farms? For instance, lower costs for infrastructure.
Solar conditions and storage
9. Do you believe that the Swedish solar conditions are suitable for large scale solar farms? 10. Will storage be important in the future for solar cells? What type of storage? What
batteries? 11. When will batteries be introduced into the market for large scale solar farms? Should we
include storage in our study?
Financial support policy
12. What are your opinions about the electricity certificate system? What are the pros and cons?

87
13. What do you think about the direct capital subsidy system? Pros and cons? 14. Should Sweden have different support policy for different types of RES? 15. We have read a little bit about Guarantees of Origin, how would you describe it? How
much is it used today? Will it be more used in the future? 16. Do you recieve ”ROT-avdrag” for large solar installations? 17. Do you think other financial support policies would benefit solar installations more?
Other
18. How large share do you think solar energy could have in the Swedish electricity production in the future?
19. What do you think we should consider in our study? Is there any specific aspect that we have forgotten?
20. Do you have any recommendations to map the solar conditions? Any computer software?

88
Interview–Interviewee2(Interview was held in Swedish) Describe the purpose of our study.
General
1. What do you do with the vegetation under the solar panels? 2. What do you do when it snows and rains? 3. What do you think about combining solar and wind farms? Are the solar panels resistant
for wind?
Components in the system
4. What is the reason for choosing the module tilt angles 19 and 40 degrees? Which have proven to be most efficient?
5. Is it profitable to use efficiency optimizers? 6. Have some unexpected losses arose that you did not expect when planning? 7. What are the losses for transmission of electricity compared to if the electricity is not
transmitted? 8. Is it mono crystalline solar cells? 9. What type of inverters is it? (Solar edge?) 10. What modules are used? 11. How many modules can you use in every string? Does an optimal ratio exist? 12. What is the inter-row spacing? How did you come up with this space? 13. Logging? 14. Are the ground mounted systems movable? How much more expensive would it get to
move the systems once a year?
Land
15. What do you pay for the land area? Is it a percentage of the production revenue? Do you rent it?
16. How hard is it to rent land for solar farms? 17. Are there any general guidelines when renting land?
Grid connection
18. How did you connect the farm to the grid? 19. What costs come along with grid connection? 20. What type of grid do you connect to? 21. Infrastructure? 22. What should you consider regarding infrastructure? Roads etc.?

89
Interview–Interviewee3(Interview held in Swedish) Describe the purpose of the study.
1. In what categories is land divided into?
2. How do you value land and by whom?
3. What value do different land types have? Is farmland most valuable or another type land?
4. Is it possible to see the type of land at maps?
5. Could you describe a general process for leasing land?
6. What are the pros of leasing land compared to buying it?
7. Is the price set per square meter? Does it exist any general price for leasing land or does it fluctuate from case to case? What is a reasonable return to the land owner?
8. How do you pay? Monthly or annually? Or does it differ?
9. Is a larger amount payed in the beginning or is it a constant cost during the whole land lease period?
10. How does land lease work? Are there any general legislations? Who are responsible if something happens? Sabotage for instance?
11. Is the price set between leaser and land owner?
12. How negotiable is the land lease price?
13. What should be considered regarding building permits? When do you have to apply?
14. Are there any other legislations to consider when building? Additional regulations set by the municipality for instance?
15. Are there any rules for cables?
16. How is this usually carried out?
17. Do you have any experience of land lease agreements for solar farms?
18. What type of lease would a solar installation be? What would it be called?
19. We are also wondering about what is called a property. What does it take for land to be called a property? Are there any lower or upper limit considering size?
20. What do you believe it will take for a land owner to lease its property for solar installations?

90
Interview–Interviewee4
We are doing our master thesis at Vattenfall about solar power. They have the renewable target of growing in the renewable market. Today they do not produce any solar power and therefore we want to look at how they could implement solar power in their production in Sweden. In our study we only focus on electricity and large scale production.
Thermal vs PV
1. We have made some research about the basics for solar technologies. We have interpreted that CSP is not possible to install in Sweden due to the lack of direct radiation, is that correct?
Yes, no CSP in Sweden.
2. The other type of solar thermal is non-concentrating solar power. Is it possible to generate electricity from this technology? (or could just heat be produced by non-concentrating solar) Is it possible to use non-concentrating in Sweden?
3. If yes on the previous question: What is the future potential for thermal non-concentrating solar power in the electricity production?
4. Should Sweden focus on PV or thermal for large scale electricity production in Sweden?
5. Is it possible to use a hybridization of PV-thermal in Sweden?
If knowledge in PV
6. We have found that four-five different types of PV-cells exist today (even though not all are used in the market). What type of PV cells do you think has the greatest potential in the future in Sweden? (Multijunction cells, Single-junction GaAs, Crystalline Si cells, Thin-Film technologies and Emerging PV)
7. Regarding storage, we have got the impression that it is better storage possibilities (cheaper and more efficient) of thermal solar power than PV? Is that correct?
8. What storage methods are used for solar power today?
9. What methods for storage do you think will be used most in the future?
10. Is it possible to store electricity from PV today in a profitable way? If not, could you say when you think that will be possible? 5, 10, 20 years?
11. Do you think storage will be an important part of solar installations in the future?
12. Can the development of storage be the decisive factor for more implementation of solar power in Sweden?
The future of solar power in Sweden
13. What do you think Sweden should do to produce more energy from solar power?

91
14. If you would do the same project as us, what would you focus on? What parameters would you consider?
PV in general
15. Which type of PV solar are there on the market today?
16. Which technology for PV solar cells do you think is most suitable for Sweden?

92
Interview–Interviewee5
We are doing our master thesis at Vattenfall about solar power. They have a renewable target of growing in the renewable market. Today they do not produce any solar power and therefore we want to look at how they could implement solar power in their production in Sweden. In our study we only focus on electricity and mostly on large scale production.
Potential in Sweden
1. We have found that four-five different types of PV-cells exist today (even though not all are used in the market). What type of PV cells do you think has the greatest potential in the future in Sweden? (Multijunction cells, Single-junction GaAs, Crystalline Si cells, Thin-Film technologies and Emerging PV)
2. What do you think is the potential for solar power in Sweden?
3. How do you think energy production companies in Sweden should invest in solar power? Private solutions, large scale plants, B2B?
Comparison with Germany
4. How does the financial support system work in Germany?
5. What are the pros and cons regarding their financial support system?
6. In Sweden the electricity certificate system exists and an installation subsidiary for electricity producers, but at the moment it does not work that well since there is a surplus of certificates. Do you think Sweden could have the same support system as Germany or could another system be more suitable?
7. Could a reverse auction based system be good for Sweden? What are the pros and cons about this system?
8. Why does Germany have more installed solar power than Sweden? Is it only due to their financial support systems? Is it correct that Sweden has the same amount of solar radiation/conditions as Germany?
9. When the energy production includes more renewable sources the price for electricity decreases (merit order curve). What effects have this shown on the German market?
10. What must be considered in a market when more renewables (such as wind and solar) are included?
The future of solar power in Sweden
11. What do you think Sweden should do to produce more energy from solar power?
12. What do you think is required in order to make solar installations profitable in the future in Sweden?

93
13. If you would do the same project as us, what would you focus on? What parameters would you consider?

94
Appendix 2 Calculations for the size of the PV plant clear;clc; beta=45; %module angle in degrees l=1.6; %;module height in meter b=1.0; %module width in meter alfa=10; %solar altitude angle in degrees C=10^6; %installed capacity in MW rl=sind(180-alfa-beta)*l/(sind(alfa)) %inter-row-spacing between modules, modules=standing on height rb=sind(180-alfa-beta)*b/(sind(alfa)) %inter-row-spacing between modules, modules=standing on width n=C/265 %number of modules needed considering the installad capacity sizel=(n*rl*b)/10000 %size of plant with modules standing on height in ha sizeb=(n*rb*b)/10000 %size of plant with modules standing on width in ha