Embed Size (px)
Citation preview
University of South Florida University of South Florida
Scholar Commons Scholar Commons
Graduate Theses and Dissertations Graduate School
2011
The Positive Illusory Bias: Do ADHD Symptoms Differ Among The Positive Illusory Bias: Do ADHD Symptoms Differ Among
Young Adolescents with Accurate Versus Discrepant Self-Young Adolescents with Accurate Versus Discrepant Self-
Perceptions? Perceptions?
Sarah A. Fefer University of South Florida, [email protected]
Follow this and additional works at: https://scholarcommons.usf.edu/etd
Part of the American Studies Commons, Educational Psychology Commons, Psychology Commons,
and the Secondary Education and Teaching Commons
Scholar Commons Citation Scholar Commons Citation Fefer, Sarah A., "The Positive Illusory Bias: Do ADHD Symptoms Differ Among Young Adolescents with Accurate Versus Discrepant Self-Perceptions?" (2011). Graduate Theses and Dissertations. https://scholarcommons.usf.edu/etd/3098
This Ed. Specalist is brought to you for free and open access by the Graduate School at Scholar Commons. It has been accepted for inclusion in Graduate Theses and Dissertations by an authorized administrator of Scholar Commons. For more information, please contact [email protected].

The Positive Illusory Bias: Do ADHD Symptoms Differ Among Young Adolescents with
Accurate Versus Discrepant Self-Perceptions?
by
Sarah A. Fefer
A thesis submitted in partial fulfillment of the requirements for the degree of
Education Specialist Department of Psychological and Social Foundations
College of Education University of South Florida
Co-Major Professor: Julia A. Ogg, Ph.D. Co-Major Professor: Shannon M. Suldo, Ph.D.
Robert Dedrick, Ph.D. Sarah Kiefer, Ph.D.
Date of Approval: May 3, 2011
Keywords: Attention-Deficit/Hyperactivity Disorder, self-concept, middle school students, academic self-perception, social self-perception
© Copyright 2011, Sarah A. Fefer

Acknowledgements
I would like to thank all of the people who have provided guidance and support
throughout my thesis research. Specifically, I would like to thank my Co-Major
Professors, Drs. Julia Ogg and Shannon Suldo for their expertise and continuous support
throughout my studies at University of South Florida and for this project in particular.
Their outstanding mentorship enhanced the quality of this thesis, helped me to build my
skills as a researcher, and contributed to my passion for the research process. I would
also like to thank Dr. Sarah Kiefer for her insight related to self-concept and adolescence,
and for her ongoing encouragement. Additionally, I would like to thank Dr. Robert
Dedrick for sharing his vast knowledge of statistical analyses and for providing insight
into the procedures used for this study. All of the contributions of my committee
members have helped me to further my understanding of the entire research process from
conceptualization to interpreting results and identifying implications. Dr. Rance Harbor
and the principals of each of the middle schools that I worked with deserve a special
thank you for helping to ensure that the data collection associated with this project was
successful. Also, I am forever grateful to my family for their love and enthusiasm related
to all of my academic endeavors. Finally, thank you to my friends and cohort members
for being my “Florida family.”

i
Table of Contents List of Tables iv Abstract v Chapter I: Introduction 1
Statement of the Problem 1 Theoretical and Conceptual Framework for Self-Concept 4 Purpose of the Current Study 6 Definition of Key Terms 7
Attention-deficit/Hyperactivity Disorder (ADHD) 7 Self-Concept 7 Positive Illusory Bias (PIB) 8 Accuracy of Self-Perceptions 8 Elementary-Age Youth 8 Adolescents 9
Research Questions 9 Importance of the Current Study to School Psychology 9 Contributions to the Literature 10
Chapter II: Review of the Literature 12
Self-Concept 12 Terminology 12 Global versus Domain Specific Self-Concept 13 Multidimensional Theories 14
Marsh 15 Bracken 17 Harter 19 Comparison of three models 21
Developmental Findings 23 Childhood 23 Adolescence 24
Attention-Deficit/Hyperactivity Disorder 28 Diagnosis 29 Primary Characteristics of ADHD 30
Inattention 30 Hyperactivity/Impulsivity 31 Combined 32
Comorbidity 32 Developmental Considerations 33

ii
Academic Outcomes 34 Social Outcomes 35
ADHD and Self-Concept 37 Hypotheses to Explain the Positive Illusory Bias 38 Past Literature Exploring the Positive Illusory Bias 42
Absolute self-perceptions 42 Pre/post performance ratings 47 Criterion/discrepancy analysis 50
Conclusions 58 Chapter III: Method 61
Participants 61 Selection of Participants 64
Students 64 Teachers 67
Measures 68 Student Measures 68
Demographic form 68 Florida Comprehensive Assessment Test 69 Self-Perception Profile for Children 70 Center for Epidemiological Studies Depression Scale 72
Teacher Measures 74 Teacher’s Rating Scale of the Child’s Actual Behavior 74 Vanderbilt ADHD Diagnostic Teacher Rating Scale 75
Procedures 76 Student Survey 76 Teacher Survey 78
Analyses 78 Descriptive analysis 78 Creating Groups Based on the Accuracy of Self-Perceptions 79 Correlational Analyses 81 Research Question Analyses 81
Ethical Considerations 83 Limitations of the Current Study 84
Chapter IV: Results 87
Data Screening 87 Calculating the Accuracy of Self-Perceptions 88 Descriptive Analyses 90 Preliminary Analyses 96
Scale Reliability 96 Correlational Analyses 97
Differences in Symptoms between Groups 100 Assumptions 100 MANOVA Results 102 Groups based on academic self-perceptions and teacher ratings 102
iii
Groups based on academic self-perceptions and standardized achievement scores 104 Groups based on social self-perceptions and teacher ratings 105
Summary of Results 107 Chapter V: Discussion 109
Key Findings from Descriptive Analyses 109 Differences in Symptoms between Self-Perception Groups 111
Academic Domain 111 Social Domain 115 Comparison of Inattentive and Hyperactive/Impulsive Symptoms 117
Implications and Future Directions: Research and Practice 120 Implications for Research 120 Implications for Practice 126
Limitations 128 Conclusions 131
References 133 Appendices 151
Appendix A: Parent Consent Letter 152 Appendix B: Student Assent Letter 154 Appendix C: Vanderbilt ADHD Diagnostic Teacher Rating Scale
(VADTRS) 156 Appendix D: Teacher’s Rating Scale of the Student’s Actual Behavior
(SPPC-TRS) 158 Appendix E: Teacher Consent Letter 159 Appendix F: Demographic Form 161 Appendix G: Self-Perception Profile for Children (SPPC) 162 Appendix H: Center for Epidemiological Studies Depression Scale (CES-
D) 164 Appendix I: Comparison of Raw Accuracy Scores Across Groups 165
iv
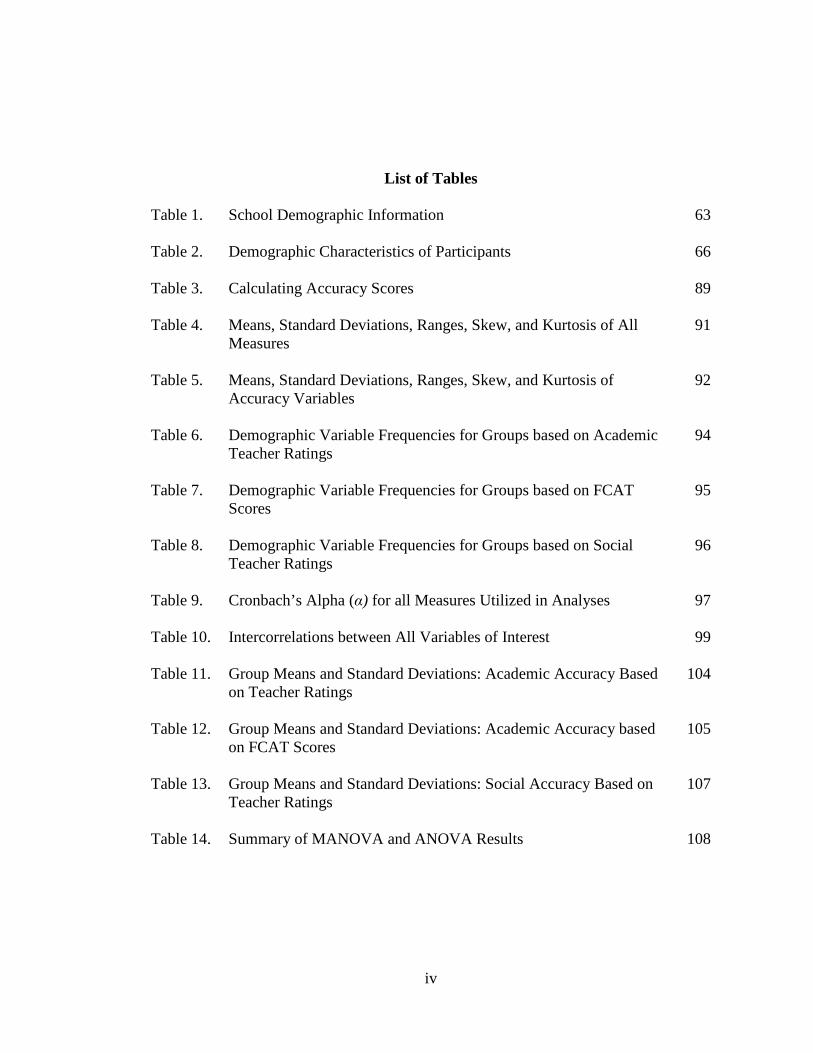
List of Tables
Table 1. School Demographic Information
63
Table 2. Demographic Characteristics of Participants 66
Table 3. Calculating Accuracy Scores
89
Table 4. Means, Standard Deviations, Ranges, Skew, and Kurtosis of All Measures
91
Table 5. Means, Standard Deviations, Ranges, Skew, and Kurtosis of Accuracy Variables
92
Table 6. Demographic Variable Frequencies for Groups based on Academic Teacher Ratings
94
Table 7. Demographic Variable Frequencies for Groups based on FCAT Scores
95
Table 8. Demographic Variable Frequencies for Groups based on Social Teacher Ratings
96
Table 9. Cronbach’s Alpha (α) for all Measures Utilized in Analyses 97
Table 10. Intercorrelations between All Variables of Interest 99
Table 11. Group Means and Standard Deviations: Academic Accuracy Based on Teacher Ratings
104
Table 12. Group Means and Standard Deviations: Academic Accuracy based on FCAT Scores
105
Table 13. Group Means and Standard Deviations: Social Accuracy Based on Teacher Ratings
107
Table 14. Summary of MANOVA and ANOVA Results 108
v
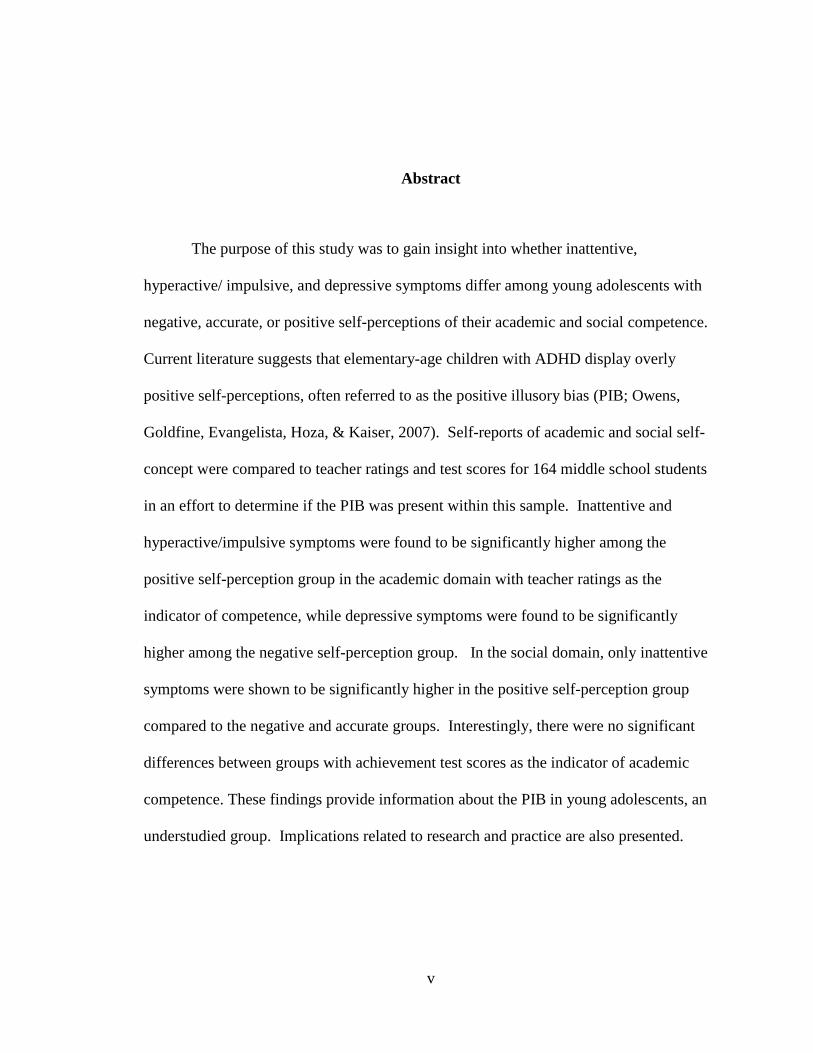
Abstract
The purpose of this study was to gain insight into whether inattentive,
hyperactive/ impulsive, and depressive symptoms differ among young adolescents with
negative, accurate, or positive self-perceptions of their academic and social competence.
Current literature suggests that elementary-age children with ADHD display overly
positive self-perceptions, often referred to as the positive illusory bias (PIB; Owens,
Goldfine, Evangelista, Hoza, & Kaiser, 2007). Self-reports of academic and social self-
concept were compared to teacher ratings and test scores for 164 middle school students
in an effort to determine if the PIB was present within this sample. Inattentive and
hyperactive/impulsive symptoms were found to be significantly higher among the
positive self-perception group in the academic domain with teacher ratings as the
indicator of competence, while depressive symptoms were found to be significantly
higher among the negative self-perception group. In the social domain, only inattentive
symptoms were shown to be significantly higher in the positive self-perception group
compared to the negative and accurate groups. Interestingly, there were no significant
differences between groups with achievement test scores as the indicator of academic
competence. These findings provide information about the PIB in young adolescents, an
understudied group. Implications related to research and practice are also presented.

1
Chapter I: Introduction
Statement of the Problem
Attention-Deficit/Hyperactivity Disorder (ADHD) is one of the most common
childhood mental health diagnoses, impacting five to ten percent of school-age students
in the United States (Scahill & Schwab-Stone, 2000). This percentage is even higher
when students displaying non-clinical levels of ADHD symptoms are included. The core
symptoms associated with this disorder include inattention and/or
hyperactivity/impulsivity. A diagnosis of ADHD requires the presence of functional
impairments, which must manifest in multiple life domains (American Psychiatric
Association [APA], 2000). Social, academic, and behavioral impairments are common
for students with ADHD symptoms (Gaub & Carlson, 1997). One might expect that
children displaying ADHD symptoms would be at risk for low self-concept in these
domains due to frequent difficulties in these areas; however, past studies examining self-
perceptions of children with ADHD have demonstrated that these children may not
perceive or report these deficits. In contrast, children with ADHD have been shown to
overestimate their competence in areas where they experience significant difficulties
(Hoza, Gerdes, Hinshaw, Arnold, Pelham, Molina, et al., 2004). These overly positive
self perceptions are often referred to as the positive illusory bias (PIB). The PIB has been
defined in the following way: “children with ADHD unexpectedly provide extremely
positive reports of their own competence in comparison to other criteria reflecting actual

2
competence” (Owens, Goldfine, Evangelista, Hoza, & Kaiser, 2007, p. 335). The PIB has
been observed across a number of different domains of self-concept, including academic,
social, behavior, athletic competence, and physical appearance (Hoza et al., 2004).
Current literature supporting the presence of the PIB in individuals with ADHD
has been conducted primarily with elementary-age students. However, symptoms of
ADHD have been shown to persist into adolescence and adulthood, with estimates that as
many as 65% of children diagnosed with ADHD continue to meet diagnostic criteria
during adolescence (Wolraich, Wibbelsman, Brown, Evans, Gotlieb, Knight et al., 2005).
Additionally, academic and social problems associated with ADHD may become more
pronounced during adolescence due to the increasing academic demands and the
increased emphasis on peer acceptance that are associated with middle and high school
(Wolraich et al., 2005).
Children and adolescents in the normative population who have high self-concept
in academic and social domains have been shown to have more positive outcomes, such
as higher academic achievement and positive social relationships (Bracken, 2009).
Social self-concept has been shown to be important for initiating and engaging in positive
social interactions, which are seen as a key component of mentally healthy children,
adolescents, and adults (Bracken, 2009). Additionally, academic success and higher
levels of academic self-concept have been shown to have a reciprocal relationship in the
general population (Trautwein, Lüdtke, Köller, & Baumert, 2006). Although there has
been an association between high levels of self-concept and positive outcomes, this
relationship is less clear in children with ADHD. While positive illusions in the general
population have been shown to lead to more task-persistence and motivation (Taylor &

3
Brown, 1988), positive illusions have not proven to be adaptive for children with ADHD.
These children have been shown to have less task persistence and lower performance
than same-age peers (Hoza, Waschbusch, Owens, Pelham, & Kipp, 2001). The presence
of the PIB in the academic and social domains for adolescents with symptoms of ADHD
warrants attention for the following reasons: (1) younger children with ADHD have been
shown to overestimate their competence in these domains, and symptoms of ADHD
persist into adolescence, (2) adolescence is a developmental period marked by increased
demands in the academic and social domains, (3) symptoms of ADHD are often
associated with impairments in these two domains, and (4) high self-concept in these
areas is linked to positive outcomes for adolescents in the general population, but this has
not been directly studied for adolescents with ADHD. This study served to determine if
the PIB persists through early adolescence for students with symptoms of ADHD.
It is also important to consider how ADHD symptoms may change during this
developmental period. Research has shown that inattentive symptoms become more
prevalent than hyperactive/impulsive symptoms during adolescence (Smith, Barkley, &
Shapiro, 2007; Wolraich et al., 2005). Related to the PIB, only one study has looked
specifically at the influence of ADHD subtypes (i.e., Innattentive, Hyperactive/Impulsive,
and Combined subtypes) and found differences in the expression of the PIB between
these subtypes (Owens & Hoza, 2003). Specifically, the PIB was found only in students
with elevated hyperactive/impulsive (HI) symptoms. The current study adds to this small
body of literature by determining if the PIB persists despite known changes in symptom
profiles from childhood to adolescence, and by examining the presence of the PIB in
relation to the adolescent’s degree of inattentive and hyperactive/impulsive symptoms
4
rather than ADHD diagnosis. This is the first investigation of the PIB which has
considered the full range of ADHD symptoms rather than only including students with
clinical levels of ADHD symptoms.
Comorbid diagnoses are frequent among children and adolescents with symptoms
of ADHD, with comorbid depression becoming more prevalent as children with ADHD
approach adolescence (Barkley, 2006). Approximately 50% of young adolescents with
ADHD were found to exhibit comorbid depression in a clinic based sample (Bird, Gould,
& Staghezza, 1993), compared to a 30% rate of comorbidity for younger children with
ADHD (Biederman, Mick, & Faraone, 1998). Comorbid depression has been shown to
influence the presence of the PIB in children with ADHD, with symptoms of depression
decreasing the presence of the PIB and leading to more realistic self-evaluations for
children with ADHD (Hoza, Pelham, Dobbs, Owens, & Pillow, 2002). Because the
likelihood of students with ADHD exhibiting comorbid depressive symptoms has been
shown to increase with age (Smith et al., 2007), it is particularly important to consider
depressive symptoms when investigating the relationship between ADHD symptoms and
the presence of the PIB in adolescents.
Theoretical and Conceptual Framework for Self-Concept
It is important to adopt a multidimensional, or domain-specific, perspective of
self-concept when examining the presence of the PIB because previous research has
documented that a student can display positive illusions in one domain, but not in another
(Ohan & Johnston, 2002). Domain-specific self-concept reflects an individual’s self-
perception in a specific realm of functioning and considers an individual’s perceptions of
their specific qualities, skills, and abilities (Trautwein et al., 2006).
5
Three dominant multidimensional theories of self-concept have been adopted as
the framework for the current study (Bracken, 1992; Harter, 1999; Marsh, 1988). These
theories have emerged to explain self-concept in children, adolescents, and adults. The
model proposed by Marsh is the most academically focused and considers self-concept
within specific academic areas (e.g., reading or mathematics), Bracken’s model is
oriented around behavioral principles which highlight reinforcement and punishment
within the environment as primary in the development of one’s self-concept, and Harter’s
model focuses on cognitive and social factors and emphasizes the importance of
developmental considerations. There are several common threads underlying each of
these theories. First, each of these theories views self-concept as a multidimensional
construct, with different domains representing different contexts. Considering self-
concept as a multidimensional construct accounts for differences that are inherent across
contexts. Although there is not currently agreement about the specific domains of
importance for children and adolescents, these three theorists all propose domains to
represent the students’ social, academic, and physical self-perceptions (Bracken, 1992;
Harter, 1999; Marsh, 1988). Additionally, each of these theories is considered to present
a hierarchical view of self-concept, which views global self-concept or overall self-worth
to be at the top or primary level of the hierarchy, with specific domains making up a
secondary level of self-concept. Lastly, these theorists purport that self-concept must be
considered developmentally because individuals experience different contexts as they age
and the importance placed on the perceptions of others may change over time (Harter,
1999). Additionally, Harter (1999) purports that an individual’s cognitive development
and age should be considered when examining domain-specific self-concept and that self-
6
concept is often differentiated across more domains as individuals age. These three
theories of self-concept have been adopted as the framework for the current study, which
examined self-concept in the social and academic domains.
Purpose of the Current Study
The purpose of the current study was to gain insight about whether or not levels
of ADHD symptoms differ among groups of middle school students with negative,
accurate, or positive self-perceptions within the academic and social domains. This study
adds to the small body of literature suggesting that the presence of the PIB differs
between students with inattentive (IA), hyperactive/impulsive (HI), and depressive
symptoms and is the first study to investigate these symptoms on a full continuum.
Additionally, the current study replicated methodology (cf. Owens & Hoza, 2003) that
has been used in the past by including a criterion against which student reports can be
compared. This method is currently recommended as the best practice for measuring the
PIB (Owens et al., 2007). This study compared student self-report in the academic and
social domain to teacher ratings, and utilized achievement test scores as an additional
criterion for the academic domain. Exploring the presence of the PIB in adolescents is a
critical gap in the literature that must be addressed to understand whether the PIB
continues to be present beyond elementary school. Insight gained about the accuracy of
adolescent’s self-perceptions in the social and academic domains could be informative in
developing interventions to improve academic and social functioning for adolescents with
ADHD.
7
Definition of Key Terms
Attention-deficit/Hyperactivity Disorder (ADHD). ADHD is defined by the
core symptoms of inattention, hyperactivity, and impulsivity. A clinical diagnosis of
ADHD requires that a child, adolescent, or adult exhibit six or more symptoms in either
the area of inattention (IA) or hyperactivity-impulsivity (HI; American Psychiatric
Association [APA], 2000). For a diagnosis, these symptoms must be present before age
7, maladaptive, inconsistent with the behavior of others at their age level, and present for
at least six months to receive a diagnosis. ADHD is one of the most common mental
health problems when children enter school (APA, 2000; Carter, Wagmiller, Gray,
McCarthy, Horwitz, Briggs-Gowan, 2010). The current study explored specific ADHD
symptoms on a continuum rather than as a diagnostic label. This means that students
displaying all levels of inattentive or hyperactive/impulsive symptoms were included in
the sample (ranging from no symptoms present to clinically significant levels of
symptoms). This method has advantages over looking at only diagnostic levels of
symptoms as has been done in the majority of past literature. The primary advantage is
that all students, including those who may have elevated symptoms yet not meet
diagnostic criteria, are included. As additional rationale for the importance of
investigating the full range of ADHD symptoms rather than just diagnoses, recent
research suggests that students with sub threshold levels of ADHD symptoms may be
significantly at-risk for negative school outcomes and associated impairments (Bussing,
Mason, Bell, Porter, & Garvan, 2010).
Self-Concept. Self-concept is a multidimensional and hierarchical construct that
is used to refer to an individual’s self-evaluations of their competence in specific

8
domains, such as the academic, social, or behavioral domains (Harter, 1999).
Positive Illusory Bias (PIB). This term refers to the unwarranted overestimation
of self-competence, either in comparison to another group or compared to a criteria that is
meant to reflect one’s actual abilities (Owens et al., 2007).
Accuracy of Self-Perceptions. Accuracy of self-perceptions refers to the
discrepancy between student perceptions in a specific domain of functioning and an
indicator of actual competence in that domain (i.e., achievement test scores or teacher
ratings). Accuracy scores based on each of the indicators of competence are continuous
and range from positive to negative, but for the purpose of the current study students
were classified into three groups based on the accuracy of their self-perceptions. Students
who had self-perceptions that were lower than the external indicator were classified as
the “negative self-perception” group, students with self-perceptions that were similar to
the indicator of competence were classified as having “accurate self-perceptions,” and
students with self-perceptions that were higher than seemed warranted based on the
indicator of competence were classified as the “positive self-perception” groups.
Students in the positive self-perception group were exhibiting a positive illusory bias in
either the academic or social domain.
Elementary-Age Youth. Children in grades kindergarten through fifth grade are
referred to as elementary-age youth. These students are typically between the ages of 5
and 10. The more specific terms young children/early childhood were used to refer to
students in the primary grades (K-2), and middle childhood was used to refer to children
in the intermediate grades (3-5).
9
Adolescents. This term was used to refer to students in sixth through twelfth
grade. Middle school age students (grades 6-8) were referred to as young adolescents
and are typically between 11 and 14 years old, while high school youth (grades 9-12) are
referred to as older adolescents and are typically between the ages of 14 and 18.
Research Questions
1. How do young adolescents with negative, accurate, or positive perceptions of
academic competence differ on inattentive, hyperactive/impulsive, and depressive
symptoms, when teacher ratings are used as an indicator of actual academic
competence?
2. How do young adolescents with negative, accurate, or positive perceptions of
academic competence differ on inattentive, hyperactive/impulsive, and depressive
symptoms, when achievement test scores are used as an indicator of actual academic
competence?
3. How do young adolescents with negative, accurate, or positive perceptions of
social competence on inattentive, hyperactive/impulsive, and depressive symptoms,
when teacher ratings are used as an indicator of actual social competence?
Importance of the Current Study to School Psychology
Adolescents with symptoms of ADHD are at risk for numerous negative
outcomes, such as poor academic performance and negative peer relationships (Wolraich
et al., 2005). To further complicate the situation, during adolescence youth are
particularly vulnerable for decreased self-concept due to the increased importance of
academic and social factors for self-appraisals (Harter, 1999). Adolescents who
experience impairments in these two important areas, such as youth with symptoms of

10
ADHD, may be particularly at-risk for low self-perceptions (Barkley, 2006). It is
important to understand if the self-concept of adolescents with symptoms of ADHD align
with the positive illusions found in elementary-age youth with ADHD (Hoza et al., 2002).
It is critical that school psychologists gain an understanding of the academic and
social self-concept of adolescents with symptoms of ADHD because these domains are
often the target of assessment and intervention efforts. It has been suggested that self-
concept may be a factor in adherence to complex behavioral interventions (Hoza &
Pelham, 1995; Lindeman & Behm, 1999). Positive illusions may serve as a barrier to
treatment if children do not believe they are experiencing difficulty. Furthermore,
findings related to the PIB may suggest that the accuracy of self-report data from
adolescents with symptoms of ADHD may be questionable. An understanding of the PIB
will serve to enhance the effectiveness of school psychologists in assessing and
improving the academic and social functioning of adolescents with symptoms of ADHD.
Contributions to the Literature
The current study enhances the current knowledge base related to the PIB in
students with symptoms of ADHD by extending this research into middle-school aged
students. This research elucidates whether the PIB persists into adolescence for students
with symptoms of ADHD, using the methodology recommended by Owens and
colleagues (2007) to extend upon past literature. Additionally, this study adds to past
literature, which has only considered clinically significant levels of ADHD symptoms, by
examining the relationship between the accuracy of self-concept and the degree of
specific ADHD symptoms. Furthermore, the current study adds to the small body of
research suggesting that the presence of the PIB differs between students with inattentive

11
or hyperactive/impulsive symptoms and students with depressive symptoms. Exploring
the presence of the PIB in young adolescents with a full range of ADHD symptoms, and
determining if findings from studies of younger children with clinical levels of symptoms
can be replicated in this age group, is important to gain an understanding of the
developmental course of this intriguing phenomenon.
12
Chapter II: Review of the Literature
This chapter outlines the knowledge base of self-concept in adolescents with
Attention-deficit/Hyperactivity Disorder (ADHD) through a discussion of three important
elements: the construct of self-concept, an overview of ADHD, and past research on the
self-concept of children and adolescents with ADHD. A thorough understanding of the
definition, proposed models, and developmental nature of self-concept must be
established before this construct can be examined in terms of the accuracy of self-
perceptions for adolescents with symptoms of ADHD and depression. A review of
influential literature related to these three elements is then presented, and support for the
current study is provided through a discussion of self-concept within domains that are of
particular importance for adolescents with symptoms of ADHD.
Self-Concept
Terminology. Researchers investigating self-concept have struggled to find
uniform terminology to describe the way that individuals view themselves. Terms such
as self-perception, self-worth, self-esteem, and self-concept are among the many terms
used to describe how one perceives oneself or his/her overall competence. There is not
currently a consensus for the terminology to be used in the literature (Valentine, Dubois,
& Cooper, 2004). It has been suggested that self-esteem, global self-concept, and other
more general terms are nearly impossible to differentiate (Bracken, Bunch, Keith, &
Keith, 2000), and are too complex and comprehensive to have a meaningful relationship

13
with specific domains of functioning (e.g., academic, social, or physical domain;
Valentine et al., 2004). For the purpose of this review, the term self-concept has been
selected to represent different variations of domain specific self-perception that have
been used in past literature. The term self-concept has been selected because this is the
term that is commonly used to refer to self-evaluations of attributes in specific domains,
such as the academic, social, or behavioral domains (Harter, 1999). The
multidimensional nature of this term, which includes global and domain specific self-
concept (Bracken, 2009; Harter, 1999; Marsh, 1994), will allow for a focus on domains
that are salient for adolescents with ADHD.
Global versus Domain Specific Self-Concept. Early research on self-concept
focused on a unidimensional construct of self-evaluation that represents individuals’
overall feelings toward themselves, often referred to as self-esteem (Coopersmith, 1967;
Marsh, 2008). Unidimensional models of self-concept focus on a person’s overall sense
of his/her worth as a person or their feelings averaged across multiple domains (Harter,
1999). These early conceptions led to the widespread use of measures designed to
evaluate self-concept through averaging an individual’s responses to a variety of
questions into a single score (e.g., Coopersmith, 1967; Piers & Harris, 1964; Rosenberg,
1979). Some of the instruments using a single global self-concept score continue to be
widely used as measures of overall perceived competence (Marsh, 2008).
In response to the widespread use of self-concept measurement tools that viewed
self-concept as a single score, Shavelson, Hubner, and Stanton (1976) provided an initial
multidimensional model of self-concept. This seminal work posited that self-concept
must be viewed as a domain specific construct that is influenced by the environment. The
14
dissemination of this model led to widespread agreement among psychological
researchers about the importance of investigating self-concept within specific contexts
(Bracken, 2009). Since this influential contribution, many theories have emerged that
view self-concept as a multidimensional construct (Bracken, 2009; Harter, 1999; Marsh,
1990). Multidimensional self-concept refers to self-perceptions that are differentiated
into specific domains (e.g., academic, behavioral, social, physical appearance).
Considering self-concept as a multidimensional construct accounts for differences that
are inherent across domains and allows individuals to judge their adequacy differently
across contexts. Current theorists suggest that self-concept is best summarized using a
profile of scores across different domains rather than as a single aggregate score (Harter,
1999; Marsh & Hattie, 1996). It is important to note that multidimensional theories of
self-concept often include self-esteem or global self-concept as a separate dimension that
focuses on a person’s general contentment with themselves (Manning, Bear, & Minke,
2006). Models that propose multiple levels of self-concept are considered to be
hierarchical (Harter, 1999). Global self-concept is often viewed as encompassing self-
evaluations from multiple domains and is therefore viewed as the broadest and highest
level of self-concept within hierarchical models (Bracken & Howell, 1991; Harter, 1999).
Multidimensional Theories . Current theorists are not in agreement about
exactly how the distinct domains of self-concept are defined. Some theorists believe that
it is important to further disaggregate contexts within the academic and social domains
(Marsh, 1993, 1994) to include evaluations related to subjects such as mathematics or
reading, while other researchers include age-dependent domains such as job competence
for adolescents and adults (Harter, 1999). Three dominant multidimensional theories

15
have emerged to explain self-concept in children, adolescents, and adults (Bracken, 1992;
Harter, 1999; Marsh, 1988). The model proposed by Marsh is the most aligned with the
multidimensional perspective originally proposed by Shavelson and colleagues (1976),
Bracken’s model is oriented around behavioral principles, and Harter’s model focuses on
cognitive and social factors and emphasizes the importance of developmental
considerations. The following section will explain these theories that have a common
focus on multidimensional self-concept, as well as examine the unique contributions of
each theory.
Marsh. Herbert Marsh’s conceptualization of self-concept is highly influenced
by the seminal work of Shavelson and colleagues (1976). According to Shavelson’s
model, the definition of self-concept must include seven criteria: stable, structured,
hierarchical, multiple domains, developmental, evaluative, and must be distinguishable
from other constructs such as self-esteem (Crain & Bracken, 1994; Shavelson et al.,
1976). Marsh incorporates each of these aspects into his current model, which is often
referred to as the Marsh/Shavelson model (Marsh & Shavelson, 1985). This model views
self-concept as being highly differentiated across domains, and evaluates academic self-
concept within specific subject areas (Marsh, 1990).
Marsh’s hierarchical/multidimensional view of self-concept considers evaluations
of the “general self” (Marsh’s terminology for global self-concept) to be at the top of the
hierarchy. Underneath the general self is a broad intermediate level that includes
academic and nonacademic self-concepts (Marsh & Hattie, 1996). Academic and non-
academic self concept are further broken down into physical abilities and peer relations
(nonacademic domain), and verbal and math (academic domain). This model is
16
considered to be an integration between unidimensional and multidimensional
conceptions of self-concept, because both domain-specific and global evaluations are
included (Marsh, 2008).
Marsh accounts for changes in the domains of interest as children age, and this
model is therefore considered to be developmental (Marsh, 1990). According to this
model, children as young as kindergarten are able to evaluate their competence across
multiple domains such as academic versus nonacademic (Marsh, Debus, & Bornholt,
2005); however, Marsh and colleagues (2005) acknowledge that as children age they are
more likely to differentiate their self-evaluations across more specific contexts, such as
distinguishing between their math and verbal abilities.
Marsh proposes that a specific domain of self-concept is more informative than
utilizing global self-concept because this has been shown to be related more closely with
actual outcomes (Marsh, 2008). For example, Marsh (1992) has found that performance
in specific subject areas is highly correlated with self-concept in that subject area, and
reasonably uncorrelated with global self-concept. Marsh’s model and the research
validating this model (Marsh, Byrne, & Shavelson, 1988) highlight the importance of
considering self-concept as a multidimensional construct, with two levels of domain
specific evaluations further differentiated into core subject areas (i.e., verbal and math),
rather than focusing solely on a broad academic domain or global evaluations. However,
Marsh’s model does not account for differentiation in non-academic areas beyond
physical abilities and peer relationships; therefore, this model may fail to acknowledge
the importance of domains such as family, athletic competence, or behavioral conduct

17
(Bracken, 2009; Harter, 1999) that are suggested to be important for child and adolescent
self-concept.
Bracken. Bruce Bracken’s model of self-concept is linked to behavioral
principles (Bracken, 2009). This model emphasizes the importance of learning
experiences, achievement and failure, and others’ reactions to behavior for the
development of self-concept (Bracken, 2009). In line with Bracken’s behavioral
orientation, self-concept is viewed as “a learned, organized response pattern that is
acquired and maintained through an individual’s action upon and reactions to stimuli in
various environmental contexts” (Crain & Bracken, 1994, p. 497).
Bracken’s model is similar to other contemporary models in that self-concept is
viewed as multidimensional, with specific domains representing the differing contexts.
Bracken views self-concept as being differentiated across six context-dependent domains
including academic, affect, competence, family, physical, and social self-concept.
Bracken’s model is also hierarchical and emphasizes the importance of considering
global self-concept. Global self-concept is viewed as the primary level of self-concept,
which is purported to encompass a portion of each of the six distinct yet correlated
secondary domains (Bracken, 2009; Bracken & Howell, 1991). Bracken emphasizes that
domain specific self-concept is more meaningful than global self-concept for examining
the relationship between self-concept and outcomes within a specific domain (Bracken et
al., 2000).
Bracken’s model deemphasizes the developmental nature of self-concept that is
central to other self-concept theories (e.g., Harter, 1982; Marsh, 1992). Bracken believes
that each of the six proposed domains is relevant for children, adolescents, and adults
18
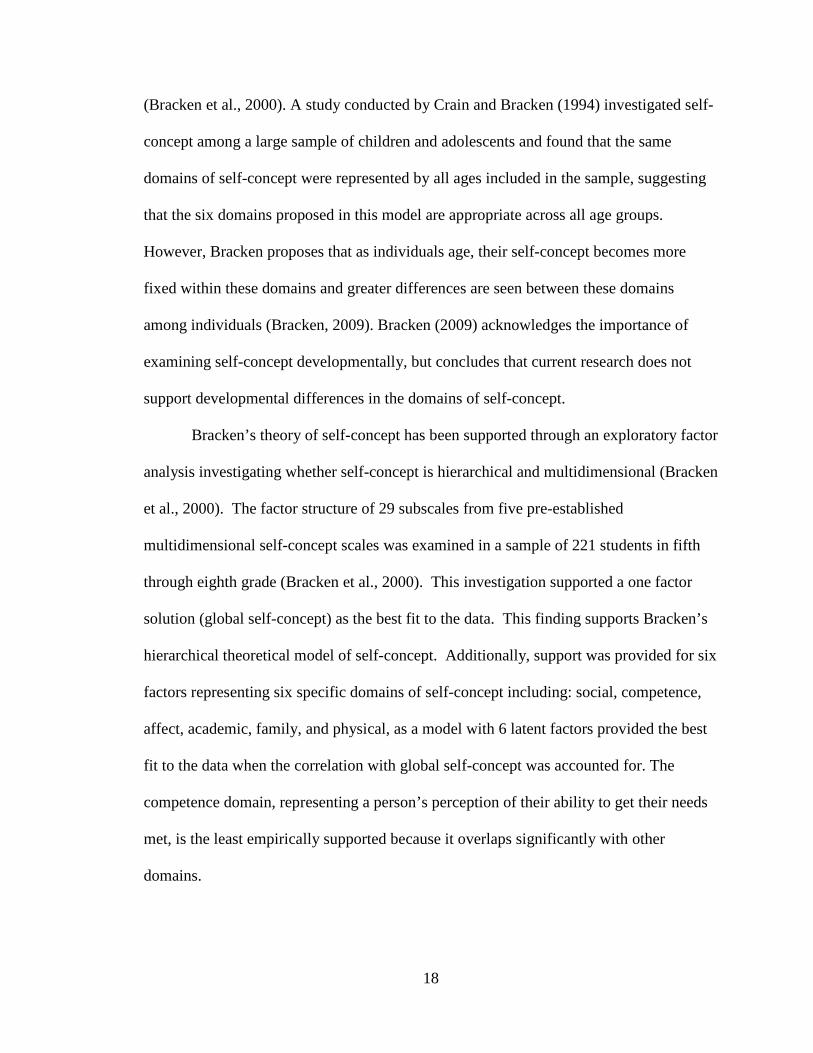
(Bracken et al., 2000). A study conducted by Crain and Bracken (1994) investigated self-
concept among a large sample of children and adolescents and found that the same
domains of self-concept were represented by all ages included in the sample, suggesting
that the six domains proposed in this model are appropriate across all age groups.
However, Bracken proposes that as individuals age, their self-concept becomes more
fixed within these domains and greater differences are seen between these domains
among individuals (Bracken, 2009). Bracken (2009) acknowledges the importance of
examining self-concept developmentally, but concludes that current research does not
support developmental differences in the domains of self-concept.
Bracken’s theory of self-concept has been supported through an exploratory factor
analysis investigating whether self-concept is hierarchical and multidimensional (Bracken
et al., 2000). The factor structure of 29 subscales from five pre-established
multidimensional self-concept scales was examined in a sample of 221 students in fifth
through eighth grade (Bracken et al., 2000). This investigation supported a one factor
solution (global self-concept) as the best fit to the data. This finding supports Bracken’s
hierarchical theoretical model of self-concept. Additionally, support was provided for six
factors representing six specific domains of self-concept including: social, competence,
affect, academic, family, and physical, as a model with 6 latent factors provided the best
fit to the data when the correlation with global self-concept was accounted for. The
competence domain, representing a person’s perception of their ability to get their needs
met, is the least empirically supported because it overlaps significantly with other
domains.

19
Harter. The focus of this model is on cognitive aspects of the self and the
importance that individuals place on specific domains, a concept that was first introduced
by William James (1890). Harter views the self as being a cognitive construction that
aligns with the individual’s stage of cognitive development (Harter, 2006). This model
views the construction of self as a continuous process with each level influencing the next
rather than as a stage-like progression (Harter, 1999). Furthermore, Harter (1999)
suggests that social influences are a vehicle for shaping self-concept. Harter’s model
incorporates Cooley’s (1902) early notion of the looking glass self, the idea that people
view themselves by internalizing their perceptions of how others view them. Harter
(1999) purports that self-concept is strongly influenced by consideration of the perceived
opinions of significant others, such as parents, teachers, or caregivers. Additionally, the
values of the larger society are thought to be incorporated into the self-perceptions of
children, adolescents, and adults (Harter, 1999).
This model of self-concept is also hierarchical in nature, with global self-worth at
the top of the hierarchy. Unlike other theorists who view global self-concept as
correlated with all of the specific domains of self-concept (Bracken, 2009), Harter
believes that it is important to ask about self-worth directly in order to obtain an
evaluation of the individual’s feelings of overall worth as a person. This model allows
for global self-worth to be examined as a construct that is separate from domain specific
self-evaluations and allows for relationships to be examined between global and domain
specific self-concept. In contrast to other hierarchical models, Harter emphasizes that the
influence of domain specific self-concepts on global self-worth will not be the same for
each person and that different hierarchies may exist for each individual. The second tier
20
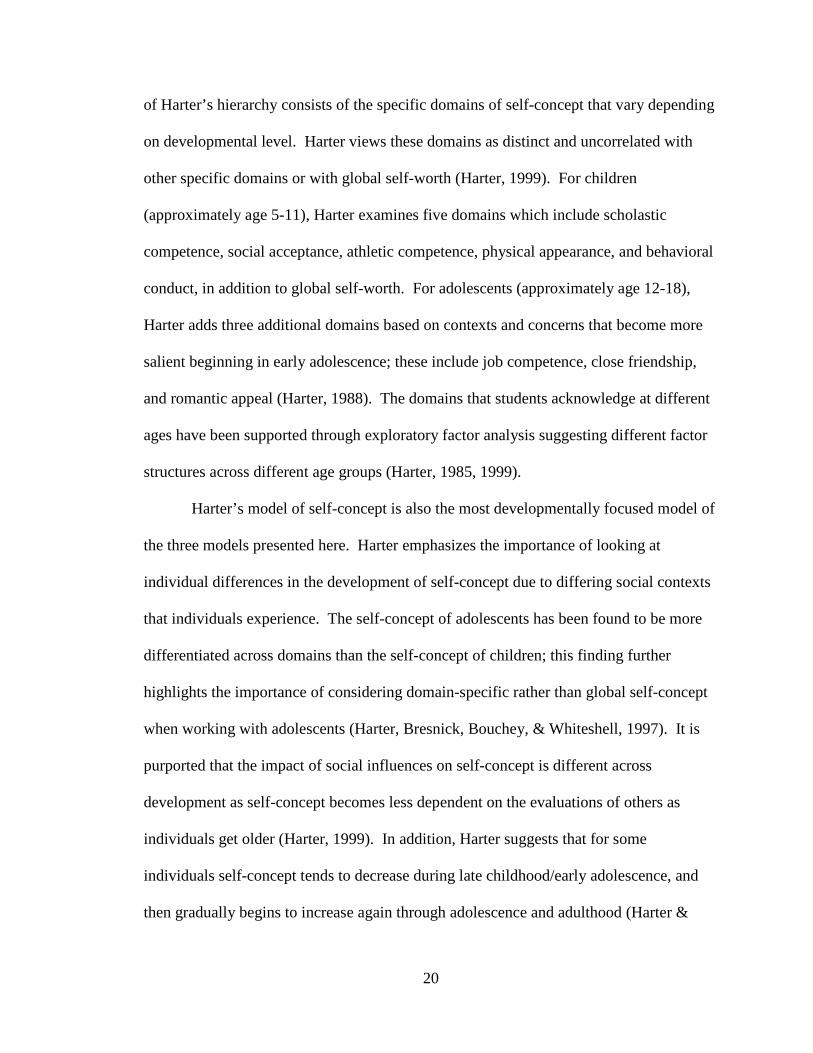
of Harter’s hierarchy consists of the specific domains of self-concept that vary depending
on developmental level. Harter views these domains as distinct and uncorrelated with
other specific domains or with global self-worth (Harter, 1999). For children
(approximately age 5-11), Harter examines five domains which include scholastic
competence, social acceptance, athletic competence, physical appearance, and behavioral
conduct, in addition to global self-worth. For adolescents (approximately age 12-18),
Harter adds three additional domains based on contexts and concerns that become more
salient beginning in early adolescence; these include job competence, close friendship,
and romantic appeal (Harter, 1988). The domains that students acknowledge at different
ages have been supported through exploratory factor analysis suggesting different factor
structures across different age groups (Harter, 1985, 1999).
Harter’s model of self-concept is also the most developmentally focused model of
the three models presented here. Harter emphasizes the importance of looking at
individual differences in the development of self-concept due to differing social contexts
that individuals experience. The self-concept of adolescents has been found to be more
differentiated across domains than the self-concept of children; this finding further
highlights the importance of considering domain-specific rather than global self-concept
when working with adolescents (Harter, Bresnick, Bouchey, & Whiteshell, 1997). It is
purported that the impact of social influences on self-concept is different across
development as self-concept becomes less dependent on the evaluations of others as
individuals get older (Harter, 1999). In addition, Harter suggests that for some
individuals self-concept tends to decrease during late childhood/early adolescence, and
then gradually begins to increase again through adolescence and adulthood (Harter &

21
Pike, 1984); however, for others self-concept remains relatively stable over time despite
more differentiation between domains. Harter’s model emphasizes individual differences
in the development of self-concept (Harter, 2006).
Support for Harter’s five domains of self-concept for children is provided through
an exploratory factor analysis investigating each of the five proposed domains of self-
concept as a separate factor for three samples of students ranging from fifth through
eighth grade (Harter, 1985). Across three distinct samples (students ranging from 5th to
8th grade) a clear five factor pattern was identified for domain specific self-concept, with
low correlations between factors. The supported factors include scholastic competence,
social acceptance, athletic competence, physical appearance, and behavioral conduct.
There is also evidence that all domains are correlated with global self-worth, with
physical appearance being the most highly correlated (at a moderately high level: .62 -
.73; Harter, 1985).
Comparison of three models. The similarities between the three models
presented here are quite evident. Each model considers self-concept to be a hierarchical
and multidimensional construct with a global evaluation at the apex of the hierarchy.
Additionally, each of these theorists emphasizes that the domains of self-concept become
further differentiated as children age. These theorists generally agree about the domains
that should be included within the model. Each theorist considers domains related to
academic, social, and physical evaluations, although they do not agree on the level of
specificity required for describing these domains.
Despite the vast similarities, each model has unique contributions. Marsh’s
model contains an intermediate level of self-concept that is not included in other models.

22
Additionally, Marsh has demonstrated that academic self-concept can be further
differentiated into core subject areas (verbal and math; Marsh et al., 1988), while other
theorists consider all academic subject areas to be encompassed within their scholastic
competence or academic domains (Bracken, 1992; Harter, 1999). However, there is a
lack of empirical support for the domains that are differentiated beyond the math and
verbal domains and uncertainty about where other academic areas are accounted for
within Marsh’s model (Marsh, 1990). Additionally, some theorists believe that specific
domains of self-concept are correlated (Bracken, 2009), while others view domains as
being correlated only at low levels (Harter, 1985; Marsh & Hattie, 1996).
The current study focuses on self-concept in two specific domains of functioning,
social and academic, which have been supported by each of these three theories
(Bracken, 2009; Harter, 1999; Marsh, 2008). The social acceptance and scholastic
competence domains, as measured by the Self-Perception Profile for Children (Harter,
1985), were examined in this study as these domains are related to the primary challenges
frequently experienced by adolescents with ADHD. Additionally, these domains are
linked to important outcomes such as academic achievement and the development of
adequate social skills (Bracken, 2009; Trautwein et al., 2006), which have particular
relevance to the school setting. These domains were viewed within a multidimensional
and hierarchical model of self-concept, with particular attention to the developmental
focus and consideration of individual differences that are central to Harter’s model. The
scholastic or academic domain examines the student’s perception of their overall
academic abilities and performance across multiple subject areas (Harter, 1985). The

23
social acceptance domain evaluates the degree to which the student feels as though they
are popular, liked, and accepted by their peers (Harter, 1985).
Developmental Findings. There is evidence that self-concept is a developmental
construct which should be evaluated differently for different age-groups (Harter, 1999;
Marsh et al., 2005). Similarities among the self-concept of individuals at a particular
developmental level are suggested to be directly related to cognitive abilities (Harter,
1999). The numerous changes in self-concept from early childhood to adolescence will
be highlighted below.
Childhood. During their early years, a child’s self-concept is often overly
positive, which is attributed to an observed disconnect between the child’s desired and
actual self (Harter & Pike, 1984). Overly positive self-evaluations are considered to be
normative between the ages of four and seven (Manning, Bear & Minke, 2006) and are
suggested to be adaptive at this age due to increased task persistence in the face of failure
(Taylor & Brown, 1988). At this point in development, children have not developed the
skills that are required to alter their self-evaluations based on social comparisons or
feedback from others (Ruble & Dweck, 1995). Additionally, young children (those in the
primary grades) are not able to acknowledge that they can have one feeling and another
simultaneously, and have difficulties differentiating between their abilities in different
contexts or domains (Harter & Pike, 1984). During middle childhood (intermediate
grades), children begin to develop a greater reliance on feedback from others, which
leads to more realistic self-perceptions (Harter, 1999; Marsh, 1994). Consequently, self-
perceptions become less positive and more realistic as children move from early to
middle childhood (Harter & Pike, 1984). Middle childhood (approximately the ages of 8-
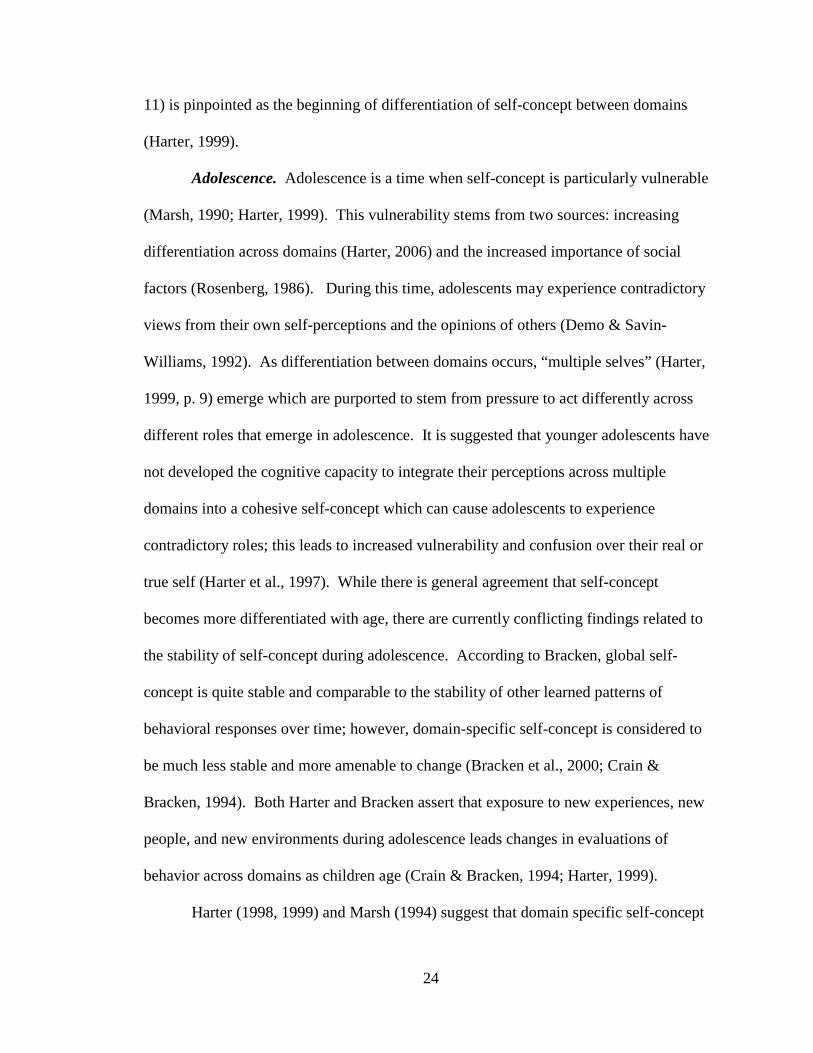
24
11) is pinpointed as the beginning of differentiation of self-concept between domains
(Harter, 1999).
Adolescence. Adolescence is a time when self-concept is particularly vulnerable
(Marsh, 1990; Harter, 1999). This vulnerability stems from two sources: increasing
differentiation across domains (Harter, 2006) and the increased importance of social
factors (Rosenberg, 1986). During this time, adolescents may experience contradictory
views from their own self-perceptions and the opinions of others (Demo & Savin-
Williams, 1992). As differentiation between domains occurs, “multiple selves” (Harter,
1999, p. 9) emerge which are purported to stem from pressure to act differently across
different roles that emerge in adolescence. It is suggested that younger adolescents have
not developed the cognitive capacity to integrate their perceptions across multiple
domains into a cohesive self-concept which can cause adolescents to experience
contradictory roles; this leads to increased vulnerability and confusion over their real or
true self (Harter et al., 1997). While there is general agreement that self-concept
becomes more differentiated with age, there are currently conflicting findings related to
the stability of self-concept during adolescence. According to Bracken, global self-
concept is quite stable and comparable to the stability of other learned patterns of
behavioral responses over time; however, domain-specific self-concept is considered to
be much less stable and more amenable to change (Bracken et al., 2000; Crain &
Bracken, 1994). Both Harter and Bracken assert that exposure to new experiences, new
people, and new environments during adolescence leads changes in evaluations of
behavior across domains as children age (Crain & Bracken, 1994; Harter, 1999).
Harter (1998, 1999) and Marsh (1994) suggest that domain specific self-concept

25
of most adolescents has a trajectory that is a flat u-shape, with an initial decrease in
pre/early adolescence followed by a period of stability and then gradual increases through
late adolescence and adulthood. Research indicates that there is a slight decline in self-
concept during early adolescence (age 11-13), which is followed by gradual increases in
both global and domain-specific self-concept (Marsh, Smith, Marsh, & Owens, 1988).
Some researchers associate this initial decrease in self-concept with the transition to
middle or junior high school (Wigfield, Eccles, MacIver, Reuman, & Midgley, 1991).
Eighth grade has been suggested to mark the beginning of a gradual increase in self-
concept that continues through late adolescence (Cairns, McWhirter, Duffy, & Barry,
1990; Demo & Savin-Williams, 1992). These findings suggest the importance of the
school environment for shaping the global and domain specific self-concept of children
and adolescents.
There is some evidence that contradicts research indicating a u-shaped trajectory
of self-concept for children and adolescents. In a large cross-sectional study of 2,501
students in fifth through twelfth grade, Crain and Bracken (1994) found that younger
students (age ten and eleven) had significantly higher global self-concepts than fifteen
and sixteen year olds. Additionally, no significant differences in levels of domain
specific self-concept were detected across the age group. These authors also found that
students begin to highly differentiate their self-concept across domains around age 13
(Crain & Bracken, 1994).
Few researchers have directly explored the developmental nature of domain-
specific self-concept in adolescence (Cole, Maxwell, Martin, Peeke, Seroszynski, Tram et
al., 2001; Shapka & Keating, 2005). Most studies examining adolescents have examined
26
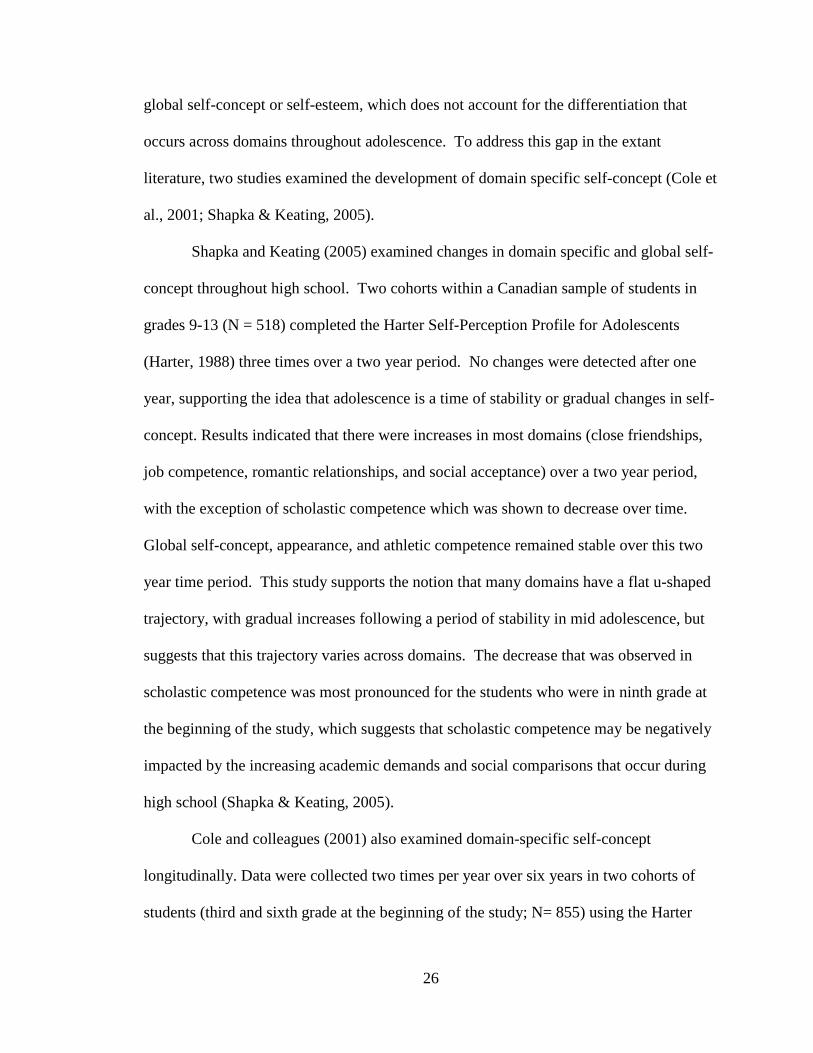
global self-concept or self-esteem, which does not account for the differentiation that
occurs across domains throughout adolescence. To address this gap in the extant
literature, two studies examined the development of domain specific self-concept (Cole et
al., 2001; Shapka & Keating, 2005).
Shapka and Keating (2005) examined changes in domain specific and global self-
concept throughout high school. Two cohorts within a Canadian sample of students in
grades 9-13 (N = 518) completed the Harter Self-Perception Profile for Adolescents
(Harter, 1988) three times over a two year period. No changes were detected after one
year, supporting the idea that adolescence is a time of stability or gradual changes in self-
concept. Results indicated that there were increases in most domains (close friendships,
job competence, romantic relationships, and social acceptance) over a two year period,
with the exception of scholastic competence which was shown to decrease over time.
Global self-concept, appearance, and athletic competence remained stable over this two
year time period. This study supports the notion that many domains have a flat u-shaped
trajectory, with gradual increases following a period of stability in mid adolescence, but
suggests that this trajectory varies across domains. The decrease that was observed in
scholastic competence was most pronounced for the students who were in ninth grade at
the beginning of the study, which suggests that scholastic competence may be negatively
impacted by the increasing academic demands and social comparisons that occur during
high school (Shapka & Keating, 2005).
Cole and colleagues (2001) also examined domain-specific self-concept
longitudinally. Data were collected two times per year over six years in two cohorts of
students (third and sixth grade at the beginning of the study; N= 855) using the Harter

27
Self-Perception Profile (Harter, 1985, 1988). This study evaluated behavioral, physical,
and sports competence, in addition to scholastic and social competence. Behavioral
competence decreased in elementary school, and then gradually increased during middle
school and high school. Males’ perceptions of their physical appearance increased from
elementary school to middle school, while female physical self-concept decreased;
however, both males and females had increasing physical self-concept during high
school. Sports competence was shown to slightly decrease during both middle and high
school, with females’ decreasing more than males. Cole and colleagues found that
participants’ academic competence ratings gradually increased throughout the elementary
years, followed by a drop during the transition to middle school. However, the transition
to high school was marked by an increase in academic self-concept followed by a period
of relative stability in this domain. This provides support for a u-shaped trajectory in the
academic domain. Conversely, social acceptance was marked by a positive trajectory
throughout the elementary years. During the transition to middle school, social self-
concept was shown to continue to increase at a very gradual rate. Furthermore, social
self-concept during the high school years remained relatively stable (Cole et al., 2001).
These studies demonstrate the importance of considering self-concept at a domain-
specific level for adolescents because each domain may have its own unique
developmental trajectory related to cognitive and social influences.
It is imperative to understand the development of self-concept due to the
important outcomes that are shown to be related to self-concept in adolescents. First,
individuals with positive self-views tend to have higher levels of satisfaction with their
lives (McCullough, Huebner, & Laughlin, 2000). Social self-concept is important for
28
initiating and engaging in positive social interactions, which are seen as a key component
of mentally healthy children, adolescents, and adults (Bracken, 2009). Additionally,
there is evidence that there is a strong reciprocal relationship between academic success
and higher levels of academic self-concept (Trautwein et al., 2006). Considering that
adolescence is a developmental period marked by increased demands in the academic and
social domains, these domains are crucial to highlight. This is of particular importance
for populations that may exhibit academic and social impairments, such as those
experienced by children and adolescents with ADHD. The self-concept of children with
ADHD has been explored in past literature, and findings do not seem to align with
theories that purport that self-concept is high when frequent success and feedback from
the environment is experienced (Harter, 1999). The self-concept of children with ADHD
tends to remain high despite frequent experiences with failure (Owens et al., 2007). The
following section will outline the core symptoms and characteristics of this disorder, as
well as the associated impairments, before presenting unique findings related to the self-
concept of this population.
Attention-Deficit/Hyperactivity Disorder
ADHD is one of the most common childhood mental health diagnoses, impacting
five to ten percent of school-age students in the United States (Scahill & Schwab-Stone,
2000). Therefore, there are numerous students with ADHD within every school, and
approximately one student with ADHD in every classroom. This review will provide a
description of ADHD and the diagnostic criteria for the disorder, highlight the dominant
symptoms, describe comorbidity with other disorders, emphasize the persistence of
29
ADHD from childhood to adolescence, and discuss the outcomes associated with the
dominant symptoms of ADHD.
Diagnosis. A clinical diagnosis of ADHD requires that a child, adolescent, or
adult exhibit six or more symptoms in either the area of inattention (IA) or hyperactivity-
impulsivity (HI; American Psychiatric Association [APA], 2000). These symptoms must
be maladaptive, inconsistent with the behavior of other’s at their age level, and be present
for at least six months to receive a diagnosis. Examples of IA symptoms include
difficultly following instructions, sustaining attention, being forgetful, or easily
distractible. Examples of HI symptoms include problems with waiting one’s turn, talking
excessively, interrupting, and fidgeting. Hyperactivity and impulsivity are grouped
together due to past research suggesting that they are a single behavioral dimension
(Achenbach & Edelbrock, 1983), which some researchers have labeled as disinhibition
(Barkley, 2006). A diagnosis of ADHD requires that at least some of these symptoms are
present and problematic before the age of seven and that functional impairments
stemming from these symptoms are present in multiple life domains (e.g., school and
home). According to the Diagnostic and Statistical Manual, Fourth Edition, Text
Revision (DSM-IV-TR; APA, 2000), an ADHD diagnosis is currently separated into
three different subtypes depending on the specific symptoms that are present. These
include: 1) ADHD predominantly inattentive type (IA; presenting 6 or more symptoms of
inattention and less than 6 symptoms of hyperactivity-impulsivity), 2) ADHD
predominantly hyperactive-impulsive type (HI; 6 or more symptoms of hyperactivity-
impulsivity and less than 6 symptoms of inattention), and 3) ADHD combined type (C; 6
or more symptoms in both areas). Despite the acknowledged distinction between the two

30
subtypes of the disorder within the DSM-IV-TR, there is some debate about whether the
IA subtype is a disorder that is distinct from ADHD (Barkley, 2001). Despite the debate,
it seems that most researchers agree that there are differences between the symptoms and
impairments experienced across subtypes (Gaub & Carlson, 1997). Furthermore, recent
research suggests that the impairments associated with ADHD symptoms are present
among students who display sub threshold levels of ADHD symptoms and therefore do
not meet diagnostic criteria (Bussing et al., 2010). For this reason it is important to
consider a full range of ADHD symptoms.
Primary Characteristics of ADHD.
Inattention. Students displaying predominantly IA symptoms display a different
behavioral manifestation of ADHD than their HI or C subtype counterparts. Socially,
children with the IA subtype are often characterized as appearing withdrawn, sluggish,
and passive (McBurnett, Pfiffner, & Frick, 2001; Milich, Balentine, & Lynam, 2001).
Shyness has also been found to be prevalent among this population (Hodegens, Cole, &
Boldizar, 2000). Additionally, IA behaviors have been shown to be highly related to
academic difficulties (Barkley, 2006). Some research has shown that students with the
predominantly IA subtype of ADHD have greater academic impairments and a higher
percentage of comorbid learning disabilities than students with other ADHD subtypes
(Gaub & Carlson, 1997). IA is demonstrated through difficulties with sustaining effort
and attention to tasks, particularly tasks that are uninteresting or repetitive (Barkley,
2006). Distractibility is also a common area of difficulty for children with the inattentive
subtype of ADHD; many students with ADHD are easily distracted by internal stimuli,
such as thoughts or feelings, as well as external distractions (Barkley, 2006). Shifting
31
from one task to the next and failing to follow through with activities are also associated
with IA (Wolraich et al., 2005). Prevalence rates of comorbidity with other externalizing
disorders, including Conduct Disorder (CD) and Oppositional Defiance Disorder (ODD)
have been shown to be lower for the IA ADHD subtype compared to the other ADHD
subtypes (Crystal, Ostrander, Chen, & August, 2001). Children with the IA subtype have
been shown to have more internalizing symptoms, including higher rates of depression
and social withdrawal than children with other subtypes of ADHD (Carlson & Mann,
2000). Interestingly, IA has been found to be the most common presenting symptom for
adolescents with ADHD, as other symptoms (such as HI) may change or become less
visible as students reach adolescence (Wolraich et al., 2005).
Hyperactivity/Impulsivity. The combination of the HI symptoms, as seen in the
DSM-IV-TR, is the result of factor-analytical studies indicating that hyperactivity and
impulse control make-up a single behavioral dimension (Achenbach & Edelbrock, 1983;
DuPaul, Anastopoulos, Power, Reid, Ikeda, & McGoey, 1998). This combination is
particularly important when considering ADHD in older students, because difficulties
with hyperactivity at a young age may later be reflected through poor impulse control or
self-monitoring skills (Smith, Barkley, & Shapiro, 2007). Manifestations of impulsive
symptoms include quick or careless responding to questions or requests, failure to
consider consequences, interrupting others, difficulty taking turns or waiting, and
problems with delaying gratification (Barkley, 2006). Hyperactivity is directly related to
difficulties with impulsivity and is often considered to be a failure to regulate activity
levels which results in higher rates of motor activity (Berlin & Bohlin, 2002).
Impulsivity is often thought of as an underlying factor that contributes to the other core

32
symptoms of ADHD and this symptom, often called disinhibition, is considered the best
marker to distinguish students with ADHD from students without the disorder (Barkley,
2006). Children who meet the diagnostic criteria for the HI subtypes tend to have more
externalizing behavior and peer problems than those with an IA subtype (Gaub &
Carlson, 1997). However, it has been shown that these students often do not exhibit high
levels of internalizing symptoms or deficits in academic skills like those experienced by
their IA classmates (Gaub & Carlson, 1997).
Combined. Individuals with the combined subtype (C) of ADHD, defined as the
presence of 6 or more symptoms of inattention and hyperactivity/impulsivity, have been
shown to behave similarly to those with the HI subtype and exhibit comparable
impairments (Barkley, 2003). However, students with the ADHD-C subtype were found
to display more significant academic difficulties, in addition to behavioral impairments
associated with HI symptoms, than students with the HI subtype (Lahey, Applegate,
McBurnett, Biederman, Greenhill, Hynd et al., 1994).
Comorbidity. Students with ADHD symptoms are often found to exhibit clinical
levels of symptoms of other psychological disorders. The ADHD-C subtype has been
found to demonstrate the highest levels of comorbidity among all three ADHD subtypes
(Barkley, 2003). Comorbidity is found with both internalizing and externalizing disorders
and is prevalent across all age groups. Estimates of the rates of comorbidity in samples
of children with ADHD range from 44% in community samples (Szatmari, Offord, &
Boyle, 1989) to 87% in clinical samples (Kadesjö & Gillberg, 2001). Oppositional
Defiance Disorder (ODD) is the most common comorbid diagnosis, and Conduct
Disorder (CD) is also common among students with ADHD. Past research indicates that

33
between 25-55% of adolescents meeting criteria for ADHD also display antisocial
behavior associated with ODD and CD (Barkley, 2006). It has been suggested that the
presence of ADHD in early childhood is the greatest risk factor for later antisocial
behavior and diagnosis of CDD or ODD (Lahey, McBurnett, & Loeber, 2000).
Depression has also been identified as occurring at high rates within individuals
with ADHD; 25-30% of children with ADHD display depressive symptoms (Barkley,
2006; Biederman, Mick, & Faraone, 1998). It is suggested that the prevalence of
comorbid internalizing disorders increases with age, with the rate of 25 to 30 percent of
children with ADHD displaying comorbid anxiety/depression increasing up to
approximately 50 percent during adolescence (Barkley, 2006). One study including
students with ADHD between 9 and 16 years old found that 48% of their sample
exhibited comorbid depression (Bird, Gould, & Staghezza, 1993). Levels of depression
surpassed the levels of comorbid ODD/CD (36%) and comorbid anxiety disorder (36%)
found within this sample (Bird et al., 1993). This rate suggests a significant increase in
depressive symptoms in adolescence compared to samples of younger children with
ADHD (Wolraich et al., 2005).
Developmental Considerations. Recent research has concluded that 65% of
childhood diagnoses of ADHD persist into adolescence (Wolraich et al., 2005), with
ranges from 43-80% (Smith et al., 2007). It has been suggested that the notion that
ADHD is outgrown may have stemmed from the fact that the symptoms of ADHD
change as children become adolescents, with hyperactive symptoms being less prevalent
and less visible (Wolraich et al., 2005). Some suggest that hyperactive symptoms are just
an early manifestation of problems with impulsivity and disinhibition, which would
34
explain why hyperactive behaviors decrease with age (Smith et al., 2007). While the
levels of motor activity may decrease with age, this difficulty with inhibiting responses
will likely manifest as a deficit in self-monitoring and regulation during adolescence
(Barkley, 2006).
These deficits related to disinhibition often lead to impairments in the academic
and social domains for children and adolescents with ADHD; these impairments are
associated with increasing academic and social demands that accompany puberty and the
transition into middle school and high school (Wolraich et al., 2005). Academics become
more challenging and demanding and higher levels of independence are expected during
late childhood and adolescence. Additionally, relationships with peers become
increasingly important during this developmental period (Brown, 2004). Symptoms of
ADHD may exacerbate the challenges associated with the developmental period of
adolescence. Students with symptoms of ADHD tend to have lower academic
achievement and more social difficulties than adolescents without symptoms of ADHD
(Barkley, 2006).
Academic Outcomes. Adolescents with ADHD tend to have difficulties that can
significantly impact their school performance; these students are three times more likely
than their peers to have been retained and are also at higher-risk for dropping out of
school (Barkley, Fischer, Edelbrock, & Smallish, 1990). Underachievement has been
found to be a common problem for adolescents with ADHD. It is estimated that thirty to
forty-five percent of children with ADHD have received special education services
related to their academic impairments by the time they reach adolescence (Barkley,
2006). Eighty percent of children with ADHD are two grades or more below grade level

35
by the time they are eleven years old (Cantwell & Baker, 1992). While children with IA
symptoms are more likely to exhibit academic skill deficits, children and adolescents
presenting higher levels of HI symptoms tend to have difficulties with behavioral aspects
of academic performance such as motivation, task persistence, or productivity (Barkley,
2003). Difficulties with productivity for children and adolescents with ADHD are a
primary contributor to their academic impairments and this under-productivity is likely
related to underdeveloped executive functioning skills, such as self-monitoring (Barkley,
2003). Learning disabilities are also common in students with ADHD, with
approximately half of special education students with ADHD qualifying as having a
learning disability (Shnoes, Reid, Wagner, & Marder, 2006).
Other common academic difficulties experienced by adolescents with ADHD
include the tendency to procrastinate, be disorganized, become distracted easily, have
difficulty with completing projects, and receive poor grades (Wolraich, et al., 2005).
These problems are more pronounced on tasks that require sustained effort and attention
and are not of high interest to these students (Barkley, 2006). The increased academic
demands, more independence and responsibility for work completion, switching between
a variety of teachers and subjects, and increased volume of homework associated with
middle school and high school can present significant challenges for adolescents with
ADHD (Wolraich et al., 2005). The grades of students with ADHD tend to decline
throughout each school year during middle school, with grades at the beginning of the
year being higher than the end of the year as the demands become more intense (Shultz,
Evans, & Serpell, 2009).
Social Outcomes. Because of the value that is often placed on peer interactions

36
during adolescence, problems with peers have the potential to become most pronounced
during this developmental period for students with and without ADHD (Brown, 2004).
This is likely related to the increasing importance of peer acceptance during this time, as
well as the changes to the social environment associated with achieving a new level of
independence (Wolraich et al., 2005). Poor social skills contribute to the social
difficulties of children with ADHD. While some children are able to effectively learn to
manage their impulsive behavior in social settings by the time they reach adolescence,
others still have significant impairments in this area. Common impairments include
intruding into conversations, being aggressive, intense, or emotional, and speaking in an
excessive and disorganized manner (Barkley, 2003). A study investigating the
relationship between self-control, ADHD, bullying, and bully victimization in a large
sample of middle school students found that low self-control was correlated with higher
rates of bullying; however, middle school youth with ADHD were shown to be victims of
bullying whether or not difficulties with self-control were present (Unnever & Cornell,
2003). ADHD status was more highly correlated with being victimized by bullies than
height, weight, age, or relative strength (Unnever & Cornell, 2003). Children with ADHD
may not understand the nuances of social interaction, such as the concept of reciprocity
or skills for initiating or exiting a conversation (Barkley, 2003). These negative social
behaviors may lead students with ADHD to be rejected, avoided, or bullied by their
peers. While other students are joining extracurricular activities and engaging in social
events, children and adolescents with ADHD are often treated differently or rejected from
these activities (Barkley, 2006). This rejection becomes particularly problematic during
adolescence, as peers become more important to the adolescents overall sense of self
37
(Wolraich et al., 2005).
Adolescents with ADHD are at-risk for a variety of negative outcomes associated
with academic and social functioning. Barkley (2006) asserts that impairments
associated with ADHD may start to impact self-acceptance and personal satisfaction
during later developmental phases (i.e., adolescence), and indicates that low self-esteem
may be a concern for adolescents with ADHD. For this reason, it is particularly
important to understand the way that adolescents with symptoms of ADHD view
themselves within the academic and social domains, as these are areas where they
experience significant difficulties. The following will include a discussion of past
research related to the self-concept of children with ADHD.
ADHD and Self-Concept
Given the difficulties that adolescents with ADHD commonly experience, one
might expect that children with symptoms of ADHD would be at risk for having low self-
perceptions. Past research does not support this notion, and instead some children with
ADHD have been found to have inflated positive perceptions of their own abilities
(Evangelista, Owens, Golden, & Pelham, 2008). These overly positive self perceptions
are often referred to as the positive illusory bias (PIB; Hoza, Pelham, Milich, Pillow &
McBride, 1993). The PIB has been defined as when, “children with ADHD unexpectedly
provide extremely positive reports of their own competence in comparison to other
criteria reflecting actual competence” (Owens et al., 2007, p. 335).
Positive illusions are not unique to children with ADHD. Examinations of self-
concept in the general population have indicated that inflated self-perceptions are often
observed in young children (Harter, 1999; Harter & Pike, 1984; Manning et al., 2006;
38
Taylor & Brown, 1988). However, it has been suggested that the positive illusions
observed in children with ADHD are unique compared to the general population for three
reasons (Owens et al., 2007). First, the discrepancy between self-reported and actual
competence observed is larger for children with ADHD and goes beyond what are
considered normative positive illusions for young children. Additionally, the positive
illusions have not proven to be adaptive for children with ADHD; these children continue
to give up on tasks easily and have lower performance than same-age peers (Hoza et al.,
2001), whereas positive illusions in the general population have been shown to lead to
more task-persistence and motivation (Taylor & Brown, 1988). Finally, the self-concept
of children with ADHD does not align with past self-concept theories which suggest that
when self-perceptions are positive, it is due to experiences of success, and negative self-
concepts stem from experiences of failure (Harter, 1999). In contrast, the self-
perceptions of children with ADHD remain high despite frequent experiences of failure
(Owens et al., 2007).
Hypotheses to Explain the Positive Illusory Bias. Efforts to explain the causes
and the function of the PIB phenomenon are still ongoing. Currently, there are four
hypotheses that have been proposed to explain the PIB including cognitive immaturity,
neuropsychological deficits, ignorance of incompetence, and self-protection (Owens et
al., 2007). Each of these hypotheses currently has limited empirical support, with some
having no direct support at all. Therefore, it is difficult to determine which hypothesis is
most viable to explain the causes and function of PIB.
The hypothesis of cognitive immaturity is that children with ADHD are not as
cognitively mature as their same-age peers and therefore may exhibit positive illusions

39
much longer than what is typical for young children in the normative population (Milich,
1994). This hypothesis has an underlying assumption that children with ADHD will
eventually outgrow their immature cognitions that lead them to display the PIB (Owens
et al., 2007). One recent longitudinal study evaluating the PIB over a six-year period
suggests that cognitive immaturity is not an accurate explanation for the PIB because
positive illusions persisted throughout adolescence in the social domain and the PIB was
not shown to decrease over time as would be expected if cognitive immaturity was
maintaining the PIB (Hoza, Murray-Close, Arnold, Hinshaw, Hechtman, & MTA
Cooperative Group, 2010). Some available indirect empirical evidence also challenges
the viability of this hypothesis. For example, in young children within the general
population overestimation of competence serves the function of improving persistence
with novel tasks (Taylor & Brown, 1988); however, children with ADHD have been
shown to give up on tasks easily (Hoza et al., 2001; Milich & Okazaki, 1991).
Additionally, children with ADHD have been shown to accurately rate the competence of
others (Evangelista et al., 2008) Additional longitudinal or cross-sectional research is
needed in order to fully evaluate this hypothesis for explaining the PIB in children with
ADHD.
The ignorance of incompetence hypothesis is that children with ADHD are not
able to recognize their deficits because they lack the skills needed to determine what
would constitute success in an area in which they are unskilled or incompetent (Hoza et
al., 2002). In support of this hypothesis, it has been shown that children with ADHD
overestimate their competence most in areas where they experience the greatest
impairments (Hoza et al., 2002). According to the logic behind this hypothesis, it would
40
be likely that children with ADHD would inaccurately rate their own abilities and the
abilities of others in areas in which they were incompetent. However, a recent study
found that students with ADHD are able to accurately assess the performance of other
children (Evangelista et al., 2008). This finding calls into question the promise of the
ignorance of incompetence hypothesis to explain the PIB.
The neuropsychological deficit hypothesis has not yet been fully evaluated but
remains as one potential explanation for the PIB (Owens et al., 2007). This hypothesis
stems from the fact that children with ADHD often have impairments in executive
functioning, which plays a key role in accurately evaluating performance and abilities.
Owens and colleagues suggest that the neurologically-based deficits in the frontal lobe
associated with ADHD, which result in impairment in executive functions, may underlie
the PIB in children with ADHD. Support for this hypothesis has been found with patients
with frontal lobe damage and problems with executive functioning. These patients have
been shown to display a condition called anosognosia, a lack of awareness of personal
errors that is neurologically based (Stuss & Benson, 1987). Individuals with this
anosognosia condition are able to accurately rate the competence of others, despite
inaccurate self-evaluations (Ownsworth, McFarland, & Young, 2002; Starkstein, Jorge,
Mizrahi & Robinson, 2006). Similarly, children with ADHD have been shown to
accurately rate the abilities of others (Evangelista et al., 2008). No study directly
examining the relationship between deficits in executive functioning, ADHD, and the
PIB has been conducted; therefore the viability of this hypothesis for explaining the PIB
is plausible, but currently unknown.

41
The self-protective hypothesis currently has the most support for being a viable
explanation of the function of the PIB. This hypothesis purports that children with
ADHD have positive illusions of their own competence to ward off feelings of
inadequacy (Diener & Milich, 1997). Evidence supporting this hypothesis includes the
fact that children’s perceptions of others’ competence is unimpaired (Evangelista et al.,
2008), and children with ADHD exhibit the PIB most prominently in the area of greatest
impairment (Hoza et al., 2002; 2004). Additionally, several studies have shown that
positive feedback leads to more accurate self-perceptions in the social domain (Diener &
Milich, 1997; Ohan & Johnston, 2002). This lends support to the self-protective
hypothesis because after positive feedback was received, the students may have no longer
felt the need to inflate their perceptions of competence because they were told that they
were doing well. A recent 6-year longitudinal study following students who were
between the ages of 8 and 13 at the beginning of the study purports that substantial
differences in the PIB between the social and behavioral domain over time provides
evidence for the self-protective hypothesis (Hoza et al., 2010). It is suggested that
adolescents with ADHD likely have significant social impairments and thus require
significant self-protection within the social domain because social aspects are valued
during adolescence; however, little self-protection in the behavioral domain is needed due
to normative shifts towards more defiant behavior during adolescence (Hoza et al., 2010).
Thus, the PIB was found to consistently remain in the social domain and decrease in the
behavioral domain across the six year study (Hoza et al., 2010). The self-protective
hypothesis has the most direct empirical support of all the hypotheses discussed herein.
However, the PIB is likely to be best explained by a combination of these hypotheses.

42
More insight into the developmental trajectory of the PIB and determining if the PIB is
present in adolescents with symptoms of ADHD provides additional information to help
elucidate the cause and function of the PIB.
Past Literature Exploring the Positive Illusory Bias. Empirical research
conducted on the topic of the positive illusory bias has evolved over the past decade.
Past findings related to the presence of the positive illusory bias for children with ADHD
are mixed and it is important to review past literature to understand trends in these
findings. It has been suggested that conclusions drawn about whether or not the PIB is
present in children with ADHD may relate to the specific method used to investigate this
phenomenon (Owens et al., 2007). Therefore, it is important to understand the
implications that the methods used may have on findings related to the PIB. Three
methods have been used in past research on the PIB: absolute self-perceptions, pre/post
performance ratings, and discrepancy or criterion analysis (Owens et al., 2007). The
following section will include a description of each method, an explanation of past
studies investigating the PIB using this method, and the corresponding results.
Absolute self-perceptions. Using absolute self-perceptions involves comparing
self-ratings of children with ADHD to a group of control children. For example, children
with and without ADHD rate their competence in the academic domain and then their
levels of perceived competence are compared. Findings from past research utilizing this
methodology are mixed. Several researchers have compared the global self-concept of
students with ADHD and control groups to investigate the presence of the PIB or
determine if there are differences between mean levels of self-concept between groups.
These findings do not support the presence of the PIB at the level of global self-concept.
43
In an early study on the global self-perceptions of children with ADHD, Horn, Wagner,
and Ialongo (1989) found that boys and girls (age 7-9) with ADHD had lower overall
self-perceptions than children in the control group. A more recent study conducted by
Hanc and Brzezinska (2009) also found that children (age 11-13) with higher levels of
ADHD symptoms have lower perceptions of their overall competence. Other early
studies investigating the global self-concept of young adults who were hyperactive as
children (Hechtman, Weiss, & Perlman, 1980; Slomkowski, Klein, & Mannuzza, 1995)
indicated that this group had lower global self-concepts than the non-hyperactive control
group as adolescents (age 16-23) and young adults (age 23-30).
In contrast, other researchers have investigated the PIB at a domain-specific level.
Ialongo and colleagues used the method of absolute self-perceptions to investigate
multiple domains of self-concept and reported that the ADHD group (age 7-11) had
lower academic, social, behavioral and global self-concept than a group of non-ADHD
controls (Ialongo, Lopez, Horn, Pascoe, & Greenberg, 1994). In one study, no significant
difference was found between the performance ratings of children (age 8-13) with
ADHD, and the ratings of a non-ADHD control group in multiple domains including
social, scholastic, behavioral, physical, and global self-concept (Hoza et al., 1993). The
only notable difference between the children with ADHD and the non-ADHD control
children in this study was in the domain of athletic competence, where boys with ADHD
provided more positive self-evaluations than the non-ADHD controls. This finding
provides preliminary evidence for the presence of the PIB in the athletic domain, but
suggests contradictory conclusions. It remains unclear if a PIB is present in the other

44
domains investigated because there is no measure of the actual competence/abilities of
the students in either the ADHD or control groups (Hoza et al., 1993).
Other studies utilizing absolute self-perceptions have investigated the impact of
comorbid conditions, such as aggression or depression, on the presence of the PIB.
Treuting and Hinshaw (2001) examined the effect of aggressive behavior on the global,
behavioral, intellectual, physical, anxiety, popularity, and happiness self-perceptions of
children (age 7-12) with ADHD. These authors found that aggressive children with
ADHD demonstrated lower self-concept than both control children and nonaggressive
children with ADHD (who only had lower levels of self-concept in the popularity domain
compared to control children with other domains rated the same as controls; Treuting &
Hinshaw, 2001). This study also examined the presence of depressive symptoms among
the three participant groups and found that aggressive children with ADHD had the
highest levels of depressive symptoms and the lowest global self-concept. This finding
demonstrates the importance of examining comorbid symptoms when investigating the
presence of the PIB to achieve a better understanding of which symptoms may be
influencing the child’s self-concept.
Gresham, MacMillan, Bocian, Ward, and Forness (1998) utilized a modified
version of the absolute self-perceptions methodology to examine the academic and social
self-perceptions of three groups of students in 3rd and 4th grade: one group of students
who were considered to be hyperactive, inattentive, impulsive, and have conduct
problems (based on internalizing and externalizing subscale scores more than 2 standard
deviations above the gender mean on the Social Skills Rating System- Teacher [SSRS-T];
Gresham & Elliot, 1990) another group whose scores on the SSRS-T indicated the

45
presence of internalizing and externalizing symptoms 1 standard deviation above the
mean, and a matched control group. Although these researchers used multiple sources of
data within each domain including peer reports, teacher ratings, school records, as well as
self-reports, they did not directly compare the self-reports of the children in their study to
any of these objective criterion. Rather, mean differences in student rated self-concept
between these groups were examined and data from other sources were used as measures
of outcomes within each domain. Results indicated that there was no difference between
the children in either group and the control children in social or global self-concept, and
that children in the two symptomatic groups had lower academic self-concept ratings than
students in the control group. However, it is important to note that all of the groups rated
themselves within the average range of self-concept. The authors concluded that this
could be seen as evidence of the PIB because outside sources (i.e. peer reports, teacher
ratings, and school records) indicated that the children in two different symptomatic
groups had significant impairments within the academic and social domains when
compared to the control group. The group displaying symptoms of ADHD and conduct
problems was shown to have worse academic and social outcomes than children in the
other two groups, indicating that the PIB may be greatest for those displaying ADHD
symptoms. The method used in this study demonstrates one way that self-concept ratings
can be corroborated by outside sources; however, this is still considered to be absolute
methodology because there was no direct comparison between self-ratings and a
specified criterion.
Only one study (Hanc & Brzezinska, 2009) using absolute methodology to
investigate the self-perceptions of students with symptoms of ADHD has considered the

46
intensity or severity of ADHD symptoms. Hanc and Brezinkska (2009) compared ratings
of competence in Polish children (age 11-13) with varying degrees of ADHD symptoms
and found no significant differences between groups with different levels of ADHD
symptoms in terms of self-rated social competence (including social adjustment and
cooperation skills). The authors suggest that this lack of differences could be attributed
to the PIB, because these students likely differ in terms of social impairment (Hanc &
Brzezinska, 2009). However, general feelings of competence, as well ratings of adaptive
properties, knowledge and skills, acknowledgement, emotional factor, and belief in
success, were shown to be lower for students with higher levels of ADHD symptoms
(Hanc & Brzezinska, 2009).
When interpreting these inconclusive results, it is important to consider sample
characteristics such as age, comorbidity, subtype, and symptom severity. Studies that
found that the children with ADHD had lower self-perceptions than the control group
children did not account for comorbid internalizing symptoms (Horn et al., 1989; Ialongo
et al., 1994; Slomkowski et al., 1995); while Hoza and colleagues (1993) controlled for
internalizing symptomatology and found no differences between the ADHD and control
groups. Trueting and Hinshaw (2001) also accounted for comorbid aggression and
depression and found that the group of children with ADHD who exhibited both
aggressive and depressive symptoms had the lowest self-concept. These findings
demonstrate the importance of considering various comorbid conditions when
investigating issues pertinent to self-concept, including the PIB (Treuting & Hinshaw,
2001). Additionally, the samples utilized in the studies by Slomkowski and colleagues
(1995) and Hechtman and colleagues (1980) were much older, consisting of

47
adolescents/young adults age 16-30 years compared to samples of children below the age
of 13 utilized in the other studies presented here. The age of participants could have an
impact on the presence of the PIB and further research is needed on this topic.
Furthermore, these two studies investigated global self-concept, which is in contrast to
the majority of research on the PIB that focuses on domain-specific self-concept.
Utilizing absolute self-perceptions to examine the presence of the PIB yields
mixed results and has some major limitations. A primary challenge with this method is
that it does not allow for comparisons between children’s actual performance and his/her
self-ratings and relies solely on comparisons of mean levels of self-concept between
groups. Given the difficulties and impairments often experienced by children with
ADHD, it is logical that accurate self-perceptions would be lower than children without
ADHD. However, this method does not account for any differences that may exist in the
actual abilities or competence between the groups of children with ADHD and the non-
ADHD controls. Based on findings in this line of research, it is evident that relying
solely on the self-report of children with ADHD leads to inconclusive results.
Pre/post performance ratings. Understanding of the PIB has been advanced by
the use of pre-task and post-performance ratings to investigate the self-perceptions of
children with ADHD. This method involves children predicting or rating their
performance on a task and then comparing their self-ratings to their actual performance
and/or to children in a control group. Children with ADHD have been shown to inflate
their ratings of their own performance more than children in the control group, despite
the fact that children with ADHD are consistently shown to perform worse on these tasks
(e.g., Milich & Okazaki, 1991; Hoza, Waschbusch, Pelham, Molina, & Milich, 2000;

48
Hoza et al., 2001).
Past research has utilized a method of asking children to predict their performance
on tasks that include word games, such as find-a-word or word-search puzzles. Whalen,
Henker, Hinshaw, Heller, and Huber-Dressler (1991) found that 80% of children (age 7-
13 years) with ADHD in their sample predicted that they would complete the word-
search task with perfect accuracy, compared to only 43% of the control group. Another
study found that children (age 9-11) with ADHD consistently predicted better
performance than children in the control group on a find-a-word task, despite
experiencing less success and more frustration than the control group (Milich & Okazaki,
1991). Additionally, on a story-recall task where the performance between the ADHD
and non-ADHD groups was comparable, children (grades 3-7) with ADHD were still
shown to have higher pre-task performance predications than their non-ADHD peers
(O’Neill & Douglas, 1991).
Other methods include having a researcher manipulate situations to determine
whether the child will experience success or failure with a task and then asking the
children to rate their performance after they complete the task. Hoza and colleagues
(2000) examined the social self-concept of boys (age 7-13 years) with ADHD using this
method. These researchers had each student participate in one successful and one
unsuccessful task that involved initiating a child confederate in conversation. Boys with
ADHD were rated at less socially effective when completing this task; however, the boys
evaluated their own performance higher than control boys who were rated as being more
successful with this task. Interestingly, the boys with ADHD were shown to have higher
overestimation after the unsuccessful social interaction. This finding lends support to the

49
hypothesis of self-protection in the social domain, because the boy’s overestimation
could be a method to combat feeling of inadequacy after the task was completed
unsuccessfully.
An extension of the previous study was conducted to examine post-task
predictions in the academic domain (Hoza et al., 2001). Children (age 7-13 years) with
ADHD were shown to be less successful and extend less effort than the control group on
a find-a-word task. However, the post-task ratings of children with and without ADHD
were comparable. This finding indicates the children with ADHD rated their ability as
higher than what was actually observed and shows that these boys with ADHD were
optimistic about their performance even though it was poor (Hoza et al., 2001).
The studies summarized here demonstrate consistent findings that children with
ADHD rate their performance as higher than what is actually observed or higher than
children without ADHD. This method of using children’s performance on a task as a
basis for comparing their self-ratings provides a useful measure of the PIB, because it
allows for comparison between their actual abilities and their self-ratings. It is important
to note that all of these studies utilized samples of boys only. Additionally, internalizing
and aggressive symptoms were not accounted for in these studies. Potential limitations to
this methodology include the fact that it is difficult to assess multiple domains of self-
concept within one study because a separate task would need to be designed to assess
each domain of self-concept. Also, this method only allows for the evaluation of self-
concept on a specific task (e.g., find-a-word task), rather than assessing how a student
feels about a domain in general. Furthermore, the academic tasks used in past research
50
(e.g., mazes, word-find tasks) may not be representative of academic tasks that children
encounter in school.
Criterion/discrepancy analysis. The current best practice recommendation in
terms of methodology for exploring the PIB is the discrepancy and criterion analysis,
which involves comparing the child’s report of competence to some form of objective
source (Owens et al., 2007). This is distinct from the pre/post method discussed
previously, because this method compares a child’s perception of their overall abilities
within a given domain, rather than task-specific evaluations, to the objective source. The
source for the criterion can be another rater (typically teacher or parent) or a child’s
performance on an objective measures, such as an achievement test score. To calculate a
discrepancy, the criterion score is subtracted from the child’s self-rating and the result is
a discrepancy or difference score. High and positive difference scores are suggestive of
overestimation of competence by the student. Consistent results documenting the
presence of the PIB in children with ADHD have been gathered using this methodology
(Evangelista et al., 2008; Hoza et al., 2002; 2004; Owens & Hoza, 2003).
Hoza and colleagues have conducted several studies utilizing this methodology by
comparing the self-ratings of children on the multiple domains of the Self-Perception
Profile for Children (SPPC; Harter, 1985) with the accompanying teacher rating scale
that is directly comparable (Teacher Report of Child’s Actual Behavior, Harter, 1985).
Hoza and colleagues (2002) investigated the academic, social, behavioral, athletic, and
physical domains, as well as global self-concept. Using the discrepancy method, boys
(ages 7-13 years) with ADHD were shown to overestimate their academic, behavioral,
and social competence compared to teacher ratings, significantly more than boys in the

51
control group (Hoza et al., 2002). This study also considered the influence of depressive
symptoms on the presence of the PIB and found that the group of boys with ADHD and
comorbid symptoms of depression (assessed using the Children’s Depression Inventory
[CDI]; Kovacs, 1992) had a decreased presence of the PIB. Children with ADHD and
comorbid depression were shown to have more realistic self-perceptions than those with
ADHD and no depressive symptoms across multiple domains.
In a similar study using the discrepancy method, Hoza and colleagues (2004)
demonstrated that the PIB exists in the scholastic, social, athletic and behavioral domains
for both boys and girls (ages 7-10 years) with ADHD and also showed that the
overestimation of competence in children with ADHD was found regardless of whether
the child’s teacher, mother, or father served as the criterion reporter (Hoza et al., 2004).
The two studies using the criterion/discrepancy analysis described here (Hoza et al.,
2002; 2004) have also provided evidence that the PIB is most prominent in the child’s
domain of greatest deficit. Children who had low academic achievement were shown to
have the greatest discrepancy in the academic domain, and children with conduct
problems had the greatest discrepancy in the behavioral domain (Hoza et al., 2002, 2004).
Owens and Hoza (2003) also utilized the discrepancy methodology in their
examination of how ADHD subtype may contribute to the presence of the PIB. This
study, which utilized clinic and school-based recruitment methods, was the first to
explore the PIB in relation to ADHD subtypes. This study focused solely on the
academic domain and used teacher reports and standardized achievement tests scores as
two methods of comparison utilizing a discrepancy analysis. These authors found
significant differences between a group of children (ages 9-12 years) who were primarily

52
inattentive (IA), and another group of children who displayed hyperactive/impulsive and
combined (HICB) symptoms. The children in the IA and control groups were shown to
have self-perceptions in the academic domain that aligned with the criterion; conversely,
the children in the HICB group were shown to overestimate their competence compared
to the two criterion measures that were used. Larger discrepancies were found when
teacher ratings were used as the criterion compared to standardized achievement test
scores. It was also demonstrated that more severe HICB symptoms were associated with
larger discrepancies between the child’s report and the criterion; thus, higher levels of
hyperactive/impulsive symptoms were related to more overestimation of competence
(Owens & Hoza, 2003). The results of this study suggest that subtype and symptom
severity may be important considerations when examining the self-perceptions of
children with ADHD; the PIB may not be present in children who are primarily
inattentive or children with less severe ADHD symptoms. This may be particularly
important to consider when examining the PIB in adolescents because there is evidence
that hyperactive symptoms decrease over time and IA symptoms become more prevalent
as children age (Wolraich et al., 2005).
A study conducted in Sweden with 635 twelve year-old children also suggests that
it is important to consider the intensity of ADHD symptoms when determining the
accuracy of self-perceptions (Diamantopoulou, Henricsson, & Rydell, 2005).
Diamantopoulou and colleagues (2005) utilized peer nominations, and self and teacher
reports to explore the relationship between peer relations, student perceptions, and
varying levels of intensity of ADHD symptoms. These authors found that children with
higher levels of ADHD symptoms did not perceive their peer relationships to be more

53
negative, despite teacher ratings and peer nominations suggesting that higher levels of
ADHD symptoms were related to social rejection and peer dislike (Diamantopoulou et
al., 2005). While low levels of ADHD symptoms were also significantly related to peer
dislike, these students reported feelings of loneliness that were more aligned with the
external criterion used (teacher ratings and peer nominations; Diamantopoulou et al.,
2005). This study suggests that the degree of ADHD symptoms may be an important
consideration when exploring the PIB.
In an effort to determine if children with ADHD are able to accurately rate the
competence of others, Evangelista and colleagues (2008) used the discrepancy analysis
methodology to investigate the presence of the PIB in the academic, social, athletic,
physical, and behavioral domains. This study was designed to elucidate whether the PIB
is a function of the inability of children with ADHD to accurately rate competence in
general, or if it was only their own competence that this group was inaccurate in rating.
Boys and girls with ADHD overestimated their own competence compared to teacher
ratings in all of these domains. When the absolute self-concept of the children in the
ADHD group was compared to control children, children with ADHD reported lower
self-perceptions in all domains with the exception of athletic competence. However,
when these self-ratings were compared to teacher ratings, the children with ADHD
significantly overestimated their competence in all domains, while the control children
did not. This shows the importance of investigating the PIB using a criterion rather than
simply comparing self-concept scores between groups. All children in this study were
also asked to share their perceptions of the academic and social competence of others
through a video task. Results suggest that there was no difference in the ability of

54
children with and without ADHD in judging the competence of others in either the
academic or the social domains. Both groups were able to accurately rate the abilities of
others. This study provides evidence that suggests that the ignorance of competence
hypothesis is not a viable explanation of the PIB because children with ADHD are able to
accurately judge the competence of others. Another unique aspect of this study is that
both clinic and community based samples were utilized.
In order to test the hypothesis of self-protection, Ohan and Johnston (2002) used
positive feedback during social and academic tasks to determine if this would decrease
the discrepancy between the self-perceptions of boys with ADHD and their actual
performance. This study combined the pre-task prediction and the discrepancy analysis
methods to explore the PIB in boys with and without ADHD. First, students predicted
their performance on a maze-completion task. After being individually instructed on the
maze-task and completing the mazes, boys were given positive, average, or no feedback
from a member of the research team. All of the boys were shown to rate their
performance similarly in the academic and social domain. Because the boys with ADHD
had lower performance compared to the boys without ADHD, they were shown to have
larger discrepancies between their self-rated competence and their actual competence on
both the academic and social tasks. Boys with ADHD who received positive feedback
from their teacher were shown to have a smaller difference between their actual and self-
reported competence in the social domain. In other words, the positive illusions in the
social domain decreased when positive feedback was given in the social domain. This
finding was not replicated in the academic domain, as boys with ADHD had even larger
discrepancies between their actual and self-rated academic competence after receiving

55
positive feedback. This study demonstrates the importance of considering each self-
concept domain independently when investigating potential ways to decrease the
presence of the PIB in children with ADHD.
To extend the findings of past researchers, Whitley, Heath, and Finn (2008) used
a combination of absolute self-perception comparisons and a discrepancy analysis to
determine if the presence of the PIB was related to externalizing behaviors or specifically
to ADHD. Past research (e.g., Hoza et al., 2004) could not make this distinction because
the comparison groups included students who were not exhibiting emotional or behavior
problems. To answer this question, the self-perceptions of students with ADHD (based
on teacher reported symptoms in the clinical range on the Child Behavior Checklist
[CBCL; Achenbach, 1991] and SSRS [Gresham & Elliot, 1990]) ages 6-13 years, were
compared to a matched control group of students exhibiting both internalizing and
externalizing problems (based on teacher nominations), but who did not meet ADHD
criteria. Students’ self-perceptions were also compared to teacher ratings in the
academic, social, and behavioral domains. The results of this study indicated that there
was no difference between the absolute self-perceptions of students with ADHD and
other emotional or behavioral problems. If these researchers had only conducted this
comparison of absolute self-perceptions between these two groups, the presence of
positive illusions may have been overlooked. However, it was found that teachers rated
the competence of the students in the ADHD group significantly lower than the students
in the comparison group, which indicates that teachers perceived students with ADHD to
be experiencing more deficits across the academic, social, and behavioral domains. Thus,
when difference scores were calculated, significant differences in the self-perceptions
56
between the groups were noted. Specifically, the students with ADHD overestimated
their competence in all three domains significantly more than students in the non-ADHD
group. This is especially noteworthy because students with ADHD were compared to
students identified as having emotional and behavioral problems. While the authors
suggest that this difference in discrepancies found between groups may be a result of
biased teacher ratings towards students with ADHD, the findings of this study are
suggestive that the PIB may be directly related to symptoms associated with ADHD,
rather than with behavioral difficulties in general.
The first longitudinal study of the PIB utilized discrepancy analysis to investigate
the PIB in the social and behavioral domains among 513 children with ADHD that were
8-13 years old at the beginning of the six year study (Hoza et al., 2010). This ADHD
group was compared to a group of 284 comparison peers without elevated ADHD
symptoms. Results from this study indicate that children with ADHD exhibited larger
and more positive discrepancies between self and teacher rated competence than the
control group in both the social and behavioral domains across all time points.
Interestingly, this study also noted that students with ADHD demonstrate a trend of
increasing social self-perceptions during early adolescence which is similar to what has
been demonstrated in normative samples. However, less increase in social self-
perceptions was noted in the ADHD group compared to students without ADHD
symptoms.
This study also investigated the PIB’s relationship with depression and aggression
over time as a means to determine whether or not the PIB is adaptive. Decreased PIB in
the social and behavioral domain were found to be associated with higher levels of

57
depressive symptoms, while increases in the PIB in the behavioral domain were
predictive of more aggression. It is important to note that the authors suggest that more
negative perceptions may be the result of depression rather than the cause, and therefore
they concluded that the PIB does not serve as a protective factor for depressive
symptoms. This study also purported that the self-protective hypothesis may be a viable
explanation for the PIB because adolescents with ADHD were more likely to
overestimate their competence in the social domain (an area where impairments are
viewed quite negatively during adolescence and therefore require self-protection)
compared to the behavioral domain (where impairments may be more normative due to a
tendency towards more deviant behaviors during the developmental period of
adolescence). Additional research is needed to further explore this finding.
One potential criticism for using this discrepancy analysis methodology is that
there is some evidence that parents and teachers may have negatively biased reports of
children with ADHD (Eisenberg & Schneider, 2007; Whitley et al., 2008). However,
given the consistency in ratings found across raters (Hoza et al., 2004), and the consistent
findings demonstrating the presence of the PIB when utilizing a criterion (Evangelista et
al., 2008; Hoza et al. 2002, 2004; Owens & Hoza, 2003), it is unlikely that a negative
bias is accounting entirely for the PIB. Yet, utilizing perceptions from others and
objective outcome measures (e.g., achievement test scores or school records) to complete
discrepancy analyses is suggested as the best method for ensuring the validity of this
construct (Owens et al., 2007).
The studies discussed herein that have utilized the discrepancy and criterion
analysis to address some of the limitations with previous studies and yield more
58
consistent results than studies using other methods to examine the PIB. All of the studies
using this method provided support for the presence of the PIB in several domains of
self-concept. However, it is important to note that the majority of these studies have used
primarily elementary-age samples and clinic-based recruitment for participants with
diagnosable levels of ADHD symptoms. It is important to focus future research on older
students (middle school age or above) and utilize school-based recruitment methods in
order to achieve a larger range of symptom severity and to address these gaps in the
literature. Furthermore, it is important that considerations learned from these studies
(such as the importance of considering subtype and depressive symptoms) are accounted
for when examining the PIB in adolescents in order to yield results that can be compared
across age groups. It is also important to be aware of how differing methodologies may
lead to different conclusions about the presence of the PIB. The use of discrepancy
analysis with a criterion is recommended as the best practice in examining the PIB in
samples of children, adolescents, or adults with ADHD (Owens et al., 2007).
Conclusions
It is important to conduct research with the goal of further understanding the self-
concept of young adolescents demonstrating ADHD symptoms. The self perceptions of
students with ADHD are unique compared to individuals without ADHD, and while more
research is needed, these differences may help inform future assessment and intervention
efforts. Previous research on self-concept suggests that the PIB may not be present in
adolescents with symptoms of ADHD (Hecthman et al., 1980; Slomkowski et al., 1995).
Traditional theories of self-concept suggest that negative feedback from the environment
can lead to negative self-perceptions (Harter, 1999). Considering the impairments that

59
are experienced by students with ADHD symptoms, it is likely that they have received
negative feedback from both the home and school environments that may influence the
presence of the PIB. This negative feedback received throughout their lives may
accumulate and make a negative mark on the self-concept of these adolescents that
persists into adulthood, as was evidenced in past research conducted by Hechtman et al.
(1980) and Slomkowski and colleagues (1995) indicating low self-esteem in adolescents
and young adults with ADHD. In the normative population, self-concept has been shown
to decrease during the middle school years and then begin to gradually increase as
student’s age (Harter, 1999). Considering this finding, which suggests that the PIB may
not be present during the middle school years, in conjunction with recent research on the
PIB suggesting that positive illusions persist in the social but not behavioral domains
(Hoza et all., 2010), more research is needed to understand whether or not the self-
concept of adolescents with symptoms of ADHD aligns with the PIB that has been found
in elementary-aged children with ADHD.
There is a clear need for studies utilizing the discrepancy/criterion methodology
that has been used in past research endeavors focused on the PIB in children, to extend
this research to middle and high school populations. The PIB has been found to be less
prevalent in children who exhibit symptoms of depression (Hoza et al., 2002), and
students who have primarily inattentive ADHD symptoms (Owens & Hoza, 2003).
These factors must be considered when investigating the persistence of the PIB into
adolescence, as more students with ADHD exhibit primarily inattentive symptoms as
they enter adolescence (Wolraich et al., 2005), and the rates of depression also increase

60
during this developmental period (Bird et al., 1993). These factors alone may lead to a
decreased prevalence of the positive illusory bias in adolescents.
The function of the PIB is not currently well understood and it is not clear if this
phenomenon leads to adaptive or maladaptive outcomes. However, children and
adolescents with ADHD experience significant impairments in the academic and social
domains, such as academic underachievement and high rates of rejection by peers. If the
PIB was shown to persist into adolescence then this could lead to problems with
intervention compliance if these students do not perceive that they have impairments that
could warrant improvements from intervention efforts. Additionally, the PIB could
contribute to these students having difficulty learning from their past mistakes. However,
the PIB may also lead to positive aspects such as being open to many new experiences,
and attempting more challenging social and academic tasks. There is not currently a
research foundation that allows for conclusions about the presence of the PIB in
adolescents, and therefore the function of this phenomenon is unknown.

61
Chapter III: Method
The purpose of the current study was to gain insight into the presence of the
positive illusory bias (PIB) within the academic and social domains for middle school
students exhibiting symptoms of ADHD. The accuracy of academic and social self-
concept was determined through a comparison of students’ self-ratings of competence to
teacher ratings and achievement test scores. These comparative data were classified into
three categories of young adolescents with negative, accurate, or positive self-
perceptions. Differences in inattentive (IA), hyperactive/impulsive (HI), and depressive
symptoms among these three groups of young adolescents were investigated. The
following chapter details the methods utilized for the current study, beginning with a
description of participant characteristics and participant selection, followed by a
description of the measures and procedures that were used to collect data from students
and teachers. Then, the analyses for each research question are explained. Finally, a
discussion of ethical considerations and limitations of the study is provided.
Participants
Participants in grades six through eight were recruited from two public middle
schools in a large school district in a southeastern state. These two middle schools were
selected based on their varied socioeconomic and cultural variables and because the
administrators at these schools expressed interest in working with the University of South
Florida research team. Each of these schools had some unique features. School one had

62
a magnet program that focuses on science, mathematics, technology, and engineering in
which 15% of the student body was enrolled. Additionally, school 1 was a certified
Advancement Via Individual Determination (AVID) school, meaning that study skills
were taught school-wide in an effort to decrease the achievement gap between students
from various ethnic and socioeconomic backgrounds. Only one third of the schools in
the county were certified AVID schools. School 1 had recently received a school grade
of B; however this school had previously been a C school. Ten percent of the students at
School 1 were enrolled there due to School Choice, a program that allows students to
choose and apply to schools that they desire to attend. School 2 was described by an
administrator as having fewer specialized programs, with no magnet components and a
gifted program. School 2 had recently received a school grade of A, and had also
received grades of A in the past. Twenty-five percent of students at school 2 were
enrolled there due to School Choice. At school 1, 80% of the students qualified to
receive free and reduced price school lunches; while 53.5% of students qualified at
school 2 (compared to 2007-2008 state average of approximately 45%; U.S. Department
of Education, 2008). Eighty-one and 58.8% of the student bodies at these two middle
schools were from an ethnic minority background (compared to 2007-2008 state average
of approximately 54%; U.S. Department of Education, 2008). More information on the
demographics of these two schools can be found in Table 1.

63
Table 1
School Demographic Information
School 1
School 2
Total
% (n) % (n) % (n)
Gender
Male 52.8% (473) 47.9% (521) 50.1% (994)
Female 47.2% (422) 52.1% (567) 49.9% (989)
Race/Ethnicity
American Indian or Alaskan Native 0.6% (5) 0.2% (2) 0.4% (7)
Asian or Pacific Islander 2.7% (24) 3.4% (37) 3.1% (61)
Black, Non-Hispanic 52.7% (472) 6.3% (69) 27.3% (541)
Hispanic 20.0% (179) 42.6% (463) 32.4% (642)
Multiracial 5.1% (46) 6.3% (69) 5.8% (115)
White, Non-Hispanic 18.9% (169) 41.2% (448) 31.1% (617)
Free & Reduced Lunch Status
Yes 80.0% (716) 53.5% (582) 65.5% (1298)
No 20.0% (179) 46.5% (506) 34.5% (685)
Receiving ESL Services 12.5% (112) 14.6% (159) 13.7% (271)
Students Enrolled in ESE 20.3% (182) 15.3% (166) 17.6% (348)
Grade Level
Six 31.1% (278) 35.5% (386) 33.5% (664)
Seven 35.6% (319) 33.2% (361) 34.3% (680)
Eight 33.3% (298) 31.4% (342) 32.3% (640)
Total Enrollment 45.1% (895) 54.9% (1,088) 100.0% (1,983)
64
The current study was part of a larger study that investigated the experiences of
adolescents exhibiting inattention, hyperactivity, and impulsivity, in order to better
understand how these behaviors relate to academic, social, family, and substance use
outcomes. The principal investigators (PIs), Dr. Julia Ogg and Dr. Rance Harbor,
received approval to conduct this study from the Institutional Review Board (IRB) at the
University of South Florida (USF; Ogg & Harbor, 2009), and the participating school
district. Data were collected during the Spring semester of 2010 by a research team
consisting of graduate students from USF, including the author of this research. Students
were supervised by the PIs, Dr. Julia Ogg and Dr. Rance Harbor, faculty members in the
USF School Psychology Program. The current study includes secondary analysis of data
from the above referenced dataset to answer the research questions, and separate IRB
approval was obtained before beginning analyses.
Selection of Participants.
Students. In order to participate, students were required to be enrolled full-time
at one of the middle schools included in this study and to obtain parental informed
consent for their participation (see Appendix A). In addition, students reviewed and
signed a student assent form just prior to data collection (see Appendix B). Students
served exclusively in self-contained special education classrooms and non-English
speaking students were excluded from the present study. While the exact number of
students excluded based on these criteria is unknown, 12.5% and 20.3% of students at
School 1 and 14.6% and 15.3% of students at school 2 receive English as a Second
Language (ESL) or Exceptional Student Education (ESE) services, respectively. As can
be seen in Table 1, total enrollment across both schools was 1983 (school 1 n = 895;

65
school 2 n = 1088). Parental consent was obtained for a total of 198 students, which
represents 10% of the total enrollment across both schools, and 12% of the total
enrollment across both school if ESL (Total = 1,652; School 1 n = 784; School 2 n = 868)
or ESE students (Total = 1,687; School 1 n = 765; School 2 n = 922) are excluded. It is
important to note that not all ESE students were excluded from the sample, only those
students served in self-contained classrooms; however, these percentages provide a better
understanding of the response rate in the current study. One-hundred eighty-three
students were present and gave assent to participate in the current study (9% of the total
student body).
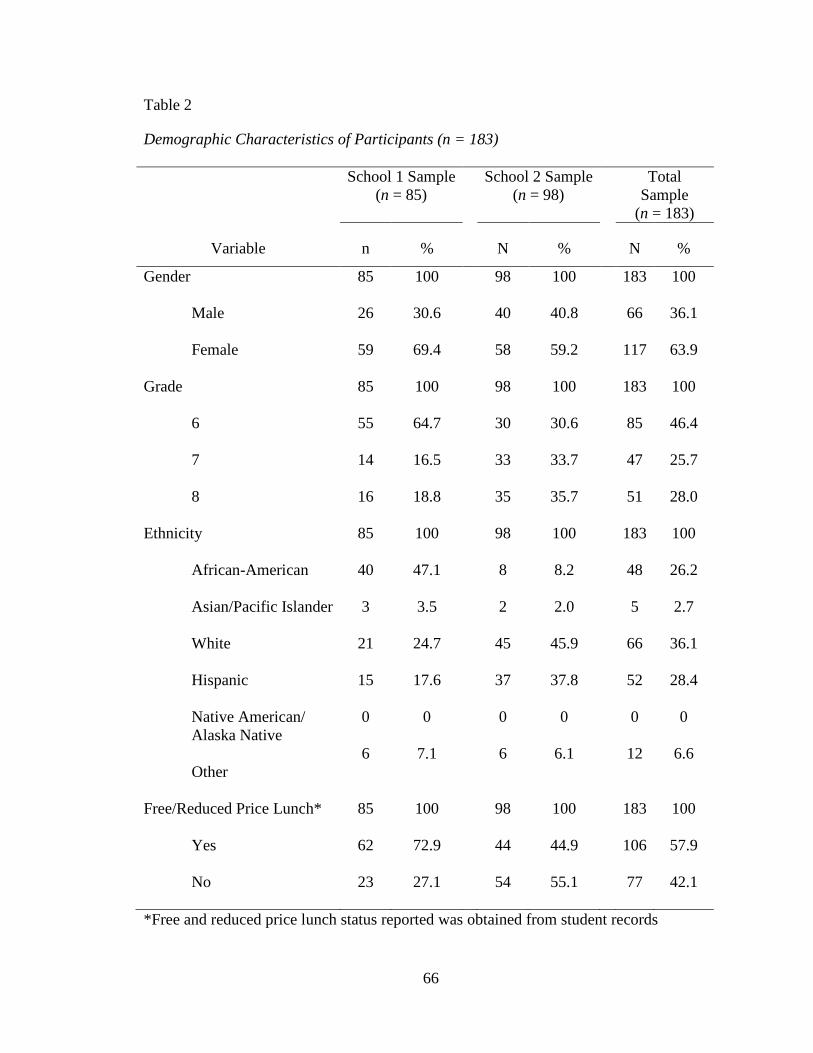
66
Table 2
Demographic Characteristics of Participants (n = 183)
School 1 Sample (n = 85)
School 2 Sample (n = 98)
Total Sample
(n = 183)
Variable n % N % N %
Gender 85 100 98 100 183 100
Male 26 30.6 40 40.8 66 36.1
Female 59 69.4 58 59.2 117 63.9
Grade 85 100 98 100 183 100
6 55 64.7 30 30.6 85 46.4
7 14 16.5 33 33.7 47 25.7
8 16 18.8 35 35.7 51 28.0
Ethnicity 85 100 98 100 183 100
African-American 40 47.1 8 8.2 48 26.2
Asian/Pacific Islander 3 3.5 2 2.0 5 2.7
White 21 24.7 45 45.9 66 36.1
Hispanic 15 17.6 37 37.8 52 28.4
Native American/ Alaska Native
0 0 0 0 0 0
Other
6 7.1 6 6.1 12 6.6
Free/Reduced Price Lunch* 85 100 98 100 183 100
Yes 62 72.9 44 44.9 106 57.9
No 23 27.1 54 55.1 77 42.1
*Free and reduced price lunch status reported was obtained from student records

67
Descriptive statistics of the demographics of the entire sample of study
participants are provided in Table 2. A comparison between the sample and the school
demographic data presented above suggests that a larger percentage of the current sample
came from school 2; however, this is representative considering that school 2 is larger
than school 1. Additionally, females were overrepresented as a whole within the current
sample, particularly from school 1 where 47.2% of the student body is female, compared
to 69.4% female within the current sample. In terms of ethnicity, this sample appears to
be well-aligned with the percentages of students of each ethnic background represented at
each school. In terms of socioeconomic status, with free or reduced price lunch as an
indicator, there was a smaller percentage of students in the current sample receiving
free/reduced price lunch compared to the student body as a whole (57.9% receiving FRL
in this sample, 65.5% across the two schools). However, the breakdown of FRL across
schools in the current sample matches school data, with school 1 having a higher
percentage of students from low socioeconomic status. Lastly, at school 1 there was
overrepresentation of students in sixth grade (64.3% of study participants from school 1
were in grade 6, whereas only 31.1% of students attending school 1 were in sixth grade).
The participants at school 2 were more evenly distributed across grade levels, with the
highest percentage of students in 8th grade.
Teachers. Homeroom teachers of student participants were asked to complete the
Vanderbilt ADHD Diagnostic Teacher Rating Scale (VADTRS; Wolraich, Feurer,
Hannah, Baumgaertel, & Pinnock, 1998; see Appendix C) and the Self-Perception Profile
for Children Teacher Rating Scale (SPPC-TRS; Harter, 1985; see Appendix D) for each
student in their homeroom class who provided self-report data and had parent permission

68
to participate. Homeroom teachers were selected for participation because the
administrator at each school suggested that these teachers knew each student in their
homeroom classes very well. Homeroom teachers had students in their classrooms for
the longest period of the day because this homeroom time was in addition to an academic
subject area. Therefore, these teachers were expected to be the best source of information
about a student’s academic and social functioning in the school context. If a student’s
homeroom teacher declined to participate, the administrator selected another teacher that
had the student in his or her class throughout the school year. At school one 42% of
students had their survey completed by a teacher other than their homeroom teacher,
while at school two only 6% had their survey completed by another teacher. A letter of
informed consent (see Appendix E) was distributed to all teachers with student
participants in their homeroom class. Teachers were informed of the small incentive
available for each questionnaire packet that they completed. Specifically, teachers
received a $2 gift card for each individual student packet they completed. Fifty-one
teachers completed questionnaires for 1-10 students each; this resulted in teacher data for
all students included in the current study.
Measures
Multiple sources of data from students and teachers questionnaires were obtained
in this study. Additional data were gathered from student records, including information
about students’ Free/Reduced Lunch (FRL) status as an indicator of SES, and also
reading and math scale scores from the Florida Comprehensive Assessment Test (FCAT).
Student Measures.
Demographic form. The demographic form (see Appendix F) contained 14
69
questions regarding age, grade, gender, race/ethnicity, attendance, school discipline and
arrest history, past and present mental health status, and socioeconomic status (SES).
Questions specific to ethnicity and gender were utilized in this study. All demographics
questions included multiple choice answer sets. This measure had been used in previous
research with adolescents (Snodgrass, 2009).
Florida Comprehensive Assessment Test. Florida Comprehensive Assessment
Test (FCAT) reading and math scale scores (combined) were used as an index of a
student’s overall academic achievement. The FCAT is a standardized test given to all
students in grades three through eleven in the state of Florida. This assessment is
designed to measure student progress towards meeting the benchmarks specified in
Florida’s statewide standards (Next Generation Sunshine State Standards) and is
therefore linked with the curriculum that is taught to Florida students. Several scores are
available for the FCAT including scaled scores and levels. FCAT reading and math scale
scores range from 100-500, with 100 being the lowest score and 500 being the highest
score. These scale scores correspond with FCAT levels, which range from 1 (lowest) to 5
(highest) and indicate a student’s level of success mastering the Florida Sunshine State
Standards for each grade level (Florida Department of Education, 2008). The Sunshine
State Standards represent the challenging curriculum content that Florida students are
expected to learn at each grade level. A level 1 indicates that the student has “little
success” with the content of the Sunshine State Standards, and a level 5 is assigned when
a student demonstrated success with the most challenging content of the Sunshine State
Standards (Florida Department of Education, 2008, p. 1). While the exact relationship
between FCAT level and scale score is dependent on both grade level and subject area, a

70
scale score ranging from 100 to approximately 260 corresponds with level 1, levels 2-4
correspond with scale scores ranging from approximately 260 through 380, and a scale
score of approximately 380-500 corresponds with a FCAT level 5 (Florida Department of
Education, 2008). FCAT reading scores and math scale scores have high internal
consistency (Cronbach’s alphas range from .85 to .90 for reading, and .94-.95 for math
for 6th to 8th graders; Florida Department of Education, 2007). In the present study,
students’ scale scores on the reading and math portion of 2010 FCAT were obtained from
school records in June/July 2010 from school FCAT reports. For the purpose of this
study, FCAT reading and math scale scores were combined to provide an estimate of
students’ overall academic competence.
Self-Perception Profile for Children. The Self-Perception Profile for Children
(SPPC; Harter, 1985; see Appendix G) measures six domains including scholastic, social,
and athletic competence, as well as physical appearance, behavioral conduct, and global
self-worth. This scale is suggested for measuring the self-concept of children in third
grade or above, and has been used with children in grades 3 through 8. For the purpose
of the current study, the scholastic competence and social acceptance domains were used
to represent the academic and social domains. Each of the subscales representing these
domains includes six items per subscale, for a total of 12 items (two additional sample
items are included for practice, but are not scored). Completing this measure involved
two steps. First, students were asked to decide which of two opposite sentences (for
example, “some kids would rather play outdoors in their spare time” but “other kids
would rather watch T.V.”) best described them. Then, students were asked to indicate
whether the statement was “sort of true” or “really true” for them. This question format
71
is called a “structure alternative format” (Harter, 1982, p. 89) and was designed to
combat the tendency for children to provide socially desirable responses. Each item on
the SPPC is scored from 1 to 4, with one indicating low perceptions of competence and
four indicating high perceived competence. Three items are reverse scored within each
domain because the less competent or adequate self-description is provided first. After
accounting for items that are reverse scored, the six items within each domain are
averaged, resulting in separate subscale means for each domain. As recommended by the
author, in order to calculate an average the student must answer at least 3 out of the 6
items per domain. Items where more than 1 response was indicated (i.e., more than one
box checked) were not considered when calculating an average. Total scores (subscale
means) for each domain range from 1 to 4, with higher scores indicating higher perceived
competence in that domain.
The SPCC has been used in both elementary and middle school samples (grades
3-8); however, psychometric properties of the SPCC specific to the middle school sample
are presented as these provide the best match to the sample in the current study. This
scale has high internal consistency for each subscale within two samples of middle school
students (Cronbach’s alpha=.80 across both samples for the social domain and .80 in a
sample of 748 sixth and seventh graders and .85 in a sample of 390 sixth, seventh and
eighth graders for the scholastic domain; Harter, 1985). Using exploratory factor
analysis, Harter (1985) examined the factor structure of data within three samples of
middle school students. In three samples including students in 5th through 8th grade, a
clear five factor model emerged including physical appearance, behavioral conduct, and
athletic competence, in addition to the two factors that are included in this study: social

72
acceptance and academic competence (Harter, 1985). Cross loadings between domains
was small (Harter, 1985). Test-retest reliability was also collected with two samples of
third through sixth graders, with retesting occurring at three months for one sample, and
nine months for another sample. Test retest reliability was .78 and .80 at three months,
and .78 and .75 at nine months for the scholastic and social domains, respectively (Harter,
1982). Convergent validity has been calculated between the SPPC and the teacher rating
scale component of this scale (see details below). It has been found that pupil and teacher
ratings within the scholastic domain have a moderate correlation of .55 for sixth grade
students, .31 for seventh grade students, and .66 for eighth grade students (Harter, 1982).
Scholastic competence ratings were also found to be correlated with standardized
achievement test scores from the Iowa Test of Basic Skills. Correlations with this
measure were found to be .45, .29, and .44 for sixth, seventh and eighth graders,
respectively. For the social domain, the domain-specific SPPC scores were moderately
correlated (r = .59) with sociometric standing based on the Roster and Rating Scale for
4th- 6th grade students (Harter, 1982). The Harter Self-Perception scale was selected
based on these strong psychometric properties, its prior use with middle school students,
and also because past studies investigating the PIB in students with ADHD have
predominantly utilized the SPPC (e.g., Evangelista et al., 2008; Owens & Hoza, 2003).
Center for Epidemiological Studies Depression Scale. The Center for
Epidemiological Studies Depression Scale (CES-D; Radloff, 1977; see Appendix H) is a
20 item self-report measure designed to screen for depressive symptoms and determine
the prevalence of depressive symptoms in the general population. This measure is not
intended to provide a clinical diagnosis of depression and high scores do not indicate that

73
a diagnosis of depression is warranted. Individuals completing this scale were asked to
indicate the frequency of their experiences with various behaviors and emotions during
the past week (e.g., “I thought my life had been a failure,” and “I felt that people disliked
me”). Four of the twenty items are worded positively to assess for positive affect (e.g. “I
felt hopeful about the future”) and are therefore reverse scored. All responses are on a 4-
point scale, ranging from 0 (rarely or none of the time) to 3 (most or all of the time).
Scores were averaged and range from 0 to 3, with higher scores indicating that the
individual was experiencing more depressive symptoms. If scores are totaled, then the
maximum score on the CES-D is 60. In adults it was recommended that individuals
scoring 16 or higher were identified as at-risk for a clinical diagnosis of depression
(Radloff, 1977). More recent research investigating appropriate cutoff scores to be used
with adolescent samples indicate that a score of 24 yields a 9.2% depression prevalence
rate in a sample of students in grades 7-12. This prevalence rate is closer to the estimated
community-based prevalence rate of 1.5-8%, while using a cutoff of 16 yielded a high
prevalence rate of 28.7% (Rushton, Forcier, & Schectman, 2002).
The CES-D has been shown to have high internal consistency and moderate test-
retest reliability within adolescent samples (Roberts, Lewinsohn, & Seeley, 1991).
Internal consistency was high with coefficient alpha of .88 in a high school population,
and test-retest reliability was moderate for a mean follow-up interval of 9.6 days (r = .61;
Roberts et al., 1991). This scale is designed to measure depressive symptoms during the
past week; therefore, it is expected that higher correlations would be observed for shorter
test-retest intervals compared to longer intervals. Criterion validity evidence for the
CES-D with a group of high school students is provided through its high and positive
74
correlations with another instrument measuring depressive symptomalogy, the Beck
Depression Inventory (BDI; r = .70; Roberts et al., 1991).
Teacher Measures.
Teacher’s Rating Scale of the Child’s Actual Behavior. The teacher rating scale
of the SPPC (SPPC-TRS; Harter, 1985; see Appendix D) follows the same format as the
SPPC to assess children’s competencies within specific domains. The three items that
make up the Scholastic Competence domain and the three items of the Social Acceptance
domain were utilized for this study. To complete this measure, teachers were first asked
to decide which of two opposite sentences best described the actual competence of the
target student. For example, “This child is really good at his/her schoolwork OR This
child can’t do the school work assigned.” Secondly, the teacher was asked to indicate
whether they believed the statement was “sort of true” or “really true” for the student.
Each item on the SPPC is scored from 1 to 4, with one indicating low perceptions of
student competence and four indicating high perceptions of student competence. Two of
the three items for the scholastic domain are reverse scored, and one of the three items
from the social subscale is reverse scored meaning that the less competent descriptor is
listed first. After accounting for items that are reverse scored, the three items within each
domain were averaged, resulting in separate subscale means for each domain. Scores
from each domain were used as a criterion for judging the accuracy of children’s self-
perceptions in the academic and social domains.
A factor analysis conducted with the teacher rating scale resulted in a similar four
factor solution to the students’, with evidence of four factors: cognitive (originally Harter
[1982] called this the cognitive domain; however, in 1985 Harter renamed this same scale

75
scholastic competence; Harter, 1985), social, physical, and general self-concept (Harter,
1982). The Scholastic Competence and Social Acceptance subscales were analyzed in
the current study. The average factor loading was .84 for the Scholastic Competence
subscale and .74 for the Social Acceptance subscale. The teacher rating scale also has
high internal consistency reliabilities (Cronbach’s alpha=.96 and .93 for the Scholastic
Competence and Social Acceptance domains, respectively; Harter, 1982).
Vanderbilt ADHD Diagnostic Teacher Rating Scale. The Vanderbilt ADHD
Diagnostic Teacher Rating Scale (VADTRS; Wolraich et al., 1998; see Appendix C) is a
43 item rating scale that was used to allow teachers to report the presence and severity of
inattention, hyperactivity, and impulsivity displayed by a child in their homeroom
classroom. The VADTRS items directly correspond to the Diagnostic and Statistical
Manual of Mental Disorders, Fourth Edition (DSM-IV; APA, 2000) ADHD diagnostic
criteria. To complete this scale, the teacher was asked to consider each rating in the
context of age-appropriate behaviors for the student. There are nine items that assess
Inattention and nine items assessing Hyperactive/Impulsive symptoms. Examples of
items from these scales include: “Is forgetful in daily activities” and “fidgets with hands
or feet or squirms in seat”, respectively. The VADTRS also includes items that can be
used to screen for coexisting conditions. ADHD and comorbid symptoms are rated on a
four point scale from 0 (never) to 3 (very often). The degree of both inattentive and
hyperactive/impulsive symptoms was considered for each student participant, with the
degree of these symptoms ranging from 0 to 3 (averaged across the 9 items of the
VADTRS representing each symptom type).

76
The VADTRS is reported to have adequate internal consistency for both the
Inattention (coefficient alpha = .92) and the Hyperactivity/Impulsivity (coefficient alpha
= .90) with an economically and ethnically diverse standardization sample from
Tennessee (Wolraich et al., 1998). In a study sampling from Spain, Germany, and urban
and suburban U.S. regions, internal consistencies ranged from .95 to .96 for Inattention
items, and from .87 to .93 for Hyperactivity and Impulsivity items (Wolraich, Lambert,
Baumgaertel, Garcia-Tornel, Fuerer, Bickman, et al., 2003b). Internal consistencies
ranged from .91 to .94 across samples from an urban elementary school system (Wolraich
et al., 2003a). Using confirmatory factor analysis, Wolraich and colleagues (1998) found
that data most strongly supported a two factor solution (Inattention and
Hyperactivity/Impulsivity separately) rather than considering all the symptoms together
or as three separate symptoms (e.g., Inattention, Hyperactivity, and Impulsivity). No test-
retest data have been reported for this instrument.
Procedures
Student Survey. A packet of questionnaires, including the measures described
above as well as others not relevant to this study, were compiled into a comprehensive
packet. Measures in the survey packet were counterbalanced to control for order effects.
Specifically, six versions of the survey packet were administered. The questionnaire
packet and instructions were piloted with a group of 15 middle school students in a 7th
grade English class that included students who were average or typically achieving for
their grade level. After completing the pilot questionnaire, students were asked questions
about the clarity and ease of/time required for completion. Some students noted difficulty
with the response format of the SPPC during piloting. Therefore, two sample items

77
within the measure (see Appendix G), and a sample item that was presented and taught
by a member of the research team before survey administration, were subsequently
added. These additional sample items were meant to decrease confusion about the
response format used for this measure and to increase the accuracy of completion on the
SPPC.
A letter of informed consent (see Appendix A) was sent home to parents of all
students attending the two middle schools (N = 2,000) prior to data collection. Students
were offered separate incentives for three aspects of data collection. Specifically, students
were entered into an initial drawing for a $25 gift card for a local store for returning
signed parent consent forms, and were entered into an additional drawing for another $25
gift card after completed parent measures (not relevant to the current study) were
submitted. Furthermore, students received a small thank you gift (<$1.00) for completing
the survey packet on the day of data collection.
A list of students who obtained parental consent for participation was compiled
prior to data collection. Students who returned their parent consent forms were asked to
report to a predetermined location in the school for survey completion during their
elective class period on one school day during the spring semester of 2010. Completion
of the survey packet took approximately 40 minutes. One of the PIs or a graduate student
who was trained for the administration of this particular study read aloud the student
assent form to all students prior to survey completion and explained several example
items that were representative of questions within the survey packet. Confidentiality and
the voluntary nature of the survey were explained to students, and they were told that
they could withdraw their participation at any time. Once assent was obtained,
78
participants independently completed all of the measures included in the questionnaire
packet. Researchers monitored the room throughout survey administration to ensure
accurate completion of the study materials and to answer any questions that students had.
Additionally, when students finished their survey, one of the PIs or a trained graduate
student asked each student to look over their survey and pay close attention to whether
they answered every question that they wanted to answer, and that they only chose one
response per item. Students were also asked to make sure that they did not
unintentionally miss or skip pages.
Teacher Survey. Informed consent was gathered from each teacher participant
(see Appendix E). On the day of data collection for student self-report data, members of
the research provided a packet of rating scales to each student participant’s homeroom
teacher. The number of rating scales administered to each teacher was dependent on the
number of student participants in each classroom. Teachers were given approximately
one week to complete the rating scales. Completion of the questionnaires was estimated
to be 5 minutes per student. Contact information for one of the PIs was provided to each
teacher so that they had a means to ask questions related to survey completion.
Analyses
A series of statistical analyses were performed to answer the research questions to
be addressed in this study.
Descriptive analysis. Means, standard deviations, and additional descriptive
data (i.e., skew, kurtosis, etc.) were obtained for the entire sample for all variables of
interest, which included: student academic self-concept (6 academic items of SPPC),
student social self-concept (6 social items of SPPC), average depression score (CES-D),

79
teacher ratings of students’ academic competence (3 items of TRS), teacher ratings of
students’ social competence (3 items of TRS), FCAT reading and math scale scores (from
school records) and ADHD symptoms (VADTRS). This also served as a method to
screen for participants with missing data. Any participant with an entire measure missing
was excluded from analyses (a total of 19 participants were excluded for this reason).
However, to retain students with only a few items missing it was determined that all
averages would be calculated based on the availability of at least two-thirds of the data on
that measure. There was only one instance when an average could not be calculated using
the two-thirds rule. One participant was excluded because 4 of the 9 inattention items
were missing from the VADTRS and therefore an average of inattentive symptoms could
not be obtained.
These descriptive analyses helped to ensure that necessary assumptions, including
independence of data, homogeneity of variance, and normality of distributions, were not
violated. This allowed for sample demographic characteristics to be compared to the
demographics of each of the middle schools to determine if the sample was representative
in terms of these demographic variables. Furthermore, Cronbach’s alpha was calculated
for each measure to determine the internal consistency of these measures for this
particular sample (reported in chapter IV). SPSS 19.0 statistical software was used to
complete all analyses.
Creating Groups Based on the Accuracy of Self-Perceptions. Using
standardized discrepancy scores to explore the phenomenon of the PIB has been
recommended as the best method (Owens et al., 2007). To determine the accuracy of
students’ self-perceptions in the academic domain based on teacher ratings, z-scores were

80
created for the scholastic competence subscale score of the SPPC, and for scholastic
competence subscale score on the TRS. Student reading and math FCAT scores were
converted to z-scores and then averaged to indicate how far a student’s score was above
or below the sample mean. All of the z-scores were calculated based on the mean of the
data from the sample of student participants which were included in the current study (N
= 164). Converting to z-scores ensured that all measures were on the same metric. This
allowed for FCAT scores to be directly compared to students’ self-ratings on the SPPC.
FCAT scores served as a second indicator of students’ actual academic competence. To
determine the accuracy of students’ self-perceptions in the social domain, z-scores were
created for the social subscale scores from the SPPC, and for the social subscale scores
on the TRS. Raw accuracy scores were also calculated based on measures that have the
same metric (the SPPC student and teacher versions; see Appendix I).
Difference scores were calculated by subtracting the standardized criterion scores
(academic/social teacher rating or FCAT score) from the standardized self-perceptions
score. High difference scores in either domain suggest higher discrepancy between a
student’s self-perceptions and another indicator of competence in that specific domain
(academic or social). The sign of the difference score is also important, with a positive
discrepancy indicating overestimation of competence and a negative discrepancy score
indicating low perceived competence. The use of discrepancy analysis has been used in a
past study investigating the presence of the PIB based on ADHD subtypes (Owens &
Hoza, 2003). These difference scores were used to create three groups of students with
negative, accurate, or positive self-perceptions of competence compared to an external
indicator of competence. Students with discrepancy scores that were one half standard

81
deviation below the mean (less than approximately -.5 depending on the indicator of
actual competence utilized in the discrepancy analysis) were classified as the negative
self-perceptions group for each of the three indicators of competence. Students with
discrepancy scores between one half standard deviation above and below the mean were
classified as the accurate self-perceptions group for each separate indicator of
competence. Lastly, students with discrepancy scores higher than one half standard
deviation above the mean made up the positive self-perception group. It was decided to
use one half standard deviations above or below the mean to determine the group
classification because this method divided the sample into nearly equal thirds, and
because this is closely aligned with methods described in previous research (Gresham et
al., 2000). This group classification (negative, accurate, and positive self-perceptions)
represented the independent variable for each of the research questions.
Correlational Analyses. To determine the bivariate relationships between self-
perceptions, actual achievement, competence, accuracy of social and academic self-
perceptions, and specific symptoms of ADHD (IA, HI), correlation coefficients were
calculated between each variable of interest. A correlation coefficient (ranging from -1 to
+1) provided information about the strength and direction of the relationship between two
variables. A correlation matrix is provided to determine the bivariate associations
between all variables of interest in this study (see Table 10).
Research Question Analyses. The following research questions were developed
to determine if young adolescents with negative, accurate, or positive self-perceptions in
the academic and social domains differ on ADHD and depressive symptoms:
82
1. How do young adolescents with negative, accurate, or positive perceptions of
academic competence differ on inattentive, hyperactive/impulsive, and
depressive symptoms, when teacher ratings are used as an indicator of actual
academic competence?
2. How do young adolescents with negative, accurate, or positive perceptions of
academic competence differ on inattentive, hyperactive/impulsive, and
depressive symptoms, when achievement test scores are used as an indicator
of actual academic competence?
3. How do young adolescents with negative, accurate, or positive perceptions of
social competence differ on inattentive, hyperactive/impulsive, and depressive
symptoms, when teacher ratings are used as an indicator of actual social
competence?
To determine if symptoms of ADHD and depression are related to the accuracy of
self-perceptions in the academic and social domain for middle school students, data were
subjected to a series of three separate Multivariate Analysis of Variance (MANOVA).
Three groups of students with negative, accurate, or positive self-perceptions were
contrasted on inattentive, hyperactive/impulsive, and depressive symptoms in each
analysis. Separate MANOVA were conducted for the groups based on the discrepancies
between self-perceptions and each of the three separate indicators of competence
(accuracy of academic self-perceptions with teacher ratings as the criterion [Q1],
accuracy of academic self-perceptions with FCAT scores as the criterion [Q2], and
accuracy of social self-perceptions with teacher ratings as the criterion [Q3]). In each
MANOVA, inattentive, hyperactive/impulsive, and depressive symptoms were the
83
dependent variables. MANOVA results indicate whether there were statistically
significant differences among the groups on a combination of the dependent variables.
When MANOVA results were significant, each of the dependent variables was then
considered separately to determine which symptoms differed across the three groups
using univariate Analysis of Variance (ANOVA). Lastly, Tukey’s follow-up tests were
conducted in order to determine which groups were significantly different from each
other on each of the dependent variables.
Ethical Considerations
Precautions were taken throughout the current study to protect all participants.
IRB approval from the University of South Florida (Ogg & Harbor, 2009) and the
collaborating local school district was obtained prior to data collection; this ensured that
precautions were taken to protect human research participants.
A parental consent form (see Appendix A), which outlined the goals and
procedures for the project, was distributed so that parents were aware of all aspects of the
study. All of the potential risks and benefits associated with the child’s participation in
the study were included in this parent consent letter. The letter included the contact
information for one of the PIs to provide parents with the opportunity to discuss questions
or concerns pertaining to the nature of the proposed project.
For all students who returned a signed parent consent form, a student assent form
was administered before survey completion (see Appendix B). The student assent form
outlined the risks and benefits of the study and allowed students to decide whether or not
they wanted to participate. One of the PIs or a trained member of the research team read
the letter out-loud to students at the time of data collection to ensure student
84
understanding. Additionally, time was provided to answer students’ questions and
inform students of their option to withdrawal from the study at any time. Teacher
consent was sought from all teachers with student participants in their classoom and
teachers were provided with a copy of the consent letter, which described the study
purpose and the timeframe for survey completion (see Appendix E). This letter also
included contact information for one of the PIs in order to address any questions that
teachers may have.
The participants’ confidentiality was ensured in part by examining data only in
aggregate; individual students were not identifiable. Student responses were only known
by study investigators. There were two instances in which confidential data were shared
and these were clearly specified in the parental consent and student assent forms.
Specifically, district school psychologists were notified and provided immediate threat
assessments to any student who indicated that they were going to harm themselves or
someone else. School psychologists were also provided with a list of students who
scored at or above a cutoff score of 24 on the CES-D, as this score is considered to be
indicative of risk of depression among adolescents (Roberts et al., 1991; Rushston et al.,
2002). The investigators provided a mental health professional at each school with the
names of all students who scored above this cutoff on the day of data collection. The
school was responsible for determining how this information was used.
Limitations of the Current Study
When carrying out this research project, precautions were taken to ensure that
valid results were obtained and to address potential threats to validity. First, all measures
were piloted with average-achieving 7th grade students to ensure that items were clear and

85
could be understood by this age group. When the surveys were administered, six
counterbalanced versions of the survey packet were distributed to control for order
effects. All of the graduate students assisting with data collection received training to
ensure that they understood the correct answer format for each measure, and to ensure
that student questions were answered in a uniform manner. During administration, these
trained graduate students and one of the PIs circulated throughout the area where surveys
were administered to assist students. All of these procedures helped to control for errors.
Because all threats to validity cannot be controlled prior to data analysis, the
researcher took precautions when interpreting the results of this study. Population validity
is limited in this quantitative research project. Additionally, the use of self-report and
teacher report methods were potential limitations to this study design.
Population validity is the ability to generalize results from the sample to a larger
population. Some unique participant characteristics may limit the populations to which
results of the results of the study can be generalized. The methods of this study involved
collecting data from a convenience sample; and it must be considered that students who
agreed to participate in the research study and returned their parental consent forms may
differ from other middle school students who declined to participate or did not return a
parental consent form. The researcher took precautions to compare the study sample to
the demographics of both of the middle schools through the use of descriptive statistics to
ensure that all sub-populations of students represented at these middle schools were
included in the study sample. The middle schools where this study was carried out were
selected based on their diverse population with students from varied ethnic and
socioeconomic backgrounds.
86
Self-report methods for the current study were selected because this is one of the
only ways to determine if the PIB phenomenon is displayed for middle school students
with symptoms of ADHD. For the purpose of this study, self-report is a recommended
method for measuring the presence of this PIB when the self-report is compared to an
objective criterion such as a teacher rating or standardized reading scores (Owens et al.,
2007). However, with self-report research it is important to note that the self-ratings
reflect the students’ perceptions of their abilities and not their actual abilities. It is also
important to consider that using teacher reports for the levels of ADHD symptoms and
the criterion to determine the accuracy of students’ self-perceptions could be a limitation
to this study. Teachers are suggested to be the most relevant reporters for students’ daily
behavioral concerns (Gadow, Drabick, Loney, Sprafkin, Salisbury, Azizian, & Schwartz,
2004). Mitsis, McKay, Shultz, Newcorn, and Halperin (2000) suggest that when behavior
in school is of interest, parent input cannot replace teacher input. Additionally, past
research has shown that the PIB is present whether parent or teacher ratings of
competence are used as the criterion and that there is consistency across raters on the
Harter Teacher Rating Scale (Hoza et al., 2004). In the current study, FCAT reading and
math scale scores were also used to calculate discrepancy scores in the domain of
academic competence. These discrepancy scores were compared to discrepancies
calculated with teacher ratings used as the indicator of actual competence to determine if
there were significant differences in discrepancies when using teacher ratings or FCAT
scores as the indicator of academic competence. Teacher reports were selected for this
study because teachers have opportunities to observe their students in both academic and
social settings.

87
Chapter IV: Results
This chapter presents the results of statistical analyses conducted to answer the
three research questions within the current study. Procedures used to screen the data
gathered for the current study, a discussion of procedures for calculating and grouping
students based on the accuracy of their self-perceptions, and descriptive analyses
comparing the three groups are presented first. Preliminary analyses will follow, which
include examining scale reliabilities and correlations among variables of interest.
Subsequently, results of multivariate analysis of variance (MANOVA) and follow-up
tests are presented to demonstrate how groups of students with negative, accurate, or
positive academic and social self-perceptions differ on ADHD and depressive symptoms
based on multiple indicators of actual academic and social competence.
Data Screening
During data entry for the dataset analyzed in the current study, integrity checks
were completed for 11% of complete surveys to ensure accurate data entry. When an
error was found on one or more items, an additional survey was checked for accuracy. A
total of 14% of surveys were checked for errors until no additional errors were found.
Data were screened using SPSS 19 statistical software to determine the presence
of univariate and/or multivariate outliers. Based on data screening procedures suggested
by Tabachnick and Fidell (2007), univariate outliers were defined as data with z-scores
greater than positive or negative 3.3 on any variable of interest. One univariate outlier
for depressive symptoms was identified (z = 3.69); however, this participant was retained
88
for analyses because their average score, 2.6 on a three point scale, is within the defined
range of symptoms of the CES-D. The four additional univariate outliers identified (for a
total of 5 univariate outliers) overlap with the multivariate outliers on the
hyperactive/impulsive symptom variable explained below. These multivariate outliers
were defined as participants scoring higher than 16.27, the criterion determined by the
Mahalanobis distance for three dependent variables (Tabachnick & Fidell, 2007). Further
investigation into unique characteristics of these four cases indicated that three had
significantly elevated hyperactive/impulsive symptoms that were within the limits of the
possible VADTRS scale averages (2.43 - 3 on a 3 point scale), and one had high levels of
IA symptoms (3 on a 3 point scale). Because participants with elevated ADHD symptoms
are of particular interest in the current study, these cases were retained in all subsequent
analyses.
The data set originally included 183 participants (as seen in Table 2); however,
upon screening for incomplete data, 19 participants were removed due to incomplete data
on at least one whole measure included in the current study (two were excluded due to
missing data on the SPPC, SPPC-TRS and VADTRS; four were excluded due to missing
data on both the VADTRS and the SPPC-TRS; one participant was excluded due to
missing half of the IA items on the VADTRS; one participant was excluded due to
missing SPPC-TRS data; 10 students were excluded due to missing data on the SPPC
only; and one student was excluded due to missing FCAT scores). The data set used in
all analyses for the current study consisted of 164 participants.
Calculating the Accuracy of Self-Perceptions
To create three groups based on the accuracy of self-perceptions in the academic

89
and social domains, discrepancy scores within each domain were created. Three different
discrepancy scores were calculated by subtracting each of the criterion z-scores from the
self-perception z-score within that domain as described in Table 3.
Table 3
Calculating Accuracy Scores
Name of Accuracy Variable Equation for Calculating Discrepancy Score
Academic Accuracy (objective
criterion; FCAT)
(Standardized Academic SPPC Score) –
(Standardized mean FCAT Math/Reading scores)
Academic Accuracy (teacher
perception; SPPC-TRS)
(Standardized Academic SPPC Score) –
(Standardized Academic SPPC-TRS scores)
Social Accuracy (teacher
perception; SPPC-TRS)
(Standardized Social SPPC Score) –
(Standardized Social SPPC-TRS scores)
Three groups for each accuracy variable were formed based on these discrepancy
scores. Standardized z-scores were used to calculate all accuracy variables so that
measures could be compared despite having different metrics, and because this is in line
with previous research on the PIB (e.g., Hoza et al., 2004). For the two SPPC measures,
which are on the same metric, raw accuracy scores were also calculated and compared
across groups (see Appendix I). In the academic domain, students were grouped based
on the discrepancy between their standardized scores of their perceptions of academic
competence and their teacher’s standardized rating of their academic competence and
also based on the discrepancy between standardized self-perceptions and standardized
FCAT scores. In the social domain, groups were created based on the discrepancy
between standardized social self-perception ratings and standardized teacher ratings of
social competence. The “negative self-perception” groups represent students who
90
underestimated their competence compared to the teacher. Specifically, these students
had a discrepancy score at least one half standard deviation below the mean for a given
indicator of competence. The “accurate” group had discrepancy scores within one half
standard deviation above or below the mean of zero, while the “positive self-perception”
group had discrepancy scores more than one half standard deviation above the group
mean. This method yielded three groups of students with differing self-perceptions for
each indicator of competence utilized. Note, in line with the only moderate correlation
between FCAT scores and teacher reports of academic and social competence, a student
could be in a different group based on the area of competence examined (for instance, a
student could be “accurate” in the academic domain when FCAT scores were used as the
criterion, but have “negative” or “positive” self-perceptions when teacher reports of
academic competence were utilized as the criterion). Also, as perceptions of competence
are domain-specific, a single student could be viewed as having “accurate” self-
perceptions in one area (e.g., academic), while having “negative” or “positive” self-
perceptions in another domain (e.g., social).
Descriptive Analyses
Descriptive statistics for the measures used in the current study are presented in
Table 4. Means, standard deviations, range, skewness, and kurtosis of each of the
variables were calculated. Overall, symptom means were low; however, a full range of
symptoms is evidenced within the current sample (see Table 4). Skewness and kurtosis
were included to assess for univariate normality beyond investigating univariate outliers
that fall outside of the range of z-scores between -3 and +3. The highest obtained values
were for the hyperactive/impulsive symptoms variable (skew = 2.25, kurtosis = 4.96),
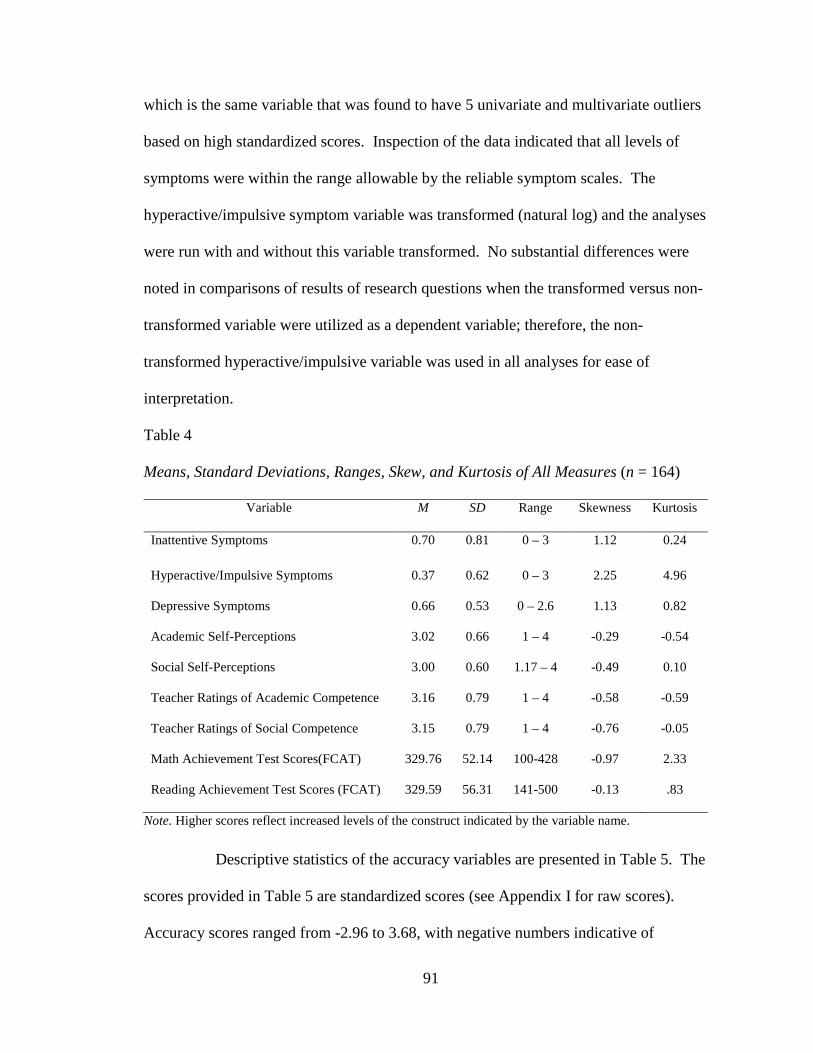
91
which is the same variable that was found to have 5 univariate and multivariate outliers
based on high standardized scores. Inspection of the data indicated that all levels of
symptoms were within the range allowable by the reliable symptom scales. The
hyperactive/impulsive symptom variable was transformed (natural log) and the analyses
were run with and without this variable transformed. No substantial differences were
noted in comparisons of results of research questions when the transformed versus non-
transformed variable were utilized as a dependent variable; therefore, the non-
transformed hyperactive/impulsive variable was used in all analyses for ease of
interpretation.
Table 4
Means, Standard Deviations, Ranges, Skew, and Kurtosis of All Measures (n = 164)
Variable M SD Range Skewness Kurtosis
Inattentive Symptoms 0.70 0.81 0 – 3 1.12 0.24
Hyperactive/Impulsive Symptoms 0.37 0.62 0 – 3 2.25 4.96
Depressive Symptoms 0.66 0.53 0 – 2.6 1.13 0.82
Academic Self-Perceptions 3.02 0.66 1 – 4 -0.29 -0.54
Social Self-Perceptions 3.00 0.60 1.17 – 4 -0.49 0.10
Teacher Ratings of Academic Competence 3.16 0.79 1 – 4 -0.58 -0.59
Teacher Ratings of Social Competence 3.15 0.79 1 – 4 -0.76 -0.05
Math Achievement Test Scores(FCAT) 329.76 52.14 100-428 -0.97 2.33
Reading Achievement Test Scores (FCAT) 329.59 56.31 141-500 -0.13 .83
Note. Higher scores reflect increased levels of the construct indicated by the variable name.
Descriptive statistics of the accuracy variables are presented in Table 5. The
scores provided in Table 5 are standardized scores (see Appendix I for raw scores).
Accuracy scores ranged from -2.96 to 3.68, with negative numbers indicative of

92
underestimation of competence and positive numbers indicating overestimation of
competence. All of the obtained values for skewness and kurtosis were between -1.0 and
+1.0, demonstrating a normal distribution of the calculated discrepancies.
To determine if the participants who were classified into the negative,
accurate, and positive perceptions groups significantly differed in terms of school, grade
level or gender, chi-square tests for independence were employed for each of the
accuracy variables based on the three separate indicators of competence. School was
found to be significantly related to grouping for the two academic indicators of
competence (see Tables 6 and 7) but not for the social domain (see Table 8). Grade level
was not found to be significantly related to grouping for any of the three indicators of
competence across the academic (see Tables 6 and 7) or social domains (see Table 8).
Notably, though, more than half of the positive self-perception group was made up of
students in the 6th grade across the three accuracy variables. Seventh and 8th grade
students comprised only 19.6-26.1% of the positive self-perceptions groups across all
three indicators of competence within the academic and social domains; however, these
percentages are in line with the overall distribution of the sample; there were more 6th
Table 5
Means, Standard Deviations, Ranges, Skew, and Kurtosis of Accuracy Variables
(n = 164)
Variable Name M SD Range Skewness Kurtosis
Academic Accuracy (FCAT) -0.01 1.01 -3.40 – 2.94 -0.26 0.94
Academic Accuracy (SPPC-TRS) 0.00 1.14 -2.96 – 3.30 -0.30 0.37
Social Accuracy (SPPC-TRS) 0.01 1.16 -2.49 – 3.68 0.33 -0.04
Note. Higher scores reflect increased levels of the construct indicated by the variable name.
93
grade students in the current sample compared to students in 7th and 8th grade.
Chi-square tests for independence indicated a significant association between school and
self-perception group status with teacher ratings as the indicator of academic competence
, χ2 (2, N = 164) = 11.56, p = .00. Specifically, almost twice as many students in the
negative self-perception group came from school 1 and almost twice as many students in
the accurate group were from school 2. Students in the positive group were more evenly
distributed across schools, particularly considering that school 2 made up a larger
percentage of the sample. Additionally, a significant relationship between gender and
self-perception group status, χ2 (2, N = 164) = 17.73, p = .00, was identified when teacher
ratings of academic competence were used as the indicator. Despite the fact that the
majority (63.9%) of the current sample was female, the majority of students in the
positive self-perceptions group were male.

94
Table 6
Demographic Variable Frequencies for Groups based on Academic Teacher Ratings
Variable Negative (%) Accurate (%) Positive (%) Chi-Square
School 11.56**
1 65.4 34.8 41.3
2 34.6 65.2 58.7
Grade 2.43
6 48.1 42.4 54.3
7 26.9 25.8 26.1
8 25.0 31.8 19.6
Gender 17.73**
Female 80.8 69.7 41.3
Male 19.2 30.3 58.7
Total Per Group n = 52 n = 66 n = 46
** p < .01
A significant relationship between school and self-perception group was found
again when FCAT scores were utilized as a second indicator of academic competence, χ2
(2, N = 164) = 8.43, p = .02. Specifically, school 2 had a larger percentage of students in
the accurate self-perception group and school 1 had more students demonstrating positive
self-perceptions (see Table 7). However, no significant associations between gender and
self-perception group status were identified with FCAT scores as an indicator of
competence, χ2 (2, N = 164) = 2.08, p = .35.
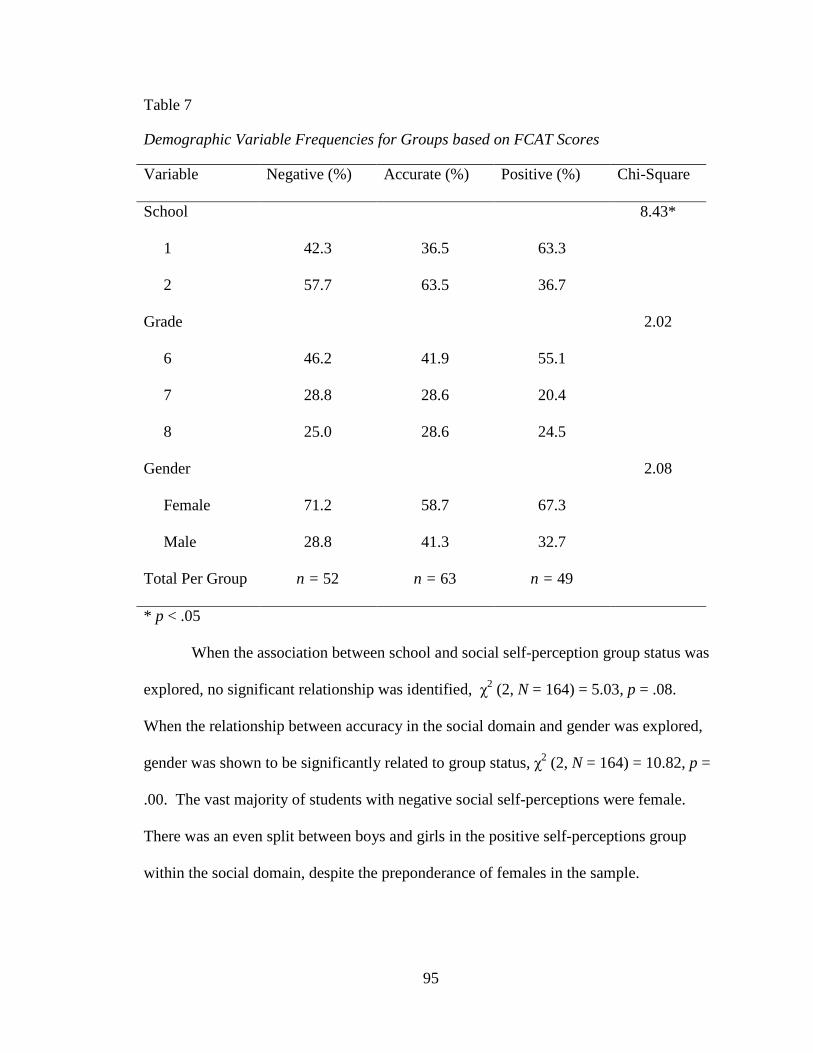
95
Table 7
Demographic Variable Frequencies for Groups based on FCAT Scores
Variable Negative (%) Accurate (%) Positive (%) Chi-Square
School 8.43*
1 42.3 36.5 63.3
2 57.7 63.5 36.7
Grade 2.02
6 46.2 41.9 55.1
7 28.8 28.6 20.4
8 25.0 28.6 24.5
Gender 2.08
Female 71.2 58.7 67.3
Male 28.8 41.3 32.7
Total Per Group n = 52 n = 63 n = 49
* p < .05
When the association between school and social self-perception group status was
explored, no significant relationship was identified, χ2 (2, N = 164) = 5.03, p = .08.
When the relationship between accuracy in the social domain and gender was explored,
gender was shown to be significantly related to group status, χ2 (2, N = 164) = 10.82, p =
.00. The vast majority of students with negative social self-perceptions were female.
There was an even split between boys and girls in the positive self-perceptions group
within the social domain, despite the preponderance of females in the sample.

96
Table 8
Demographic Variable Frequencies for Groups based on Social Teacher Ratings
Variable Negative (%) Accurate (%) Positive (%) Chi-Square
School 5.03
1 57.1 36.2 46.0
2 42.9 63.8 54.0
Grade 2.49
6 50.0 41.4 52.0
7 21.4 32.8 24.0
8 28.6 25.9 24.0
Gender 10.82**
Female 80.4 63.8 50.0
Male 19.6 36.2 50.0
Total Per Group n = 56 n = 58 n = 50
** p < .01
Preliminary Analyses
Scale Reliability. Prior to the subsequent analyses, all scales utilized within the
study (i.e., SPPC and SPPC-TRS academic and social domains, VADTRS inattentive and
hyperactive/impulsive subscales, and the CES-D) were analyzed to determine their
internal consistency. Cronbach’s alpha ranged from .73 (Social self-perceptions) to .96
(Inattentive symptoms), indicating acceptable estimates of reliability for each scale (see
Table 9).
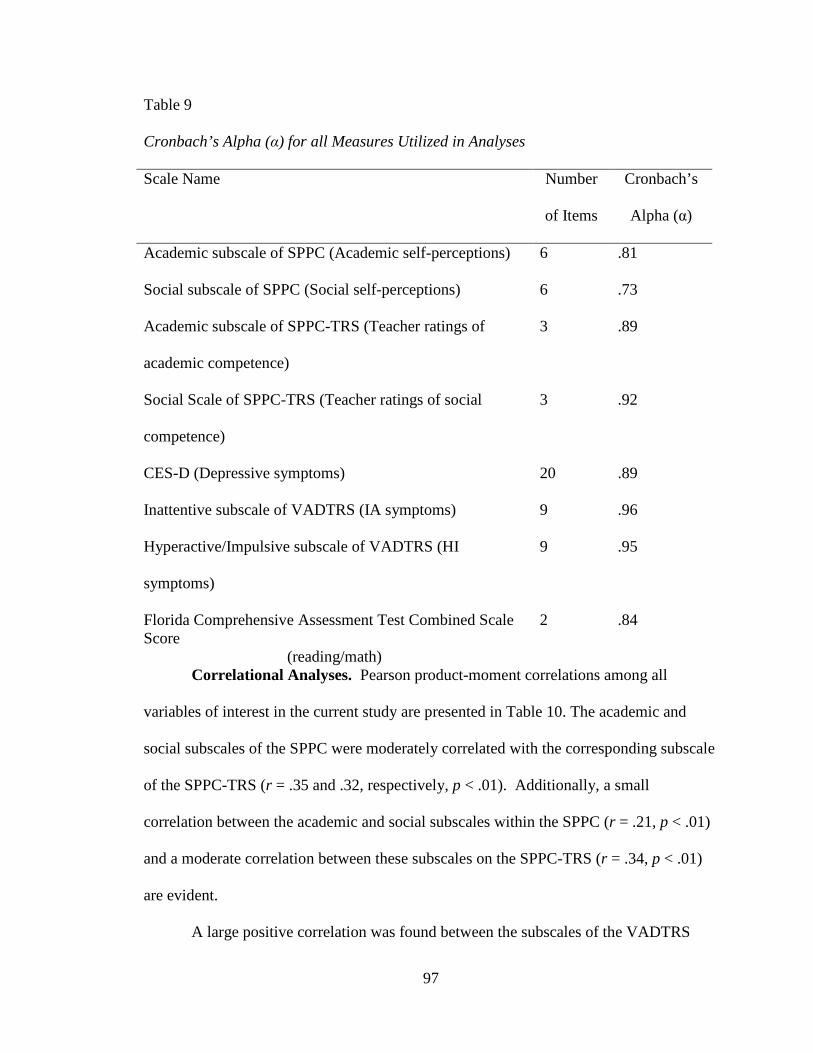
97
Table 9
Cronbach’s Alpha (α) for all Measures Utilized in Analyses
Scale Name Number
of Items
Cronbach’s
Alpha (α)
Academic subscale of SPPC (Academic self-perceptions) 6 .81
Social subscale of SPPC (Social self-perceptions) 6 .73
Academic subscale of SPPC-TRS (Teacher ratings of
academic competence)
3 .89
Social Scale of SPPC-TRS (Teacher ratings of social
competence)
3 .92
CES-D (Depressive symptoms) 20 .89
Inattentive subscale of VADTRS (IA symptoms) 9 .96
Hyperactive/Impulsive subscale of VADTRS (HI
symptoms)
9 .95
Florida Comprehensive Assessment Test Combined Scale Score
(reading/math)
2 .84
Correlational Analyses. Pearson product-moment correlations among all
variables of interest in the current study are presented in Table 10. The academic and
social subscales of the SPPC were moderately correlated with the corresponding subscale
of the SPPC-TRS (r = .35 and .32, respectively, p < .01). Additionally, a small
correlation between the academic and social subscales within the SPPC (r = .21, p < .01)
and a moderate correlation between these subscales on the SPPC-TRS (r = .34, p < .01)
are evident.
A large positive correlation was found between the subscales of the VADTRS
98
(i.e., inattentive and hyperactive/impulsive symptoms; r = .64, p < .01). This is in line
with past research suggesting that these two subscales are highly correlated (r = .75-.79;
Wolraich et al., 2003). As was expected, a high correlation is evident between academic
accuracy based on FCAT scores and academic accuracy based on SPPC-TRS ratings (r =
.59, p < .01). Social and academic accuracy with SPPC-TRS as the indicator of
competence were also significantly positively correlated (r = .28, p < .01). A review of
the correlation matrix indicated that of the two types of ADHD symptoms, inattentive
symptoms were more highly correlated with accuracy in the academic and social
domains. Depressive symptoms were shown to have significant negative relationships
with academic and social self-perceptions, all three indicators of competence (i.e., FCAT
reading and math scores, and academic and social teacher ratings), and academic
accuracy scores based on SPPC-TRS scores.
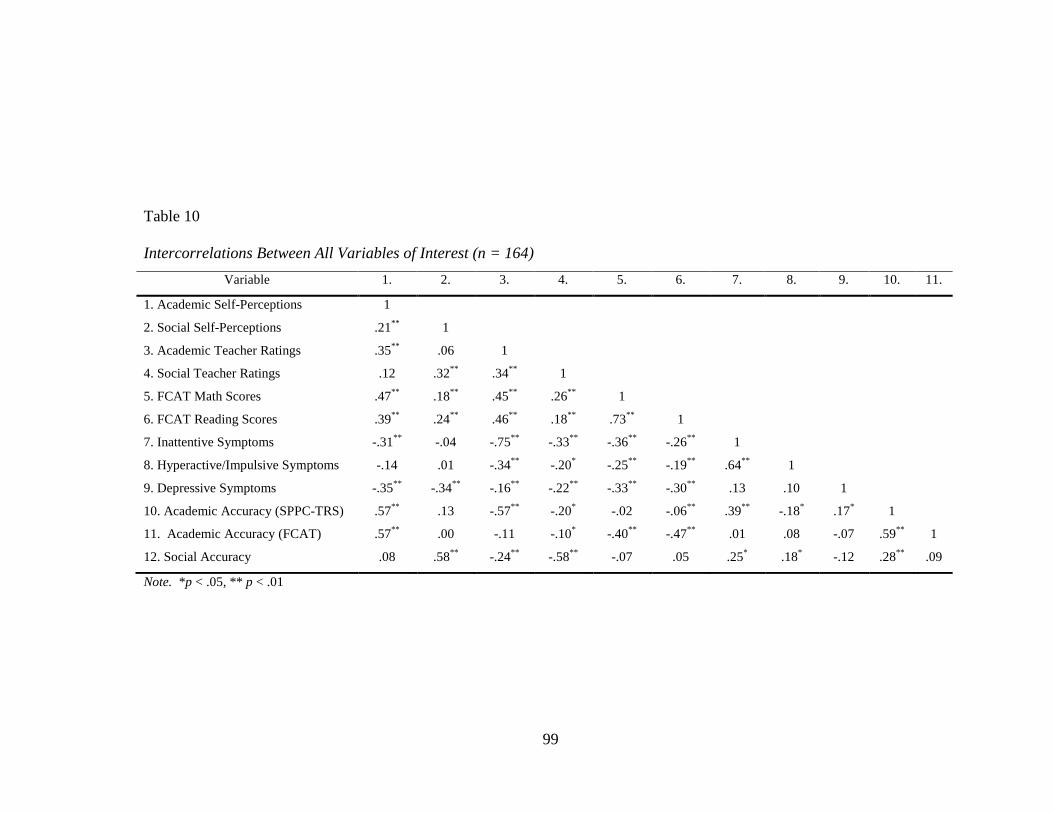
99
Note. *p < .05, ** p < .01
Table 10
Intercorrelations Between All Variables of Interest (n = 164)
Variable 1. 2. 3. 4. 5. 6. 7. 8. 9. 10. 11.
1. Academic Self-Perceptions 1
2. Social Self-Perceptions .21** 1
3. Academic Teacher Ratings .35** .06 1
4. Social Teacher Ratings .12 .32** .34** 1
5. FCAT Math Scores .47** .18** .45** .26** 1
6. FCAT Reading Scores .39** .24** .46** .18** .73** 1
7. Inattentive Symptoms -.31** -.04 -.75** -.33** -.36** -.26** 1
8. Hyperactive/Impulsive Symptoms -.14 .01 -.34** -.20* -.25** -.19** .64** 1
9. Depressive Symptoms -.35** -.34** -.16** -.22** -.33** -.30** .13 .10 1
10. Academic Accuracy (SPPC-TRS) .57** .13 -.57** -.20* -.02 -.06** .39** -.18* .17* 1
11. Academic Accuracy (FCAT) .57** .00 -.11 -.10* -.40** -.47** .01 .08 -.07 .59** 1
12. Social Accuracy .08 .58** -.24** -.58** -.07 .05 .25* .18* -.12 .28** .09
100
Differences in Symptoms between Groups
To determine if groups of students with negative, accurate, or positive academic
self-perceptions differed on inattention, hyperactive/impulsivity, and depressive
symptoms, a series of three separate MANOVAs were performed for each accuracy
indicator. This omnibus multivariate analysis was selected because it adjusts for the
potential increased risk of Type I error that results from conducting multiple univariate
analyses. Additionally, this analysis allows for the investigation of differences between
groups based on a combination of dependent variables including inattentive,
hyperactive/impulsive, and depressive symptoms. One MANOVA was conducted for
each of the accuracy variables (2 for the academic domain, and one for the social
domain). An alpha level of .05 was used to determine statistical significance. Significant
MANOVAs were followed-up with univariate analyses (ANOVAs) to determine the
specific symptom type on which the groups may differ, followed by Tukey tests to
determine which groups differed from the other on the particular symptom type. With
the follow-up analyses, a Bonferroni adjustment was utilized to control for type I error by
setting a more stringent alpha value of .017 (.05/3 for three dependent variables).
Assumptions. All assumptions of MANOVA were examined prior to conducting
analyses to determine if MANOVA was an appropriate method to answer these research
questions. Sampling was considered in order to determine if the assumption of
independence of observations was met. Although students were clustered within two
schools and therefore responses are not truly independent, the sample was drawn from a
well-defined population (middle school students) and the assumption of independence of
observation vectors is not a significant concern. However, it is important to note that
101
these results are not likely to generalize to the whole population, but rather to middle
school students similar to those sampled within the current study. To assess the
normality of the current data set, examinations of skewness and kurtosis, as well as
multivariate and univariate outliers occurred during data screening. The presence of
outliers and some evidence of higher than desirable skew or kurtosis values is not
considered to be a concern because a sample size of 164 students will allow for robust
results despite any instances of non-normality (Tabachnick & Fidell, 2007) and all scores
fell within expected ranges. The linearity assumption was examined by generating a
matrix of scatterplots to determine if a linear relationship exists between all pairs of
dependent variables. No evidence of non-linearity was noted in the examination of these
scatterplots; therefore the linearity assumption was satisfied. Significant Box’s M
statistics indicated that the homogeneity of variance-covariance matrix assumption was
violated; there is evidence of unequal covariance when the indicator of competence was
academic teacher ratings (Box’s M = 70.73, F (12, 104667.79) = 5.73, p = .00), FCAT
scores (Box’s M = 42.13, F (12, 114155.49) = 3.415, p = .00), and social teacher ratings
(Box’s M = 45.80, F (12, 121044.06) = 3.71, p = .00). Tabachnick and Fidell (2007)
purport that Box’s M can be too strict with larger sample sizes, it is very sensitive to
violations of normality, and violations of this assumption are more robust when sample
sizes per group are large. While MANOVA is considered to be an appropriate analysis
technique, knowing that assumptions have been violated indicate that caution should be
used when interpreting the results of the current study. Further precautions were taken
when interpreting multivariate test statistics by examining Pillai’s Trace for significance
instead of the more common Wilks’ Lamda. Pillai’s Trace is suggested to be more robust
102
to violations of assumptions and is robust when the number of participants in each group
is unequal (Tabachnick & Fidell, 2007).
MANOVA Results. Results of multivariate analysis of variance (MANOVA) are
presented separately for each of the three separate indicators of competence utilized to
group students by negative, accurate, and positive self-perceptions. Group means and
standard deviations for each symptom (i.e., inattentive, hyperactive/impulsive, and
depressive symptoms) are presented following each description of MANOVA results.
Groups based on academic self-perceptions and teacher ratings. A one-way
between-groups MANOVA was performed to investigate differences in symptoms across
groups of students with varying accuracy of academic self-perceptions based on teacher
ratings of academic competence. Three dependent variables were examined: inattentive
symptoms, hyperactive/impulsive symptoms, and depressive symptoms. The independent
variable was group membership (negative, accurate, or positive) based on discrepancy
scores between academic self-perceptions and teacher ratings of academic competence.
Statistically significant differences between self-perception group means were found
among the combined symptom variables (inattentive, hyperactive/impulsive, and
depressive symptoms), Pillai’s Trace 0.23, F (6, 320) = 6.89, p = .00; partial eta squared
= .11.
Given the significance of the omnibus test, univariate main effects were
examined. Significant main effects for all of the symptom variables were found using a
Bonferroni adjusted alpha of .017. These included inattentive symptoms F (2, 161) =
12.95, p = .000, partial eta squared = .14, hyperactive/impulsive symptoms F (2, 161) =
5.35, p = .006, partial eta squared = .06, and depressive symptoms F (2, 161) = 4.27, p =

103
.016, partial eta squared = .05. The partial eta squared values indicate that 14% of the
variance in inattentive symptoms can be explained by their membership in either the
negative, accurate, or positive self-perceptions group, compared to only 6 and 5 percent,
respectively, for hyperactive/impulsive and depressive symptoms.
Tukey post-hoc comparisons of the three self-perceptions groups consisted of
conducting pairwise comparisons to determine which symptoms were related to the
negative, accurate, and positive groups. Each pairwise comparison was tested at the .05/3,
or .017 Bonferroni adjusted significance level. Results indicate that the positive
perceptions group had significantly higher inattentive symptoms when compared to the
negative and accurate self-perception groups (which did not significantly differ from each
other on inattentive symptoms). Additionally, the accurate and the positive group
differed on levels of hyperactive/impulsive symptoms, with the positive self-perceptions
group having significantly higher levels of hyperactive/impulsive symptoms. When
using the adjusted alpha level, no statistically significant difference in depressive
symptoms was noted between pairs of groups; however, the trend in the data was for the
negative self-perception group to have higher levels of depressive symptoms than the
positive self-perception group (alpha = .018). Descriptive statistics were calculated by
group (e.g., negative, accurate, positive self perception; see Table 11).
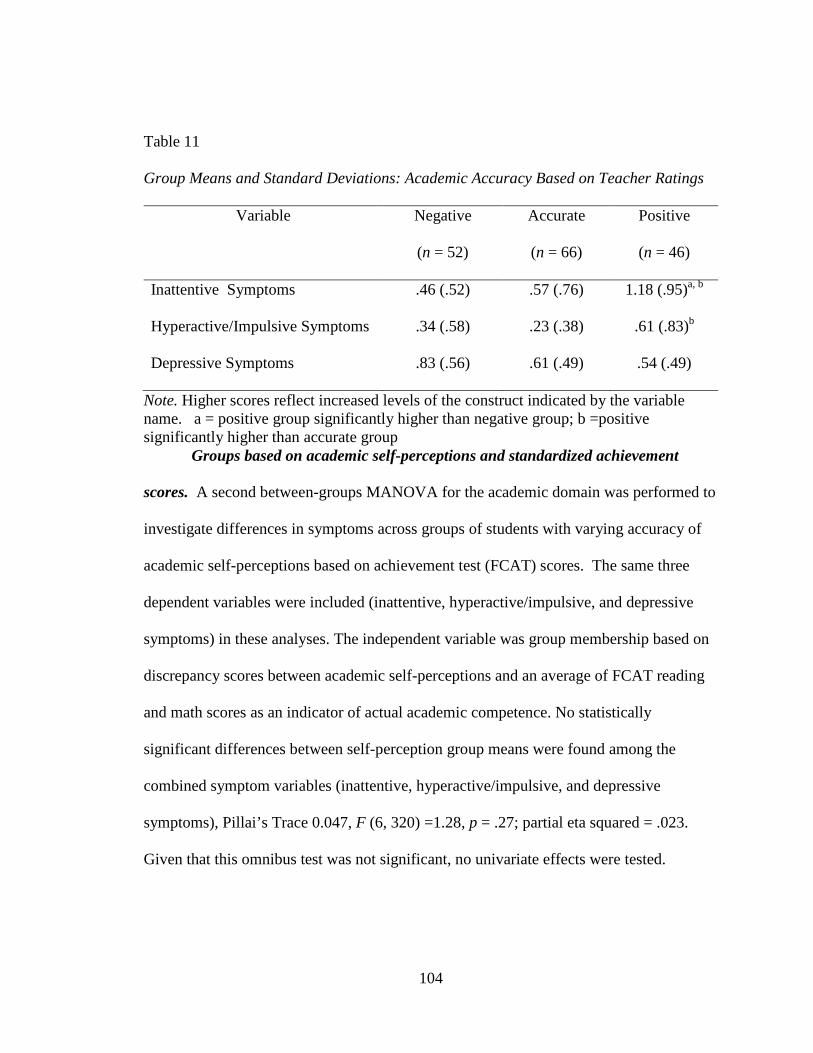
104
Table 11
Group Means and Standard Deviations: Academic Accuracy Based on Teacher Ratings
Variable Negative
(n = 52)
Accurate
(n = 66)
Positive
(n = 46)
Inattentive Symptoms .46 (.52) .57 (.76) 1.18 (.95)a, b
Hyperactive/Impulsive Symptoms .34 (.58) .23 (.38) .61 (.83)b
Depressive Symptoms .83 (.56) .61 (.49) .54 (.49)
Note. Higher scores reflect increased levels of the construct indicated by the variable name. a = positive group significantly higher than negative group; b =positive significantly higher than accurate group Groups based on academic self-perceptions and standardized achievement
scores. A second between-groups MANOVA for the academic domain was performed to
investigate differences in symptoms across groups of students with varying accuracy of
academic self-perceptions based on achievement test (FCAT) scores. The same three
dependent variables were included (inattentive, hyperactive/impulsive, and depressive
symptoms) in these analyses. The independent variable was group membership based on
discrepancy scores between academic self-perceptions and an average of FCAT reading
and math scores as an indicator of actual academic competence. No statistically
significant differences between self-perception group means were found among the
combined symptom variables (inattentive, hyperactive/impulsive, and depressive
symptoms), Pillai’s Trace 0.047, F (6, 320) =1.28, p = .27; partial eta squared = .023.
Given that this omnibus test was not significant, no univariate effects were tested.

105
Despite the lack of statistical significance, between group means of inattentive,
hyperactive/impulsive and depressive symptoms were examined across groups (e.g.,
negative, accurate, positive self perception; see Table 12). All three groups had similar
mean levels of inattentive and depressive symptoms.
Table 12
Group Means and Standard Deviations: Academic Accuracy Based on FCAT Scores
Variable Negative
(n = 52)
Accurate
(n = 63)
Positive
(n = 49)
Inattentive Symptoms .69 (.79) .72 (.84) .69 (.81)
Hyperactive/Impulsive Symptoms .28 (.42) .33 (.59) .52 (.79)
Depressive Symptoms .65 (.48) .69 (.60) .63 (.47)
Note. Higher scores reflect increased levels of the construct indicated by the variable name.
Groups based on social self-perceptions and teacher ratings. A final one-way
between-groups MANOVA was performed to investigate differences in symptoms across
groups of students with varying accuracy of social self-perceptions. Teacher ratings were
the only indicator of actual social competence available and thus utilized in the current
study. Inattentive, hyperactive/impulsive, and depressive symptoms were the dependent
variables. The independent variable was group membership based on discrepancy scores
between a student’s social self-perceptions and teacher social competence ratings.
Statistically significant differences between self-perception group means were found
among the combined symptom variables (inattentive, hyperactive/impulsive, and
depressive symptoms), Pillai’s Trace 0.115, F (6, 320) = 3.27, p = .004; partial eta
squared = .06. Because the MANOVA omnibus test was significant, univariate main

106
effects were examined. Significant main effects were found for both ADHD symptoms
using a Bonferroni adjusted alpha of .017. These include inattentive symptoms F (2,
161) = 9.04, p = .00, partial eta squared = .10 and hyperactive/impulsive symptoms F (2,
161) = 4.42, p = .014, partial eta squared = .05. The three groups were not found to
significantly differ on their levels of depressive symptoms F (2, 161) = .87, p = .42,
partial eta squared = .011. The partial eta squared data indicate that 10% of the variance
in inattentive symptoms can be explained by their membership in either the negative,
accurate, or positive self-perceptions group, compared to 5% for hyperactive/impulsive
symptoms.
Post hoc analyses were conducted for only inattentive and hyperactive/impulsive
symptoms because univariate follow-up tests were not significant for depressive
symptoms. Each pairwise comparison was tested at the .05/3, or .017 Bonferroni
adjusted significance level. Results parallel the findings from teaching ratings in the
academic domain for inattentive symptoms. Specifically, the positive perceptions group
had significantly higher inattentive symptoms compared to the negative and accurate self-
perception groups. When using the adjusted alpha level, no statistically significant
difference in hyperactive/impulsive symptoms was noted across the groups. The mean
and standard deviations were also calculated for each group (e.g., negative, accurate,
positive self perception; see Table 13). When examining descriptive data, the positive
self-perception group appears to have a trend for higher mean levels of
hyperactive/impulsive symptoms than the other 2 groups. Additionally, similar mean
levels of depressive symptoms were found across the three groups.

107
Table 13
Group Means and Standard Deviations: Social Accuracy Based on Teacher Ratings
Variable Negative
(n = 56)
Accurate
(n = 58)
Positive
(n = 50)
Inattentive Symptoms .56 (.72) .51 (.73) 1.09 (.87)a, b
Hyperactive/Impulsive Symptoms .27 (.47) .29 (.46) .58 (.84)
Depressive Symptoms .73 (.54) .60 (.48) .66 (.56)
Note. Higher scores reflect increased levels of the construct indicated by the variable name. a = positive group significantly higher than negative group; b =positive significantly higher than accurate group Summary of Results
In summary, groups of young adolescents with accurate versus discrepant self-
perceptions of academic and social abilities were found to differ on inattentive,
hyperactive/impulsive, and depressive symptoms when teacher ratings were used as the
criterion (see Table 14). Specifically, when accuracy of academic self-perceptions was
determined using teacher ratings as the criterion, univariate tests showed significant main
effects for all three symptoms (inattentive, hyperactive/impulsive, and depressive
symptoms). Both inattentive and hyperactive/impulsive symptoms were found to be
significantly higher in the positive self-perception or PIB group compared to the other
two groups. In the social domain, significant main effects were identified for inattentive
and hyperactive/impulsive symptoms, and statistically significant differences in
inattentive and hyperactive/impulsive symptoms between the groups were detected.
Follow-up tests indicated that inattentive symptoms were significantly higher in the
positive self-perception group compared to the other two groups while there were no
significant differences in hyperactive/impulsive symptoms between groups in the social
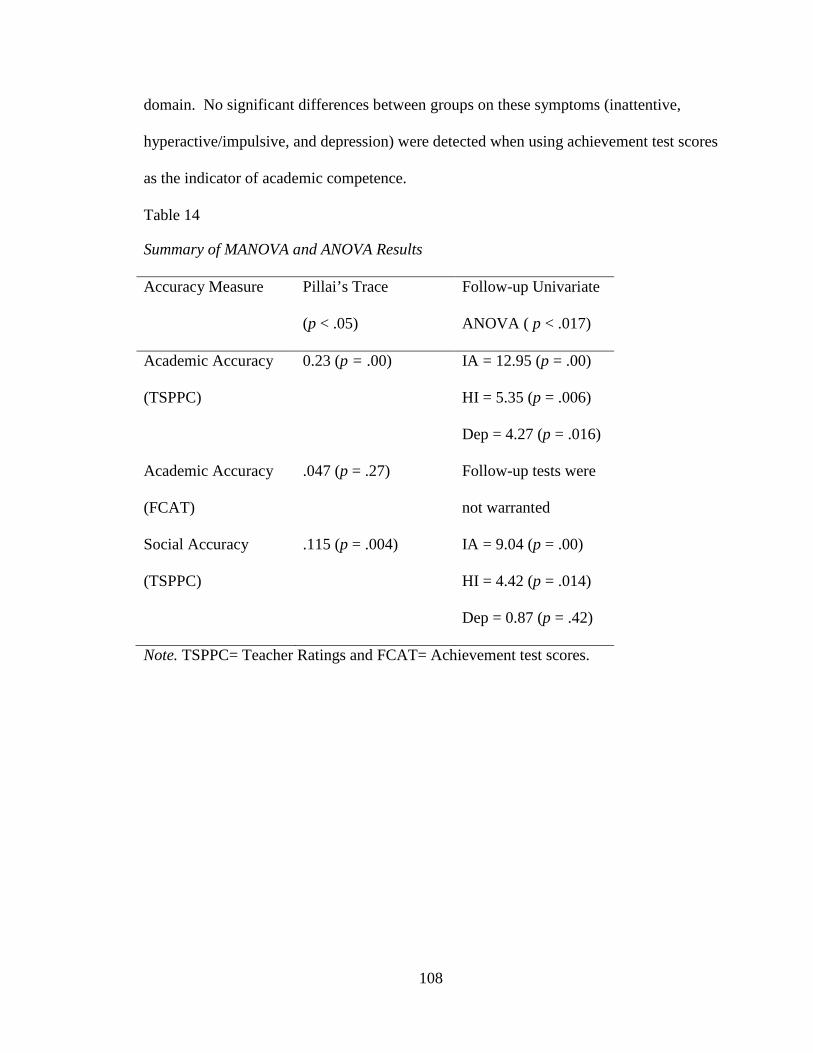
108
domain. No significant differences between groups on these symptoms (inattentive,
hyperactive/impulsive, and depression) were detected when using achievement test scores
as the indicator of academic competence.
Table 14
Summary of MANOVA and ANOVA Results
Accuracy Measure Pillai’s Trace
(p < .05)
Follow-up Univariate
ANOVA ( p < .017)
Academic Accuracy
(TSPPC)
0.23 (p = .00) IA = 12.95 (p = .00)
HI = 5.35 (p = .006)
Dep = 4.27 (p = .016)
Academic Accuracy
(FCAT)
.047 (p = .27) Follow-up tests were
not warranted
Social Accuracy
(TSPPC)
.115 (p = .004) IA = 9.04 (p = .00)
HI = 4.42 (p = .014)
Dep = 0.87 (p = .42)
Note. TSPPC= Teacher Ratings and FCAT= Achievement test scores.

109
Chapter V: Discussion
The current study investigated how groups of middle school students with
negative, accurate, or positive perceptions of competence differ on inattentive,
hyperactive/impulsive and depressive symptoms. Multiple indicators of actual
competence were utilized to determine the accuracy of self-perceptions across the
academic and social domains. The primary purpose of this study was to gain an
understanding of whether the PIB persists for young adolescents with elevated ADHD
symptoms. Research questions addressed include the degree to which groups of students
with negative, accurate or positive self-perceptions of competence differ on inattention,
hyperactivity/impulsivity, and depressive symptoms (1) in the academic domain when
teacher ratings were used as an indicator of actual academic competence, (2) in the
academic domain when achievement test scores were used as an indicator of actual
academic competence, and (3) in the social domain when teacher ratings were used as an
indicator of actual social competence. This chapter summarizes the results of the current
study and relates these findings to existing literature. The chapter also includes a
discussion of limitations of this research, and implications for both research and practice.
Key Findings from Descriptive Analyses
Findings from preliminary descriptive analyses indicate that more inattentive
symptoms were present in this sample of young adolescents compared to
hyperactive/impulsive symptoms. This is consistent with extant literature findings that

110
suggest that inattention is the most common presenting symptom for adolescents with
ADHD as hyperactive/impulsive symptoms may become less visible during adolescence
(Wolraich et al., 2005). In terms of self-concept, average academic and social self-
concept ratings were high (above 3 on a 1-4 scale) and nearly identical, suggesting that
on average the young adolescents within this sample viewed their competence highly
across both of these important domains. Interestingly, past literature suggests that self-
concept becomes more differentiated across domains in early adolescence (Harter, 2006).
It is important to note that while group means were similar across domains, correlations
between these self-perception scores were low, suggesting that individuals do
differentiate between their academic and social competence. A similar pattern was noted
when examining teacher ratings of social and academic competence, with average ratings
being high and very similar across these domains, but with correlations suggesting that
teachers differentiate across ratings of academic and social competence.
One other interesting relationship was identified when examining the descriptive
data. Specifically, significant associations were found between group status and gender.
Females were more likely to fall within the negative self-perception group, which is
consistent with past literature suggesting that females may be more prone to lower self-
perceptions during adolescence (Harter, 1999). More males were shown to have positive
self-perceptions in the academic domain, while there was an even split between males
and females with positive social self-perceptions. Unlike the current sample which
consisted of more female young adolescents than males, the majority of past studies on
the PIB have consisted of samples of boys with ADHD (e.g., Hoza et al., 2002). There is
currently a lack of consensus in past literature related to the relationship between gender

111
and the PIB, but it is suggested that the PIB is present across both genders (Owens et al.,
2007).
Differences in Symptoms between Self-Perception Groups
Academic Domain. Multiple indicators of actual academic competence were
used to achieve a multi-source perspective of students’ actual academic abilities. Students
were identified as having negative, accurate, or positive self-perceptions based on the
discrepancy scores between their academic self-perceptions and their actual competence
based on (1) teacher ratings of academic competence, and (2) achievement test scores
(i.e., FCAT scores). Comparing results across these two indictors of academic
competence suggests that the symptoms present (i.e., inattentive, hyperactive/impulsive,
and depression) among self-perception groups differed depending on which indicator of
competence was utilized for determining if a student has negative, accurate, or positive
perceptions of their academic competence. This is in contrast with past findings
suggesting that accuracy based on teacher ratings and standardized achievement tests
both yield significant relationships with ADHD symptoms (Owens & Hoza, 2003). It is
important to note that Owens and colleagues found that the relationship between accuracy
of academic self-perceptions and ADHD symptoms was stronger when teacher ratings
were used, as was the case in the current study. Thus, it appears that the indicator of
actual competence selected for comparison may have an impact on findings related to the
presence of the PIB.
When teacher ratings were utilized as the indicator of academic competence, the
self-perception groups were shown to differ in terms of both ADHD and depressive
symptoms. Follow up tests suggest that 14% of the variance in inattentive symptoms was

112
explained by self-perception group status, compared to 5% and 6% for depressive and
hyperactive/impulsive symptoms, respectively. The positive self-perception group had
significantly higher levels of both inattentive and hyperactive/impulsive symptoms
compared to the accurate and negative self-perception groups. In contrast, the negative
self-perception group had the highest mean levels of depressive symptoms compared to
the other groups. Despite a significant main effect, pairwise comparisons with the
significance level adjusted to control for type I error suggest that depressive symptoms do
not significantly differ between pairs of groups. Overall, results are consistent with past
literature in suggesting that individuals in the positive group, the group of students who
are displaying the PIB, have higher levels of ADHD symptoms compared to the other
two groups (Owens & Hoza, 2003). These results also suggest that the negative group
had a trend toward higher levels of depressive symptoms. Two previous studies
investigating depression that compared positive illusions among two groups of students
with ADHD, those with and without depression, found that students with ADHD and
depression were similar to their non-diagnosed peers in that they did not overestimate
their competence. These studies demonstrated that the presence of depression may lead to
more accurate self-evaluations for students with ADHD (Hoza et al., 2002; 2004). Other
studies with non-ADHD samples have investigated the influence of depressive symptoms
on self-perceptions and found that depression is related to negative self-perceptions
(Gladstone & Kaslow, 1995; Kistner, David-Ferdon, Repper, & Joiner, 2006). Consistent
with past literature, ADHD and depressive symptoms were found to be differentially
associated with self-perception group in the current study. Students with higher levels of
ADHD symptoms, particularly inattentive symptoms, were found to display positive

113
academic self-perceptions compared to teacher ratings, whereas the negative self-
perception group demonstrated a trend of higher levels of depressive symptoms.
Notably, there were no statistically significant differences in ADHD or depressive
symptoms between self-perception groups formed on the basis of achievement test
scores. Despite the lack of statistically significant differences between groups, the
positive self-perception group showed a trend for higher levels of hyperactive/impulsive
symptoms compared to the other two groups when achievement test scores were used as
the indicator of competence. Although it was determined that this difference was non-
significant, this observed trend is in line with the only past study that has examined the
relationship between the PIB and ADHD subtype, which found that the PIB was more
common in students with hyperactive/impulsive symptoms compared to inattentive
symptoms (Owens & Hoza, 2003).
These authors also found differing results when teacher ratings or achievement
test scores were used as the indicator of actual academic competence. In line with the
current research, more overestimation was evidenced when teacher ratings were used as
the criterion to compare with self-perceptions (Owens & Hoza, 2003). There are several
possible explanations for these findings. Eisenberg and Schneider (2007) investigated
teacher perceptions of children with ADHD and found that teachers in their sample had
negatively biased perceptions of the academic abilities of students with ADHD that were
beyond what could be explained by the students’ achievement test scores. Thus, it is
possible that negative teacher bias contributed to differences in findings between self-
perception groups based on teacher ratings and FCAT scores as indicators of actual
competence (Eisenberg & Schneider, 2007). The differences between the two indicators

114
could be attributed to the fact that state-wide achievement tests may not measure
academic abilities that are commensurate with the types of academic skills that students
and/or teachers consider when rating overall academic competence. While achievement
tests such as the FCAT primarily measure academic knowledge, teacher ratings may
account for a wider range of academic competencies such as organization, study skills,
and engagement (Owens & Hoza, 2003). These skills, known as academic enablers, have
been shown to contribute to the academic underachievement of students with ADHD
(Volpe, DuPaul, DiPerna, Jitendra, Lutz, Tresco, et al., 2006). Because these enabling
skills have been demonstrated as an important component of academic achievement,
teacher ratings may be a valuable indicator of competence because they may include
information about competence in specific academic subjects, as well as general skills like
academic enablers.
In sum, when teacher ratings were used to determine self-perception grouping, the
positive self-perception group was shown to have significantly higher levels of both
ADHD symptoms (i.e., inattentive and hyperactive/impulsive symptoms). As in past
research, higher levels of ADHD symptoms are associated with positive illusions of
academic competence when compared to teacher ratings (Hoza et al., 2002, 2004; Owens
& Hoza, 2003). However, percentages of variance explained by inattentive (14%) versus
hyperactive/impulsive (6%) symptoms is in contrast to past literature on the PIB which
suggests that hyperactive/impulsive symptoms are more highly related to overestimation
of competence in elementary-age children (Owens & Hoza, 2003). In the current study,
inattentive symptoms accounted for a larger amount of variance than
hyperactive/impulsive symptoms. Potential explanations for this finding are included

115
below in the comparison of inattentive versus hyperactive/impulsive symptoms. It is
important to gain insight into the relationship between the PIB and inattentive symptoms,
as these symptoms tend to become more prominent than hyperactive/impulsive symptoms
as students enter adolescence (Wolriach et al., 2005), as shown by the higher prevalence
of elevated inattentive symptoms in this middle school sample.
Social Domain. When investigating the differences in overall symptoms across
groups of middle school students with varying accuracy of social self-perceptions, the
three self-perception groups differed in terms of ADHD symptoms. In contrast to the
academic domain, teacher ratings were used as the only indicator of social competence.
Follow-up tests suggest that group status has significant main effects on inattentive and
hyperactive/impulsive symptoms, with 10% of the variance in inattentive symptoms
explained by self-perception group status, compared to 5% for hyperactive/impulsive
symptoms. Groups did not differ significantly on depressive symptoms at the univariate
level. Post hoc analyses indicate that the positive perception group had significantly
higher inattentive symptoms compared to the other groups. Hyperactive/impulsive
symptoms were not found to significantly differ across groups when pairwise
comparisons adjusted to control for type I error were conducted. When examining mean
scores, the positive self-perception group had higher levels of hyperactive/impulsive and
inattentive symptoms, and although results were not significant, the negative self-
perception group demonstrated a trend of higher levels of depressive symptoms,
compared to the other two groups.
Notably, the relationship between group membership and inattentive symptoms in
the academic domain was demonstrated to be slightly stronger than the relationship
116
shown in the social domain (when teacher ratings were used as the indicator of
competence in both domains). It is unclear why the magnitude of this relationship is
slightly stronger in the academic versus the social domain. One potential explanation is
that students with higher levels of inattentive symptoms have been shown to experience
greater academic difficulties and less peer problems than children with predominantly
hyperactive/impulsive symptoms (Gaub & Carlson, 1997). Past literature on the PIB
suggests that boys with ADHD tend to overestimate their competence the most in the
domains where they experience the greatest impairment (Hoza et al., 2002). Perhaps
greater academic impairments for students with high levels of inattentive symptoms
contribute to the differences in the variance in inattentive symptoms accounted for by
membership in the negative, accurate, or positive self-perception group.
In sum, groups were found to differ significantly on inattentive and
hyperactive/impulsive symptoms in the social domain, with the positive self-perception
group having significantly higher levels of inattentive symptoms compared to the other
two groups. Symptoms of depression were statistically similar across groups. Because
the only previous study examining specific ADHD subtype focused solely on the
academic domain (Owens & Hoza, 2003), these findings about the relationship between
specific ADHD symptoms and accuracy within the social domain cannot be compared to
any past literature. One study investigating the overall intensity of ADHD symptoms
suggested that higher levels of overall ADHD symptoms were more highly related to the
PIB in the social domain (Diamantopoulou et al., 2005). However, this study and others
focusing solely on ADHD as a diagnosis (Hoza et al., 2004) did not examine the
influence of hyperactive/impulsive and inattentive symptoms separately. Past research
117
suggests that social impairments differ based on ADHD subtype, with inattentive
symptoms related to shyness and social passivity (Hodegens et al., 2000) and
hyperactive/impulsive symptoms linked to interrupting or intruding in social
conversations and limited consideration of social consequences (Barkley, 2006).
Children with predominantly hyperactive/impulsive symptoms have been shown to
experience more social difficulties than students with symptoms of inattention (Gaub &
Carlson, 1997). While it is well documented that ADHD symptoms are associated with
positive illusions within the social domain (Owens et al., 2007), the current study
suggests that the overestimation of social competence may be more highly associated
with inattentive symptoms compared to hyperactive/impulsive symptoms. Further
research should be conducted in order to provide more definitive conclusions regarding
the relationship between specific ADHD symptoms and accuracy of self-perceptions in
the social domain.
Comparison of Inattentive and Hyperactive/Impulsive Symptoms
Results suggest that higher levels of inattentive symptoms are associated with
positive self-perceptions when teacher ratings were used as the indicator of academic and
social accuracy. This suggests a relationship between the PIB and inattentive symptoms
in young adolescence. While hyperactive/impulsive symptoms were also found to be
significantly related to group status, twice as much variance was accounted for by
inattentive for both the academic (14%) and social (10%) domains compared to
hyperactive/impulsive symptoms (6% and 10%, respectively). This is in contrast to past
literature on the PIB which suggests that hyperactive/impulsive symptoms are more
highly related to overestimation of competence in elementary-age children (Owens &

118
Hoza, 2003). The only study to investigate differences in the PIB across ADHD
subtypes, which included elementary-age students, found only one marginally significant
(p < .10) result indicating higher levels of inattentive symptoms may be associated with
overestimation of academic competence when based on teacher ratings (Owens & Hoza,
2003). However, the authors suggest that this finding be interpreted with caution as their
overall results demonstrated more support for significant associations between
hyperactive/ impulsive symptoms and the presence of the PIB in the academic domain
(Owens & Hoza, 2003). Given that the current findings related to the importance of
inattentive symptoms are unique when compared to previous literature (e.g., Owens &
Hoza, 2003), it is important to generate possible explanations of why these symptoms
may be more highly associated with accurate versus discrepant group membership in the
current study. Notably, the univariate statistical analyses utilized in the current study did
not account for high intercorrelation between the ADHD symptoms, which could have
influenced that amount of variance that was suggested to be accounted for by inattentive
or hyperactive/impulsive symptoms alone. Because the current study included students
who are older than participants in the majority of past research (which have included
elementary-age students), inattentive symptoms were more prevalent than
hyperactive/impulsive symptoms among participants within the current sample. This is
in line with past research suggesting that inattentive symptoms are more common and
visible than hyperactive/impulsive symptoms among adolescents with ADHD (Wolraich
et al., 2005). Depressive symptoms have also been shown to become much more
prevalent among adolescents with ADHD compared to children (Barkley, 2006; Bird et
al., 1993).

119
Furthermore, the accumulation of negative feedback related to academic and/or
social impairments over time for middle school students with symptoms of ADHD could
contribute to findings that overestimation of competence is related to both ADHD
symptoms (not just hyperactive/impulsive as in past research with elementary-age
samples; Owens & Hoza, 2003). While the effect of negative feedback for students with
ADHD has not been directly evaluated, Ohan and Johnston (2002) found that boys with
ADHD who received positive feedback tended to lower their self-perceptions, while no
change was noted when boys received average or no feedback. These authors suggest
that this finding may be related to the need to protect ones self-image, and that when the
elementary age boys in their study received positive feedback the need for self-protection
was diminished and thus they provided more realistic self-ratings. These findings
suggest that an accumulation of negative feedback over time may lead to increased need
for self-protection during adolescence. Furthermore, current longitudinal research
including adolescents with ADHD supports the self-protective hypothesis as the most
viable explanation of the PIB (Hoza et al., 2010). Lastly, self-concept literature suggests
that feedback from others is viewed as more important during adolescence compared to
other developmental stages (Harter, 1999; Marsh, 1994). Adolescents with impairments
associated with ADHD symptoms may be likely to inflate their self-ratings in an effort to
protect their self-image in the face of negative feedback from others (e.g., teasing from
peers, poor grades, negative feedback from parents and teachers about academic and/or
social performance, etc.).
Future research examining differences between specific ADHD symptoms is
needed in order to further understand the different findings of the current study compared
120
to the past study investigating the PIB among different ADHD subtypes (Owens & Hoza,
2003). The findings from the current study add insight into the presence of the PIB
among young adolescents, as inattentive symptoms tend to become more prominent than
the hyperactive/impulsive symptoms during this developmental stage.
Implications and Future Directions: Research and Practice
Implications for Research. The current study makes a significant contribution to
the existing literature on self-perceptions among students with ADHD in several ways.
Specifically, the sample and methodology used in the current study is unique compared to
past research on the PIB, a continuum of ADHD and depressive symptoms are considered
rather than only clinical levels, and the discrepancy method incorporating multiple
indicators of competence was utilized. Directions for future research are also discussed.
First, the sample and sampling procedures utilized in the current study are quite
different than the majority of the past research focusing on the PIB. This study has
served to extend the investigation of the PIB to young adolescents, as the majority of past
literature on the PIB has been conducted with elementary-age samples. Age is an
important consideration when examining the PIB because specific areas of impairment
and the presence and severity of ADHD and comorbid symptoms may change for
adolescents compared to children. For this reason, findings from past research conducted
with elementary age children is unlikely to generalize to young adolescent, adolescent, or
young adult samples. This underscores the importance of conducting longitudinal and
cross-sectional research with middle school, high school, and college age samples to
understand how the PIB is impacted by accumulation of feedback and experience,
changes in impairment, and symptoms as students grow older.

121
Second, past research on the PIB has solely investigated the self-perceptions of
clinically referred samples or school-children with diagnosable levels of ADHD
symptoms compared to students without an ADHD diagnosis. Considering symptoms on
a continuum provides insight about the relationship between the degree of ADHD
symptoms and the accuracy or bias of self-perceptions across two important domains.
Findings from this study suggest that investigating the full range of symptoms and
grouping students based on the accuracy of their self-perceptions, rather than an ADHD
diagnosis, are alternative methods to investigating the PIB, and may provide insight about
how to better explore this phenomenon within school-based samples. This is particularly
important for adolescents because hyperactive/impulsive symptoms often decrease or
become less visible during this time and symptoms may not reach levels of diagnosable
significance (Wolraich et al., 2005). As additional support for the importance of
considering symptoms on a continuum in relation to self-perception group, a recent study
utilizing a community sample of adolescents with varying levels of ADHD symptoms
found that students with sub threshold levels of ADHD symptoms (i.e., symptoms present
but not meeting diagnostic criteria) are at higher risk of negative school outcomes than
their counterparts who are diagnosed with ADHD. Furthermore, students with ADHD
and sub threshold ADHD symptoms were at significant risk for continued functional
impairment through adolescence (Bussing et al., 2010). This study suggests the
importance of considering a full range of ADHD symptoms when conducting research
with this population in order to best inform prevention and intervention efforts. Because
the findings in the present study are different when compared to the only other study that
has looked at severity of both inattention and hyperactive/impulsive symptoms (Owens &

122
Hoza, 2003), additional research using older age groups and symptom severity rather than
diagnosis is warranted in hopes that more research will shed light on these contradictory
findings.
The diverse nature of this sample is an additional important contribution to the
PIB literature, as the majority of the extant research has used samples consisting of
primarily elementary-age Caucasian males. It is noteworthy that there were significant
differences in the accuracy of self-perceptions between the two middle schools included
in the current study, especially considering the difference in ethnicity and SES of the
student bodies across the two schools. Further research using diverse samples will allow
for a better understanding of whether the PIB phenomenon extends to more diverse
groups of students. Additionally, future research should explore demographic features
beyond those examined in the current study (i.e., gender, school, and grade level) to
provide more information about the relationship between the PIB and ethnic or
socioeconomic diversity.
In addition, the investigation of specific ADHD and depressive symptoms among
groups of students with varying self-perceptions adds to the sparse literature that has
taken these variables into account in the study design. Only one study has previously
considered ADHD subtype in their investigation of the PIB (Owens & Hoza, 2003).
While three previous studies have considered the presence of depressive symptoms (Hoza
et al., 2002; 2004; Owens & Hoza, 2003), only one study considered specific levels of
depressive symptoms rather than accounting for only clinical levels of depression (Owens
& Hoza, 2003). More research is needed in order to fully understand the relationship
between positive illusions and specific symptoms in adolescent populations.

123
Only one previous study has grouped students in a similar way to the methods
used in the current study (Gresham et al., 2000). However, this study did not investigate
differences in symptoms across these negative, accurate, or positive groups or make
attempts to explain why the groups differed in their academic and social self-perceptions.
Rather, this study focused on outcomes related to positive and negative illusions of
competence and found that children with positive self-perceptions had more problem
behavior and lower academic competence than students in the other groups (Gresham et
al., 2000). More studies utilizing this type of grouping, rather than grouping based on
symptoms as has occurred in other studies on the PIB (e.g., Owens & Hoza, 2003), will
contribute to the literature by examining factors that differ among students with self-
views that are either discrepant or accurate compared to external indicators of
competence. This methodology allows for specific symptoms and other characteristics
(such as demographic factors) to be compared between students who display the PIB and
those who do not.
Furthermore, the discrepancy methodology utilized in this study is representative
of the current best practice measurement recommendations for the PIB (Owens et al.,
2007). This is the first time that this methodology has been used for students with a full
range of ADHD symptoms, which is a unique contribution to the literature that allows for
the PIB to be investigated in a much broader group of students (those without an ADHD
diagnosis). However, it is important to note that the use of discrepancy scores in this type
of analyses raised challenges in the interpretability of the results. For this reason,
alternatives to calculating discrepancy scores between students’ self-perceptions and an
external criterion should be explored and warrant attention in future research (Owens et
124
al., 2007). Considerations regarding the use of standardized scores in discrepancy
analyses are warranted. Within the current study z-scores created for all self-perception,
teacher rating, and test scores were based on the mean of the entire sample (N = 164).
Notably, previous published studies on the PIB have not explained the comparison
sample that was used (e.g., Evangelista et al., 2008; Owens & Hoza, 2004). Future
research should consider which comparison groups (e.g., entire sample, grade level,
gender specific) may serve as the best reference group to calculate standardized scores,
and should report the selected group in future publications.
An additional challenge for future research in this area will be to develop
alternative, more objective, indicators of competence in all domains of competence. For
example, in the current study multiple indicators of competence (standardized test scores
and teacher ratings) were utilized in the academic domain; however, only teacher ratings
was used as an indicator of social competence. In the future, methods such as direct
observation, task performance measures, peer or teacher nomination methods, or rating
scales could also be utilized as indicators of competence in the social or behavioral
domains. Comparing the accuracy of self-perceptions across multiple indicators of
competence is important because this may provide a fuller picture of a student’s
competence in a given domain. This will also allow for research on the PIB to be
extended to older adolescents and young adults, for whom teacher ratings may not be
available or may not provide a full portrayal of social competence. Within the academic
domain, measurement of the PIB may be advanced by gathering student and teacher
ratings across multiple teachers and subject areas. This is a particularly relevant direction
for extending this research into middle school and high school samples as teachers only

125
see students for one subject, compared to elementary school where teaching multiple
subjects is more typical. This method of measuring the accuracy of academic self-
perceptions is more aligned with Marsh’s conceptualization of self-concept as varying
across specific academic areas (Marsh & Hattie, 1996). Mixed methods research should
also be considered for future investigations of the PIB , as qualitative data gathered from
focus groups or interviews with students with the PIB may provide more insight than
survey methodology about the function of this intriguing phenomenon. This would allow
researchers to ask more specific questions about student, parents, or teacher perceptions
of the PIB in students with symptoms of ADHD. Extensions upon current survey
methodology may also provide insight about factors which discriminate students who
display the PIB in multiple domains from those who display the PIB in only one domain.
Past research suggests that students display the greatest overestimations of competence in
the area where they experience the most impairment (Hoza et al., 2004), but little is
known about why individual variability in the PIB is noted across domains of
competence. These are important direction for future research as many questions remain
unanswered regarding the PIB, such as why the presence of the PIB may change based on
the indicator of competence used for comparison or the specific domain investigated.
Lastly, the question of whether or not the PIB is adaptive is still unanswered by
the current study and other research conducted in this area. In order to fully understand
the PIB, we must first elucidate the function of this phenomenon. The self-protective
hypothesis currently has the most support for explaining the PIB (Hoza et al., 2010), and
thus it is crucial that more research is conducted to confirm or disconfirm the adequacy of
this explanation of the PIB and provide further support for or against the proposed

126
hypotheses for explaining the PIB. The findings from this study also highlight the
importance of considering age level when considering the function of the PIB, as this
may also change as students progress through school.
Implications for Practice. The current study provides preliminary evidence that
the PIB persists into adolescence for students with elevated levels of ADHD symptoms.
Unfortunately, with regard to intervention, the specific actions taken with these students
will be dependent on future research providing information on the function of the PIB
and whether or not the PIB is found to be adaptive or maladaptive. Insight related to the
hypothesis that best explains the PIB for students with symptoms of ADHD will likely
lead to prevention or intervention efforts that either decrease or bolster these overly
positive self-perceptions. Some emerging literature suggests that the PIB may be a risk
factor for increased aggression, and that the PIB does may not serve as a protective factor
against depression (Hoza et al., 2010). These findings that the PIB is likely not adaptive
suggest that interventions for these students prior to adolescence may be warranted,
particularly because comorbid internalizing and externalizing disorders are increasingly
common for adolescents with ADHD (Carlson & Mann, 2000; Crystal et al., 2001).
Furthermore, findings from previous literature suggest that the presence of the PIB may
decrease the effectiveness of behavioral interventions due to adherence issues (Hoza &
Pelham, 1995). Children who do not believe that they are experiencing difficulty in a
given domain may not fully engage in the complex behavioral interventions that may be
necessary to see improvements within their areas of impairment.
Findings from the current study are also important for consideration while
assessing students with ADHD symptoms. The presence of the PIB in this young
127
adolescent sample may suggest that self-report data from students with symptoms of
ADHD may not be accurate. While it is more well-known that students with ADHD may
not provide accurate reports of the externalizing behavior (Barkley, Fischer, Edelbrock,
& Smallish, 1991), findings from the current study and other investigations of the PIB in
children with ADHD symptoms suggest that these students may also provide inaccurate
reports of their academic and social abilities. This information will likely impact how
school psychologists use self-report data as they will need to consider that student reports
merely reflect their perceptions of their abilities and may not truly reflect their
competence. These findings also highlight the importance of getting data from multiple
sources when conducting evaluations related to ADHD. Additionally, differences in
findings between teacher ratings and FCAT scores within the current study serve as a
reminder about the importance of considering multiple sources of information when
evaluating students with ADHD symptoms. It is known that students with ADHD
display inconsistent behavior across settings and depending on the environmental context
(DuPaul & Stoner, 2003), which is further impetus to use multiple sources of information
for any student with symptoms of ADHD. The design of this study may also have
meaningful implications for school-based practices. Unlike past studies on the PIB that
looked at diagnostic criteria for ADHD, this study considered behaviors that were present
from a teacher’s perspective. Beyond diagnosis, understanding the severity of ADHD
symptoms may be more useful for developing interventions that target an individual’s
specific areas of impairment.
Increased understanding and awareness that the PIB may persist into adolescence
may lead to improvements in the current practices used for assessing and intervening to

128
address with this population. The unique challenges and increased demands associated
with the transitions to middle and high school for a student with symptoms of ADHD
underscore the importance of shedding light on this understudied population.
Limitations
There are several limitations of the current study that warrant discussion at this
time. Specifically, limitations related to the use of (1) teacher report, (2) missing data on
the SPPC, (3) a convenience sample, and (4) discrepancy scores are presented.
The first limitation that will be discussed is the use of teacher report as an
indicator of actual competence. While it is acknowledged that teacher reports of
competence may be biased (Eisenberg & Schnieder, 2007), it is important to note that
teachers are suggested to be the most relevant reports for students’ daily concerns
experienced at school (Gadow et al., 2004). Teacher reports were deliberately selected for
this study because teachers have opportunities to observe students in both academic and
social settings. However, the nature of middle school scheduling may limit the ability of
teachers to provide accurate ratings of social and academic competence. This
measurement challenge is unique in comparison to past studies on the PIB, which have
included predominantly elementary-age youth. Middle school students likely see
teachers for only one period rather than for the entire day as is more common in
elementary schools. The use of ratings from only one teacher, rather than all of the
students’ teachers, may be a limitation to the current study as this teacher may not be
equipped to provide ratings of a students’ academic and social competence. Several
attempts were made to account for this potential limitation. First, students’ homeroom
teachers were selected as raters whenever possible because students spend the longest

129
period of the day with this teacher. Additionally, FCAT scores were selected as an
additional indicator of academic competence.
Missing data on the SPPC is also a potential limitation as 12 students were
excluded for completing this measure incorrectly (2 of these students also had missing
data on the two teacher measures used in this study). On the SPPC, students are asked to
read two sentences and decide which one is most like them before deciding if the
statement is “sort of true” or “really true” for them. These students checked one box for
each sentence, therefore providing more than one response per item. These errors were
made despite students receiving additional instructions and a sample of this “structure
alternative format” (Harter, 1982, p. 189) prior to completing the measure. No notable
trends were seen upon examination of the demographic characteristics of the 12 students
excluded due to missing data on this measure; however, it is unknown whether these
students had any unique characteristics that led to their difficulty completing this
measure.
Another potential limitation in the current study is related to the use of a
convenience sample. Because participants were only selected from two middle schools
in one school district results may not generalize to populations which are very different
from the current sample. It must also be considered that students who returned their
parent consent form and who agreed to participate in this study may differ from those
who did not. Precautions were taken to compare the study sample to the demographics of
both of the middle schools and the school district to ensure that all sub-populations of
students were represented. The only notable differences between the current sample and
the school and district demographic data are that females and sixth grade students are

130
overrepresented within the current sample. Despite these limitations, it is important to
note that this sample is substantially more diverse in terms of gender and ethnic
background than past studies investigating the PIB.
In terms of measurement, the use of the discrepancy analysis to determine
accuracy certainly has some limitations. First, there is the potential that children with
higher levels of ADHD symptoms may be more likely to overestimate their competence
because they experience impairments beyond those of children without these symptoms
(Owens et al., 2007). If a student has high competence in an area, a large discrepancy
between self and teacher ratings may not be possible (if they rate themselves as high as
possible, a teacher may not be able to rate them as even more competent). Additionally,
there is increased risk of Type II error with discrepancy scores because the reliability
tends to be significantly lower than the reliabilities of the variables used to calculate the
discrepancy (Edwards, 2001). In the current study, the reliability of the scales used to
calculate the discrepancy ranged from .73 to .92. While these are considered to be
acceptable estimates of reliability, the moderate internal consistency of the social
subscale of the SPPC (α = .73) is a limitation. It is noted that this reliability is similar to
previous research with samples of students in 3rd through 8th grade, with alphas ranging
from .75 to .80 (Harter, 1985). The second limitation relevant to the use of discrepancy
scores is that they tend to be highly correlated with their components (Cronbach, 1958).
This limitation was addressed by calculating and reporting correlations between all
variables of interest. Although there are limitations to the discrepancy approach, this is
currently the best practice standard for measuring the PIB (Owens et al., 2007), and
future research should explore alternatives considering the known limitations of this

131
method.
Conclusions
Findings garnered from the current study suggest that the PIB is present within
the academic and social domains for middle school students, and that students with
overly positive self-perceptions exhibit significantly higher levels of inattentive
symptoms than students with accurate or negative self-perceptions.
Hyperactive/impulsive symptoms were also shown to be prevalent among students in the
positive self-perception group, particularly within the academic domain. This study adds
to the small body of literature that has considered ADHD symptoms, and has gone a step
further by examining levels of ADHD symptoms rather than considering ADHD as a
diagnostic label. Findings are unique when compared to past research in that inattentive
symptoms were more highly related to perceptions of competence that are higher than an
indicator of actual competence in both academic and social domains. The only study that
had previously examined the PIB by specific ADHD subtype suggested that students with
inattentive symptoms were less likely than students with predominantly
hyperactive/impulsive symptoms to display the PIB (Owens & Hoza, 2003). It is
important to note that the prior study considered only the academic domain, and included
students between 9 and 12 years of age. Notably, inattentive symptoms are the most
common presenting symptom for adolescents with ADHD (Wolraich et al., 2005) and
these symptoms were found to be much more prevalent than hyperactive/impulsive
symptoms within the current sample. The differences in findings between the current
study and past research on the PIB underscore the importance of extending this body of
research to older populations. This study also suggests that the presence of the PIB is
132
dependent on the indicator of competence that is selected for comparison with self-
ratings. In the current study, there was only evidence of the PIB when teacher ratings
were used as the indicator of competence in the academic domain.
This body of literature on the PIB would benefit from longitudinal exploration of
the PIB in relation to ADHD symptoms as this type of research design would likely
provide insight about the function of the PIB and about the persistence of the PIB across
developmental periods. This study is also unique in that the level of depressive
symptoms was considered, and students in the negative self-perception group were more
likely to have increased levels of depressive symptoms. Insight gained from the current
study regarding the accuracy of adolescents’ self-perceptions in the social and academic
domains in relation to inattentive, hyperactive/impulsive, and depressive symptoms
provides insight about the presence of the PIB in middle school students, and suggests
that the PIB is demonstrated by young adolescents with elevated ADHD symptoms.

133
References
Achenbach, T. M. (1991). CBCL teacher’s report form for ages 5-18. Burlington, VT:
Center for Children, Youth, & Families, University of Vermont.
Achenbach, T. M., & Edelbrock, C. S. (1983). Manual for the Revised Child Behavior
Profile and Child Behavior Checklist. Burlington: University of Vermont,
Department of Psychiatry.
American Psychiatric Association (APA). (2000). Diagnostic and Statistical Manual of
Mental Disorders (4th Ed.) Text Revision. Washington DC: author.
Barkley, R. A. (2001). The inattentive type of ADHD as a distinct disorder. In H. Quay &
A. Hogan (Eds.), Handbook of disruptive behavior disorders (pp. 295-316). New
York: Plenum Press.
Barkley, R. A. (2003). Attention-deficit/hyperactivity disorder. In E. J. Mash, R. A.
Barkley, E. J. Mash & R. A. Barkley (Eds.), Child psychopathology (2nd ed.). (pp.
75-143). New York, NY: Guilford Press.
Barkley, R. A. (2006). Attention-deficit hyperactivity disorder, 3rd ed.: A handbook for
diagnosis and treatment. New York, NY: Guilford Press.
Barkley, R. A., Fischer, M., Edelbrock, C. S., & Smallish, L. (1990). The adolescent
outcome of hyperactive children diagnosed by research criteria: I. an 8-year
prospective follow-up study. Journal of the American Academy of Child &
Adolescent Psychiatry, 29(4), 546-557.

134
Barkley, R. A., Fischer, M., Edelbrock, C., & Smallish, L. (1991). The adolescent
outcome of hyperactive children diagnosed by research criteria: III. Mother-child
interactions, family conflicts and maternal psychopathology. Journal of Child
Psychology and Psychiatry, 32(2), 233-255.
Berlin, L., & Bohlin, G. (2002). Response inhibition, hyperactivity, and conduct
problems among preschool children. Journal of Clinical Child and Adolescent
Psychology, 31(2), 242-251.
Biederman, J., Mick, E., & Faraone, S. V. (1998). Depression in attention deficit
hyperactivity disorder (ADHD) children: “True” depression or demoralization?
Journal of Affective Disorders, 47, 113-122.
Bird, H. R., Gould, M. S., & Staghezza, B. M. (1993). Patterns of diagnostic comorbidity
in a community sample of children aged 9 through 16 years. Journal of the American
Academy of Child & Adolescent Psychiatry, 32(2), 361-368.
Bracken, B. A. (1992). Multidimensional self-concept scale. Austin, TX: Pro-Ed.
Bracken, B. A. (2009). Positive self-concepts. In R. Gilman, E. S. Huebner & M. J.
Furlong (Eds.), Handbook of positive psychology in schools. (pp. 89-106). New
York, NY: Routledge/Taylor & Francis Group.
Bracken, B. A., Bunch, S., Keith, T. Z., & Keith, P. B. (2000). Child and adolescent
multidimensional self-concept: A five-instrument factor analysis. Psychology in the
Schools, 37(6), 483-493.
Bracken, B. A., & Howell, K. K. (1991). Multidimensional self concept validation: A
three-instrument investigation. Journal of Psychoeducational Assessment, 9, 319-
328.
135
Brown, B. (2004). Adolescents’ relationships with peers. In R. Lehrer & L. Steinberg
(Eds.), Handbook of adolescent psychology (2nd Ed; pp. 363-394). New York, NY:
Wiley.
Bussing, R., Mason D. M., Bell, L., Porter, P., & Garvan, C. (2010). Adolescent
outcomes of children attention-deficit/hyperactivity disorder in a diverse community
sample. Journal of the Academy of Child & Adolescent Psychiatry, 49(6), 595-605.
Cairns, E., McWhirter, L., Duffy, U., & Barry, R. (1990). The stability of self-concept in
late adolescence: Gender and situational effects. Personality and Individual
Differences, 11(9), 937-944.
Carlson, C. L., & Mann, M. (2000). Attention-deficit/hyperactivity disorder,
predominately inattentive subtype. Child and Adolescent Psychiatric Clinics of
North America, 9(3), 499-510.
Carter, A.S., Wagmiller, R.J., Gray, S.A., McCarthy, K.J., Horwitz, S.M., & Briggs-
Gowan, M.J. (2010). Prevalence of DSM-IV Disorder in a Representative, Healthy
Birth Cohort at School Entry: Sociodemographic Risks and Social Adaptation.
Journal of the American Academy of Child and Adolescent Psychiatry, 49, 686-698.
Cole, D. A., Maxwell, S. E., Martin, J. M., Peeke, L. G., Seroczynski, A. D., Tram, J. M.,
et al. (2001). The development of multiple domains of child and adolescent self-
concept: A cohort sequential longitudinal design. Child Development, 72(6), 1723-
1746.
Cooley, C. H. (1902). Human nature and the social order. New York, NY: Charles
Scribner’s Sons.
Coopersmith, S. (1967). The antecedents of self-esteem. San Francisco, CA: W. H.
Freeman.
136
Crain, R. M., & Bracken, B. A. (1994). Age, race, and gender differences in child and
adolescent self-concept: Evidence from a behavioral-acquisition, context-dependent
model. School Psychology Review, 23(3), 496-511.
Cronbach, L. J. (1958). Proposals leading to analytic treatment of social perception
scores. In R. Tahiuiri & L. Petrullo (Eds.), Person perception and interpersonal
behavior (pp. 353-379). Stanford, CA: Stanford University Press.
Crystal, D. S., Ostrander, R., Chen, R., & August, G. (2001). Multimethod assessment of
psychopathology among DSM-IV subtypes of children with attention-
deficit/hyperactivity disorder: Self, parent and teacher reports. Journal of Abnormal
Child Psychology, 29(3), 189-205.
Diamantopoulou, S., Henricsson, L., & Rydell, M. (2005). ADHD symptoms and peer
relations of children in a community sample: Examining associated problems, self-
perceptions, and gender differences. International Journal of Behavioral
Development, 29(5), 388-398.
Diener, M. B., & Milich, R. (1997). Effects of positive feedback on the social interactions
of boys with attention deficit hyperactivity disorder: A test of the self-protective
hypothesis. Journal of Clinical Child Psychology, 26(3), 256-265.
Demo, D. H., & Savin-Williams, R. (1992). Self-concept stability and change during
adolescence. In R. P. Lipka, T. M. Brinthaupt, R. P. Lipka & T. M. Brinthaupt
(Eds.), Self-perspectives across the life span. (pp. 116-148). Albany, NY: State
University of New York Press.
DuPaul, G. J., Anastopoulos, A. D., Power, T. J., Reid, R., Ikeda, M. J., & McGoey, K.
E. (1998). Parent ratings of attention-deficit/hyperactivity disorder symptoms: Factor
137
structure and normative data. Journal of Psychopathology and Behavioral
Assessment, 20(1), 83-102.
Edwards, J. R. (2001). Ten difference score myths. Organizational Research Methods, 4,
265-287.
Eisenberg, D. & Schneider, H. (2007). Perceptions of academic skills of children
diagnosed with ADHD. Journal of Attention Disorders, 10(4), 390-397.
Evangelista, N. M., Owens, J. S., Golden, C. M., & Pelham, W. E. J. (2008). The positive
illusory bias: Do inflated self-perceptions in children with ADHD generalize to
perceptions of others? Journal of Abnormal Child Psychology, 36(5), 779-791.
Florida Department of Education. (2008). FCAT Achievement Levels. Tallahassee, FL:
Author.
Florida Department of Education. (2007). Reading and Mathematics: Technical report for
2006 Florida Comprehensive Assessment Test administrations. Tallahassee, FL:
Author.
Gadow, K. D., Drabick, D. A. G., Loney, J., Sprafkin, J., Salisbury, H., Azizian, A., et al.
(2004). Comparison of ADHD symptom subtypes as source-specific syndromes.
Journal of Child Psychology and Psychiatry, 45, 1135-1149.
Gaub, M., & Carlson, C. L. (1997). Behavioral characteristics of DSM-IV ADHD
subtypes in a school-based population. Journal of Abnormal Child Psychology, 25,
103-111.
Gladstone, T. R., & Kaslow, N. J. (1995). Depression and attributions in children and
adolescents: A meta-analytic review. Journal of Abnormal Child Psychology, 23,
597–606.

138
Gresham, F. L., & Elliot, S. N. (1990) Social Skills Rating System. Circle Pines, MN:
American Guidance Service.
Gresham, F. M., MacMillan, D. L., Bocian, K. M., Ward, S. L., & Forness, S. R. (1998).
Comorbidity of hyperactivity-impulsivity-inattention and conduct problems: Risk
factors in social, affective, and academic domains. Journal of Abnormal Child
Psychology, 26(5), 393-406.
Hanc, T. & Brzezinka, A. I. (2009). Intensity of ADHD symptoms and subjective
feelings of competence in school age children. School Psychology International
30(5), 491-506.
Harter, S. (1982). The perceived competence scale for children. Child Development, 53,
87-97.
Harter, S. (1983). Developmental perspectives on the self- system. In E. M. Hetherington
(Ed.), P. H. Mussen (Series Ed.), Handbook of child psychology: Socialization,
personality, and social development. (4th ed., pp. 275-385). New York, NY: Wiley.
Harter, S. (1985). Manual for the self-perception profile for children. University of
Denver Denver, CO.
Harter, S. (1988). Manual for the self-perception profile for adolescents. University of
Denver, CO.
Harter, S. (1998). The development of self-representations. In W. Damon (Series Ed.) &
N. Eisenberg (Vol. Ed.), Handbook of child psychology, Vol 3, Social, emotional,
and personality development. (5th edition., pp. 553-617). Hoboken, NJ: Wiley.
Harter, S. (1999). The construction of the self: A developmental perspective. New York,
NY US: Guilford Press.

139
Harter, S. (2006). The self. In N. Eisenberg, W. Damon, R. M. Lerner, N. Eisenberg, W.
Damon & R. M. Lerner (Eds.), Handbook of child psychology: Vol. 3, social,
emotional, and personality development (6th ed.;(pp. 505-570). Hoboken, NJ: John
Wiley & Sons Inc.
Harter, S., Bresnick, S., Bouchey, H. A., & Whitesell, N. R. (1997). The development of
multiple role-related selves during adolescence. Development and Psychopathology,
9(4), 835-853.
Harter, S., & Pike, R. (1984). The pictorial scale of perceived competence and social
acceptance for young children. Child Development, 55(6), 1969-1982.
Hodgens, J. B., Cole, J., & Boldizar, J. (2000). Peer-based differences among boys with
ADHD. Journal of Clinical Child Psychology, 29(3), 443-452.
Heath, N. L., & Glen, T. (2005). Positive illusory bias and the self-protective hypothesis
in children with learning disabilities. Journal of Clinical Child & Adolescent
Psychology, 34(2), 272-281.
Hechtman, L., Weiss, G., & Perlman, T. (1980). Hyperactives as young adults: Self-
esteem and social skills. Canadian Journal of Psychiatry, 25(6), 478-482.
Horn, W. F., Wagner, A. E., & Ialongo, N. (1989). Sex differences in school-aged
children with pervasive attention deficit hyperactivity disorder. Journal of Abnormal
Child Psychology, 17(1), 109-125.
Hoza, B., Gerdes, A. C., Hinshaw, S. P., Arnold, L. E., Pelham, W. E. J., Molina, B. S.
G., et al. (2004). Self-perceptions of competence in children with ADHD and
comparison children. Journal of Consulting and Clinical Psychology, 72(3), 382-
391.

140
Hoza, B., Murray-Close, D., Arnold, L. E., Hinshaw, S. P., Hechtman, L., & The MTA
Cooperative Group. (2010). Time-dependent changes in positively biased self-
perceptions of children with attention-deficit/hyperactivity disorder: A
developmental psychopathology perspective. Development and Psychopathology,
22, 375-390.
Hoza, B. & Pelham, W. E. (1995). Social-cognitive predictors of treatment response in
children with ADHD. Journal of Social & Clinical Psychology, 14, 23-35.
Hoza, B., Pelham, W. E. J., Dobbs, J., Owens, J. S., & Pillow, D. R. (2002). Do boys
with attention-deficit/hyperactivity disorder have positive illusory self-concepts?
Journal of Abnormal Psychology, 111(2), 268-278.
Hoza, B., Pelham, W. E., Milich, R., & Pillow, D. (1993). The self-perceptions and
attributions of attention deficit hyperactivity disordered and nonreferred boys.
Journal of Abnormal Child Psychology, 21(3), 271-286.
Hoza, B., Waschbusch, D. A., Owens, J. S., Pelham, W. E., & Kipp, H. (2001).
Academic task persistence of normally achieving ADHD and control boys: Self-
evaluations, and attributions. Journal of Consulting and Clinical Psychology, 69(2),
271-283.
Hoza, B., Waschbusch, D. A., Pelham, W. E., Molina, B. S. G., & Milich, R. (2000).
Attention-deficit/hyperactivity disordered and control boys' responses to social
success and failure. Child Development, 71(2), 432-446.
Hymel, S., Bowker, A., & Woody, E. (1993). Aggressive versus withdrawn unpopular
children: Variations in peer and self-perceptions in multiple domains. Child
Development, 64(3), 879-896.
141
Ialongo, N. S., Lopez, M., Horn, W. F., & Pascoe, J. M. (1994). Effects of
psychostimulant medication on self-perceptions of competence, control, and mood in
children with attention deficit hyperactivity disorder. Journal of Clinical Child
Psychology, 23(2), 161-173.
James, W. (1890). The consciousness of self. In W. James (Ed.), The principles of
psychology, vol I. (pp. 291-401). New York, NY: Henry Holt and Co.
Johnson, B. & Christensen, L. (2004). Educational research: Quantitative, qualitative,
and mixed approaches (2nd ed.). Boston, MA: Allyn and Bacon.
Kadesjö, B., & Gillberg, C. (2001). The comorbidity of ADHD in the general population
of swedish school-age children. Journal of Child Psychology and Psychiatry, 42(4),
487-492.
Kovacs, M. (1992). Children’s Depression Inventory (CDI) manual. North Tonawanda,
NY: Multi-Health Systems.
Kistner, J. A., David-Ferdon, C. F., Repper, K. K., & Joiner, T. E. Bias and accuracy of
children’s perceptions of peer acceptance: Prospective associations with depressive
symptoms. Journal of Abnormal Child Psychology, 34(3), 349-361.
Lahey, B., Applegate, B., McBurnett K., Biederman, J., Greenhill, L., Hynd, G., et al.
(1994). DSM-IV field trials for attention deficit/hyperactivity disorder in children
and adolescents. American Journal of Psychiatry, 151, 1673-1685.
Lahey, B., McBurnett, K., & Loeber, R. (2000). Are attention-deficit/hyperactivity
disorder and oppositional defiant disorder developmental precursors to conduct
disorder? In A. J. Sameroff, M. Lewis, & S.M. Miller (Eds.), Handbook of

142
developmental psychopathology (2nd ed., pp. 431-446.). New York: Kluwer
Academic Plenum.
Lindenman, M., & Behm, K. (1999). Cognitive strategies and self-esteem as predictors of
bracewear complicance among adolescents with juvenile rheumatoid arthritis.
Pediatric Orthopediatry, 19, 494-299.
Manning, M. A., Bear, G. G., & Minke, K. M. (2006). Self-concept and self-esteem. In
G. G. Bear, K. M. Minke, G. G. Bear & K. M. Minke (Eds.), Children's needs III:
Development, prevention, and intervention. (pp. 341-356). Washington, DC:
National Association of School Psychologists.
Marsh, H. W. (1988). Causal effects of academic self-concept on academic achievement:
A reanalysis of newman (1984). Journal of Experimental Education, 56(2), 100-103.
Marsh, H. W. (1990). The structure of academic self-concept: The Marsh/Shavelson
model. Journal of Educational Psychology, 82(4), 623-636.
Marsh, H. W. (1992). Content specificity of relations between academic achievement and
academic self-concept. Journal of Educational Psychology, 84(1), 35-42.
Marsh, H. W. (1993). Relations between global and specific domains of self: The
importance of individual importance, certainty, and ideals. Journal of Personality
and Social Psychology, 65(5), 975-992.
Marsh, H. W. (1994). Using the national longitudinal study of 1988 to evaluate
theoretical models of self-concept: The self-description questionnaire. Journal of
Educational Psychology, 86(3), 439-456.
Marsh, H. W. (2008). A multidimensional, hierarchical model of self-concept: An
important facet of personality. In G. J. Boyle, G. Matthews, D. H. Saklofske, G. J.

143
Boyle, G. Matthews & D. H. Saklofske (Eds.), The SAGE handbook of personality
theory and assessment, vol 1: Personality theories and models. (pp. 447-469).
Thousand Oaks, CA: Sage Publications, Inc.
Marsh, H. W., Debus, R., & Bornholt, L. (2005). Validating young children’s self-
concept responses: Methodological ways and means to understand their responses.
In D. M. Teti (Ed.). Handbook of research methods in developmental science. (pp.
138-160). Oxford, UK: Blackwell.
Marsh, H. W., & Hattie, J. (1996). Theoretical perspectives on the structure of self-
concept. In B. A. Bracken, & B. A. Bracken (Eds.), Handbook of self-concept:
Developmental, social, and clinical considerations. (pp. 38-90). Oxford, England:
John Wiley & Sons.
Marsh, H. W., & O'Mara, A. (2008). Reciprocal effects between academic self-concept,
self-esteem, achievement, and attainment over seven adolescent years:
Unidimensional and multidimensional perspectives of self-concept. Personality and
Social Psychology Bulletin, 34(4), 542-552.
Marsh, H. W., & Shavelson, R. (1985). Self-concept: Its multifaceted, hierarchical
structure. Educational Psychologist, 20(3), 107-123.
Marsh, H. W., Smith, I. D., Marsh, M., & Owens, L. (1988). The transition from single-
sex to coeducational high schools: Effects on multiple dimensions of self-concept
and on academic achievement. American Educational Research Journal, 25(2), 237-
269.

144
McBurnett, K., Pfiffner, L. J., & Frick, P. J. (2001). Symptom properties as a function of
ADHD type: An argument for continued study of sluggish cognitive tempo. Journal
of Abnormal Child Psychology, 29(3), 207-213.
McCullough, G., Huebner, E. S., & Laughlin, J. E. (2000). Life events, self-concept, and
adolescents' positive subjective well-being. Psychology in the Schools, 37(3), 281-
290.
Milich, R., Balentine, A. C., & Lynam, D. R. (2001). ADHD combined type and ADHD
predominantly inattentive type are distinct and unrelated disorders. Clinical
Psychology: Science and Practice, 8(4), 463-488.
Milich, R. (1994). The response of children with ADHD to failure: If at first you don’t
succeed, do you try, try again? School Psychology Review, 23(1), 11-28.
Milich, R., & Okazaki, M. (1991). An examination of learned helplessness among
attention-deficit hyperactivity disordered boys. Journal of Abnormal Child
Psychology, 19(5), 607-623.
Mitsis, E. M., McKay, K. E., Schulz, K. P., Newcorn, J. H., & Halperin, J. M. (2000).
Parent teacher concordance for DSM-IV attention-deficit/hyperactivity disorder in a
clinic-referred sample. Journal of the American Academy of Child & Adolescent
Psychiatry, 39, 308-313.
Ogg, J. A., & Harbor, R. (2009). The experiences of and perceptions toward adolescents
exhibiting inattention, hyperactivity, and impulsivity. Application for Initial Review:
University of South Florida Social and Behavioral Institutional Review Board.

145
O’Neill, M. E., & Douglas, V. I. (1991). Study strategies and story recall in attention-
deficit disorder and reading disability. Journal of Abnormal Child Psychology,
19(6), 671-692.
Ohan, J. L., & Johnston, C. (2002). Are the performance overestimates given by boys
with ADHD self-protective? Journal of Clinical Child and Adolescent Psychology,
31(2), 230-241.
Owens, J. S., Goldfine, M. E., Evangelista, N. M., Hoza, B., & Kaiser, N. M. (2007). A
critical review of self-perceptions and the positive illusory bias in children with
ADHD. Clinical Child and Family Psychology Review, 10(4), 335-351.
Owens, J. S., & Hoza, B. (2003). The role of inattention and hyperactivity/impulsivity in
the positive illusory bias. Journal of Consulting and Clinical Psychology, 71(4),
680-691.
Ownsworth, T. L., McFarland, K. M., & Young, R. (2002). The investigation of factors
underlying deficits in self-awareness and self-regulation. Brain Injury, 16, 291-309.
Piers, E. V., & Harris, D. B. (1964). Age and other correlates of self-concept in children.
Journal of Educational Psychology, 55, 91-95.
Radloff, L. S. (1977). The CES-D scale: a self-report depression scale for research in the
general population. Applied Psychological Measurement, 1, 385-401.
Resnick, R. J. (2005). Attention deficit hyperactivity disorder in adults: They don’t all
outgrow it. Journal of Clinical Psychology, 61(5), 529-533.
Roberts, R. E., Lewisohn, P. M., & Seeley, J. R. (1991). Screening for adolescent
depression, a comparison of depression scales. Journal of the American Academy
of Child and Adolescent Psychiatry, 30, 58-66.
146
Rosenberg, M. (1979). Conceiving the self. Malabar, FL: Robert E. Krieger.
Rosenberg, M. (1986). Self-concept from middle childhood through adolescence. In J.
Suls & A. Greenwald (Eds.), Psychological perspectives on the self. (pp. 107-136).
Hillsdale, NJ: Erlbaum.
Ruble, D. N., & Dweck, C. S. (1995). Self-perceptions, person conceptions, and their
development. In N. Eisenberg, & N. Eisenberg (Eds.), Social development. (pp. 109-
139). Thousand Oaks, CA: Sage Publications, Inc.
Rushton, J. L., Forcier, M., & Schectman, R. M. (2002). Epidemiology of Depressive
Symptoms in the National Longitudinal Study of Adolescent Health. Journal of
the American Academy of Child and Adolescent Psychiatry, 41,199-205.
Scahill, L. & Schwab-Stone, M. (2000). Epidemiology of ADHD in school-age children.
Child and Adolescent Psychiatric Clinics of North America, 9(3), 541-555.
Schultz, B. K., Evans, S. W., & Serpell, Z. N. (2009). Preventing failure among middle
school students with attention deficit hyperactivity disorder: A survival analysis.
School Psychology Review, 38(1), 14-27.
Schnoes, C., Reid, R., Wagner, M., Marder, C. (2006). ADHD among students receiving
special education services: A national survey. Exceptional Children, 72(4), 483-496.
Seroczynski, A. D., Cole, D. A., & Maxwell, S. E. (1997). Cumulative and compensatory
effects of competence and incompetence on depressive symptoms in children.
Journal of Abnormal Psychology, 106, 586-597.
Shapka, J. D., & Keating, D. P. (2005). Structure and change in self-concept during
adolescence. Canadian Journal of Behavioural Science, 37(2), 83-96.

147
Shavelson, R. J., Hubner, J. J., & Stanton, G. C. (1976). Self-concept: Validation of
construct interpretations. Review of Educational Research, 46(3), 407-441.
Slomkowski, C., Klein, R. G., & Mannuzza, S. (1995). Is self-esteem an important
outcome in hyperactive children? Journal of Abnormal Child Psychology, 23(3),
303-315.
Smith, B. H., Barkley, R. A., & Shapiro, C. J. (2007). Attention Deficit (Hyperactivity)
Disorder. In E. Mash & R. Barkley (Eds.), Assessment of Childhood Disorders (pp.
53-131). New York, NY: Guilford Press.
Snodgrass, H. (2009). Adolescent Response to Peer Substance Use. (Unpublished
master’s thesis). University of South Florida, Tampa, FL.
Starkstein, S. E., Jorge, R., Mizrahi, R., & Robinson, R. G. (2006). A diagnostic
formulation for anosognosia in Alzheimer’s disease. Journal of Nuerology,
Nuerosurgery, & Psychiatry, 77, 719-725.
Stuss, D. T., & Benson, D. F. (1987). The frontal lobes and control of cognition and
memory. In E. Pereceman (Ed.), The frontal lobes revisited. Hillsdale, NJ: Lawrence
Erlbaum Associates.
Szatmari, P., Boyle, M. H., & Offord, D. R. (1989). ADHD and conduct disorder: Degree
of diagnostic overlap and differences among correlates. Journal of the American
Academy of Child & Adolescent Psychiatry, 28(6), 865-872.
Tabachnick, B. G. & Fidell, L.S. (2007). Using multivariate statistics (5th ed). Boston:
Pearson Education.
Taylor, S. E., & Brown, J. D. (1988). Illusion and well-being: A social psychological
perspective on mental health. Psychological Bulletin, 103(2), 193-210.
148
Trautwein, U., Lüdtke, O., Köller, O., & Baumert, J. (2006). Self-esteem, academic self-
concept, and achievement: How the learning environment moderates the dynamics
of self-concept. Journal of Personality and Social Psychology, 90(2), 334-349.
Treuting, J. J., & Hinshaw, S. P. (2001). Depression and self-esteem in boys with
attention-deficit/hyperactivity disorder: Associations with comorbid aggression and
explanatory attributional mechanisms. Journal of Abnormal Child Psychology,
29(1), 23-39.
Unnever, J. D., & Cornell, D. G. (2003). Bullying, self-control, & ADHD. Journal of
Interpersonal Violence, 18(2), 129-147.
U.S. Department of Education, National Center for Education Statistics, Common Core
of Data. (2008). State Nonfiscal Survey of Public Elementary/Secondary
Education: Florida State Education Data Profile (2007-2008). Retrieved from
http://nces.ed.gov/programs/stateprofiles/sresultasp?mode=full&displaycat=1&s1
=12
Valentine, J. C., DuBois, D. L., & Cooper, H. (2004). The relation between self-beliefs
and academic achievement: A meta-analytic review. Educational Psychologist,
39(2), 111-133.
Volpe, R. J., DuPaul, G. J., DiPerna J. C., Jitendra A. K., Lutz, J. G., & Junod R. V.
(2006). Attention deficit hyperactivity disorder and scholastic achievement: A model
of mediation via academic enablers. School Psychology Review, 35(1), 47-61.
Whalen, C. K., Henker, B., Hinshaw, S. P., Heller, T., & Huber-Dressler, A. (1991).
Messages of medication: Effects of actual versus informed medication status on

149
hyperactive boys’ expectancies and self-evaluations. Journal of Consulting &
Clinical Psychology, 59(4), 602-606.
Whitley, J. L, Heath, N. L., & Finn, C. A. (2008). The role of attention-deficit
hyperactivity disorder in the self-perceptions of children with emotional and
behavioural difficulties. McGill Journal of Education, 43(1), 65-80.
Wigfield, A., Eccles, J. S., Mac Iver, D., Reuman, D. A., & Midgley, C. (1991).
Transitions during early adolescence: Changes in children's domain-specific self-
perceptions and general self-esteem across the transition to junior high school.
Developmental Psychology, 27(4), 552-565.
Wolraich, M. L., Feurer, I. D., Hannah, J. H., Baumgaertel, A., & Pinnock, T. Y. (1998).
Obtaining systematic teacher reports of disruptive behavior disorders utilizing
DSM-IV. Journal of Abnormal Child Psychology, 26, 141-152.
Wolraich, M. L., Hannah, J. N., Pinnock, T. Y., & Baumgaertel, A. (1996). Comparison
of diagnostic criteria for attention-deficit hyperactivity disorder in a county-wide
sample. Journal of the American Academy of Child & Adolescent Psychiatry, 35(3),
319-324.
Wolraich, M. L., Lambert, W., Doffing, M.A., Bickman, L., Simmons, T. & Worley, K.
(2003a). Psychometric properties of the Vanderbilt ADHD Diagnostic Parent
Rating Scale in a referred population. Journal of Pediatric Psychology, 28, 559-
568.
Wolraich, M. L., Lambert, E. W., Baumgaertel, A. , Garcia-Tornel, S., Feurer, I. D.,
Bickman, L. et al. (2003b). Teachers’ screening for attention deficit/hyperactivity

150
disorder: comparing multinational samples on teacher ratings of ADHD. Journal
of Abnormal Child Psychology, 31, 445-455.
Wolraich, M. L., Wibbelsman, C. J., Brown, T. E., Evans, S. W., Gotlieb, E. M., Knight,
J. R., et al. (2005). Attention-deficit/hyperactivity disorder among adolescents: A
review of the diagnosis, treatment, and clinical implications. Pediatrics, 115(6),
1734-1746.

151
Appendices

152
Appendix A: Parent Consent Letter (Modified to fit in current document)
Dear Parent or Caregiver: This letter provides information about a research study that will be conducted at __________ Middle School by Dr. Julia Ogg and Dr. Rance Harbor. Dr. Ogg is a professor from the University of South Florida and Dr. Harbor is a school psychologist in __________County, as well as a visiting professor at the University of South Florida. Our goal in conducting the study is to investigate the experiences of adolescents exhibiting symptoms of inattention, hyperactivity, and impulsivity and to better understand the perceptions of adolescents toward those exhibiting these behaviors.
� Who We Are: Julia Ogg, Ph.D. is a professor in the College of Education at the University of South Florida (USF). Rance Harbor, Ph.D. is a school psychologist in __________County and a visiting professor at USF. We are planning the study in cooperation with the principal and administrators of __________ Middle School to ensure the study provides information that will be helpful to the schools.
� Why We Are Requesting Your Participation and Your Child’s Participation: This study is being conducted as part of a project entitled, “The Experiences of and Perceptions toward Adolescents Exhibiting Inattention, Hyperactivity, and Impulsivity.” You and your child are being asked to participate because your child is a student at __________ Middle School. All students at __________ Middle School are being asked to participate.
� Why You and Your Child Should Participate: We need to learn more about how to help students be successful during the pre-teen and teenage years. The information that we collect from students and parents may help increase our overall knowledge of difficulties frequently encountered in school and help support students’ success. Please note neither you nor your child will be paid for your participation in the study. However, all students who return parental consent forms will be entered into a drawing for a gift certificate, regardless of if you allow your child to participate or not.
� What Participation Requires: If you give permission for your child to participate in the study, he or she will be asked to complete paper-and-pencil questionnaires. The surveys will ask about your child’s behaviors, feelings about themselves, medication use, substance use, life events, and about how family members get along. They will also be asked to report their gender, ethnicity, experiences getting in trouble, diagnoses, and the marital status of their parents. Completion is expected to take your child about 40 minutes. We will personally administer the questionnaires at __________ Middle School along with a trained team of researchers from USF during regular school hours. Questionnaires will be administered to students who have parent permission to participate. Participation will occur during one class period this Spring semester. In addition, students’ school records will be reviewed for academic achievement (e.g., grades, FCAT scores) and reduced lunch status. If you choose to participate, you will be asked to complete a questionnaire about your child’s behavior. Completion of the questionnaire is expected to take about 5 minutes.
� Please Note: Your decision to participate and to allow your child to participate in this research study is completely voluntary. You are free to allow your child to participate in this research study or to withdraw him or her at any time. You are also free to decide if you would like to participate in this study or to withdraw at any time. If you choose not to participate or not to allow your child to participate, or if you withdraw your child at any point during the study, this will in no way affect your relationship with __________ Middle School, USF, or any other party.
� Confidentiality of Your Responses and Your Child’s Responses: There is minimal risk to you and your child for participating in this research. We will be present during administration of the questionnaires, along with a team of trained researchers, in order to provide assistance to your child if he or she has any questions or concerns. Your child’s privacy and research records will be kept confidential to the extent of the law. Authorized research personnel, employees of the Department of Health and Human Services, and the USF Institutional Review Board may inspect the records from this research project, but you and your child’s individual responses will not be shared with school system personnel or anyone other than us and our research assistants. Your questionnaire and your child’s completed questionnaire will be assigned a code number to protect the confidentiality of his or her responses. Only we will have access to the locked file cabinet stored at USF that will contain: 1) all records linking code numbers to participants’ names, and 2) all information gathered from school records. The questionnaires will be kept for 5 years and then will be destroyed. Please note that although your child’s specific responses on the questionnaires will not be shared with school staff, if your child indicates that he or she intends to

153
Appendix A: Continued
harm him or herself, we will provide your child’s name to the mental health counselors at __________ Middle School and ask that they follow up with your child to ensure your child’s safety. We will also let school mental health counselors know if your child scores high on a measure of depression. The mental health counselors will determine if additional follow-up is needed.
� What We’ll Do With Your Responses and Your Child’s Responses: We plan to use the information from this study to inform educators and psychologists about helping all students be successful in school. The results of this study may be published. However, the data obtained from you and your child will be combined with data from other people in the publication. The published results will not include your name or your child’s name or any other information that would in any way personally identify you or your child.
� Questions? If you have any questions about this research study, please contact Dr. Julia Ogg at (813) 974-9698. If you have questions about you or your child’s rights as a person who is taking part in a research study, you may contact a member of the Division of Research Compliance of the University of South Florida at (813) 974-9343.
� Do You Want to Participate or Have Your Child Participate? To permit your child to participate in this study, complete the attached child consent form (top portion below) and have your child turn it in to his or her 1st period teacher. If you would like to participate in this study, please complete the parent consent form (2nd portion of form below). If you choose to participate, your child will also bring the questionnaire home for you to fill out.
Sincerely,
Julia A. Ogg, Ph.D. Rance Harbor, Ph.D. Assistant Professor of Educational Psychology School Psychologist & Visiting Professor USF College of Education __________County & USF College of Education -----------------------------------------------------------------------------------------------------------------------------------------------
Consent for Child to Take Part in this Research Study
I do not give permission to let my child take part in this study.
I freely give my permission to let my child take part in this study. I understand that this is research. I have received a copy of this letter and consent form for my records.
________________________________ ________________________________ Printed name of child Child’s Homeroom Teacher Date ________________________________ ________________________________ Signature of parent of child taking part in the study Printed name of parent
Consent For You To Take Part in this Research Study I do not give permission to participate in this study.
I freely give my permission to take part in this study. I understand that this is research. I have received a copy of this letter and consent form for my records.
________________________________ ________________________________ _____________ Signature of parent taking part in study Printed name of parent Date
_____________________________________________________________________________________________________ Statement of Person Obtaining Informed Consent
I certify that participants have been provided with an informed consent form that has been approved by the University of South Florida’s Institutional Review Board and that explains the nature, demands, risks, and benefits involved in participating in this study. I further certify that a phone number has been provided in the event of additional questions. ________________________________ ________________________________ _____________ Signature of person obtaining consent Printed name of person obtaining consent Date

154
Appendix B: Student Assent Letter (Modified to fit in current document)
Hello! This letter explains a research study that we would like you to take part in. Our goal in conducting the study is to learn more about your thoughts, feelings, and attitudes related to school, family, friends, and life in general. � Who We Are: Julia Ogg, Ph.D. is a professor in the College of Education at the University
of South Florida (USF). Rance Harbor, Ph.D. is a school psychologist in __________ County and a visiting professor at USF. Several doctoral students in the College of Education at USF are also part of the team. We are working with your principal and administrators to make sure this study will be helpful to your school.
�� WWhhyy WWee aarree AAsskkiinngg YYoouu ttoo TTaakkee PPaarrtt iinn tthhee SSttuuddyy:: TThhiiss ssttuuddyy iiss bbeeiinngg ccoonndduucctteedd aass ppaarrtt ooff aa pprroojjeecctt eennttii ttlleedd,, ““TThhee EExxppeerriieenncceess ooff aanndd PPeerrcceeppttiioonnss ttoowwaarrdd AAddoolleesscceennttss EExxhhiibbii ttiinngg IInnaatttteennttiioonn,, HHyyppeerraaccttiivvii ttyy,, aanndd IImmppuullssiivvii ttyy..”” YYoouu aarree bbeeiinngg aasskkeedd ttoo ppaarrttiicciippaattee bbeeccaauussee yyoouu aarree aa ssttuuddeenntt aatt ____________________ MMiiddddllee SScchhooooll ..
� Why You Should Take Part in the Study: We need to learn more about how to help students
be successful during the pre-teen and teenage years! The information that we collect from you may help increase our overall knowledge of difficulties frequently encountered in school and help support your success. Please note you will not be paid for your participation in the study. However, all students who complete and return parental consent forms will be entered into a drawing for a gift certificate.
�� WWhhaatt WWii ll ll HHaappppeenn ii ff YYoouu’’ rree iinn tthhee SSttuuddyy:: IIff yyoouu cchhoooossee ttoo ttaakkee ppaarrtt iinn tthhee ssttuuddyy yyoouu wwii ll ll bbee
aasskkeedd ttoo ccoommpplleettee aa ppaappeerr--aanndd--ppeennccii ll qquueessttiioonnnnaaiirree.. TThhee ssuurrvveeyy wwii ll ll aasskk yyoouu aabboouutt yyoouurr tthhoouugghhttss aanndd bbeehhaavviioorrss.. IItt wwii ll ll ttaakkee yyoouu aabboouutt 4400 mmiinnuutteess ttoo ccoommpplleettee tthhee qquueessttiioonnnnaaiirree.. IIff yyoouu cchhoooossee ttoo ttaakkee ppaarrtt iinn tthhee ssttuuddyy,, wwee wwii ll ll aallssoo llooookk aatt ssoommee ooff yyoouurr sscchhooooll rreeccoorrddss iinncclluuddiinngg yyoouurr ggrraaddeess,, aanndd rreedduucceedd lluunncchh ssttaattuuss..
� Please Note: Your involvement in this study is voluntary (it’s your choice). By signing this
form, you are agreeing to take part in this study. Your decision to take part, not to take part, or to stop taking part in the study at any time will not affect your student status or your grades; you will not be punished in any way. If you choose not to take part, it will not affect your relationship with __________ Middle School, USF, or anyone else.
� Privacy of your Involvement: Your privacy and research records will be kept confidential
(private, secret) to the extent of the law. People approved to do research at USF, people who work with the Department of Health and Human Services, the USF Institutional Review Board, and its staff, and other individuals acting on behalf of USF may look at the records from this research project. However, your responses to the surveys will not be shared with people in the school system or anyone other than us and our research assistants. Your surveys will be given a code number to protect the confidentiality of your responses. Only we will have the ability to open the locked file cabinet stored at USF that will contain: 1) all records linking code numbers to names, and 2) all information gathered from school records. All records from the study (completed surveys, information from school records) will be destroyed in four years. Please note that although your specific responses and comments will not be shared with school staff, if you say or write that you may harm yourself or

155
Appendix B: Continued
someone else, or if your responses on specific surveys indicate extreme emotional distress, we will contact district mental health counselors to make sure everyone is safe. The district mental health counselor may meet with you to make sure you are safe.
� What We’ll Do With Your Responses: We plan to use the information from this study to
learn more about how to help students be successful during the pre-teen and teenage years! The information that we collect from you may help increase our overall knowledge of difficulties frequently encountered in school and help support your success. The results of this study may be published. However, your responses will be combined with other students’ responses in the publication. The published results will not include your name or any other information that would identify you.
� Questions? If you have any questions about this research study, please contact Dr. Julia Ogg
at (813) 974-9698. If you have questions about your rights as a person who is taking part in a research study, you may contact a member of the Division of Research Compliance of the University of South Florida at (813) 974-9343.
Thank you for taking the time to take part in this study. Sincerely, Julia A. Ogg, Ph.D. Rance Harbor, Ph.D. Assistant Professor of School Psychology School Psychologist & Visiting Professor USF College of Education County & USF College of Education --------------------------------------------------------------------------------------------------------------------
Assent to Take Part in this Research Study I give my permission to take part in this study. I understand that this is research. I have received a copy of this letter and assent form. ________________________________ ________________________________ _ Signature of student taking part in the study Printed name of student Date _______________________________ Your Homeroom Teacher
Statement of Person Obtaining Assent I certify that participants have been provided with an assent form that has been approved by the University of South Florida’s Institutional Review Board and that explains the nature, demands, risks, and benefits involved in participating in this study. I further certify that a phone number has been provided in the event of additional questions. _______________________________ ________________________________ Signature of person obtaining assent Printed name of person obtaining assent Date

156
Appendix C: Vanderbilt ADHD Diagnostic Teacher Rating Scale (VADTRS)

157
Appendix C: Continued
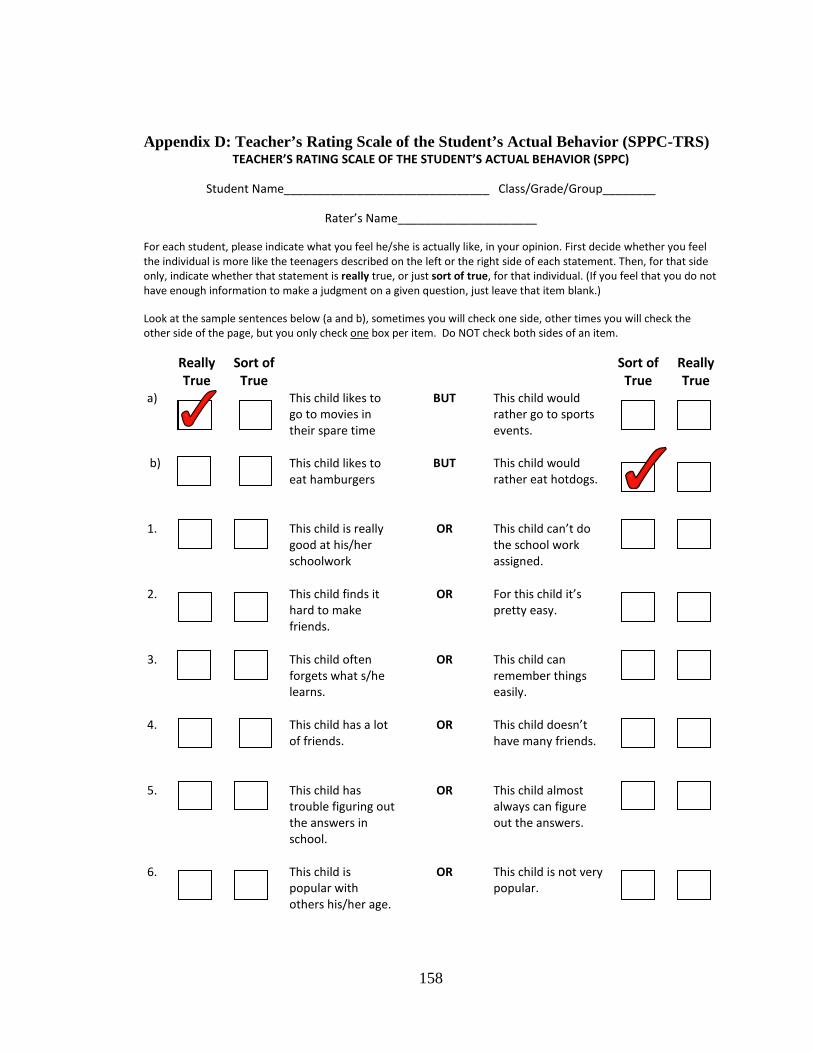
158
Appendix D: Teacher’s Rating Scale of the Student’s Actual Behavior (SPPC-TRS) TEACHER’S RATING SCALE OF THE STUDENT’S ACTUAL BEHAVIOR (SPPC)
Student Name_______________________________ Class/Grade/Group________
Rater’s Name_____________________
For each student, please indicate what you feel he/she is actually like, in your opinion. First decide whether you feel
the individual is more like the teenagers described on the left or the right side of each statement. Then, for that side
only, indicate whether that statement is really true, or just sort of true, for that individual. (If you feel that you do not
have enough information to make a judgment on a given question, just leave that item blank.)
Look at the sample sentences below (a and b), sometimes you will check one side, other times you will check the
other side of the page, but you only check one box per item. Do NOT check both sides of an item.
Really
True
Sort of
True
Sort of
True
Really
True
a)
b)
This child likes to
go to movies in
their spare time
This child likes to
eat hamburgers
BUT
BUT
This child would
rather go to sports
events.
This child would
rather eat hotdogs.
1.
This child is really
good at his/her
schoolwork
OR
This child can’t do
the school work
assigned.
2.
This child finds it
hard to make
friends.
OR
For this child it’s
pretty easy.
3.
This child often
forgets what s/he
learns.
OR
This child can
remember things
easily.
4.
This child has a lot
of friends.
OR
This child doesn’t
have many friends.
5.
This child has
trouble figuring out
the answers in
school.
OR
This child almost
always can figure
out the answers.
6.
This child is
popular with
others his/her age.
OR
This child is not very
popular.
159
Appendix E: Teacher Consent Letter (Modified to fit in Current Document)
DDeeaarr TTeeaacchheerr::
TThhiiss lleetttteerr pprroovviiddeess iinnffoorrmmaattiioonn aabboouutt aa rreesseeaarrcchh ssttuuddyy tthhaatt wwii ll ll bbee ccoonndduucctteedd aatt ________________ MMiiddddllee SScchhooooll bbyy DDrr.. JJuull iiaa OOgggg aanndd DDrr.. RRaannccee HHaarrbboorr.. DDrr.. OOgggg iiss aa pprrooffeessssoorr ffrroomm tthhee UUnniivveerrssii ttyy ooff SSoouutthh FFlloorriiddaa aanndd DDrr.. HHaarrbboorr iiss aa sscchhooooll ppssyycchhoollooggiisstt iinn __________________ CCoouunnttyy,, aass wweell ll aass aa vviissii ttiinngg pprrooffeessssoorr aatt tthhee UUnniivveerrssii ttyy ooff SSoouutthh FFlloorriiddaa.. OOuurr ggooaall iinn ccoonndduuccttiinngg tthhee ssttuuddyy iiss ttoo iinnvveessttiiggaattee tthhee eexxppeerriieenncceess ooff aaddoolleesscceennttss eexxhhiibbii ttiinngg ssyymmppttoommss ooff iinnaatttteennttiioonn,, hhyyppeerraaccttiivvii ttyy,, aanndd iimmppuullssiivvii ttyy aanndd ttoo bbeetttteerr uunnddeerrssttaanndd tthhee ppeerrcceeppttiioonnss ooff aaddoolleesscceennttss ttoowwaarrdd tthhoossee eexxhhiibbii ttiinngg tthheessee bbeehhaavviioorrss.. �� Who We Are: JJuull iiaa OOgggg,, PPhh..DD.. iiss aa pprrooffeessssoorr iinn tthhee CCooll lleeggee ooff EEdduuccaattiioonn aatt tthhee UUnniivveerrssii ttyy ooff
SSoouutthh FFlloorriiddaa ((UUSSFF)).. RRaannccee HHaarrbboorr,, PPhh..DD.. iiss aa sscchhooooll ppssyycchhoollooggiisstt iinn __________________ CCoouunnttyy aanndd aa vviissii ttiinngg pprrooffeessssoorr aatt UUSSFF.. WWee aarree ppllaannnniinngg oouurr ssttuuddyy iinn ccooooppeerraattiioonn wwii tthh tthhee pprriinncciippaall aanndd aaddmmiinniissttrraattoorrss ooff __________________MMiiddddllee SScchhooooll ttoo eennssuurree tthhee ssttuuddyy pprroovviiddeess iinnffoorrmmaattiioonn tthhaatt wwii ll ll bbee hheellppffuull ttoo tthhee sscchhoooollss..
�� WWhhyy WWee aarree RReeqquueessttiinngg YYoouurr PPaarrttiicciippaattiioonn:: This study is being conducted as part of a project entitled, “The Experiences of and Perceptions toward Adolescents Exhibiting Inattention, Hyperactivity, and Impulsivity.” YYoouu aarree bbeeiinngg aasskkeedd ttoo ppaarrttiicciippaattee bbeeccaauussee yyoouu aarree aa tteeaacchheerr ooff aatt lleeaasstt oonnee ssttuuddeenntt wwhhoo iiss aa ppaarrttiicciippaanntt iinn tthhee ssttuuddyy..
� Why You Should Participate: We need to learn more about how to help students be successful during the pre-teen and teenage years! The information that we collect from teachers may help increase our overall knowledge of difficulties frequently encountered in school and help support students’ success. Please note that you will receive a gift card for participating in the study.
�� WWhhaatt PPaarrttiicciippaattiioonn RReeqquuiirreess:: YYoouu wwii ll ll bbee aasskkeedd ttoo ccoommpplleettee aa qquueessttiioonnnnaaiirree((ss)) aabboouutt tthhee bbeehhaavviioorr ooff eeaacchh ooff yyoouurr ssttuuddeennttss wwhhoo iiss aa ppaarrttiicciippaanntt iinn tthhee ssttuuddyy.. CCoommpplleettiioonn ooff tthhee qquueessttiioonnnnaaiirree((ss)) iiss eexxppeecctteedd ttoo ttaakkee bbeettwweeeenn 55 aanndd 1100 mmiinnuutteess..
� Please Note: Your decision to participate in this research study must be completely voluntary. You are free to participate in this research study or to withdraw from participation at any time. If you choose not to participate, or if you withdraw at any point during the study, this will in no way affect your relationship with ________ Middle School, USF, or any other party.
� Confidentiality of Your Responses: There is minimal risk for participating in this research. Your privacy and research records will be kept confidential to the extent of the law. Authorized research personnel, employees of the Department of Health and Human Services, the USF Institutional Review Board and its staff, and other individuals acting on behalf of USF may inspect the records from this research project, but your individual responses will not be shared with school system personnel or anyone other than the USF research team. Your completed questionnaire(s) will be assigned a code number to protect the confidentiality of your responses. Only the USF research team will have access to the locked file cabinet stored at USF that will contain all records linking code numbers to participants’ names.

160
Appendix E: Continued
� What We’ll Do With Your Responses: We plan to use the information from this study to inform educators and psychologists about helping all students be successful in school. The results of this study may be published. However, the data obtained from you will be combined with data from other people in the publication. The published results will not include your name or any other information that would in any way personally identify you.
� Questions? If you have any questions about this research study, please contact Dr. Julia Ogg
at (813) 974-9698. If you have questions about your rights as a person taking part in a research study, you may contact a member of the Division of Research Compliance of the University of South Florida at (813) 974-9343.
� Want to Participate? To participate in this study, please sign the attached consent form. Sincerely, Julia A. Ogg, Ph.D. Rance Harbor, Ph.D. Assistant Professor of Educational Psychology School Psychologist & Visiting Professor USF College of Education __________ County & USF College of Education -------------------------------------------------------------------------------------------------------------------------------
Consent to Take Part in this Research Study I freely give my permission to take part in this study. I understand that this is research. I have received a copy of this letter and consent form for my records. ________________________ ________________________ ___________ Signature of teacher Printed name of teacher Date
Statement of Person Obtaining Informed Consent
I certify that participants have been provided with an informed consent form that has been approved by the University of South Florida’s Institutional Review Board and that explains the nature, demands, risks, and benefits involved in participating in this study. I further certify that a phone number has been provided in the event of additional questions. ________________________ ________________________ ___________ Signature of person Printed name of person Date obtaining consent obtaining consent

161
Appendix F: Demographic Form
1. Gender � 1) Female � 2) Male
2. Ethnicity
� 1. African American/Black � 2. Asian/ Pacific Islander � 3. White � 4. Hispanic � 5. Native American/ Alaska Native � 6. Other (Specify ______________)
3. Age
� 10 � 14 � 18 � 11 � 15 � 19
� 12 � 16 � 20 � 13 � 17 � 21 4. Grade � 6 � 9 � 11
� 7 � 10 � 12 � 8
5. Estimated GPA � 4.0 or higher (A) � 3.0-3.9 (B)
� 2.0-2.9 (C) � 1.0-1.9 (D) � Less than 1.0 (F)
6. Are you on Free or Reduced Lunch (e.g. do
you pay for your lunch in the cafeteria)? � 1. Yes � 2. No
7. Do you attend school regularly? � 1. No � 2. Sometimes
� 3. Yes
8. Including last year, and this year, have you received any discipline referrals for behaviors other than being tardy?
� 1. Often (More than 5) � 2. Some (1-5) � 3. Never
9. Including last year, and this year,
have you been suspended out of school (including ATOSS)?
� 1. Often (More than 5 days) � 2. Some (1-5 days total) � 3. Never 10. Including last year, and this year,
have you been arrested? � 1. Often (More than 2 times) � 2. Some (1-2 times) � 3. Never
11. Have you ever been diagnosed with ADHD?
� 1. Yes � 2. No 12. Have you ever been diagnosed with
Anxiety, Depression, or other mental health problems?
� 1. Yes � 2. No 13. Have you ever been prescribed
medication for ADHD? � 1. Yes, and I still take the
medication. � 2. Yes, but I no longer take
medication. � 3. No 14. Have you ever been prescribed
medication for Anxiety, Depression, or other mental health problems?
� 1. Yes, and I still take the medication.
� 2. Yes, but I no longer take medication.
� 3. No 15. My biological parents are: � 1. Married � 2. Divorced � 3. Separated � 4. Never married � 5. Never married but living together � 6. Widowed
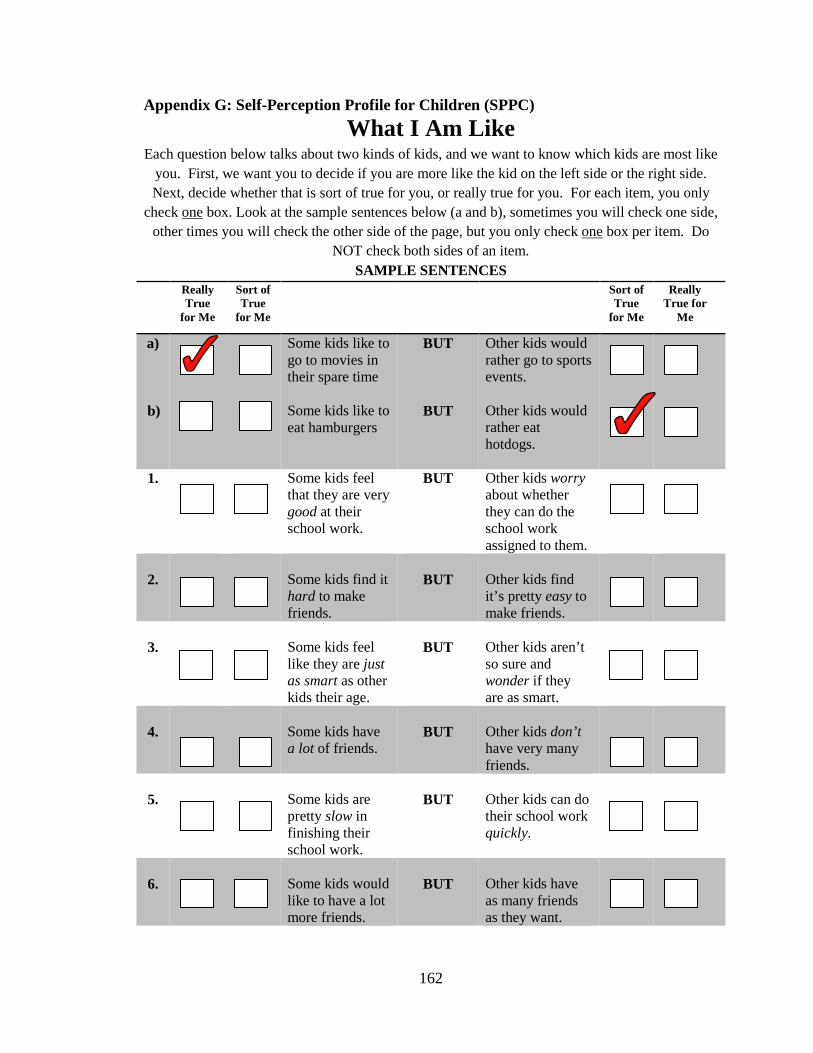
162
Appendix G: Self-Perception Profile for Children (SPPC)
What I Am Like Each question below talks about two kinds of kids, and we want to know which kids are most like
you. First, we want you to decide if you are more like the kid on the left side or the right side. Next, decide whether that is sort of true for you, or really true for you. For each item, you only
check one box. Look at the sample sentences below (a and b), sometimes you will check one side, other times you will check the other side of the page, but you only check one box per item. Do
NOT check both sides of an item. SAMPLE SENTENCES
Really True
for Me
Sort of True
for Me
Sort of True
for Me
Really True for
Me
a) b)
Some kids like to go to movies in their spare time Some kids like to eat hamburgers
BUT
BUT
Other kids would rather go to sports events. Other kids would rather eat hotdogs.
1. Some kids feel that they are very good at their school work.
BUT Other kids worry about whether they can do the school work assigned to them.
2.
Some kids find it hard to make friends.
BUT
Other kids find it’s pretty easy to make friends.
3.
Some kids feel like they are just as smart as other kids their age.
BUT
Other kids aren’t so sure and wonder if they are as smart.
4.
Some kids have a lot of friends.
BUT
Other kids don’t have very many friends.
5.
Some kids are pretty slow in finishing their school work.
BUT
Other kids can do their school work quickly.
6.
Some kids would like to have a lot more friends.
BUT
Other kids have as many friends as they want.

163
Appendix G: Continued
7.
Some kids often forget what they learn.
BUT
Other kids can remember things easily.
8.
Some kids are always doing things with a lot of kids.
BUT
Other kids usually do things by themselves.
9.
Some kids do very well at their class work.
BUT
Other kids don’t do very well at their class work.
10.
Some kids wish more people their age liked them.
BUT
Other kids feel that most people their age do like them.
11.
Some kids have trouble figuring out the answers in school.
BUT
Other kids almost always can figure out the answers.
12.
Some kids are popular with others their age.
BUT
Other kids are not very popular.
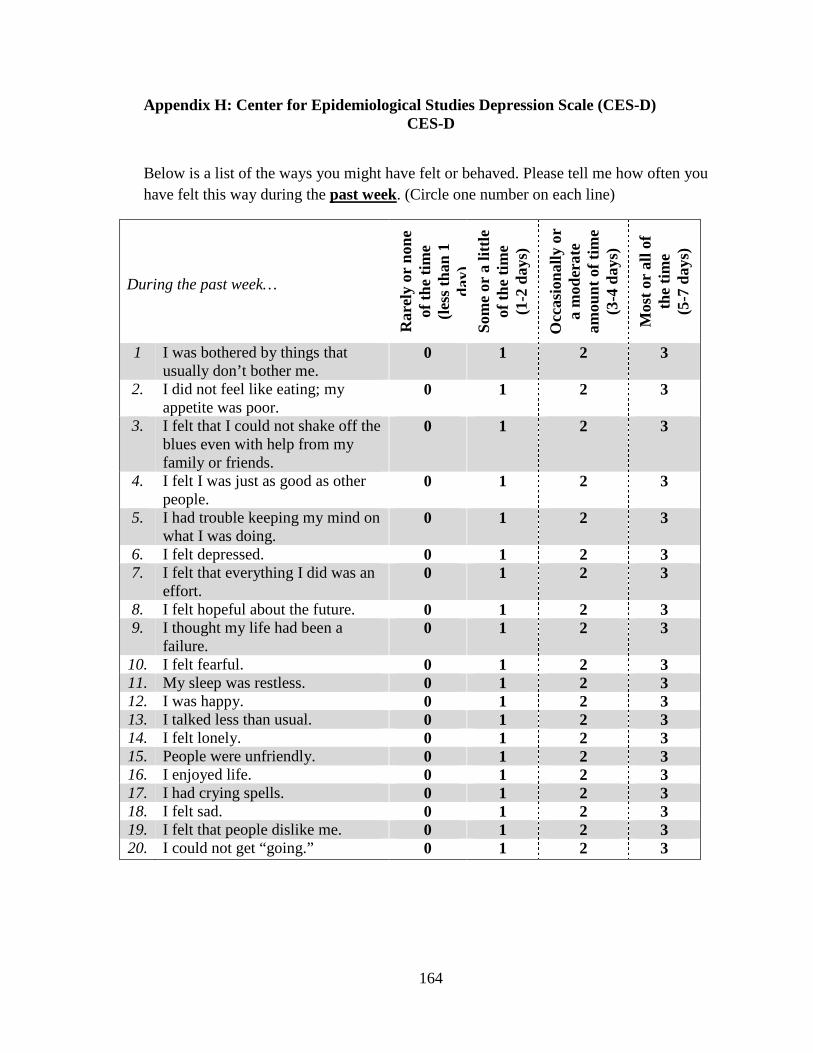
164
Appendix H: Center for Epidemiological Studies Depression Scale (CES-D) CES-D
Below is a list of the ways you might have felt or behaved. Please tell me how often you have felt this way during the past week. (Circle one number on each line)
During the past week…
Rar
ely
or n
one
of th
e tim
e
(le
ss th
an 1
da
y)
Som
e or
a li
ttle
of th
e tim
e (1
-2 d
ays)
Occ
asio
nally
or
a m
oder
ate
amou
nt o
f tim
e (3
-4 d
ays)
Mos
t or
all o
f th
e tim
e
(5-7
day
s)
1 I was bothered by things that usually don’t bother me.
0 1 2 3
2. I did not feel like eating; my appetite was poor.
0 1 2 3
3. I felt that I could not shake off the blues even with help from my family or friends.
0 1 2 3
4. I felt I was just as good as other people.
0 1 2 3
5. I had trouble keeping my mind on what I was doing.
0 1 2 3
6. I felt depressed. 0 1 2 3 7. I felt that everything I did was an
effort. 0 1 2 3
8. I felt hopeful about the future. 0 1 2 3 9. I thought my life had been a
failure. 0 1 2 3
10. I felt fearful. 0 1 2 3 11. My sleep was restless. 0 1 2 3 12. I was happy. 0 1 2 3 13. I talked less than usual. 0 1 2 3 14. I felt lonely. 0 1 2 3 15. People were unfriendly. 0 1 2 3 16. I enjoyed life. 0 1 2 3 17. I had crying spells. 0 1 2 3 18. I felt sad. 0 1 2 3 19. I felt that people dislike me. 0 1 2 3 20. I could not get “going.” 0 1 2 3

165
Appendix I: Comparison of Raw Accuracy Scores Across Groups
Raw Academic Discrepancy Scores with Teacher Ratings as
the Indicator of Competence
Accuracy Group Minimum Maximum M (SD)
Positive (PIB) .17 2.33 .89 (.54)
Accurate -.50 .33 -.17 (.27)
Negative -2.17 -.50 -.99 (.40)
Note. M= Mean; SD = Standard Deviation
Raw Social Discrepancy Scores with Teacher Ratings as the
Indicator of Competence
Accuracy Group Minimum Maximum M (SD)
Positive (PIB) .17 2.5 .82 (.53)
Accurate -.67 .33 -.18 (.26)
Negative -1.83 -.33 -.98 (.34)
Note. M= Mean; SD = Standard Deviation