Embed Size (px)
Citation preview

Southern Illinois University CarbondaleOpenSIUCThe Simon Review (Occasional Papers of the PaulSimon Public Policy Institute) Paul Simon Public Policy Institute
7-2018
The Politics of Public Budgeting in IllinoisJohn JacksonSouthern Illinois University Carbondale, [email protected]
John FosterSouthern Illinois University Carbondale, [email protected]
Follow this and additional works at: https://opensiuc.lib.siu.edu/ppi_papersThis is Paper #53 in The Simon Review series.
This Article is brought to you for free and open access by the Paul Simon Public Policy Institute at OpenSIUC. It has been accepted for inclusion in TheSimon Review (Occasional Papers of the Paul Simon Public Policy Institute) by an authorized administrator of OpenSIUC. For more information,please contact [email protected].
Recommended CitationJackson, John and Foster, John. "The Politics of Public Budgeting in Illinois." ( Jul 2018).

The Simon Review
The Politics of Public Budgeting in Illinois
By John L. Foster and John S. Jackson
Paper #53 - July 2018
A Publication of the Paul Simon Public Policy Institute
Authors’ note: Thanks to Cary Day for assistance in the making of the map in Appendix A and the
cover and to Jordee Justice for reading and correcting the manuscript and for help on formatting
the tables and to John Shaw for reading and making suggestions on the manuscript.

2
THE SIMON REVIEW
The Simon Review papers are occasional papers of the Paul Simon Public Policy Institute at
Southern Illinois University Carbondale. These papers examine and explore policy issues within
the scope of the Institute’s mission and in the tradition of the University.
Production and distribution of this paper is supported by the generosity of donors to the Friends
of the Paul Simon Public Policy Institute Fund. To learn more about this fund, please visit
www.paulsimoninstitute.org/donate.
The Paul Simon Public Policy Institute acts on significant and controversial issues impacting the
region, the state, the nation, and the world. The Institute is committed to developing and working
to implement approaches that could bring concrete, positive results in tackling some of the most
difficult challenges in the public policy arena. The Institute focuses its efforts on fostering ethical
conduct in government, opportunity and fair treatment for people in America and throughout the
world, and promoting responsible citizenship for all Americans--but particularly for young
Americans.
The Institute executes its mission by conducting nationally known public opinion polls (Simon
Poll™ and The Southern Illinois Poll™) to inform decision makers and citizens, and analyzing
public policy in this paper and other media. The Institute also provides and supervises paid
internships and other learning opportunities for university students, hosts lectures and
conferences with noted leaders in public policy, journalism and other fields, and provides
leadership and civic education programs for high school students.
More information about the Institute can be found at www.paulsimoninstitute.org.
Feedback is welcome at our Facebook page at www.facebook.com/paulsimoninstitute or by mail
at our address below. Please remember to ‘like’ us on Facebook.
This and other The Simon Review papers are also available online at:
www.paulsimoninstitute.org/thesimonreview.
Paul Simon Public Policy Institute
Southern Illinois University Carbondale
Mail Code 4429
1231 Lincoln Drive
Carbondale, Illinois 62901

3
The Politics of Public Budgeting in Illinois
By John L. Foster and John S. Jackson
Abstract
This paper is about taxing, revenue and public budgeting in Illinois. The concept of public
budgeting includes both the revenues raised by government and the ways in which those
revenues are spent on the functions and programs sponsored by governments. This paper
focuses especially on spending, that is on how and where revenue is distributed in the state in
the form of public services and programs. It provides relevant data on the statewide
distribution patterns and especially the question of whether those expenditures of the tax-
payers’ money disproportionately benefit one region over the other. This question has
provoked a long running debate in Illinois and it is one of the key questions influencing
budgeting and most notably the raising of revenue in the state. The backdrop for this analysis is
the stalemate over the state’s budget that went on for more than two years in 2015-2017 and
that did lasting damage to the state and the continuing questions over what Illinois should do
next regarding taxes and spending which will be crucial issues in the 2018 elections.
Introduction: Perception and Reality in Public Policy Making
Our paper also raises questions related to perceptions and realities in politics and their role in
the never ending debate over the making of public policy and especially budgeting.
Constructing a budget and deciding each year how to spend the projected revenues is one of
the most fundamental things all governments are required to do. Budgeting shares equally in
with “providing for the common defense” in the words of the U. S. Constitution, that is,
ensuring public safety at the state and local level and for the national defense at the national
level. Those two receive top billing as the most important functions the public expects from
their government. As anyone who is conversant with Illinois government over the past few
years knows, Illinois was not able to perform that basic function, i. e. could not adopt a full
state spending plan for over two years, a failure unprecedented in the state’s modern history.
In addition Illinois has run a structural deficit in its budget for the almost two decades since the
turn of the century--another budgeting failure. This paper explores some of the root causes for
those failures and some of the basic lessons we should learn from those experiences to guide
the state’s future.
It is often asserted by those who study politics that perception is more important than reality in
the rough and tumble of the American political process. This is because public opinion,
campaigns and elections have a major impact on the making of policy and this is particularly
true in tax and budget issues. It is clearly the case that the public’s perception of an issue may
well not square with all the empirical facts. People believe what they have been taught, what
they have told by trusted sources, particularly public figures, sources they trust in the media,
and what they want to believe. Never mind what the factual basis for those beliefs are and how
complex the empirical realities of establishing what “the facts” are.
4
This makes it more difficult to make rational public policy based in the reality of what the facts
and the empirical evidence show. If the mass public does not believe in what are objectively
provable facts, this ignorance corrupts the political discourse and makes the adoption of
rational, evidence based public policy very problematic. For instance if a majority, or large
minorities of the public do not accept that there is a virtual scientific consensus about the facts
of climate change being real and that human activity has been the most significant cause of that
change, then the potential for the adoption of realistic measures to combat it become more
problematic (Nadja Popovish and Livia Albeck-Ripka, New York Times Interactive, December 14,
2017. https://www.nytimes.com/ineractive/2017/12/14/climate/republicans).
It is the role of a pluralistic community of scientists, engineers, researchers, scholars and
informed experts to try to learn what the relevant facts are and to understand what we do not
know and where the boundaries of ignorance still need to be pushed back. This is the
fundamental role of research. There are well founded rules required by the scientific method
that are the rules of the game in the establishment of empirical truth. Those rules govern the
ways in which a widely recognized body of public knowledge is created. The professional
communities in each discipline share a respect for those rules and requirements and
understand what is involved in expanding the scope and limits of accepted public knowledge.
Transferring all of that fairly “academic” and arcane scientific world to the political debate is
however a challenge in modern American politics, or in the politics of any state or nation in the
21st Century. “Experts”, scientist, engineers, and basic researchers are easily dismissed as
“elites” who are trying to tell us what to think and what to do in a political world which recently
has been infected by a mass populist movement, in the U. S. and in many other nations. The
manifestations of this mentality are as diverse as the “Brexit” movement in Great Britain and
Europe and “Trumpism” in the United States. This paper explores the occurrence of one major
disconnect between perception and reality which has long infected the politics of Illinois, and
has especially influenced the public discussion and the making of policy in the fields of taxation
and public budgeting in the Prairie State.
Popular Perceptions of the Budget and Taxing in Illinois
Americans in general do not like taxes and the people of Illinois are no exception to that general
rule (Fox, November 13, 2017, 62-67). It is perhaps a natural inheritance from our revolutionary
past which saw a new nation born in part out of the grievances of the colonists against the
British crown, and the popular uprising of the colonists against the “Stamp Act” taxes that
helped spark the American Revolution. “No Taxation without Representation” was a popular
battle cry which helped propel the relatively weak and disorganized colonies to make war on
the strongest military power on earth at that time.
It is significant that an appeal to that spirit of independence and rallying against taxes imposed
by England was a part of the narrative of the modern Tea Party’s uprising against the federal
government and the Obama Administration in 2009 and 2010. The Tea Party’s popular

5
adoption of the Revolutionary War’s coiled black snake on a yellow background flag was the
symbolic embodiment of this revolt against the governing party in particular and all political
elites in general. That was the beginning of the populist uprising which heavily influenced the
2010, 2012, and 2014 elections, and reached its apex in the election of Donald J. Trump in 2016.
This movement still roils our politics today. It may be that the dislike of taxes is universal;
however, in the U. S. that impulse is deeply embedded in our history and political culture,
encouraged by a substantial proportion of the political leaders, and constantly reinforced by
the tenor of most of our campaigns.
However, no matter how much we hate taxes in general we do like a great number of concrete
public policies and programs that are supported by that revenue. We like and depend on the
functions the taxes can buy. Symbolically this dichotomy was represented by the perhaps
apocryphal Tea Party demonstrator in 2009 holding a sign that read, “Keep your government
hands off my Medicare”. Our earlier analyses of longitudinal data covering public opinion in
Illinois over time shows clearly that a healthy majority of Illinois voters want to keep and not
cut substantially all the most important and most expensive services funded by state
government (Jackson, Leonard, and Dietz, June 2016). Public education, public safety, public
health, parks and recreation, etc. all received high levels of support coupled with majority
opposition to budget cuts when asked where specifically the state budget should be cut to
address the state’s continuing deficit.
Polls at the national level also support the view of the American public as being schizophrenic in
our desire for both low taxes and relatively generous public goods. We are especially solicitous
of those programs that benefit us and people like us. It is only foreign aid, welfare, and “waste
and fraud” that Americans generally believe are the source of the problems of the federal
budget and the cuts should come from what other people in other classes or other parts of the
country or state are receiving from the government if reductions are to be made.
This schizophrenic view is a perennial feature of American public opinion which led Lloyd Free
and Hadley Cantril to label us as “ideological conservatives and operational liberals” in a classic
article they published in 1967 (Free and Cantril, 1967, 206-261). That label is a cogent synoptic
description of the empirical data found in our Illinois polls over the 2008-2018 period (Jackson,
Leonard, and Dietz, 2016; Jackson and Leonard, 2014; Jackson and Gottemoller, 2007).
Polarization
It has become a commonplace in both the popular press and academic literature to observe
that the nation is deeply divided, or “polarized”. While there are nuanced differences between
some scholars about the depth and the policy impact of this polarization, most researchers
conclude that it is real at the political elite level and fairly advanced and deep at the mass voter
level as well. Empirical studies indicate that we are deeply divided by geography, class, race,
religion, party and ideology and those divisions have grown much more marked over the past
two to three decades (Levendusky, 2009; Bishop, 2008; Gelman, 2008; Heatherington, 2001).

6
These divisions are manifest most importantly in the way we vote individually and in the mass
distribution of public opinion collectively. It also shows up in the way the voters react to the
personalities and issues of the day. For example, the nation’s views on what kind of job the
president is doing or where public opinion stands on proposed policies are profoundly
influenced by which party the respondent belongs to and what their ideological positions are.
Those evaluations swing wildly from time to time with a change in presidents or the party in
power in the Congress.
Similarly voting patterns and the results of elections at state, local and national levels are
deeply influenced by where the voters live. The acceptance of the red state vs. blue state
symbolism and the deep differences those symbols represent are so widespread and complete
that they have become a handy popular shorthand for summarizing the many issues and
personalities that divide the American people.
Probably the most readily recognized application of the red state vs. blue state dichotomy is in
the wide acceptance of the fact that Americans are deeply divided into the predominantly rural
and the predominantly urban states (Bishop, 2008; Gelman, 2008). The national map of the
state winners of the presidential votes always show a deeply and predictably divided nation
which played out again when the winner of the electoral vote prevailed over the winner of the
popular vote in the 2016 election which in this respect was a replay of the 2000 election results.
What is not so widely recognized is that inside the states the counties and regions are often
also easily recognizable by their long running pattern of voting for either the Republicans or
Democrats so routinely that they provide safe seats in both the state legislatures and in
Congress for most of their legislative representatives. There are well recognized patterns of red
rural counties and blue urban counties voting consistently for their favored party over a very
long period of time in almost all the states. This theme is widely documented and analyzed in
a variety of literature on the sources of our current polarization (Florida, 2016; Bishop, 2008;
Gelman, 2008; Levendusky, 2009).
This red county versus blue county history is especially evident in Illinois where our politics
are marked and marred by regionalism. It is so prevalent that fairly often some angry pundit or
politician will advance the perennial idea of dividing Illinois into two states, Chicago and the
downstate region ostensibly in order to free the rural areas from the burdens of Chicago. In the
March 2018 Primary, one Democrat running for governor, Robert Marshall, went a step farther
and advocated the creation of three states, Chicago, the Collar Counties, and Downstate
(Luciano, March 12, 2018). It is an idea that has been around for much of Illinois’ history and
that refuses to die no matter how impractical it is (McClelland, November 15, 2017).
The natural regional divisions are also exacerbated by the partisan divisions that are long
standing. Several academic papers in this series have demonstrated clearly that most of the
one-hundred and two counties in Illinois have voted so routinely for either the Republican
candidate or the Democratic candidate over time that there is no problem in designating them
7
as either red counties or blue counties (Jackson, 2011). Most other states show a similar
pattern. These patterns are historic and hold true despite marked differences in issues and
candidates across disparate elections, for decades and even political generations. This electoral
stability provides the dependable and expected continuity in our election results.
In Illinois however there are still enough “swing counties”, or those where the partisan
distribution is so close, or where the numbers of independents or voters who are only weakly
committed to their party that they can go either way depending on the candidates or the issues
involved with a particular race. These voters and a modicum of “crossover voters”, i. e. partisan
loyalists who temporarily deviate from their party to vote for a candidate of the other party can
provide the change and the dynamism in the vote totals and in the ways elections are
conducted and how they turn out.
Those swing voters exist and they are also more predominantly found in the suburban areas.
Thus, the deep divisions between the urban and the rural counties are somewhat tempered by
the independent voters and the swing voters who can provide the winning margin in a closely
divided state or county. This tends to be the major pattern in Illinois where the suburban ring
of Cook County outside the city and the five suburban counties of DuPage, Kane, Lake,
McHenry, and Will can provide the difference between victory or defeat for many statewide
candidates.
Thus Illinois tends to be a predominately blue state because of the advantage in party
identification that the Democrats enjoy in statewide races. However, Illinois can and frequently
does elect Republicans to statewide offices depending on the personalities and resources of the
individual candidates and the driving issues of that particular campaign. The current Governor,
Bruce Rauner, is the most prominent example of that Republican potential as are former
senators Mark Kirk and Peter Fitzgerald and a long list of recent Republican Governors including
George Ryan, Jim Edgar and Jim Thompson.
The political tactic which is exaggerated in Illinois is the fact that individual candidates can and
often do use these political and geographical divisions as a major narrative or rationale for their
campaigns. As candidates see it they need to excite and motivate their base, that is, the loyal
party faithful to turn out voters no matter what the current issues are. They also need to
attract some of the independents and just enough crossover voters from the other side to be
competitive or make them a winner.
This is what happened in the 2014 governor’s race in Illinois for example. Republican Bruce
Rauner faced incumbent Pat Quinn in that race with Quinn seeking his first full term. Quinn had
initially inherited the job from the impeached Rod Blagojevich on January 29, 2009. He then
won a new term on his own in November of 2010 (White, 2013-14, 21). Right at the beginning
of that term Quinn led the Illinois General Assembly in adopting an increase in the state income
tax. Quinn argued that this increase was necessary to address a long term structural deficit that
had been built into the state’s spending habits which consistently exceeded its revenue flow, a

8
problem that extended back across governors of both parties and various partisan counts in the
General Assembly. During the Great Recession of 2008-2009, Illinois was particularly hard hit by
decreases in state revenue and increases in the need for spending on state services. This is
what happens in all recessions. There was also a unique increase in pension demands because
of the “ramp” in the state’s share of pension obligations which had been built into the pension
reform plan adopted in the mid-1990s under Governor Jim Edgar.
Put simply, unpaid bills were piling up and the state’s ability to pay them through the
manipulation of various accounts and one time only fixes had declined. So, Quinn advocated an
income tax increase and the Democratic majorities in the House and the Senate passed it in
January of 2011 without a single Republican vote in favor.
With $5 billion of new revenue from the tax increase the state started paying its bills more
nearly on time than before and stated paying down the backlog of unpaid bills most notably
including its required annual state pension payments. The state issued two operating bonds
backed by the earlier tobacco settlement in order to pay for the pension obligations in 2009
and 2010. In 2010 they had passed a pension reform bill which created a second tier for new
hires and this helped reduce the estimated long-term pension obligations. These steps plus the
new revenue from the income tax increase helped to stabilize the budget for the period of 2011
thru 2014. The unpaid bill backlog was reduced from $11 billion to about $6 billion by January
of 2015 when the “temporary” income tax expired.
Quinn also adopted some program expansions during his second term. Some of these later
became the basis for charges of “waste and fraud” that were leveled at him. One case involving
a community development program on the South Side of Chicago lent some credence to this
charge (Jackson, 2015).
This all set the stage for the 2014 campaign for governor and the General Assembly. Pat Quinn
attempted to explain that the new revenue was essential to providing the base of services that
the public expected and had come to rely on as well as to continue to pay down the
accumulated debt. Businessman challenger, Bruce Rauner, argued that most, and perhaps all of
the new revenue had simply been squandered on waste and fraud and unnecessary new
programs. The other Democrats running for statewide or local office tended to stay quiet in
this argument and emphasized their own local issues. Republican candidates for the General
Assembly condemned the income tax increase and promised its reduction if elected.
In 2014 Rauner was elected with 52.03% of the two party vote compared to 47.97% for Quinn
or by a 4.06 percentage point margin (Jackson, 2015, Appendix C). His victory was partially a
result of his anti-tax campaign, which was one of the major issues of his campaign although
he also argued that Quinn was not effective in getting things done. The Democrats maintained
a nominal 71 vote supermajority in the House however they could not always count on being
able to muster that majority on crucial votes. On the Senate side the party vote was 39 seats to
20 for the Democrats with a net loss of one seat (White, 2015, 31).

9
In January of 2015, when the new tax bill was scheduled to sunset, and a positive vote was
required to continue it there was little support among the Democrats for voting again for
extending the tax increase and unanimous opposition among the Republicans. Thus the
temporary increase was allowed to expire on January 1, 2015 with no plan for how to replace
the revenue it generated. With that expiration, five billion dollars of revenue per year
disappeared from the coffers of Illinois government. Immediately the accumulated backlog of
bills which had been partially paid down, started to build back up again. Constant wrangling
broke out between the Democrats in the General Assembly and the new Republican Governor
and his allies in the legislature. The result was that when the Democrats sent Rauner a budget
he vetoed it and the Democrats could not override his veto. A deep impasse developed.
Money continued to be spent, generally at the FY2015 level for a variety of essential services
under court order or due to the requirements of various federal grants for matching funds.
During this time the two areas most vulnerable under these impromptu rules were social
services and higher education. K-12 was taken off the table early by action agreed to by the
governor and leaders of the General Assembly from both parties since neither group wanted to
bear the onus of not funding public schools when they were scheduled to open in August 2015.
Universities and community colleges, on the other hand had no such protection, and they
immediately began to suffer since with no budget there were no state funds forthcoming
automatically. Their students and their families also suffered because the state started
withholding MAP grants which tens of thousands of Illinois students relied on to fund their
university or college tuition. Several universities moved immediately to use local funds to
temporarily pay for the MAP grants. This loss of state funds was somewhat alleviated by two
“stopgap” budget bills which partially funded the universities for the short term; however,
when it was all over for two fiscal years they had received only 41.5% of what they would have
received from state subsidy under the FY2015 base (Miller, June 4, 2018, 1). In addition the
resort to stopgap budgets created enormous uncertainty and dislocations for the universities
and their students and wreaked havoc on their ability to plan.
In early July of 2017 the Democrats muscled through the Illinois General Assembly a new
income tax bill with a handful of Republican votes. It provided for a nearly exact return to the
prior rates of 4.95% (instead of 5.0%) for the individual income tax rate and 7.0% (or 9.5% if the
Corporate Personal Property Replacement Tax is counted) for the corporate rate (Portman,
January, 2018). This increase was expected to generate nearly $5 billion to recoup the same
amount of revenue lost when the temporary increase expired in January of 2015. Governor
Rauner as he had promised to do, vetoed the bill. Since the Democrats had lost their
“supermajority” in the House in the 2016 election, they had to rely on a handful of Republican
crossover votes in the House and Senate to override the veto.
After a long and sometime raucous public debate, the Democrats were able to override the
governor’s veto with the assistance of one crossover Republican vote in the Senate and ten in
the House. The new rates went into effect immediately and the state started to replenish its

10
coffers with an augmented revenue stream (Bosman and Davey, July 6, 2017; Hinz, July 6,
2017).
The governor and his allies launched an intensified statewide campaign to blame the
Democrats, and especially Speaker Mike Madigan for the tax increase. Many Republican
legislators joined the governor in this condemnation of the increase which was essentially a
return to the rate which Illinois taxpayers paid from January 2011 to January 2015. The
governor also took out a series of ads which emphasized his opposition to the increased tax.
Many observers saw this as the starting gun for the governor’s campaign for a second term in
2018.
Rauner’s strategy was also reinforced by his subsequent opposition to and threatened veto of
an historic measure which would fundamentally rewrite the state’s formula for how state
revenue was distributed to local school districts. This had been a perennial problem in Illinois
for at least two decades. Critics of the prevailing formula pointed out that it did not
systematically help those districts with a low property tax base, and thus those districts with a
high number of needy students were not nearly equal in the amount of money they could
spend per pupil. The wealthy districts often outspent the poor districts by a factor of 3 or 4 to
one in total state plus local expenditures per pupil.
Governor Rauner charged that the new state aid formula disproportionately favored the
Chicago Public Schools system. He pointed to a long standing block grant program that did
apparently favor Chicago to some extent because it gave them block grants for special
education and transportation based on a guaranteed rate whereas other districts had to apply
through a more stringent categorical grant program. This gave Chicago more money for these
particular functions although Chicago officials claimed that they received a smaller proportion
of total state aid than their share of the state’s school population would require. In addition,
the Chicago Public School system had paid their share of the pension obligations
(approximately $221 million annually) while those districts outside Chicago had their share of
the pension payments picked up by the state.
The governor and some Republican legislative leaders claimed that the block grant guarantee
was just another “give away” to Chicago. This new example was seen by Chicago’s critics as
reinforcing the well-developed narrative that Chicago was always favored in the scramble for
scarce state resources.
After another contentious debate the bill was tweaked to give the private schools an additional
allocation of new money. It made available a total of $75 million for a pilot program which
would provide tax credits for individual donations to scholarships for students to attend private
schools. This was something Republican had long supported and even the Cardinal of Chicago
climbed on board this bandwagon thus making it easier for Democrats to support. With this
added feature to the bill it passed handily, and the governor signed it.

11
By the end of the fall 2017 veto session the script for the 2018 state elections was mostly set.
Rauner would run on getting the state back on track again and making the policy changes he
sought as necessary to making Illinois more competitive with surrounding states (Leonard,
2017). For him this would consistently entail his pointing at Speaker Madigan as the scourge of
state government and the obstacle to all reform and progress. The governor’s “Turn-Around
Agenda” continued to consist of a series of proposals to curb the power of organized labor
including “Right to Work” laws at the local levels, curtailing the use of union dues to pay for
lobbying, and cutting the state’s contributions to Workman’s Compensation (Ibid). Achieving
this objective demanded the curtailing of the power of Speaker Madigan and his supporters in
the General Assembly mostly via the passage of a term-limits amendment that the governor
constantly touted.
In addition the power of local governmental bodies had to be contained via distinct limits on
the property taxes (Ibid). When pressed by reporters and in some of his television ads, Rauner
also talked about “rolling back in stages” the new income tax increase. In the run up to the
upcoming primaries in 2018 the governor continued to talk generally about the need to reduce
Illinois taxes and especially targeted the increase in the income tax as well as property taxes. On
February 14, 2018 the governor gave his annual budget address. In it, he proposed rolling back
the state income tax increase over a four year period starting with a one billion dollar reduction
which would have been twenty percent of the five billion total raised by the tax increase. He
then went up with a series of television ads touting his tax decrease plan and attacking the
Democrats, especially Speaker Madigan, for the tax increase. Critics noted that his proposed
budget, however, built the entire five billion dollars from the tax increase into his base budget
for FY2019. His budget also depended heavily on moving public employee pension payments
and health insurance costs from the state to local governments, changes unlikely to be adopted
by the legislature. This early exchange presaged the major themes for the fall campaign.
The Democrats, especially J. B. Pritzker, essentially ran as the “anti-Rauner” candidate. Pritzker
emphasized that he, too, wanted economic development and more jobs, but his diagnosis of
what that would require was essentially in direct opposition to virtually every point in Rauner’s
platform. What some termed, “the Battle of the Billionaires” in Illinois featured two very
wealthy candidates promising to be the champion of the middle and working classes
(Economist, October 21, 2017, 32). By the time the votes were counted on March 18th, Rauner
and Pritzker had emerged as the nominees for their parties, although Rauner had a much closer
challenge from the far right than had been expected. He beat his challenger, State
Representative Jeanne Ives, by a narrow 20,000 vote margin while J. B. Pritzker effectively
doubled the vote for his two closest rivals, Senator Daniel Biss and Chris Kennedy.
After the primary the overall outline of the fall general election and the major narratives were
clearly discernable. One of fall campaign’s central features would be the fight over the budget,
the deficit, tax revenues and where to find the tens of millions of dollars of current spending
that the current budget did not support.

12
The Survey Data
As was discussed in the introduction to this paper, the Illinois political culture has long been
marked by a deep division between the major regions of the state. Chicagoland, versus
Downstate, Central and Southern Illinois versus Northeastern Illinois are common themes in the
political debate. This division manifests itself especially with Western Illinois and Southern
Illinois residents, and their representatives, perennially voicing feelings of being left out and
both regions occasionally spark loud movements to “secede” from the rest of the state. (Never
mind that this feat is nearly impossible to accomplish politically and constitutionally). Often
this Downstate mistrust and ire are aimed at Chicago since it is by far the largest, the most
prosperous, and the most powerful part of the state.
These feelings of regional pride or regional jealously are not completely unusual. Many states
with a big city and a dominant urban area have some of the same divisions. New York City
versus “Upstate” New York, southern California versus northern California, and Atlanta versus
the rest of Georgia are all recognizable memes in their state politics. What is different or at
least exaggerated in Illinois, however, is the extent to which many Illinois leaders emphasize,
exploit and exacerbate these regional differences for their own advantage. One of the most
tried and true political strategies in Illinois is to run against Chicago. Or alternatively, running
against major leaders of Chicago. As the original example, Mayor Richard J. Daley and the Daley
Machine in his day was always a staple for Downstate candidates to target their ire against.
More recently, the stand-in for running against Chicago is to run against Speaker of the House
Michael J. Madigan the long-time leader of the House Democrats and the Chair of the Illinois
State Democratic Party. Some of the most effective campaigners against Madigan, or before
him, Daley, have themselves also been from Chicago. Democratic Governor Dan Walker from
the mid-1970s and Republican Governor Bruce Rauner currently are the epitome of a Chicago
candidate getting elected statewide by running against the city. That theme is already
prominent in the campaign of Governor Rauner seeking re-election in 2018 and to a lesser
extent in the advertising campaign of his major rival, J. B. Pritzker.
This internecine strategy is sometimes seen in other states. Political Scientist, Katherine
Cramer, wrote a well-reviewed book published in 2016 documenting the rise to power of
Governor Scott Walker in Wisconsin (Cramer, 2016). In it she explored the concept of “Rural
Resentment” which she maintained is endemic to Wisconsin politics. She noted that much of
“Upstate Wisconsin” is like Downstate Illinois, that is, Upstate residents see the urban southern
part of Wisconsin, centered in Madison and Milwaukee, as the source of many of their state’s
troubles and places to be avoided and mistrusted. Ironically, Walker used these themes very
advantageously to win his first election and to survive the re-call election against him which
followed even though when he ran for governor he was the County Executive in Milwaukee.
Kramer also documented the pervasive extent of these urban-rural divisions in the minds of the
voters as evidenced by poll data gathered by the University of Wisconsin. Her polls showed just

13
how regionally divided Wisconsin was in the conviction in the Upstate areas that the urban
sections of the state in the south were getting more than “ their fair share” of state resources
and the feeling that the government in Madison did not represent the values and opinions of
those who lived in the more rural areas.
Cramer later noted the similarities of these divisions in the marked rural versus urban and
sectional geographic divisions that were so vivid in the national presidential election in the 2016
election. Donald Trump mined a rich vein of anti-Washington, anti-Establishment, anti-Elite,
and anti-urban resentment in places like Appalachia, the Rust Belt of the Midwest, much of the
Mountain West, and the perennial resentments in much of the South, especially the rural parts
of the Confederacy. Several studies of the 2016 election and Trump’s victory have
demonstrated the extent to which Trump was able to mine “the politics of resent” and the
alienation and mistrust that many Americans, especially those in the more rural areas and
those places where the global economic trends have hurt rather than helped the local economy
to carry him to the White House.
We are taking a page out of the Cramer book in our use of essentially the same polling
questions to demonstrate the extent of those rural vs. urban divisions in Illinois.
The Data
Our survey data are taken from statewide polls of registered Illinois voters as a part of the
Simon Poll series done by the Paul Simon Institute. These polls are designed to take periodic
measures of public opinion on a variety of political, public policy and values questions for the
entire state.
In 2017 we included questions regarding the perception of each region’s getting its “fair share”
of state resources in one of our polls conducted in the fall. This was a statewide poll of
registered voters with a total of 1000 respondents and a margin of error of 3.1 percentage
points.
We included these questions because of the long-standing controversy that this issue causes in
Illinois politics and its omnipresent appearance in so many political campaigns and their
commercials. These arguments were key to the budget impasse of 2015 through 2017 and a
part of the conflict over the General Assembly’s vote to override the governor’s veto of the
budget that finally passed in July of 2017. This narrative also surfaced a couple of weeks later in
the school funding formula battles between the governor and the legislature when the
governor threatened a veto of the whole package over his charge that the formula entailed a
“bailout of the Chicago Public School system”. While he initially signaled support for the bill, he
later vetoed it over an issue of the bill’s inadvertently leaving out some 138 small and
religiously sponsored private schools who did not have official recognition from the Illinois
State Board of Education and would not benefit during the first year from the new tax credit for
private school scholarship donations. As a result the new law was delayed until April of 2018,
deep into the planning period for FY2019 while these differences were resolved.

14
This issue of regionalism is also shaping up to be an important part of the political debate for
the general election in the fall of 2018. As covered above, the campaign ads during the primary
season were filled with charges that one candidate or another is “sold out” to Chicago or to
Speaker Madigan.
These regionalism issues are so pervasive in Illinois we included items specifically designed to
measure their contours in our statewide polls of 1000 registered voters conducted in the fall of
2017 and in the spring of 2018. The results here are from our 2017 poll and were based on
Cramer’s Wisconsin polls (Cramer, 2016). The first question asked:
Table 1
”How much attention do you feel the state government pays to what the people in your
community think when it decides what to do?”
Statewide Chicago Suburbs Downstate
A Good Deal 5% 7% 6% 3%
Some 19% 16% 22% 18%
Not Much 70% 72% 67% 73%
Don’t Know 5% 6% 5% 6%
Obviously the statewide results show that very few Illinois voters are impressed with the extent
to which their elected representatives pay attention to them or the people in their community
in making decisions. The modal category is “Not Much” which attracted seventy percent of the
respondents. The results by region reinforce this image of widespread disenchantment.
Broken down by region, the similarities are striking and the differences are narrow. The
Downstate residents by a small margin are the most alienated. The Suburbs are the least
alienated and the most generous in their assessment of how much their legislators share their
values, but the margin of difference is not great. Confidence in the link between the governors
and the governed is one of the essential elements of representative government and on this
measure, Illinois state government elicits little confidence from the voters.
Table 2 examines the question of how much the state government represents your
community’s values. This question also captures a fundamental tenant of mass democracy in
that the voters need confidence that their political leaders share some level of the same basic
values that they hold to. Obviously, the “Not Much or “Only a Little” categories attracted over
a majority (53%) of the statewide responses. It was also the most popular response in each of
15
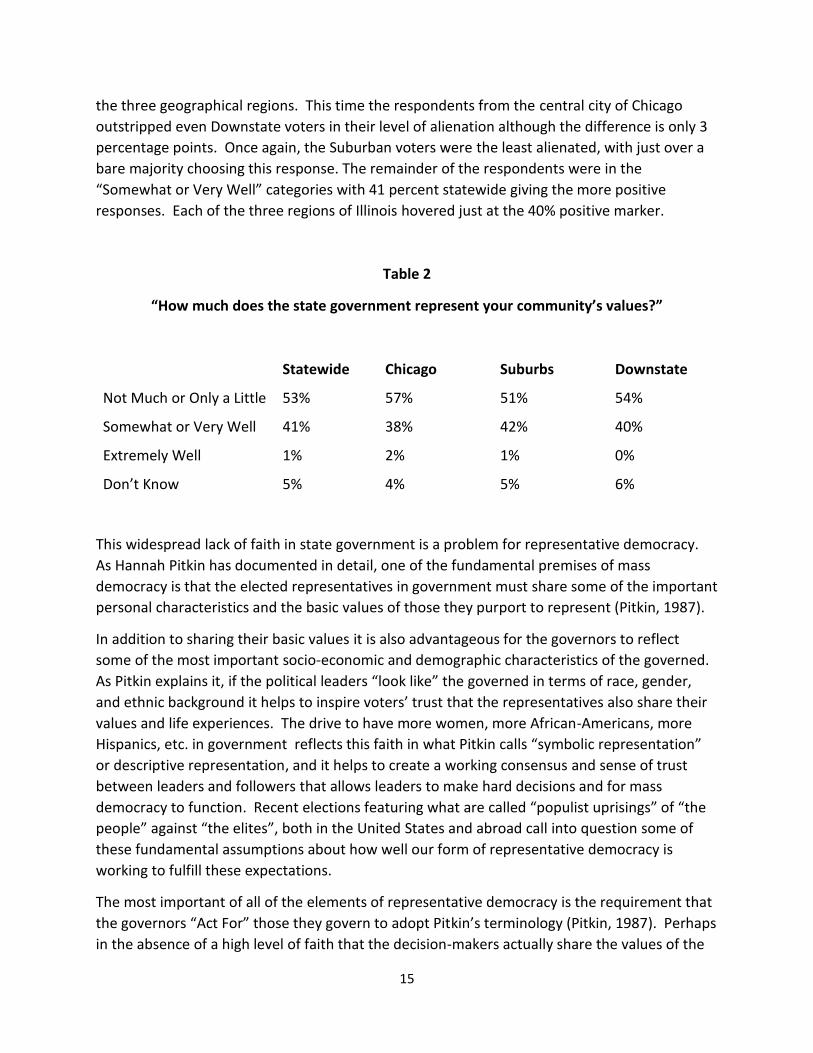
the three geographical regions. This time the respondents from the central city of Chicago
outstripped even Downstate voters in their level of alienation although the difference is only 3
percentage points. Once again, the Suburban voters were the least alienated, with just over a
bare majority choosing this response. The remainder of the respondents were in the
“Somewhat or Very Well” categories with 41 percent statewide giving the more positive
responses. Each of the three regions of Illinois hovered just at the 40% positive marker.
Table 2
“How much does the state government represent your community’s values?”
Statewide Chicago Suburbs Downstate
Not Much or Only a Little 53% 57% 51% 54%
Somewhat or Very Well 41% 38% 42% 40%
Extremely Well 1% 2% 1% 0%
Don’t Know 5% 4% 5% 6%
This widespread lack of faith in state government is a problem for representative democracy.
As Hannah Pitkin has documented in detail, one of the fundamental premises of mass
democracy is that the elected representatives in government must share some of the important
personal characteristics and the basic values of those they purport to represent (Pitkin, 1987).
In addition to sharing their basic values it is also advantageous for the governors to reflect
some of the most important socio-economic and demographic characteristics of the governed.
As Pitkin explains it, if the political leaders “look like” the governed in terms of race, gender,
and ethnic background it helps to inspire voters’ trust that the representatives also share their
values and life experiences. The drive to have more women, more African-Americans, more
Hispanics, etc. in government reflects this faith in what Pitkin calls “symbolic representation”
or descriptive representation, and it helps to create a working consensus and sense of trust
between leaders and followers that allows leaders to make hard decisions and for mass
democracy to function. Recent elections featuring what are called “populist uprisings” of “the
people” against “the elites”, both in the United States and abroad call into question some of
these fundamental assumptions about how well our form of representative democracy is
working to fulfill these expectations.
The most important of all of the elements of representative democracy is the requirement that
the governors “Act For” those they govern to adopt Pitkin’s terminology (Pitkin, 1987). Perhaps
in the absence of a high level of faith that the decision-makers actually share the values of the

16
people they represent it is even more important that there be some working level of trust that
the political elites will act faithfully for those they represent. Put simply, if they vote as I would
vote on policy issues at an acceptable level, their underlying personal values may not be as
important as the votes they cast. Perhaps this helps explain the often commented on anomaly
that in the 2016 presidential election approximately eighty-three percent of evangelical
Christians voted for Donald Trump. None of Trump’s lifestyle choices, personal language or
church attendance record would reflect the basic traditional value commitments of evangelical
Christians. So how could they possibly vote for him?
Some of the evangelical leaders, when confronted with this apparent contradiction admitted
freely that they wanted Trump’s support for anti-abortion bills, his opposition to same-sex
marriages, his promise to allow churches and pastors to participate openly in politics, even
from the pulpit, without losing their tax-exempt status, and his pledge to appoint conservative
Justices to the U. S. Supreme Court more than they wanted evidence that he shared their basic
values or had ever practiced anything resembling their form of traditional Christianity. When
faced with this dilemma, the church people unhesitatingly chose the “acting for” dimension of
representation over any other dimensions of representation although they would not have
used these terms. Pitkin’s untangling of these different layers of the concept helps us to
understand how this may not have been a hard choice for those dedicated to their policy goals
first and foremost above the other dimensions of representation.
Table 3 turns to the more pragmatic questions of who gets what in the allocation of scarce
resources that state government inevitably must do as one of its most crucial functions. This is
the essence of the budgetary process at any level of government. The fact that the resources
are always scarce is what makes governing in general and budgeting in particular so important
and so conflict ridden. It shows why you can never take “politics” out of the business of
governing. The 2015-2017 stalemate in the budgetary process in Illinois and the brief shutting
down of the federal government in the fall of 2017 and January of 2018 illustrate just how
fundamental the budgetary process is to the government’s operation. When that function fails,
government basically fails at its most fundamental level and many ordinary people are hurt.
Table 3
“How well does the state of Illinois do in distributing government resources equally across
rural, urban and suburban areas of the state?”
Statewide Chicago Suburbs Downstate
Not At All or Only a Little 62% 60% 61% 66%
Somewhat or Very Well 24% 22% 24% 24%
Extremely Well 1% 2% 1% 0%
Don’t Know 14% 17% 14% 10%

17
This table explores the question of whether the state is distributing governmental resources in
an equitable manner. It is easy to see that this question also taps into the possibility for deep
wells of resentment to exist in the different areas of the state with respect to whether their
areas are receiving their “fair share” of the governmental pie. In fact regionalism and regional
conflicts are among the most enduring themes in the political culture of Illinois. Almost any
campaign for state representative, state senate, or governor in Illinois will include a heavy dose
of one candidate accusing his or her opponent of having “sold out” to another region of the
state.
The results are not encouraging for state government as 60% or more statewide and in all three
regions give their political leaders bad marks on this report card. Downstate is still the most
alienated toward their state government with Chicago and the Suburbs essentially the same on
the “Not at All Well or Only a Little” categories. Just under one-quarter of the respondents
statewide and almost the same levels in each of the regions gave the state the “Somewhat Well
or Very Well” marks, and only one to two percent in all categories gave the most positive
“Extremely Well” response.
In the questions reported in Tables 4, 5, and 6 we break out these responses by the three most
widely recognized geographic regions of Illinois. This helps us see how the voters in each of the
regions evaluate the treatment they are receiving from the state as compared to their
counterparts elsewhere in the state. This is an attempt to delve a bit deeper into these regional
perceptions of who is getting their “fair share”.
Table 4
“Are rural areas of Illinois given much more than their fair share, somewhat more, somewhat
less, much less or about their fair share of government resources?”
Statewide Chicago Suburbs Downstate
Much More or Somewhat More
13% 24% 12% 7%
Somewhat or Much Less 48% 35% 42% 66%
About Fair Share 18% 13% 22% 14%
Don’t Know 22% 29% 24% 13%

18
Table 5
“What about suburban areas? Are suburban areas of Illinois given much more than their fair
share, somewhat more, somewhat less, much less, or about their fair share of government
resources?”
Statewide Chicago Suburbs Downstate
Much More or Somewhat More
42% 53% 33% 47%
Somewhat or Much Less 16% 10% 19% 15%
About Fair Share 28% 18% 34% 24%
Don’t Know 15% 21% 14% 14%
Table 6
“Lastly, what about urban areas? Are urban areas of Illinois given much more than their fair
share, somewhat more, somewhat less, much less, or about their fair share of government
resources?”
Statewide Chicago Suburbs Downstate
Much More or Somewhat More
30% 14% 31% 40%
Somewhat or Much Less 37% 55% 38% 25%
About Fair Share 19% 16% 18% 23%
Don’t Know 13% 17% 12% 13%
As we anticipated the Downstate voters are the most alienated or disenchanted with their lot
from state government as compared to their peers in the other two regions of the state. They
are the group most convinced (66%) that they are not receiving their fair share, and indeed are
receiving somewhat less or much less than their fair share as is evident in Table 4. This theme
of what Katherine Cramer calls “rural resentment” is now recognized as one of the driving
forces today in American politics (Cramer, 2016). It is one of the key components in explaining
Scott Walker’s take-over of state government in Wisconsin, and explaining how he survived the
recall vote subsequently mounted against him by a national coalition of Democrats and
Progressives which is the story Cramer told in her book. She and many others following her
lead then went on to extrapolate the dynamics of rural resentment as one of the most

19
important factors in the deep rural versus urban distribution of the presidential vote for Donald
Trump and Hillary Clinton nation-wide in 2016.
What we did not entirely anticipate was the extent to which Chicago voters shared this
disenchantment with respect to whether urban voters receive their fair share. As Table 6
shows, well over a majority (55%) of Chicago voters say that the urban areas are receiving
somewhat less or much less than their fair share. This level of what we would term “urban
resentment” is exceeded only by the 66% level of resentment exhibited by Downstate rural
voters in Table 4 with respect to the rural areas’ slice of the budgetary pie. (Badger, 2018, 23).
So the politics of resentment has traction among urban voters in Chicago just as it does among
rural voters Downstate. Those political leaders who divide Illinois into regions and appeal to
regional identity and stir the sense of resentment against other regions have done their work
effectively. Tens of millions of dollars spent in uncounted numbers of political ad campaigns
over the years have appealed to and reinforced this divisive narrative in Illinois. The counter
argument of “we are all in this together” and “what helps Illinois as a whole helps all of us” and
“politics does not have to be a zero-sum game” is not getting much traction in Illinois judging by
our poll results. The leaders of most other states celebrate their state’s history, culture, and
accomplishments and tout state pride. They have at least one major state university athletic
team or a professional sports franchise that is the pride of most fans statewide no matter what
their regional allegiances are. That is not the tradition in Illinois.
Voters in the Suburbs are somewhat the exception to this pervasive dissatisfaction and
resentment rule. They are about equally divided in their assessment of how well the suburbs
do in the constant battle for scarce resources. As is evident from Table 5, fully one-third (33%)
of suburban voters believe that they receive much more or somewhat more and an almost
identical 34% say that they receive about their fair share. This leaves only 19% who say that
suburban voters receive somewhat less or much less than their fair share. Trying to mine the
well-springs of some sort of “suburban resentment” does not appear to be a particularly
promising strategy for candidates in those areas of Northeast Illinois.
All of the discussion in the first section of the paper above proceeded in a vacuum based on the
political perceptions of the people. What is usually absent from such discussions is empirical
data showing the realities of where the money is spent by the state compared to where it is
raised in the form of state revenues. That is a very different story as we will see in the next
section of the paper. The deeply embedded strain of rural resentment reflected in our polls is
not necessarily well founded on demonstrable facts as we will see in the next section of the
paper. But, we started this section with the assertion that most of the time perception is
important, even crucial, in politics. When perception does not match the facts, it is very often
the perceptions, the belief systems of the people that count the most.
20
Economic Data
In one sense, ordinary voters and even officials closely involved with government should not be
faulted for not having a precise idea of which regions state revenues come from and where
they are disbursed. The state’s records do not make it particularly easy to track. In brief, there
is no single source of state revenue and disbursement data broken down either by county or
region.
The Illinois Department of Revenue does publish income tax data on their website by county
through 2015. Sales tax revenues can be traced through the return of the local portion to
counties and municipalities. But this is a significant data management task given that the state
has 1,298 municipalities receiving funds spread across 102 counties. Lottery sales are recorded
by zip code. Federal Medicaid reimbursement, which accounts for over 10% of state revenue
must be traced by the home county of recipients.
On the disbursement side, records are kept by different agencies using their organizational
units. For example, general formula and mandated categorical aid to K-12 education is
recorded by the 921 districts or separate units across the state rather than by the 102 counties.
Similarly, the state aid to community colleges data available on the Illinois Community College
Board website is categorized by 39 separate districts. State higher education aid expenditures
are available in the Illinois Board of Higher Education records and distributed to the 12
universities. This is attributed to the counties in which they are located, although their effects
obviously spill over county lines.
By far the most considerable recent effort to sort out state revenues and disbursements by
county was a report by the Illinois General Assembly’s Legislative Research Unit (LRU) released
in October 2015 (Legislative Research Unit, 2017; See also Legislative Research Unit, 1989).
Using 2013 tax and budget records, the LRU undertook a massive data management task and
was able to trace 80% of the tax revenue and 71% of expenditures from the general fund to all
102 of Illinois counties. The largest untraced item on the revenue side was the corporate
income tax. The LRU staff noted that these taxes are filed in the home county of the
corporation while business can be done across a number of counties or in other states.
On the disbursement side, the largest single item not traced was contributions to the various
public pension systems which have grown to over 20% of the general fund. Pension
contributions from the state are recorded in the counties housing the system headquarters.
Later these funds plus employee contributions and investment returns are disbursed as
payments to pension recipients across the state, nation and other countries.
The major portion of the traceable 80% of tax revenues to the general fund consisted of the
individual income tax, the state share of sales tax and the federal match for Medicaid. Much
smaller revenue sources included lottery profits, insurance taxes and the estate tax. The 71%
of traceable disbursements in order of size included Medicaid, K-12 education aid including the

21
mandated categorical programs, state operations, state payroll, Local Government Distributive
Fund, and state aid to public universities and community colleges.
The LRU report included several additional cautions in using this data. First one year of data is
obviously a snapshot in time and conditions do change with budget cycles. Second, economic
benefits clearly spill across county lines. And third, only the general fund data was included.
Revenue sources such as the motor fuel tax, vehicle license fees, toll way fees and expenditures
such as capital projects and the transportation category were excluded.
These are all reasonable cautions. We will use regions rather than counties which will reduce
but not totally eliminate the spillover problem. While it is true that FY 2013 data is a snapshot,
it is still useful for looking at taxing and funding for 2018. Budgeting is incremental and the
major contours of the 2018 budget are not dramatically different from the 2015 or even the
2013 budget. The state income tax was 5% in 2013. It has since returned to 4.95% after a
sharp reduction during the budget stalemate. The sales tax remained the same. Illinois fully
participated in the Federal Medicaid expansion by 2013 which remains in effect. Higher
education and community college state funding was dramatically reduced during the budget
stalemate years, but has returned to 90 percent of FY 15 levels. A new K-12 school aid formula
which increases state funding to the poorest property wealth districts passed in 2017, but it is
just going into effect at the time of this writing.
The data in Table 7 from the 2010 US census provides background for the state data analysis to
come. We first divided the state into three regions to match the groupings used in the earlier
poll data discussed in this paper. Cook includes the City of Chicago and its inner ring of suburbs.
The five suburban counties are DuPage, Kane, Lake, McHenry and Will. The other 96 counties
are lumped in “downstate”.
There are, however, significant variations across these 96 counties which stretch across 400
miles from the Wisconsin border to the Ohio River. Hence, we divided the 96 into four major
sub regions which, with some collapsing, follow the 10 economic development regions defined
by the Illinois Department of Employment Services (See Appendix A). The 18 North counties
run from the Wisconsin border as far south as Kankakee excluding Cook and the five suburban
counties. The 9 Southwest counties essentially are the Illinois portion of the St Louis
metropolitan area. The 19 Southern counties are along the I-64 corridor and south to the Ohio
River except for the St Louis metro area. We lumped the remaining 50 counties, which make up
5 IDES regions, into one large Central region.
Table 7 provides a quick look at the economic variation across the state. The five suburban
counties are by far the wealthiest on median household and median family income. The Cook
County region is slightly higher than the 96 county downstate region on these measures.
However, there is significant variation across the downstate counties. The 18 North counties as
a group are virtually the same as Cook County on the income measures while the 19 Southern
counties fall some distance behind.

22
Table 7
County Household and Family Income by Region
Region # of Counties in Region
Median Household Income*
Median Family Income**
Average County Population
Average County Number of Households
Cook 1 $53,942 $65,039 5,194,675 1,966,356
Suburban 5 $75,137 $86,860 624,395 216,756
Downstate 96 $45,752 $57,204 47,233 18,695
North 18 $53,698 $64,618 103,179 38,549
Central 50 $45,091 $56,976 67,103 27,375
Southwest 9 $47,193 $58,978 48,558 19,325
South 19 $37,514 $48,316 20,283 8,350
*Average median household income for counties in that region.
** Average median family income for counties in that region.
Source: 2010 United States Census reported in
wikipedia.org/wiki/List_of_Illinois_locations_by_per_capita_income
At this point, it is important to note that the rural, and to a lesser degree urban resentment
outlined in Tables 4-6 is inversely related to the regions’ broad economic conditions. The
highest levels of resentment of state taxing and spending policies occur in the downstate
counties which lag Cook County a little and the five Suburban Counties a lot on the economic
measures. The lowest levels of resentment of state policies are in the suburban counties which
clearly are doing the best. Urban Cook County is in the middle.
We do not have income data for the specific respondents to the survey. Hence, we cannot
conclude that low economic well-being is directly related to the level of resentment of state
policies among individuals. And we cannot break down the downstate survey data across the
four downstate sub regions. But if we could, we would speculate that the highest levels of
rural resentment occur in the 19 most southern counties. This speculation is partially based on
the fact that both authors have lived in southern Illinois for over forty years each.
The Southern Illinois Survey conducted periodically by the Simon PollTM provides some
additional relevant evidence. This question of rural resentment being strongest in the most

23
economically deprived parts of the state is probably related to the feeling of whether the state
is on the right track or wrong track which we ask routinely in our surveys. The 2015 Southern
Illinois poll of eighteen counties which largely overlap the “south” region in this analysis
showed that 79% of the respondents believed that the state of Illinois was on the “wrong track”
and only 13% said it was on the right track. Our March of 2015 statewide poll found that 61%
of all Downstate residents said Illinois was on the wrong track and 23% said right track. So,
these data at least indirectly suggest that southern Illinois residents are more skeptical and
critical toward state government than even the rest of downstate.
Table 8 presents the best data available on how state taxing and spending actually affect the
various regions of Illinois. For this table, we took the 2013 state general fund data collected by
the LRU for each county and aggregated it to the six regions. As noted above, the revenue data
includes 71% of disbursements drawn from and 80% of the revenue earmarked to the general
fund. The ratio column represents funds received in comparison to revenue generated. Given
this 71%/80% limitation, a ratio of .89 would estimate the same number of dollars received as
contributed (.71/.80=.89).
The final “estimated adjusted” column assumes that the unknown general fund data (mostly
corporate income tax on revenue side and pension payments on disbursements) is divided
across the regions in the same proportions as the known data. Disbursements are thus divided
by .71 and revenue by .80. A ratio of 1.0 then indicates equal estimated revenue and
expenditures in a region.
Table 8
Selected State Revenue and Disbursement by Region
Region # of Counties
in Region Selected State
Revenue x 000
Selected State Disbursement
x 000
Ratio* Estimated Adjusted Ratio**
Cook 1 $11,925,149 $9,515,776 0.80 0.90
Suburban 5 $8,024,505 $3,738,956 0.47 0.53
Downstate 96 $8,120,546 $12,096,366 1.49 1.69
North 18 $2,574,235 $2,827,802 1.10 1.24
Central 50 $3,828,613 $6,361,238 1.66 1.87
Southwest 9 $1,237,775 $1,559,109 1.26 1.42
South 19
$622,920 $1,553,709 2.49 2.81
*Ratio is selected disbursements at 71% level divided by selected revenue at 80% level
** Adjusted ratio is disbursements divided by .71 divided by expenditures divided by .80
24
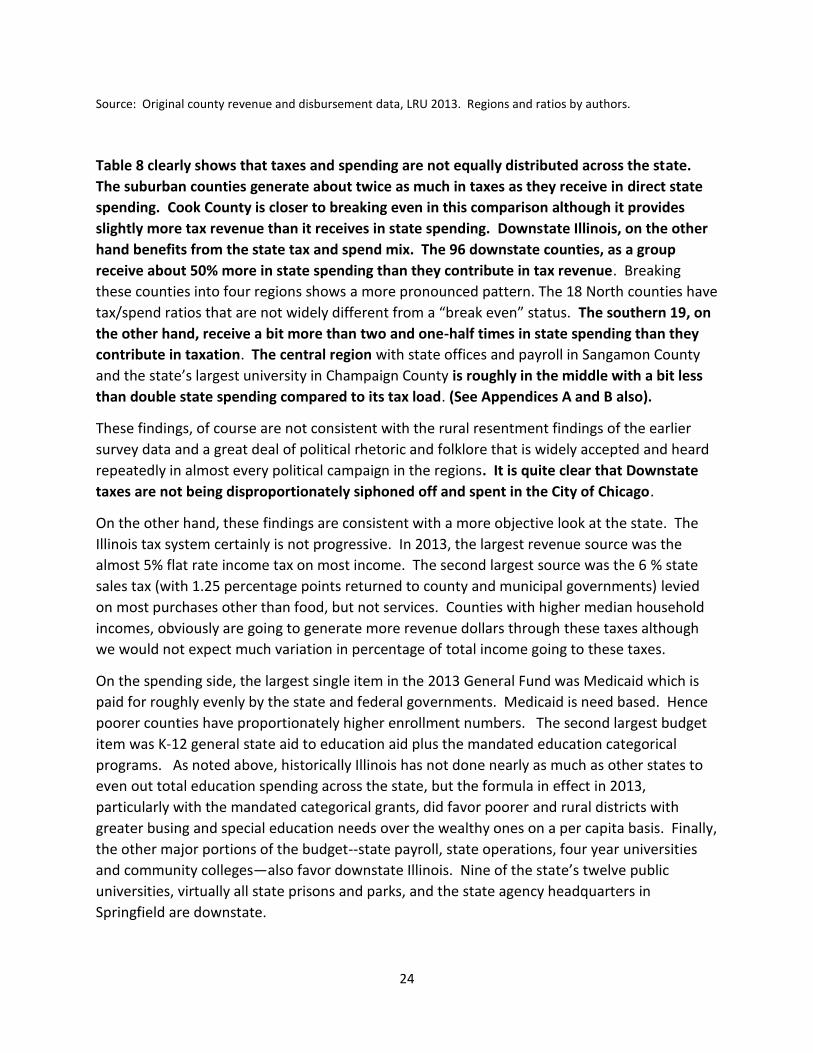
Source: Original county revenue and disbursement data, LRU 2013. Regions and ratios by authors.
Table 8 clearly shows that taxes and spending are not equally distributed across the state.
The suburban counties generate about twice as much in taxes as they receive in direct state
spending. Cook County is closer to breaking even in this comparison although it provides
slightly more tax revenue than it receives in state spending. Downstate Illinois, on the other
hand benefits from the state tax and spend mix. The 96 downstate counties, as a group
receive about 50% more in state spending than they contribute in tax revenue. Breaking
these counties into four regions shows a more pronounced pattern. The 18 North counties have
tax/spend ratios that are not widely different from a “break even” status. The southern 19, on
the other hand, receive a bit more than two and one-half times in state spending than they
contribute in taxation. The central region with state offices and payroll in Sangamon County
and the state’s largest university in Champaign County is roughly in the middle with a bit less
than double state spending compared to its tax load. (See Appendices A and B also).
These findings, of course are not consistent with the rural resentment findings of the earlier
survey data and a great deal of political rhetoric and folklore that is widely accepted and heard
repeatedly in almost every political campaign in the regions. It is quite clear that Downstate
taxes are not being disproportionately siphoned off and spent in the City of Chicago.
On the other hand, these findings are consistent with a more objective look at the state. The
Illinois tax system certainly is not progressive. In 2013, the largest revenue source was the
almost 5% flat rate income tax on most income. The second largest source was the 6 % state
sales tax (with 1.25 percentage points returned to county and municipal governments) levied
on most purchases other than food, but not services. Counties with higher median household
incomes, obviously are going to generate more revenue dollars through these taxes although
we would not expect much variation in percentage of total income going to these taxes.
On the spending side, the largest single item in the 2013 General Fund was Medicaid which is
paid for roughly evenly by the state and federal governments. Medicaid is need based. Hence
poorer counties have proportionately higher enrollment numbers. The second largest budget
item was K-12 general state aid to education aid plus the mandated education categorical
programs. As noted above, historically Illinois has not done nearly as much as other states to
even out total education spending across the state, but the formula in effect in 2013,
particularly with the mandated categorical grants, did favor poorer and rural districts with
greater busing and special education needs over the wealthy ones on a per capita basis. Finally,
the other major portions of the budget--state payroll, state operations, four year universities
and community colleges—also favor downstate Illinois. Nine of the state’s twelve public
universities, virtually all state prisons and parks, and the state agency headquarters in
Springfield are downstate.
25
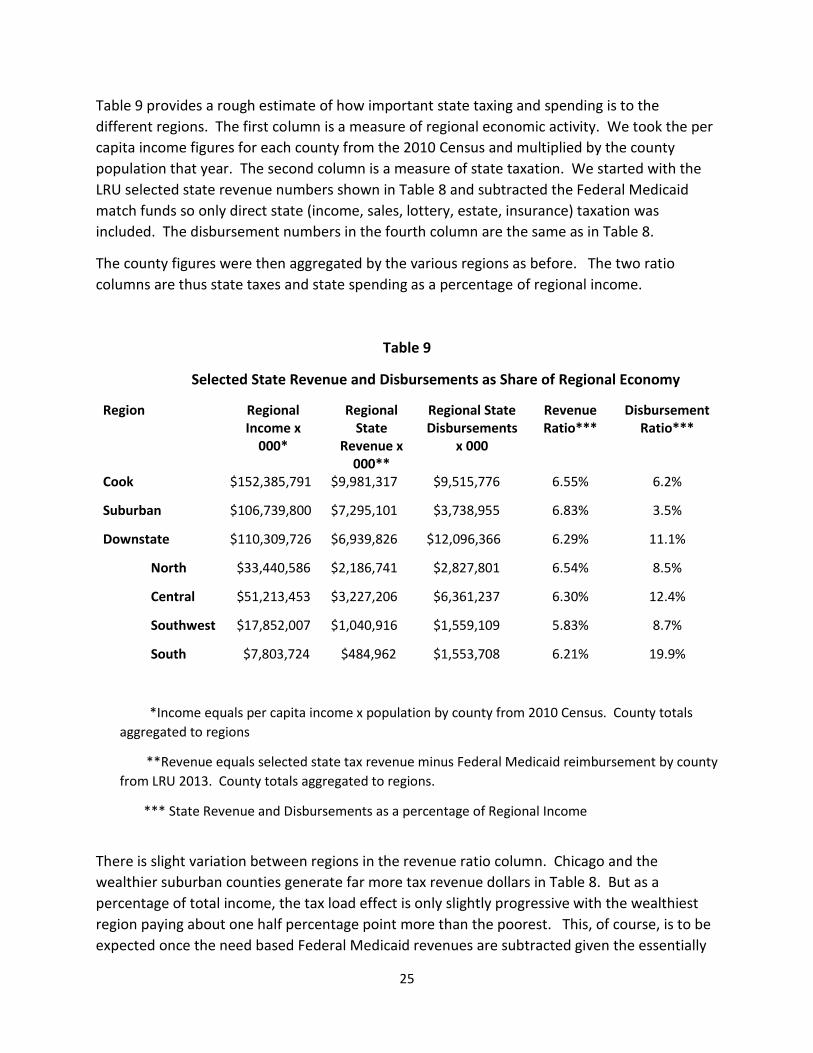
Table 9 provides a rough estimate of how important state taxing and spending is to the
different regions. The first column is a measure of regional economic activity. We took the per
capita income figures for each county from the 2010 Census and multiplied by the county
population that year. The second column is a measure of state taxation. We started with the
LRU selected state revenue numbers shown in Table 8 and subtracted the Federal Medicaid
match funds so only direct state (income, sales, lottery, estate, insurance) taxation was
included. The disbursement numbers in the fourth column are the same as in Table 8.
The county figures were then aggregated by the various regions as before. The two ratio
columns are thus state taxes and state spending as a percentage of regional income.
Table 9
Selected State Revenue and Disbursements as Share of Regional Economy
Region Regional Income x
000*
Regional State
Revenue x 000**
Regional State Disbursements
x 000
Revenue Ratio***
Disbursement Ratio***
Cook $152,385,791 $9,981,317 $9,515,776 6.55% 6.2%
Suburban $106,739,800 $7,295,101 $3,738,955 6.83% 3.5%
Downstate $110,309,726 $6,939,826 $12,096,366 6.29% 11.1%
North $33,440,586 $2,186,741 $2,827,801 6.54% 8.5%
Central $51,213,453 $3,227,206 $6,361,237 6.30% 12.4%
Southwest $17,852,007 $1,040,916 $1,559,109 5.83% 8.7%
South $7,803,724 $484,962 $1,553,708 6.21% 19.9%
*Income equals per capita income x population by county from 2010 Census. County totals
aggregated to regions
**Revenue equals selected state tax revenue minus Federal Medicaid reimbursement by county
from LRU 2013. County totals aggregated to regions.
*** State Revenue and Disbursements as a percentage of Regional Income
There is slight variation between regions in the revenue ratio column. Chicago and the
wealthier suburban counties generate far more tax revenue dollars in Table 8. But as a
percentage of total income, the tax load effect is only slightly progressive with the wealthiest
region paying about one half percentage point more than the poorest. This, of course, is to be
expected once the need based Federal Medicaid revenues are subtracted given the essentially
26
flat rate taxes used in Illinois. The slightly progressive differences which do appear are likely
the result of exempting the first $2150 per person and all retirement income (Social Security,
pensions, 401k etc.) from the 5% state income tax. This effectively lowers the rate on regions
with significant near poverty level populations or large concentrations of retirees. Food and
prescriptions are subject to a 1% sales tax rate while other purchases have a 6% sales tax.1 This
too somewhat lowers the tax load on lower income groups which tend to spend more of total
income on these essentials.
There is significantly more variation in the disbursement ratio column which shows state
expenditures as a percentage of total regional income. In the wealthiest suburban five
counties, the selected state spending is a very modest 3.5% of total regional income. In urban
Cook County the state accounts for almost twice that level of economic activity at 6.2% of total
income. This is slightly less than the 6.5% of income going to state tax revenue.
But the largest impact of state spending in relation to other economic activity is downstate.
State spending is equivalent to 11.1% of total income across this 96 county region. But this
average hides much larger variations across the sub regions. The 18 county North region is not
too far from Cook County with state expenditures at 8.5% of income. The Central region is
significantly higher at 12.4% of regional income. And in the Southern 19 counties—clearly the
poorest part of the state—state expenditures are equivalent to 19.9% of total income.
Residing in Jackson County, one of the southern 19, we can easily see the importance of state
expenditures in the local economy. The largest regional employer is Southern Illinois University
at Carbondale. A small state penal facility has recently re-opened in Murphysboro and
significant numbers of employees of state prison and mental health facilities located in
neighboring counties reside in Jackson County. Southern Illinois Healthcare is the largest non-
governmental employer, but significant portions of its revenue come from state employee
health insurance and Medicaid. The next largest employers include the City of Carbondale
which receives Local Government Distribution Funds and several school districts which receive
the mix of K-12 and mandated categorical funding. Without these state expenditures and the
multiplier effect created as they pass through private businesses, which supply state
institutions and cater to state employees, there might be very little county economic activity at
all in deep southern Illinois.
These findings may help explain the broader question posed earlier of why there is significant
rural resentment and some urban resentment in Illinois politics, but less suburban resentment.
In the context of the broader economy, the regions which are doing least well, show the highest
resentment levels while the better offs show the lowest. But blaming state government for the
perceived inequities is somewhat mistaken. True, the poorer regions are carrying almost the
1 County and municipal governments are allowed to add additional sales tax to the base 6% state rate. Five percentage points of the base sales tax goes to the state with 1.25 percentage points returned to local government. The slightly lower 5.8% tax load for the 9 county Southwest region may be the result of significant sales taxable purchases on the Missouri side of the Mississippi River.
27
same relative tax burden as the better offs. So, if one believes in progressive taxation based
upon ability to pay, there is much to dislike, or resent in the Illinois tax system. On the other
hand, the lower income regions of Illinois as a whole are receiving significantly more in state
expenditures than they contribute in taxes. Indeed in the most southern region, there would
be very little economic activity at all without the state.
Conclusion
This assertion that perception is more important than the facts is a fundamental axiom of
politics that does not bode especially well for mass democracy. Facts should count for
something, indeed for a lot, and are essential to any form of rational decision-making. Rational
action at both the individual voter level and the aggregate public opinion level is crucially
important in a democracy. The operation of a successful mass democracy depends in the long
run on the people being well informed and acting according to reality rather than perception
and myth.
The founders of the republic and the writers of the U. S. Constitution understood that
requirement well and enshrined in the First Amendment as the most important freedoms, what
the Supreme Court calls “the preferred freedoms” including Freedom of the Press, Freedom of
Speech, Freedom of Religion, the Freedom of Assembly and the Right to Petition the
government.
That is why we share with the founders the conviction that it is important for political leaders to
get the facts and make decisions based on the best information available in order to make
policy based on the facts and the evidence. The same requirements are no less important for
the people as they make their decisions in the voting booths every two years in each of their
states and nationally for president and for the composition of the Congress and who controls
the executive branch every two and four years. These requirements for a fact based discourse
are crucial to the mass media as they are the key channels of political information for the
public. The conflict over what are facts, and what is “fake news” has become a flash-point for
anger and conflict in our polarized nation recently.
We hope this paper contributes in some part to establishing what the facts are about the
raising and distribution of scarce resources in Illinois, what the people’s perceptions are, and
what are the gaps between those two important ingredients of mass and representative
democracy in America today.

28
Bibliography
Badger, Emily, May 27, 2018. “Urban-Rural-Divide Exposes Similarities”. New York Times, 23-A
Bishop, Bill. 2008. The Big Sort: Why the Clustering of Like-Minded America is Tearing Us Apart.
New York, N. Y.: Houghton-Mifflin Harcourt.
Bosman, Julie and Monica Davey. July 6, 2017. “Illinois Lawmakers Override Budget Veto,
Ending Two-Year Stalemate. https://mobile.nytimes.com/2017/07/06/us/illinois-budget -
shutdown.
Cramer, Katherine. 2016. The Politics of Resentment: Rural Consciousness in Wisconsin and the
Rise of Scott Walker. Chicago: The University of Chicago Press.
Economist. 2017. “The Yacht Primary. The Rise of Rich Governors. October 21st. 32.
Florida, Richard. November 29, 2016. “How America’s Metro Areas Voted”. City Lab.
http://www.citylab.com/politics/2016/11/how-americas-metro-areas-voted.
Fox, Justin. November 13, 2017. “America’s Hate-Hate Relationship with the Taxman”.
Bloomberg Business Week. 62-67.
Free, Lloyd, and Hadley Cantril. 1967. “The Political Beliefs of Americans. In David Apter, ed.
Ideology and Discontent. New York: The Free Press. 206-261.
Gelman, Andrew. 2008. Red State, Blue State, Rich State, Poor State: Why Americans Vote the
Way They Do. Princeton, N. J.: Princeton University Press.
Griffin, Jake. 2017. “Spending per student ranges from $8,500 to $32,000 in suburbs”. Daily
Herald. August 2. http://www.dailyherald.com/news/20170419/spending
Heatherington, Marc. 2001. “Resurgent Mass Partisanship: The Role of Elite Polarization”.
American Political Science Review. 95. (3). 619-631.
Hinz, Greg. July 5, 2017. “Inside Illinois’ new Budget and tax plan”. http;//chicagobusiness.com/
article/201770705/BLOGS02/17079
Illinois Economic Policy Institute. August 21, 2015. “A ‘Donor State’ in Crisis: Illinois’ Federal
Problem”. Illinois Economic Policy Institute.
Jackson, John S., Charles W. Leonard, and Shiloh L. Deitz. 2016. “The Climate of Opinion in
Illinois 2008-2016: The Roots of Gridlock”. The Simon Review. Paper #47. June. Carbondale,
Illinois: The Paul Simon Public Policy Institute. Southern Illinois University.
Jackson, John S. 2015. “The 2014 Illinois Governor Race: Quinn vs. Rauner. The Simon Review.
Paper #40. January. Carbondale, Illinois: The Paul Simon Public Policy Institute. Southern Illinois
University.

29
Jackson, John S. and Charles W. Leonard. 2014. “The Climate of Opinion in Illinois 2010-2014.
The Simon Review. Paper #37. June. Carbondale, Illinois: The Paul Simon Public Policy Institute.
Jackson, John S. 2013. “President Obama’s Victories in Illinois: 2012 Compared to 2008”. The
Simon Review. Paper #34. February. Carbondale, Illinois: The Paul Simon Public Policy Institute.
Southern Illinois University.
Jackson, John S. 2011. “The 2010 Elections: Illinois Still Blue Despite the Red Wave that Swept
the Nation”. The Simon Review. Paper #23. January. Carbondale, Illinois: The Paul Simon Public
Policy Institute. Southern Illinois University.
Jackson, John S. and Paul Gottemoller. 2007. “Party Competition in Illinois”. An Occasional
Paper of the Paul Simon Public Policy Institute. Carbondale, Illinois: Southern Illinois University.
Jackson, John S. 2004. “Illinois Politics in the 21st Century: Bellwether, Leading Edge, or Lagging
Indicator?” An Occasional Paper of the Paul Simon Public Policy Institute. Carbondale, Illinois:
Southern Illinois University.
Kiernnan, John S. 2014. “States Most and Least Dependent on the Federal Government”.
WalletHub. http://wallethub.com/edu/states-most-least-dependent-on-the-federal-
government
Leonard, Marnie. 2017. Governor Rauner’s Turnaround Agenda from a Comparative State Policy
Context”. The Simon Review. Paper #50. May. Carbondale, Illinois: The Paul Simon Public Policy
Institute. Southern Illinois University.
Lucaino, Phil. March 12, 2018. “What if Downstate dumped Chicago and formed a new state?”
The State Journal-Register. Springfield, Illinois.
Legislative Research Unit. 1989. “Taxes and Distributions by Region of the State”. Research
Response Report. Springfield, Illinois. Illinois General Assembly.
Legislative Research Unit. 2017. “Taxes and Distribution by Region of the State“. Research
Response Report. Springfield, Illinois. Illinois General Assembly.
Levendusky, Matthew. 2009. The Partisan Sort. Chicago: The University of Chicago Press.
McClelland, Edward. November 15, 2017. “Downstate hate: A history of the bitter, nearly 200-
year rivalry between Chicago and the rest of Illinois” The Chicago Reader.
https://www.chicagoreader.com/chicago/downstate-illinois-secession-history. Accessed, July 2,
2018.
Miller, Rich. June 4, 2018. “A Much-needed return of stability”. Capitol Fax.
https://capitolfax.com/2018/06/04/. 1.
O’Connor, John. 2017. “Illinois borrows $6.5B at reduced interest to pay down debt”.
Springfield Journal Register. October 19. http:www.sj/r.com/news/20171017.illinois.

30
Pitkin, Hannah F. 1987. The Concept of Representation. University of California Press.
Portman, Carol. January 2018. “Is the CPPRT an Income Tax?” Illinois Municipal League Review
20. See also Michael D. Klemens, “Illinois’ CPPRT: The Challenge of ‘Replacing’ a Tax, 10-14 in
the same issue.
White, Jesse. 2015. Handbook of Illinois Government. Springfield: Office of the Secretary of
State.
White, Jesse. 2013-2014. The Illinois Blue Book. Springfield: Office of the Secretary of State.
Yaccion, Steven. 2014. “Governor Wants to Keep Tax Increase, Setting Terms for Re-Election in
Illinois”. New York Times. March 27, A 23.

Cook
LakeMcHenry
Boon
e
WinnebagoStephensonJo Daviess
DuPageKaneDekalb
Kendall
Rock IslandGrundy
OgleCarroll
Whiteside Lee
Mercer
Henry Bureau LaSalle Will
Kankakee
Livingston
StarkH
ende
rson
Marshall
Putnam
Peoria Woodford
KnoxWarren
Iroquois
Ford
HancockMcDonough Fulton Tazewell McLean
VermilionSchuyler
AdamsBrown Cass
MenardLogan
De Witt
Morgan Sangamon
Pike Scott
Greene
Jersey
MaconPiatt
Champaign
Mason
Calhoun
Macoupin Montgomery
Shelby
Moultrie
DouglasEdgar
Coles
Clark
MadisonBond
Fayette
Clay
Cumberland
Jasper Crawford
St. Clair
Monroe
Christian
E�ngham
RichlandLawrence
Randolph Perry
Washington
ClintonMarion
Edw
ards
Wab
ash
Je�erson
FranklinHamilton White
JacksonWilliamson
Saline
Union
Gallatin
Johnson
Pulaski Massac
PopeHardin
Wayne
Alexander
Illinois Regions: Ratio of State Funds Received Compared to Revenues Generated
Appendix A
REGION
COOK
NORTH
CENTRAL
SOUTHWEST
SOUTH
SUBURBAN
# OF COUNTIES
1
18
50
9
19
5
ADJUSTEDRATIO
.90
1.24
1.87
1.42
2.81
.53