Embed Size (px)
Citation preview

CENTRE FOR THE STUDY OF AFRICAN ECONOMIESDepartment of Economics . University of Oxford . Manor Road Building . Oxford OX1 3UQT: +44 (0)1865 271084 . F: +44 (0)1865 281447 . E: [email protected] . W: www.csae.ox.ac.uk
Reseach funded by the ESRC, DfID, UNIDO and the World Bank
Centre for the Study of African EconomiesDepartment of Economics . University of Oxford . Manor Road Building . Oxford OX1 3UQT: +44 (0)1865 271084 . F: +44 (0)1865 281447 . E: [email protected] . W: www.csae.ox.ac.uk
CSAE Working Paper WPS/2016-27The Politics of Partial Liberalization: Cronyism and
Non-Tari� Protection in Mubarak's Egypt
Ferdinand Eibl
King's College London
Adeel Malik
University of Oxford
Abstract
This paper provides one of the �rst systematic empirical assessments of the im-
pact of political connections on trade protection. Based on a unique compilation of
sector-level data on non-tari� measures (NTMs) and politically connected businessmen
in Mubarak-era Egypt, we explore the within-sector variation in NTMs over time, and
show that sectors populated by politically connected businessmen witnessed systemat-
ically higher incidence and density of non-tari� protection. Our results suggest that
the presence of cronies is a strong predictor of the subsequent introduction of NTMs.
Crony presence also shapes the density of NTMs as measured by the share of products
subject to NTMs. Our results are derived from robust empirical methods that sim-
ultaneously address temporal dependence, �xed e�ects and endogeneity concerns. To
establish causality, we take advantage of the across the board cut in tari�s in the wake of
the EU-Egypt free trade agreement in 2004-05 to show that sectors with crony activity
were compensated signi�cantly more by new NTMs than non-crony sectors.
JEL codes : F13; F14; O24; O53; P26

1 Introduction
During the 2000s, Egypt underwent a period of rapid economic liberalization characterized
by, amongst others, a considerable fall in the country's trade tari�s. Yet, as shown in Figure
1, trade liberalization was partial in a two-fold sense: on the one hand, falling average
tari�s gave rise to a noticeable increase of non-tari� measures (NTMs) across the Egyptian
economy; on the other hand, this increase a�ected sectors unequally with some seeing their
level of non-tari� protection heightened more than others as the rising standard deviation
of NTM protection across sectors demonstrates. This paper identi�es politically connected
entrepreneurs as a major driving force behind this partial liberalization.
Figure 1: Evolution of Trade Protection in Egypt, 1997-2010
To do so, we make use of the recently available WITS database (World Bank, 2013)
which provides extensive information on the nature and the introduction of NTMs over time
and across sectors. We combine these data with an original dataset on crony capitalists in
the late-Mubarak period, allowing us to identify the entry of cronies into speci�c sectors.
We focus our analysis on Egypt for two reasons. First, the Egyptian uprising in 2011 and
the ensuing uncovering of the entrenched networks linking business elites and the state has
enabled us to collect data on cronies at a hitherto unprecedented level of detail, allowing
for variation across sectors and across time. Second, in 2004 Egypt concluded a free trade
agreement with the European Union which entailed an nearly universal cut of tari�s across
Egyptian manufacturing sectors. We capitalise on this shock to assess the extent to which
cronies were better able to lobby for compensatory measures in the form of NTMs.
2

Exploring the within-sector variation of NTMs over time, we �rst use conditional logit and
GMM models to demonstrate that sectors which transition from being non-crony to crony in
period t are systematically associated with higher incidence and intensity of NTMs in t+1.
More speci�cally, we show that, as cronies enter a sector for the �rst time, the likelihood of
a subsequent NTM introduction increases signi�cantly. In addition, our results also reveal
that the number of products subject to an NTM, that is, the intensity of NTM protection,
increases signi�cantly as cronies venture into a new sector. While we control for unit and
time �xed e�ects and ensure that crony entry temporally precedes the introduction of an
NTM, these results cannot be interpreted as conclusive evidence for a causal link between
crony presence and non-tari� trade protection. Cronies could have insider knowledge and
enter a sector in anticipation of an assured NTM introduction; alternatively, there could be
uncontrolled confounders positively correlated with both crony entry and the propensity for
NTM protection.
To establish causality, the paper utilises a di�erence-in-di�erence approach, leveraging the
across the board cut in tari�s in the wake of the EU-Egypt free trade agreement in 2004-05,
which was accompanied by the introduction of a vast number of new NTMs in 2005. More
speci�cally, we show that all sectors which by 1998 � six years prior to the conclusion of the
trade agreement � had been populated by cronies witnessed a signi�cantly higher rise in NTM
protection in response to the trade agreement than non-crony sectors. Treating only sectors
with early crony presence as `crony' alleviates concerns that these businessmen selected into
sectors knowing that an NTM protection would follow. Moreover, the nearly universal cut
in tari�s in the wake of the agreement allows us to use the conclusion of the agreement as
an exogenous shock which it was di�cult to select out of.
To fully rule out remaining concerns of endogeneity, we also instrument for the presence
of cronies by 1998 with two exogenous predictors: the share of other cronies in neighbouring
sectors, and crony sectors in the Tunisian economy. Regarding the former, we argue that
this measure is a valid instrument as cronies will seek to avoid sectoral neighbourhoods that
are already densely populated by cronies as this would decrease the amount of rent they can
extract from this sector. Regarding the latter, we argue that the nature of crony capitalism
in North Africa is such that cronies will enter similar sectors, that is, sectors with higher
barriers to entry as a result of licensing and other legal barriers. The results obtained from
this identi�cation strategy are consistent with the initial correlation between crony entry and
NTM protection in the data: compensation through NTMs was signi�cantly higher in crony
sectors than in non-crony sectors following the trade agreement. These results are robust to
di�erent measurements of crony activity as well as initial sectoral characteristics, sector and
3

time �xed e�ects, and sectoral time trends.
This paper speaks to a number of di�erent literatures. It, �rst, signi�cantly enhances
our understanding of the politics of trade protection through non-tari� barriers. While the
signi�cant rise of NTMs in both the developed and developing world has been recognized
(Hoekman and Nicita, 2011; Kee, Nicita and Olarreaga, 2006; Grilli, 1988), the literature
on the determinants of NTMs has almost uniquely focussed on Western economies (Ray,
1981b,a; Ray and Marvel, 1984; Esfahani, 2005; Gawande and Bandyopadhyay, 2000; Azrak
and Wynne, 1995; Tre�er, 1993). Lee and Swagel (1997) include developing countries in their
analysis but only consider cross-country variation, just like Esfahani and Squire's (2007)
analysis of Middle Eastern countries. Grether et al.'s (2001) study of Mexico and Ancharaz'
(2003) study of sub-Saharan Africa only look at tari�s. Furthermore, most existing studies
of endogenous trade protection necessitate a democratic political context for the theoretical
mechanisms to play out (Caves, 1976; Hillman, 1982; Bauer, de Sola Pool and Dexter, 1972;
Coughlin, 1985; Blonigen and Figlio, 1998; Magee, Brock and Young, 1989); the most promin-
ent mechanism being campaign contributions (see, for instance, Lopez and Pagoulatos, 1996).
A notable exception is Pack's (1994) study of Indonesian trade protection. However, he �nds
little evidence for political lobbying, claiming that political explanations of trade protection
`have a more tenuous base in authoritarian developing countries' (Pack, 1994, 450). Our
�ndings strongly qualify this claim.
Second, the paper contributes to the literature on cronyism and the e�ect of political con-
nections. Recent empirical work on crony capitalists has made great strides by highlighting
the e�ect of political connections on �rm value and performance (Ferguson and Voth, 2008;
Fisman, 2001; Faccio, 2006; Claessens, Feijen and Laeven, 2008; Fan, Wong and Zhang, 2007;
Goldman, Rocholl and So, 2009; Li et al., 2008); leverage (Boubakri, Cosset and Sa�ar, 2008);
access to loans (Khwaja and Mian, 2005); and the likelihood of a bail-out (Faccio, Masulis
and McConnell, 2006). Yet while all these studies have analysed the e�ect of preferential
treatment on crony companies, there is little empirical research on whether and how cronies
can leverage their connections to shift policies in their favour. By demonstrating the e�ect of
cronies on trade protection, this article thus considerably expands the literature on cronyism
to incorporate its wider policy relevance.
Third, the paper contributes to broader debates about the political economy of reform,
and rents and political order. Selective liberalization has been a pervasive feature of IMF and
WB sponsored initiatives for economic reform. Van der Walle (2001) terms it as the `partial
reform syndrome'. This paper provides a concrete illustration in the arena of trade policy
and uncovers in empirical detail the political underpinnings as well as the losers and winners
4

of partial economic reform. In essence, it shows how, in the wake of liberalization, one mode
of protection was simply replaced by another. Partial reforms are also key to understand how
authoritarian political orders are reproduced by the creation of new rent streams. Tradition-
ally, rents have been linked with state intervention in the economy (Krueger, 1974; Bhagwati,
1982). But, as this paper demonstrates, rents can also be generated from economic liberaliz-
ation during which the bene�ts and losses are distributed selectively across di�erent sectors
of the economy (King, 2003; Malik, 2015). This pattern of rent generation is particularly
important for MENA economies that derive relatively few rents from natural resources but
have extensive distributional commitments (the labour-abundant types). For these regimes,
such regulatory rents are central for sustaining an authoritarian political order and they serve
as an important commitment device between economic elites and the regime.
The paper is structured as follows: Section 2 provides descriptive background on the
forms of NTMs and the nature of cronyism in late-Mubarak Egypt. Section 3 introduces our
data. Section 4 presents our results, and Section 5 concludes with a few thoughts on the
broader implications of our �ndings.
2 Background: Cronyism and NTMs in Egypt
2.1 Cronyism in Egypt
The rise of Egyptian crony capitalists in the late Mubarak era was intimately linked to Gamal
Mubarak's ascendency in the regime's ruling party, NDP. Instrumental in his rise to power
was his alliance with Egypt's aspiring business elite, which had succeeded in accumulating
unprecedented economic resources, but were still not part of regime's inner ruling circle.
Willing to build his own power base, the trained investment banker therefore began to reach
out to private sector actors as soon as he returned from London in 1996. As head of the
in�uential US-Egypt Business Council and board member of the newly founded Egyptian
Center for Economic Studies (ECES) � a market-liberal think-tank � he nurtured numerous
contacts into the business world and managed to form a coalition favourable to more far-
reaching economic reforms (Abdel-Latif and Schmitz, 2010).
Having become the NDP's secretary general in 2000, he set out to rejuvenate the leader-
ship of the ruling party by bringing in members of the new business elite, whom he gathered
in the new Political Secretariat established in 2002. Pressuring for a resumption of economic
reforms, it was this forum that paved the way for the appointment of a new, ostensibly pro-
business cabinet under Prime Minister Nazif in 2004. The new government not only forcefully
5

relaunched economic reforms, such as privatisation, capital, and trade liberalisation, but also
brought a number of Gamal's business friends into ministerial positions.
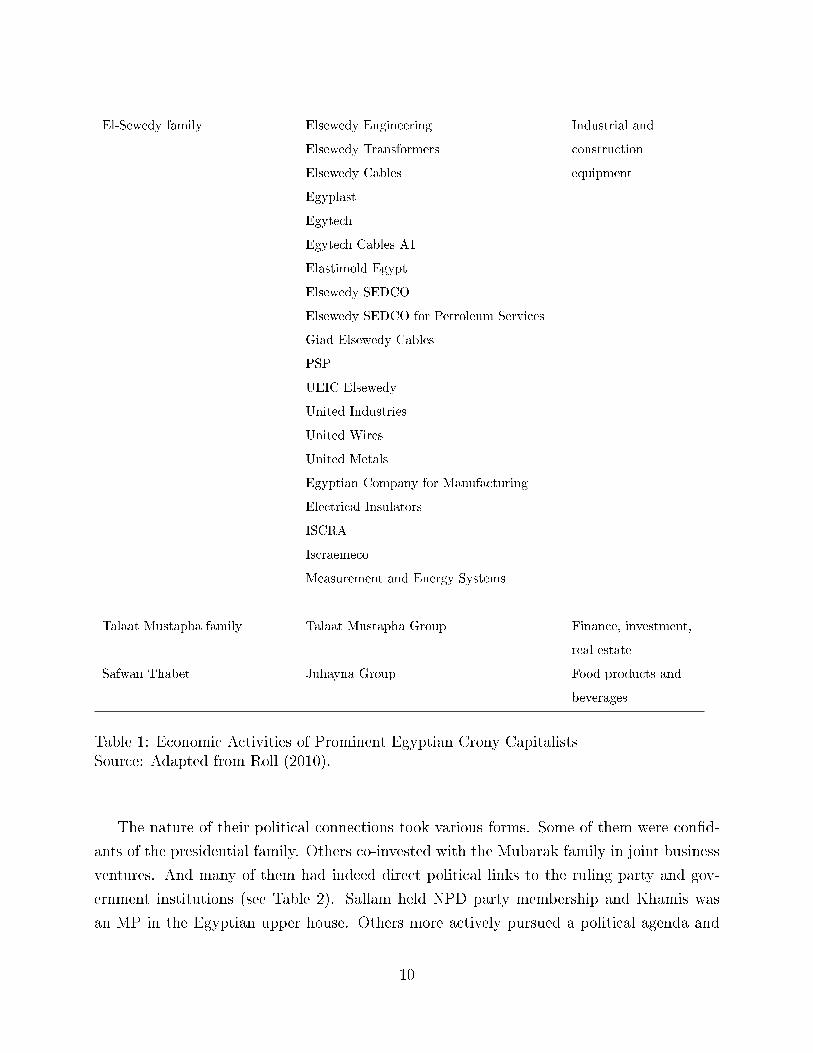
Table 1 gives an overview of the economic activities of the most prominent crony capitalists
in the late Mubarak era. They have been active in both the service and the manufacturing
sector, with an increasing importance of service activities, such as telecommunication or real
estate investment, since the early 2000s. Wherever they have been active in manufacturing,
they have tended to play a preponderant role on the market. The most notorious example of
market domination is Ahmed Ezz, whose Ezz Steel Mills came to dominate the Egyptian steel
market. Bene�ting from family connections into the army, Ezz had become the country's
biggest steel producer by the late 1990s. Controlling 65-75 per cent of the Egyptian market
(Chekir and Diwan, 2013), Ezz's market share was seven times higher than the share of
his strongest competitor (Selim, 2006). Although his anti-competitive behaviour was widely
known and even became the matter of a public report, no anti-trust procedure was instituted
against him. Another example is Safwan Thabet's Juhayna Group, one of Egypt's largest
producers of juices and dairy products. Found guilty of monopolistic practices, the company
settled its case by paying a �ne in 2013. In the sector of soap and detergent's, Ibrahim
Kamel's Kato Group dominates the market, supplying half of the country's hotels with his
products.
Thanks to their abundant cash reserves, many of Egypt's oligarchs also expanded into the
country's booming service sector. For instance, Naguib Sawiris, one of three Sawiris brothers
active in the family's business empire, launched Egypt's �rst mobile operator, Mobinil, in
1998. In 2007, he sought to acquire the public Banque du Caire, which was o�ered for
privatisation. This attempt to gain a foothold in the Egyptian banking sector only failed
because of political intervention. Another mainstay of the core elite's business activities is
the lucrative import of luxury consumption goods. Holding exclusive franchising licences of
international car manufacturers, such as General Motors, Volvo, or Mitsubishi, the Nosseir,
Ghabbour, Mansour, and Mahmoud family have reaped enormous bene�ts from the growing
demand of Egypt's middle and upper classes.
Actor Company Sector
Arafa family Arafa Holding Textiles
Hamed El-Chiaty Travco Group Holding Tourism
Diab family Pico Group Food products and
beverages
6

Pico Engineering Industrial and
construction
equipment
Pico International Petroleum
Pico Energy Group
Mining and natural
resources
Mohammed Abu El-Enein Cleopatra Group Food products and
beverages
Household equipment
Industrial and
construction
equipment
Mining and natural
resources
Ahmed Ezz Ezz Group Holding for Industry and
Investment
Industrial and
construction
equipment
Finance, investment,
real estate
Sha�k Gabr Artoc Auto
Artoc Auto Free Zone
Automobile sector
Artoc Petroleum Mining and natural
resources
Alpha Metal Industrial and
construction
equipment
Ghabbour family Ghabbour Group Automobile sector
Ibrahim Kamel Kato for Agricultural Development
National Food Company
Giza National Dehydration
Giza Seeds and Herbs
Food products and
beverages
Kato Aromatic
The Modern Factory for Manufacturing
Soap and Detergent
Chemical and
pharmaceutical
industry
Kato Construction Finance, investment,
real estate
7

El-Maghraby family Maghraby Agriculture Food products and
beverages
Other agricultural
products
Maghraby Optical Optical lenses
Mansour & Maghraby Investment and
Development
Finance, investment,
real estate
Maghriby Hospitals
Maghraby Foundation
Health services
Mohammed Khamis Oriental Weavers Textiles
Mahmoud family Mohamed Mahmoud Sons Group Automobile sector
Industrial and
construction
equipment
Leather products
Mansour family Mansour Group Automobile sector
Cigarettes, cosmetics
Food products and
beverages
Household equipment
Entertainment and
IT
Industrial and
construction
equipment
Retail
Tourism
Mansour & Maghraby Investment and
Development
Finance, investment,
real estate
Mohammed Nosseir Alkan Holdings Automobile sector
8

Textiles
Medical products
Tourism
Finance, investment,
real estate
Rachid family Rachid Group Retail
Hussein Salem Meridor Plant for Gas Distillation
East Mediterranean for Gas
Mining and natural
resources
Sallam Family Olympic Group Household equipment
Sawiris family Egyptian Fertiliser Company
Egypt Basic Industry Cooperation
OCI Nitrogen
OCI Beaumont
Sorfert Algerie
Gavilon
Chemical and
pharmaceutical
industry
Orascom Construction Industries Finance, investment,
real estate
Industrial and
construction
equipment
Orascom Telecom (Mobinil) Telecommunication
Orascom Hotels and Development Tourism
9
El-Sewedy family Elsewedy Engineering
Elsewedy Transformers
Elsewedy Cables
Egyplast
Egytech
Egytech Cables A1
Elastimold Egypt
Elsewedy SEDCO
Elsewedy SEDCO for Petroleum Services
Giad-Elsewedy Cables
PSP
UEIC Elsewedy
United Industries
United Wires
United Metals
Egyptian Company for Manufacturing
Electrical Insulators
ISCRA
Iscraemeco
Measurement and Energy Systems
Industrial and
construction
equipment
Talaat Mustapha family Talaat Mustapha Group Finance, investment,
real estate
Safwan Thabet Juhayna Group Food products and
beverages
Table 1: Economic Activities of Prominent Egyptian Crony CapitalistsSource: Adapted from Roll (2010).
The nature of their political connections took various forms. Some of them were con�d-
ants of the presidential family. Others co-invested with the Mubarak family in joint business
ventures. And many of them had indeed direct political links to the ruling party and gov-
ernment institutions (see Table 2). Sallam held NPD party membership and Khamis was
an MP in the Egyptian upper house. Others more actively pursued a political agenda and
10
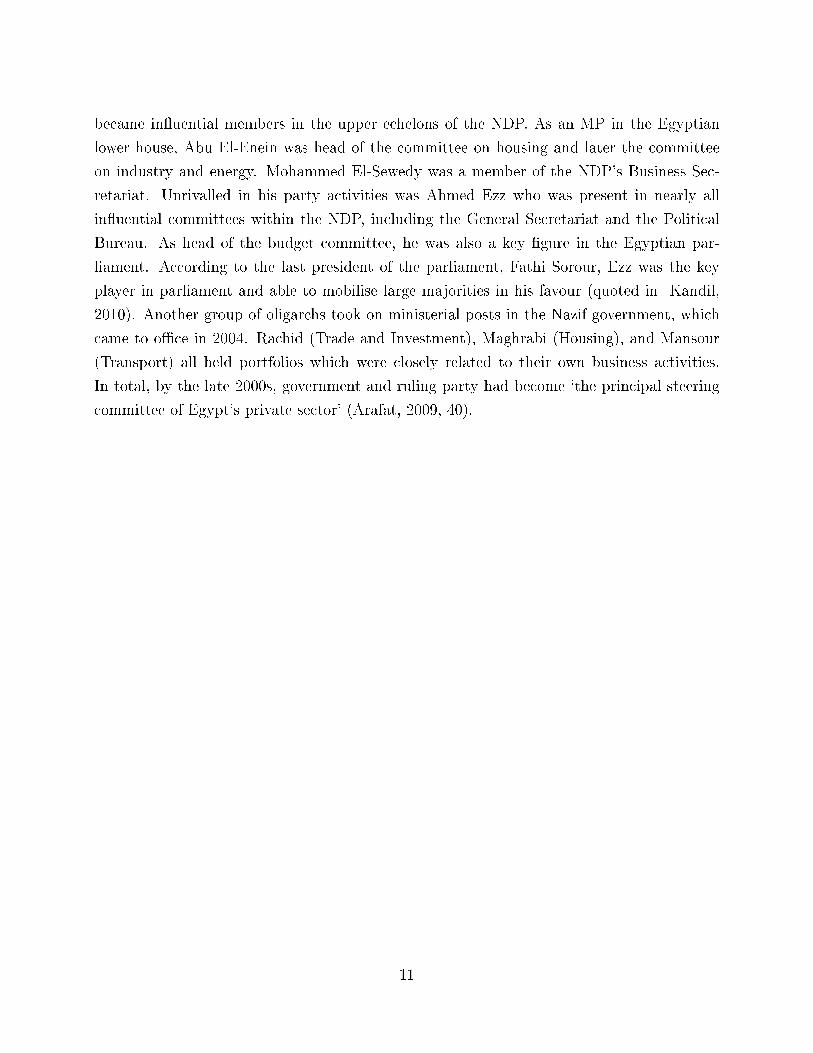
became in�uential members in the upper echelons of the NDP. As an MP in the Egyptian
lower house, Abu El-Enein was head of the committee on housing and later the committee
on industry and energy. Mohammed El-Sewedy was a member of the NDP's Business Sec-
retariat. Unrivalled in his party activities was Ahmed Ezz who was present in nearly all
in�uential committees within the NDP, including the General Secretariat and the Political
Bureau. As head of the budget committee, he was also a key �gure in the Egyptian par-
liament. According to the last president of the parliament, Fathi Sorour, Ezz was the key
player in parliament and able to mobilise large majorities in his favour (quoted in Kandil,
2010). Another group of oligarchs took on ministerial posts in the Nazif government, which
came to o�ce in 2004. Rachid (Trade and Investment), Maghrabi (Housing), and Mansour
(Transport) all held portfolios which were closely related to their own business activities.
In total, by the late 2000s, government and ruling party had become `the principal steering
committee of Egypt's private sector' (Arafat, 2009, 40).
11

Actor Political Connection
Hamed El-Chiaty Member of the High Council of Tourism
Mohammed Abu El-Enein MP: Chairman of Housing Committee (2000-5), Industry and
Energy Committee (2005-10)
Ahmed Ezz MP: Chairman of Planning and Budget Committee (2000-10)
NDP: Secretary for Organisational A�airs, member of General
Secretariat and Political Bureau
Sha�k Gabr NDP: Member of Political Secretariat
Ghabbour family Family contacts to Mubarak family
Ibrahim Kamel NDP: Member of General Secretariat
El-Maghraby family Minister of Tourism (2004-5) and Housing (2005-11)
NDP: Member of Business Secretariat
Mohammed Khamis MP
Mansour family Minister of Transport (2004-11)
Rachid family Minister of Industry (2004-11)
NDP: Member of General and Political Secretariat
Hussein Salem Family contacts to Mubarak family
Sallam Family NDP: Member
Member of National Youth Council
Sawiris family NDP: Member of Business Secretariat
Head of Industrial Training Council
El-Sewedy family NDP: Member of Business Secretariat
Talaat Mustapha family MP: Head of Housing Committee
Safwan Thabet Family contacts to Mubarak family
Table 2: Political Connections of Prominent Egyptian Crony CapitalistsSource: Alissa (2007); Demmelhuber and Roll (2007); Roll (2010, 2013).
2.2 NTMs in Egypt
With multilateral trade liberalization leading to a generalized decline in tari� barriers, non-
tari� measures, commonly known as NTMs, have attained growing prominence in developing
economies, including the Middle East (Chau�our, 2011; Augier et al., 2012). Unlike tari�
barriers, however, the NTMs are not easily quanti�able as they usually consist of complic-
ated legal texts that defy a simple characterization. Yet, they can have a profound impact
on trade performance. NTMs are essentially complicated trade frictions caused by arbitrary
regulations, procedures, and a variety of discretionary controls, which given their opaque
and invisible nature, are both hard to measure and evaluate. With the availability of a more
re�ned and structured classi�cation of NTMs available in the WITS database (World Bank,
12

2013), it is now possible to conduct a more systematic analysis of the form and function of
these trade measures. More speci�cally, this database is unique in that in not only allows us
to distinguish between di�erent types of NTMs applied but, more importantly, when NTMs
were introduced, which adds temporal variation to the data. The new system of classi�cation
divides NTMs into 16 di�erent chapters and assigns them to two main categories, technical
and non-technical measures (the third category consists of export-related measures). Some of
the key NTM categories include: Technical Barriers to Trade (TBT), Sanitary and Phytosan-
itary Measures (SPS), Pre-shipment Inspection (PSI), and Price Control Measures (PCMs).
Egypt is among the top �ve countries globally that have the largest number of products
a�ected by NTMs. Nearly 5,000 di�erent products are a�ected by NTMs. Since the late
1990s, the use of NTMs has increased dramatically and today nearly 60 percent of products
are covered by two or more NTMs (see Figure 2a). The technical barriers to trade (TBTs) are
the most dominant NTM type in Egypt, followed by SPS measures (see Figure 2b). Overall,
more than 60 percent of products are covered by TBTs and a little less than 20 percent of
products are subjected to SPS measures. The three most prevalent TBT categories were
all related to conformity assessments (B84, B859 and B89) that require inspections and
administrative oversight. These are precisely features that can invite discretionary action
and impose additional burden on �rms in dealing with bureaucracy.
(a) Share of products subjected to at least twoNTMs
(b) NTMs by type in Egypt
Figure 2: Evolution and Type of NTMs in Egypt
13

3 Data
To measure the e�ect of political connections on NTMs, we use a novel dataset on crony busi-
nessmen in Egypt. The dataset was compiled in the following manner: First, we delineated
the pool of potential crony entrepreneurs based on Roll's (2010) list of Egypt's �nancial and
economic core elite. This list consists of entrepreneurs whose net assets reached or exceeded
100 million US$ in the late 2000s.1 Using information from the Orbis database (Bureau van
Dijk, 2013), we added to this list all shareholders who had co-invested with these businessmen
or were present in the board or the management of their companies.
In a second step, we assessed the degree to which the entrepreneurs on this extended list
were politically connected. We therefore de�ned three channels of political connections: (a)
connections by virtue of holding a political o�ce, being a member of parliament, or a mem-
ber in a major committee of the former National Democratic Party (NDP) (politicians); (b)
connections established through business relations with the Mubarak family, most notably
Gamal Mubarak (associates); (c) connections resulting from strong personal relationships
with the Mubarak family, mostly through marital links or publicly known friendships (con-
�dants). Based on these di�erent types, we de�ne crony businessmen in a narrow sense as all
those who have known political connections (politicians). Cronies in a broader sense include
associates and con�dants in addition to politicians. For about a quarter of the entrepreneurs
from the initial list, we could not establish any political connection and hence dropped them
from our crony list.
In a third step, we collected information on the economic activity and date of foundation
of all companies in which crony businessmen were either minor or major shareholders or
of which they were CEOs. This information was mostly obtained from Orbis (Bureau van
Dijk, 2013) and occasionally supplemented from additional sources if needed.2 Companies for
which we could not identify the date of establishment were dropped from the list. Activity
information was collected at the four-digit level of the International Standard Industrial
Classi�cation (ISIC, Rev. 3.1).
Based on this time-varying crony information, we derive our main crony variable: crony
presence is a binary dummy and indicates in each year whether cronies are operating in a
sector. Since we are interested in cronyism in the late Mubarak period, we only use crony
entries from 1997 onwards and aggregate all information prior to 1997. This means that
1Whilst it might be a daunting endeavour to measure the net assets of cronies in other developing economies,the rapid development of the Egyptian stock exchange with its concomitant reporting requirements allows arelatively precise estimation of assets.
2These include the companies own websites and other online databases, such as Kompass.
14

some sectors are already populated by cronies at the onset of our analysis. The resulting
variable is time-varying from 1997 until 2011 and measures crony activity at the sector-year
level.3 For our main analysis, we use the broad de�nition of cronies and conduct robustness
tests with a more restrictive crony de�nition in the Online Appendix.
Information on NTMs is taken from the WITS dataset (World Bank, 2013), which doc-
uments NTMs at the six-digit product level and details the date when an NTM was intro-
duced.4 Since all other data are available at the sector level, we aggregate the NTM product
level information at the four-digit sector level and generate a number of indicators to cap-
ture di�erent dimensions of non-tari� trade protection. NTM intro is a dummy variable and
indicates if any NTM is introduced in a speci�c sector-year. Since we do not observe the
withdrawal of NTMs in the period under observation, the variable essentially remains invari-
ant once an NTM has been introduced. In addition to binary measures, we use a number of
more re�ned measures to capture the density as opposed to the presence of NTM protection.
NTM share measures the share of products in a sector subject to NTMs. Similarly, NTM2
share measures the share of products subject to at least two NTMs. Both variables are de-
rived from the product level information in the original WITS data.5 Finally, NTM chapter
designated the average number of chapters applied in a sector.
Regarding control variables, we are limited by the type of time-series data available at
the four-digit sectoral level.6 Using data from WITS (World Bank, 2013), we use three main
control variables: Imports and Exports measure the value of imports and exports respectively
in each sector-year. In addition, we control for the average most-favoured nation tari� (MFN )
applied in a sector. All three variables exhibit a considerable degree of skewness and are
therefore log-transformed. Table 3 provides summary statistics of our data.
3We do have information on economic activity after 2011 but limit our analysis to the period until the downfallof Mubarak. For later periods, we cannot safely assume that political connections persisted in their pre-2011form.
4Note that the the NTM database does not distinguish between the introduction of a new NTM and a majoramendment of an NTM, both of which require a legal decree.
5In the Online Appendix, we run additional tests for individual NTM chapters to assess which type of NTMis more susceptible to political lobbying.
6To address this problem, we are in the process of digitising the Egyptian annual industrial bulletins, whichcontain rich data at the ISIC4 level. Alternatively, we could use UNIDO (2013) industrial statistics whichprovide additional variables, such as the number of employees per sector. However, UNIDO data are onlyavailable in irregular intervals, which would result in a highly unbalanced panel. Given this drawback, wegive preference to the WITS data.
15

Table 3: Summary Statistics
Variable Mean Std. Dev. Min. Max. N
NTM intro 0.07 0.255 0 1 2542NTM new 0.305 1.322 0 15 2535NTM cum 1.381 2.074 0 10.591 2535NTM share 0.336 0.423 0 1 2542NTM2 share 0.33 0.422 0 1 2535NTM chapter 0.552 0.814 0 3.188 2535Crony presence 0.653 0.476 0 1 4480Imports (log) 7.104 1.818 0 12.673 1649Exports (log) 5.095 2.065 2.398 12.391 1556Tari�s (log) 2.46 1.131 0 8.215 2462
4 Empirical Analysis
As the preceding discussion shows, Egyptian economy has been profoundly shaped by two
developments since the late 1990s: the growing presence of politically-connected actors in
business and the introduction of trade liberalization. In this section we empirically examine
whether the two are inter-related. Speci�cally, we are interested in exploring whether there
is a distinct trade dimension to political cronyism. We conduct a number of complimentary
statistical tests to assess the e�ect of cronyism on non-tari� protection from di�erent empir-
ical angles. Broadly speaking, we are interested in two phenomena: the presence (or density)
of NTMs and its relationship with cronyism. Section 4.1 begins the empirical analysis by
presenting some exploratory evidence on the e�ect of prior crony presence on the incidence
and intensity of NTM protection. After ascertaining the robustness of these empirical pat-
terns, we next furnish a more serious attempt at establishing the causal e�ect of cronyism
on NTM protection in section 4.2. To do this, we exploit the variation in NTM introduction
induced by the EU-Egypt trade policy agreement of 2004, which is, by far, Egypt's most
dramatic trade policy shift since independence.
4.1 Exploratory Evidence
Our preliminary empirical analysis is divided into two distinct but inter-related segments.
Firstly, we investigate whether crony activity drives the introduction of NTMs across sectors
and over time. Secondly, our empirical models explore whether the presence of cronies is
systematically associated with the higher prevalence (or density) of NTMs. To answer the
�rst question we estimate a logistic model where the dependent variable captures the binary
16

information on whether or not an NTM was introduced in a particular sector and year.
Our core variable of interest is also a dichotomous indicator, which is coded as one when
a political crony is present in a given sector and year. To address the second question, we
estimate dynamic GMM models that explore variation in the share of products covered by
NTMs (NTM share). In each case, our prime focus remains on determinants of within-sector
variation in the application of NTMs over time. We would like to test whether the prior
presence of cronies determines the subsequent introduction of NTMs.
4.1.1 Conditional logit models
To discern the e�ects of crony presence on NTM introductions,we take cue from the event
history analysis that treats the dependent variable as capturing recurring events, such as the
onset of civil war, introduction of an IMF programme or transition to democracy. Using the
repeated introductions of NTMs as a binary dependent variable and, following Beck, Katz
and Tucker (1998), we estimate conditional logit models that integrate standard discrete
time methods while controlling for �xed e�ects. Combinding the conditional logit model with
approaches developed for events history allows us to treat the underlying data as Binary Time
Series Cross Section (BTSCS), which consist of realizations of zeroes and ones generated by
an underlying latent variable, such that:
y∗st = xs,t−1β + εst
yst = 1 if y∗s,t > 0
yst = 0 , otherwise
where s denotes sector and t, time; ys,t is a binary variable indicating whether or not an
NTM was introduced in a particular sector and year; and xs,t−1is a vector of observed cov-
ariates, including the crony presence indicator. To mitigate potential endogeneity concerns,
all right-hand side variables are lagged by one year.
There are two challenges to estimating such dynamic binary choice models: controlling for
�xed e�ects and duration dependence. Accounting for unobserved sector-speci�c �xed e�ects
in non-linear panel data models is not straightforward, as the standard way of estimating
�xed e�ects can generate the well-known incidental parameters problem. Conditional logit
models try to surmount this by conditioning on �xed e�ects rather than including them in
the model. Conditional logit relies on units (sectors) that experience change in the response
variable over time. We use a variant of this approach that involves conditioning on the
17

actual number of successes in a group (see Beck (2015).7 Another modelling challenge arises
from the possibility of temporal dependence, including the presence of unit roots and serially
correlated errors (Arellano 2003; Browning et al. 2006). Our empirical approach explicitly
models duration dependence, by allowing the possibility that the occurrence of an event
depends both on the number of previous events and the time elapsed since the last occurrence.
This is particularly relevant in our case, since the introduction of new NTMs can depend on
the duration of non-eventful spells (the period during which no new NTM is introduced).
To account for temporal dependence, we use time-spell polynomials that capture the length
of non-events (sequence of zeroes preceding an NTM introduction) (Carter and Signorino,
2010).8 Our models also include the number of previous NTM introductions (Prefail). This
takes on board advice by Beck, Katz and Tucker (1998) to model the underlying hazard of
an event (NTM introduction, in this case).9
The results for our conditional logit analysis are presented in Table 4. The conditional
logit drops all sectors that exhibited no variation during the whole sample period � essentially
sectors that were either subjected to NTMs during the entire period or no NTMs at all. This
leaves us 1125 observations spanning over 75 sectors and 15 years. Although we allow the
sample size to vary across speci�cations depending on availability of data on controls, there
were, on average, 12 observations per group. To allow within-sector correlations in the
errors, we use standard errors that are robust and clustered at the sectoral level. The initial
patterns of results provide strong support to our hypothesis. Column 1 shows that lagged
crony presence is a strong predictor of NTM introductions. Sectors with a prior presence of
cronies are systematically more likely to have an NTM introduced in the subsequent year.
Besides lagged crony presence, our baseline speci�cation includes various spell variables and
a discrete variable capturing the number of previous NTM introductions (Prefail). The
negative and statistically signi�cant coe�cient on Prefail suggests that there is systematically
lower probability of new NTMs being introduced in sectors that have previously experienced
more NTMs. The coe�cients on spell dummies are also statistically signi�cant, providing
strong evidence in favour of duration dependence. Overall, the probability that a spell will
7As Beck (2015) shows this has superior �nite sample properties compared to the conventional �xed e�ectslogit.
8Essentially, the procedure entails construction of a series of temporal dummy variables that measure durationof prior spells of NTM introductions, and a set of time polynomials (splines) to model temporal dependence.We use the `btscs' package in stata to estimate the spell dummies.
9This approach bears close resemblance to the proportional hazard models, where the conditional hazard ofthe event of interest happening may increase or decrease over time. The logit analysis in event history cantherefore be viewed as estimating the yearly hazards of NTMs switching from zero to one. See Beck, Katzand Tucker (1998),Zorn (2000); Carter and Signorino (2010).
18

die varies with the duration for which it lasts.
To ensure that the relationship between cronyism and non-tari� protection that we have
begun to explore is not simply attributable to un-modelled heterogeneity in the data, we
successively add a variety of relevant controls for which data is easily available in columns
(2-4). These include three plausible determinants of trade protection: the levels of imports
(col. 2), exports (col. 3) and average MFN tari�s (col. 4), all lagged by one period. As
with the crony variables, we use the lagged values of these controls. As the results show none
of these variables exerts a statistically signi�cant impact on our dependent variable beyond
the e�ects we have already highlighted. In fact, even when all controls are simultaneously
included in model in column (4), the coe�cient on lagged crony presence remains positive
and statistically signi�cant at 1 percent level. Figure 3 provides a graphical illustration of
the e�ect of crony presence on the probability of NTM introduction. While the average
probability of an NTM introduction in sectors without crony presence lies at 53 percent, the
transition to a crony sector increases this probability to 79 percent on average � an increase
by nearly 50 percent.
Figure 3: Predicted probability of NTM introduction by crony presenceNote: Probabilities based on estimates in column 4, Table 4 .
19

A related line of enquiry is whether crony presence predicts the transition of a sector from
the non-NTM to an NTM world, not just whether an NTM is introduced or not. For this
we rede�ne our dependent variable to capture the �rst-ever introduction of an NTM in a
sector. Although this reduces our sample to 307 four-digit sectors, the results are instructive.
As shown in column 5, lagged crony presence turns up as the strongest predictor, with a
coe�cient that is positive and statistically signi�cant at 1 percent level. As expected, the
prior presence of cronies in a sector make it more likely to switch from a non-NTM sector to
one subjected to an NTM. While the duration dummies become redundant in this context
and are therefore excluded from the model, the cronyism e�ect remains robust to the inclusion
of the other covariates (imports, exports and MFN tari�s). Lagged tari�s turn up as the
only signi�cant control besides crony presence. Overall, the results in Table 4 provide a
strong and consistent evidence in favour of our prior: sectors populated by cronies were
systematically more likely to experience introduction of an NTM in the subsequent period.
In the Online Appendix, we shed additional light on whether cronyism also in�uences the
intensity of protection, as measured by the number of NTMs introduced, and the types of
NTM barriers imposed.
4.1.2 GMM models
Our logit analyais a�orded useful insights on transition dynamics by asking whether prior
presence of cronies might predict whether a sector makes a transition from the non-NTM to
an NTM world. Another relevant dimension is to relate cronyism to the density (or overall
burden) of NTM protection, as measured by the share of products in each sector subjected
to NTMs. There is signi�cant variation in the NTM coverage of products, ranging anywhere
from 19% of products in a given sector subjected to NTMs to nearly 100%. About 25% of
the manufacturing sectors in our sample have all their products covered by NTMs. We wish
to ask whether prior presence of cronies in a sector drives some of this variation in NTM
coverage across sectors. Exploring these models of NTM density has the added advantage
that they permit the use of more robust empirical methods that simultaneously allow us to
address temporal dependence, unobserved heterogeneity and endogeneity concerns. To relate
NTM density with cronyism we estimate dynamic GMM models of the following form:
yst = αys,t−1 + βCronyPrs,t−1 + γxs,t−1 + εst
where ys,t denotes the share of products covered by NTMs (NTM share), CronyPrs,t−1
is an indicator variable capturing prior crony presence, and xs,t−1is the vector of control
variables. To allow unobserved and time-invariant heterogeneity at the sector level and for
20

common shocks, the error term,εst, includes sector-speci�c �xed e�ects (us) and year-speci�c
intercepts (λt) besides serially uncorrelated measurement errors (vst) , such that:
εst = µs + λt + νst for s = 1, ...S; t = 1, ...T.
When expressed in �rst di�erences the equation takes the following form:
4yst = α4ys,t−1 + β4CronyPrs,t−1 + γ4xs,t−1 +4εst
This dynamic speci�cation eliminates the sector-speci�c �xed e�ects (us) through �rst-
di�erencing. Consistent estimation of Equation 4.1.2, however, requires the use of instru-
mental variables to deal with the potential endogeneity of regressors and the implied correl-
ation between di�erences of the lagged dependent variable and the new error term structure
induced by �rst di�erencing. Subject to certain assumptions, including the requirement that
the time varying component of the disturbance is independent across sectors and serially
uncorrelated, dynamic panel GMM estimators permit the use of lagged levels of variables
as internally generated instruments (seeArellano and Bond (1991); Roodman (2013) for de-
tails)10. However, for highly persistent series, lagged levels may serve as weak instruments,
potentially resulting in a serious �nite sample bias in �rst-di�erenced estimators.
In the presence of weak instruments and short panels Blundell and Bond (1998) favour
the use of the System GMM estimator, which combines the equations in �rst di�erences with
the equations in levels (also see Arellano and Bover (1995)). Subject to the validity of some
additional assumptions, System GMM permits the use of lagged levels of the series as instru-
ments in the �rst-di�erenced equations and lagged di�erences of the series as instruments in
the levels equations.11 The System estimator is particularly relevant for our context, since
our dependent variable (NTM share) and main variable of interest (CronyPr) is possibly
subjected to slow change over time. The consistency of System GMM crucially hinges on the
validity of lagged instruments, which, in turn, is implied by the absence of serial correlation
in the error term (vst). The validity of instruments and the underlying moment conditions
can be tested using the Sargan test of overidentifying restrictions and the separate tests for
serial correlation in the di�erenced residuals suggested by Arellano and Bond (1991).
The tests of serial correlation also guide the choice of our precise speci�cation, especially
the number of lags to be included. We consider all time-varying regressors as endogenous,
instrumenting their �rst di�erences with past levels. For the dependent variable we use values,
10Speci�cally, consistent estimation relies on the assumption that the initial conditions are predetermined, sothat E[ys1εst] = E[CronyPrs1εst] = E[xk
s1εst] = 0, for t=2,...T, s=1,...S, and k=1,...,K and it is consistentin S, the number of sectors, given T
11Speci�cally, the following assumptions are required to hold: E[4ys2us] = E[4CronyPrs,tus] = E[xks,tus] = 0
21

lagged �ve periods or more, as potential instruments. Explanatory variables, including crony
presence, are instrumented using values lagged three periods or more. Estimations are carried
out on an annual sample of 75 sectors that exhibited some transition dynamics with respect
to NTMs during the period, 1997-2011. Results are presented in Table 5. We begin by asking
whether sectors that switch their status from non-crony to crony experience greater change
in the subsequent period in the share of products covered by NTMs (NTM share). Column
(1) provides con�rmatory evidence in this regard: the coe�cient on lagged crony presence is
positive and statistically signi�cant at the 1% level. Importantly, the crony e�ect is robust
to the inclusion of key controls, such as the lagged imports, exports and MFN tari�s (all in
natural logs). Our models also control for three lags of the dependent variable, coe�cients
on all of which are positive and statistically signi�cant, indicating strong persistence e�ects
in the NTM share.
We next relate crony presence with another measure of the intensity of NTM protection:
share of products in a sector that are covered by at least two NTMs (NTM2 share). The
corresponding result in column (2) shows that the coe�cient on lagged crony presence is
positive and signi�cant at 1% level. A related exercise in column (3) probes whether lagged
crony presence predicts changes in another measure of NTM protection, de�ned as the average
number of di�erent NTM chapters applied in a given sector-year (NTM chapter). To pass
the serial correlation tests the speci�cation now includes �ve lags of NTM chapter (two
of which, lags 1 and 4, have statistically signi�cant coe�cients). Despite allowing for this
temporal dependence, lagged crony presence has a positive and weakly signi�cant impact on
the intensity of NTM protection. As before, our models include several control variables for
which the data is easily available. Results for these accord well with our priors. While tari�s
do not have a signi�cant impact, trade structure variables appear to exert a signi�cant impact
in most speci�cations. The coe�cient on imports is consistently negative and statistically
signi�cant, suggesting lower levels of NTM protection for sectors reliant on imports. Model
diagnostics lend support to our speci�cations, as we can comfortably reject the null of second-
order serial correlation in all columns.
Taken together, these results present a consistent pattern, and support the contention that
sectors that become crony over time tend to experience a greater burden of NTM protection,
regardless of the NTM measure used. . We draw greater con�dence from these GMM results,
since they assuage concerns about the in�uence of unmeasured time-invariant sector-speci�c
e�ects that could be correlated with our included regressors. GMM panel data estimators are
also robust to measurement error concerns and provide a possible remedy for the simultaneity
problem.
22

However, while we use lagged crony presence to predict future changes in NTM protection,
and deploy lagged values of regressors as instruments, this might leave some selection issues
unaddressed, notably the possibility that prior crony presence is not completely independent
of our outcome of interest (future NTM protection). For example, the underlying political
process in Egypt could have led connected actors into systematically entering sectors that
subsequently received higher levels of trade protection. This would prevent us from making
any causal claim about the e�ect of cronyism on trade protection. In the empirical analysis
that follows, we subject our cronyism hypothesis to a more severe test by restricting our
analysis to a period during which Egypt underwent a major trade policy shift, and asking
whether sectors that were previously populated by cronies disproportionately bene�ted from
this shift.
4.2 Further Tests of Identification
In this sub-section we present an alternative identi�cation strategy aimed at establishing
the causal e�ect of cronyism on non-tari� protection. In this regard, we exploit the timing
of the EU-Egypt trade agreement and sectoral di�erences in prior exposure to cronyism to
investigate the politics of trade protection. Egypt signed a major trade association agreement
with the European Union (EU) in 2001, which came into force in January 2004 and ushered in
an era marked by an unprecendented trade liberalization. The main thrust of this agreement
was on the reduction of tari� barriers. Average tari�s for the manufacturing sector fell from
an average of 27 percent in 1998 to about 20 percent. However, the tari� reduction was
followed, a year later, by a compensatory application of non-tari� measures. In 2005 Egypt
witnessed the largest wave of NTM introductions. The focus of our analysis is on whether
sectors populated by cronies prior to the EU trade agreement witnessed larger increases in
NTMs after 2004. To investigate the di�erential impact of trade liberalization and to throw
light on the empirical validity of the cronyism hypothesis, we set up a standard di�erence-
in-di�erence (DID) regression framework. Before proceeding further, we set out the relevant
background for this liberalization episode and specify the identi�cation strategy in more
detail.
4.2.1 The Egypt-EU Trade Agreement
Trade liberalization began in earnest in 1999, a few years after Egypt became a member
of the WTO in 1995. This was preceded by a number of important economic and political
developments during the period, 1999-2004, which set the stage for the e�ects of cronyism we
23

want to study. In July 1999 Egypt and the United States signed the Trade and Investment
Framework Agreement (TIFA). This was, however, only a preliminary step towards a free
trade agreement between the two countries, whose e�ect really kicked in 2005 after the
formation of Quali�ed Industrial Zones (QIZs) in Egypt in December 2004.12 The year 2004
was a watershed moment in Egyptian trade policy for another more important reason, which
provides the focus of this study: the signing of the trade agreement with the European Union
(EU), which resulted in an across the board reduction in tari� barriers. The Agreement
foresaw elimination of all industrial duties over a period of 15 years, with duties on raw
materials and industrial equipment faced with a 25% reduction each year from 2004 to 2007.
With this dimantling of tari�s, half of EU's industrial exports to Egypt were to be liberalized
by 2007.13
After the agreement was reached in June 2004 Egypt began implementing the most far-
reaching changes to its MFN tari� structure, which, by September 2014, reduced the number
of tari� bands to twelve. Later, in December 2004, Egypt initiated a major programme for
harmonization of its trade standards with international standards. Importantly, the dramatic
reduction in tari�s and the compliance of standards was followed, a year later, by a major
upward shift in the application of non-tari� measures. This was a fairly generalized shock
that a�ected nearly all manufacturing sectors. About 75% of all sectors that experienced a
tari� reduction in 2004 witnessed an increase in NTMs in 2005. There was also signi�cant
heterogeneity across sectors in the application of these NTMs over time. The question we
wish to ask is whether politically connected sectors witnessed systematically larger increases
in NTMs.
The Egypt-EU trade agreement provides an ideal setting to explore this politics of partial
liberalization. Firstly, economic relations with EU carry immense signi�cance for Egypt,
as it is Egypt's single largest trade partner, its `main source' of FDI, and its second largest
donor after United States. Secondly, the EU trade agreement were largely determined outside
Egypt's domestic political domain.14 The various trade pacts Egypt signed after 2001 were
12It is important to note here that the Qualifying Industrial Zones (QIZ), which were part of a larger strategicdrive to protect exports of Egypt and Jordan, the two major signatories of the peace process with Israel(Egypt and Jordan), mainly ensured duty free access of Egyptian exports to US markets. They had no tari�implications for imports entering Egypt.
13Duties on industrial supplies, semi-manufacturing goods and construction material were to be reduced by10% in 2007 and 15% in each successive year till 2013.
14This is also true for the wider economic reform programme that was implmented by Hosni Mubarak duringthe decade of 2000s. After 9/11 the US foreign aid package to Egypt, totalling US$2 billion, was directly tiedwith economic and political reform (http://articles.latimes.com/2005/feb/28/world/fg-egypt28). The onlydomestic political driver of these reforms was Mubarak's incentive to use economic reforms as a way to buyexternal legitimacy by strengthening his reformist credentials.
24

driven by the strategic external imperative that unfolded after 9/11. As el-Khouri (2008:
p.3) notes: �Shortly after 9/11, the connection between trade policy initiatives and security
strengthened as the U.S. administration argued that global trade liberalization was a central
plank of its national security and antiterrorism e�orts.� The EU followed suit: �The 9/11
attacks renewed EU interest in the MENA region and reinvigorated the Barcelona Process�
(el-Khouri: p.4). This resulted in the US and EU signing a series of FTAs in key Middle
Eastern states.15European trade agreements are especially signi�cant in the North African
context, which, due to its geographic proximity, is part of Europe's strategic neighbourhood.16
In this backdrop, Egypt's trade agreement with EU can be treated as a relatively exo-
genous development with respect to its domestic political economy. It is also reasonable
to assume that political cronies had little, if any, role in driving the trade agreement, espe-
cially in a milieu where the business-state relationship is typically organized in a hierarchical,
centralized and top-down fashion. Scholars on the Middle East would tend to concur that
major decisions on external trade relations are usually taken without substantive input from
domestic business associations (see Cammett (2007)).17 While there is no evidence to sug-
gest that cronies pushed for the EU trade agreement, they were nevertheless in a privileged
position to leverage this trade policy shift in their favour after it had happened. This is
because the Nazif cabinet, which contained several political cronies associated with the Na-
tional Democratic Party (NDP), was sworn in six months after the EU agreement came into
force.
4.2.2 Identi�cation
Leveraging these trade policy developments, we set up a panel DID framework to identify
the causal impact of cronyism. We are interested in exploiting prior sectoral di�erences in
exposure to cronyism to predict the evolution of NTMs over time. We restrict this empir-
ical exercise to the period, 2001-2011, during which Egypt's manufacturing sector witnessed
substantive trade liberalization. Setting our cut-o� year as 2004 when the EU agreement
came into force, we de�ne the post-period as including the year 2005 and after. To assuage
concerns of endogenous entry, our treatment measure is pre-determined with respect to the
15A wave of FTAs were signed with crucial states in North Africa and Levant, including Morocco, Tunisia, Le-banon, Jordan, and Egypt. Some of these FTAs were part of a larger e�ort to create the Euro-MediterraneanFree Trade Area (EMFTA) by 2010.
16As el-Khouri (2008: p. 14) observes: �EU's two-way trade with the region is nearly three times that of theUnited States. In investment, lending, and aid, Europe also outstrips regional U.S. activity�
17Hertog (2010) has similarly stressed how Saudi Arabia's accession to the WTO was part of external condi-tionality, and de�ned by a singular absence of internal feedback from relevant businesss stakeholders.
25

introduction of EU agreement. Sectors are classi�ed as treated if they were populated by
cronies during the period, 1996-98. This is a conservative strategy, since we know cronies
continued to enter after 1998. By classifying sectors that were exposed to cronyism after
1998 as non-crony we are actually tipping the scales against our �nding.
Focusing on cronies that entered far back in time reduces the possibility of an anticipation
e�ect. It is improbable that cronies that entered far back in time could have predicted which
sectors would witness a tari� cut and a concomitant rise in NTM protection six years later.
This is particularly unlikely given Egypt's long-held tradition of centralized decisionmaking
and high levels of policy uncertainty, and a trade negotiation process that was not completely
in the hands of central authorities. Our basic DID speci�cation can be set out as follows:
yit = βCronyni.IPostt + γXit + Φjλit +
∑s θsI
si+
2011∑ρjI
jt
j=2002
+εit,
where i denotes a sector and t represents time. The dependent variable, yit, is either the
cumulative number of NTMs (NTM cum) or number of new NTMs applied in a given sector-
year (NTM new). Our main variable of interest is Cronyni, which is a measure of treatment
intensity de�ned as the total number of cronies present in a sector during the period, 1996-98.
As is common in the literature, we de�ne a binary indicator, IPostt , which is equal to one for
all years after 2004 (i.e. 2005-2011), and interacted with the pre-determined crony measure.
The coe�cient of interest on this interaction term is β, which is the estimated impact of
prior crony exposure on the cumulative evolution of NTMs. Our baseline speci�cation also
includes a vector of time-varying controls Xit, sector and year �xed e�ects,∑
s Isi and
∑jI
jt ,
and sector-year interactions that control for sector-speci�c time trends (λit).18
Like any DID exercise, random assignment remains a perennial concern. The validity of
our empirical strategy depends on the assumption that the treatment of crony sectors should
be exogenous to the future trajectory of NTMs. Another assumption behind our analysis is
that events that take place during or after the 2004 EU agreement should equally a�ect the
comparison groups. De�ning a reasonable control group is another challenge, which can be
partly addressed by ensuring that the treatment and control groups do not display divergent
trends with respect to NTMs prior to the EU agreement. Reassuringly, a visual inspection
of the data suggests a similar trajectory of the cumulative evolution of NTMs for the two
groups (see Figure 4). We will provide more formal empirical tests of this parallel trends
assumption in the analysis that follows.
18Sector �xed e�ects control for all time-invariant factors that are speci�c to each sector, whereas time �xede�ects account for secular patterns in the evolution of NTMs.
26

Figure 4: The evolution of non-tari� measures in Egypt
4.2.3 DID Results
Table 6 presents the results for our baseline speci�cation, which includes, besides our main
variable of interest, sector and year �xed e�ects, as well as time-varying sector �xed e�ects
to control for unobserved heterogeneity. Starting with models for NTM density (NTM cum)
in column (1), we �nd a positive and statistically signi�cant coe�cient on the interaction
between crony count and Post indicator. This result continues to hold in column (2) when
we add a variety of controls, including the log of total imports, exports and MFN tari�s, all
weighted by the number of products in a given sector-year. In columns (3-4) we repeat the
same exercise for a di�erent dependent variable, number of new NTM introductions (NTM
new). As before, our coe�cient of interest (β) on the interaction between treatment intensity
and IPostt turns up as positive and statistically signi�cant at the 1% level. Taken together,
these results support our prior, in that sectors more densely populated with cronies in the
pre-period (1996-98) systematically witnessed a greater introduction and density of NTMs
after 2005.
Inference in panel data models can be complicated by the presence of serial correlation in
the error term. While we cluster standard errors by sector, an additional remedy proposed
27

by Bertrand, Du�o and Mullainathan (2004) is to run a two-period DID where temporal
information is collapsed into two periods. To implement this we average the dependent
variable and controls over the pre- (2001-2004) and post-periods (2005-2011). The results,
reported in columns (5-6), provide con�rmatory evidence. The estimated coe�cient on Crony
interaction remains positive and statistically signi�cant at 1% level in both models for NTM
cum (col. 5) and NTM new (col. 6). As before, sectors that attracted a larger number of
cronies in late 1990s witnessed greater cumulative increase in NTMs as well as new NTM
introductions after the EU agreement.
4.2.4 Robustness Tests
Reassured by these �ndings, we next conduct a battery of robustness tests to check whether
the relationship between cronyism and trade protection we are trying to develop withstands
a number of variations.
Extended controls. A possible concern that we would need to address is that our crony
assignment might be correlated with initial sectoral characteristics that could determine
exposure of sectors to both cronyism and NTMs over time. To ensure that our results are
not driven by trends in other confounding factors, we include an extended set of control
variables that are all measured prior to our estimation period (1996-98) and interacted with
the full set of year �xed e�ects. Our choice of controls is guided by data availability and
the literature on trade protection.19We maintain a consitent sample of 116 sectors for which
data is available for all our controls. The results are reported in Table 7. Allowing for the
fact that trade protection might be aimed at protecting sectors with more employees, column
(1) includes the log of total employees interacted with year �xed e�ects. In column (2) we
repeat the same exercise with the log of total imports, motivated by the possibility that
import-dependent sectors might be less protected. In both cases, the coe�cient on crony
interaction remains stable and statistically signi�cant at 5% level.
To the extent that our �nding might be driven by initial levels of trade protection, column
(3) includes the log of average tari� rate. While its interactions with year �xed e�ects
have considerable explanatory power, our coe�cent of interest remains positive and highly
signi�cant at 1% level. Next, we control for the intensity of non-tari� protection, as measured
by the average number of NTM chapters applied. This builds on the idea that the intensity of
protection is higher if a sector is subjected to NTMs from di�erent chapters. The interactions
are highly predictive of the cumulative increase in NTMs. Although this weakens our result
19Sector level data on key variables is extremely patchy for most North African states.
28

in column (4) we still get a positive coe�cient that is signi�cant at 10% level. Column (5)
imposes a more stringent test by including all of the above controls. Still, the crony e�ect
survives: the coe�cient on crony interaction remains statistically signi�cant at 10% level.
The crony e�ect also survives when we replace our measure of treatment intensity with a
binary treatment indicator (Online Appendix, Table A8).
Varying the cut-o�. So far our results are based on taking 2004 as the cut-o� year, given
that the EU agreement was implemented in that year. Rather than taking this for granted
we examine whether the underlying patterns in the data support our use of 2004 as the
cut-o� year. Following Nunn (2011) we estimate a fully �exible speci�cation where, instead
of interacting Cronyni with the binary indicator, IPostt , we interact crony count with each of
the year �xed e�ects:
yit =2011∑
j=2002
βjCronyni.Ijt + Φjλit +
∑s θsI
si+
2011∑ρjI
jt
j=2002
+εit,
The estimated βjs in this equation capture the impact of cronyism on the cumulative
growth of NTMs in each successive year. As before we include sector and year �xed e�ects,
as well as sector time trends. We expect our coe�cient of interest to be larger in magnitude
and statistically signi�cant only after 2004 when the EU agreement was put into e�ect.
The estimated β coe�cients along with their 95 percent con�dence intervals are plotted in
Figure 5. The resulting patterns are entirely consistent with our story. The coe�cient on
crony interaction is negative and statistically insigni�cant before 2005. However, there is
a discernbible discontinuity in 2005, a year after the EU agreement, when the coe�cient
becomes positive. The β coe�cient remains positive and statistically signi�cant at 5 percent
level during the 2006-2010 period.
Placebo tests. We next conduct a placebo exercise to determine whether the cronyism has
any e�ect on our outcome of interest in the pre-period. For this we restrict the estimation
to the pre-period (2001-2004) and rede�ne the post indicator, IPostt , as taking the value of
one in years 2003 and 2004 (o, otherwise). This reduces our sample to 446 observations,
with a maximum of four observations per group.20 All speci�cations include the available
controls besides the usual sector and year �xed e�ects, as well as sector time trends. We
expect the coe�cient on crony interaction (β) to be close to zero and statistically signi�cant,
since cronyism should not in�uence sectoral exposure to NTMs before the EU agreement.
The results are presented in Table 8. Consistent with our prior the coe�cient on crony
20Overall sample size still consists of 119 sectors.
29

interaction is negative and statistically insigni�cant regardless of whether we use a measure
of treatment intensity (cols. 1 and 3) or a binary treatment indicator (cols. 2 and 4). The
same result holds if we were to replace our dependent variable with number of new NTMs
introduced (NTM new).21 We take this as evidence that the emhasized e�ect of cronyism is
absent before the EU agreement came into e�ect. This supports our DID design.
Figure 5: Flexible Estimates of the Relationship between Cronyism and Non-tari� Protection
Alternative de�nition of cronies. We have thus far used a broader de�nition of cronies
that include con�dants, politicians, and associates. However, using a narrower de�nition of
cronies that includes only politicians preserves our central �nding. In fact, the estimates
reported in Online Appendix show that our results become slightly stronger when using a
narrow de�nition of cronies.
Restricted sample with tari� cuts. One concern with our results is that our �ndings may
be in�uenced by the inclusion of sectors that did not witness tari� cuts in wake of the EU
agreement. To ensure that this does not bias our results we next replicate our estimates
for the restricted sample of sectors that faced a tari� cut after the EU agreement. The
21A related exercise is to bring the treatment period forward. If the Post is rede�ned to include the year 2000and beyond, the coe�cients on both the crony and crony count interactions lose their signi�cance completely.
30

accompanying results are reported in Online Appendix (Table A9).
4.2.5 DID with IV
Despite delivering a consistent pattern of results, our initial crony treatment might still leave
room for skepticism. Although it is highly unlikely that cronies that entered far back in
time could have predicted a future shift in trade policy that was mainly the result of high
geo-politics, it is still possible that part of the process may be endogenous. Apart from
the endogenous sorting of cronies in sectors that later received greater NTM protection, our
results can also be confounded by omitted variables. These could be time-varying sectoral
characteristics that are either unobserved or su�er from missing data but which could in-
�uence both initial crony presence and subsequent exposure to NTMs. Measurement error
could serve as an additional concern. To address these issues, we follow Waldinger (2012) in
combining a DID framework with IV methods.
In this sub-section we propose two plausible instruments that could provide an exogenous
source of variation for sectoral exposure to cronies, our measure of treatment intensity. Our
�rst instrument, neighbour-crony ratio, is a measure of the presence of crony relatives in neigh-
bouring sectors. We de�ne neighbour in a narrow technical sense, whereby all sub-groups
within a 3-digit sector are treated as neighbours. Precisely, the instrument is constructed as
the total number of crony relatives per neighbouring sector.22 To construct the instrument
we use the same time window as for the initial crony treatment, i.e., 1996-98.
The intuition for our instrument comes from the entry decision of cronies, which can argu-
ably be modelled through clan networks. Cronies in North Africa tend to build broad clusters
and might favour operating in sectors that are already populated by relatives. Prior presence
of relatives can bene�t cronies in several ways. It allows them to build on existing strengths,
such as accumulated family knowledge of the sector, and might deliver other positive extern-
alities. For example, clustering in sectors where other clan members are active can increase
cronies' bargaining power and help to provide insurance against policy uncertainty, which
remains a perennial concern for Egyptian manufactures. If, for whatever reason, cronies
were to prefer operating in sectors already inhabited by relatives, we should expect to have
a negative association between our instrument and crony treatment (Cronyni). This would
imply that cronies will tend to avoid sectors whose neighbourhoods have greater relatives per
sector. In other words, they would rather be in one of the neighbouring sectors than in the
22This could be expressed as: total number of crony relatives in neighbouring 3-digit sectors/total number ofneighbouring 3-digit sectors.
31

sector concerned.
Instrument validity requires that the neighbour-crony ratio only predicts which sectors
cronies enter but not NTM incidence. This seems plausible in our case, since even if one were
to admit that the entry of cronies is driven by expectations of future trade protection this
should only a�ect NTM incidence in neighbouring sectors. Clearly, this identi�cation strategy
rests on the assumption that NTMs in a given sector are not determined by protection levels in
neighbouring sectors. We provide con�rmatory evidence to this e�ect in the Online Appendix.
The exclusion restriction can be checked more generally by including our instrument as an
additional control in the main speci�cation. Doing so results in a statistically insigni�cant
coe�cient, which suggests that our instrument does not directly a�ect NTM activity in a
given sector.
Our second instrument deploys a larger notion of neighbourhood, in that it draws a paral-
lel between sectoral exposure to cronyism in Egypt with that of Tunisia, a key North African
neighbour. After the Arab Spring both Egypt and Tunisia were held out as comparable
cases of crony capitalism, where economic and political power began to overlap under their
respective leaders at the time, Mubarak and Ben Ali. We argue that there are common
drivers of sectorial variation in crony presence across the region that emanate from shared
characteristics of business-state relationship. Cronies tend to proliferate in sectors de�ned
by high barriers to entry (exclusive licenses, entry restrictions), preferential access to �n-
ance, prevalence of subsidies (food, energy), and opportunities to derive quick pro�ts (low
skill/technology and high pro�t margins), among others. There is plenty of qualitative evid-
ence to suggest that Egypt and Tunisia have a similar sectoral exposure to cronyism despite
the fact that cronies in the two countries are not directly related.
In light of this, we propose that information on whether or not a sector is exposed to
cronyism in Tunisia provides an exogenous source of variation for crony treament in Egypt
(Cronyni). To do so, we de�ne a binary indicator, CronyTunisia, which is equal to one
for sectors where a Tunsian crony was active in the same period under Ben Ali. We use
this as an instrument for Cronyni. This requires, however, a parallel attempt at compiling
the database on Tunisian cronies active under Ben Ali's regime. Details for this intensive
data exercise are separately described in the Online Appendix. As before, we require Crony-
Tunisia to be correlated with the treatment variable but lacking direct explanatory power
for variation in NTM activity. Indeed, when included as a covariate in our baseline spe-
ci�cation, CronyTunisia lacks any predictive power with regards to the dependent variable.
Reassured by this, we proceed towards re-estimating our baseline DID speci�cation using
these instrumental variables. The �rst-stage regressions take the following general form:
32

Cronyni.IPostt = γi + γ2neighbouri.I
Postt + Φjλit +
∑s θsI
si+
2011∑ρjI
jt
j=2002
+µit,
where neighbouri signi�es one of the two neighbourhood instruments and enters in the
model as an interaction with the post indicator; other variables are de�ned as before. We will
use the two instruments, neighbour-crony ratio and CronyTunisia, separately as well as jointly,
and assess instrument validity using tests for overidentifying restrictions. We estimate the IV
speci�cations using GMM methods with robust standard errors, given that GMM estimators
are generally more e�cient than 2SLS in the presence of heterosckedasticity (Baum, Scha�er
and Stillman, 2003). The IV estimates are presented in Table 9. Given data limitations, the
sample size for speci�cations using the �rst instrument reduces to 85 sectors.
To ensure that our main �nding remains intact on this reduced sample, column (1) rep-
licates the baseline speci�cation and shows that the treament-post interaction continues to
turn up as a positive and signi�cant predictor of NTM_cum. Column (2) provides the IV
estimates of this speci�cation using our �rst instrument, neighbour-crony ratio. As expected,
the instrument has a large, negative and statistically signi�cant impact on the crony-post
interaction. The �rst-stage F-Statistic is 81.38, well beyond the conventional threshold of
10. Importantly, the coe�cient on our main variable of interest, Cronyni.IPostt , comes out
as positive and signi�cant at 1 percent level. The underidenti�cation test, based on the
Kleibergen-Paap LM statistic, supports the relevance of our instrument. Similarly, the F-
statistics for weak identi�cation tests (Craig Donnald and Kleibergen Paap rk) comfortably
surpass all the relevant critical values.
In column (3) we re-estimate the baseline speci�cation using our second instrument,
CronyTunisia. As before, the instrument is a strong predictor of the exposure of Egyptian
sectors to cronyism in late 1990s. The interactive term, CronyTunisia. IPostt , enters the
estimated model with a positive and statistically signi�cant coe�cient. Our next IV speci�c-
ation in column (4) exploits the exogenous variation in both of our instruments to predict
the crony interaction. Reassuringly, both instruments turn up as signi�cant in First-stage
regressions, and the coe�cient on crony-post interaction remains positive and signi�cant.
The Sargan-Hansen test of overidentifying restrictions, and the battery of weak identi�cation
tests, support the validity of our instrument set. These results also survive the inclusion of
our standard control variables in column (5). Collectively, these �ndings further reinforce
the evidence on cronyism and trade protection that we have presented so far.
33

5 Conclusion
This article has examined the extent to which politically connected businessmen in late-
Mubarak Egypt were able to tilt non-tari� measures in their favour. To do so, we combine
information from the WITS database (World Bank, 2013) on the timing of NTM introduc-
tions with a novel dataset on crony activity in all manufacturing sectors, which allows us to
identify when cronies enter a speci�c sectors. Using conditional logistic and GMM models
to identify we identify a solid association between crony entry and subsequent introduction
and intensi�cation of NTM protection. On average, sectors in which cronies enter in t-1 are
50 percent more likely to witness the introduction of an NTM than non-crony sectors. Fur-
thermore, crony entry is also associated with an intensi�cation of NTM protection, leading
to a 6 percent average increase in the number of products subject to an NTM, conditional
on an NTM having been introduced.
We then corroborate the link between crony entry and NTM protection by conducting a
di�erence-in-di�erence analysis which exploits the introduction of the EU-Egypt trade agree-
ment in 2004 as an exogenous shock to the Egyptian trade regime. This analysis demonstrates
that cronies who had entered a manufacturing sectors by 1998 � six years prior to the trade
agreement � received on average 15% higher compensation in the form of NTMs for the ensu-
ing cut in tari� than non-crony sectors. To address any remaining selection issues, we use two
instruments for the presence of cronies by 1998: the share of other cronies in neighbouring
sectors and the sectoral distribution of politically connected entrepreneurs in Tunisia. Both
are highly predictive of crony presence as cronies seek to avoid too much crony competition in
the same sectoral neighbourhood and the nature of cronyism in the region � agglomerating in
sectors with high barriers to entry � makes the Tunisian pattern of crony activity predictive
of sectoral presence of cronies in Egypt.
Our �ndings contribute to ongoing debates about the determinants of trade protection.
Having focused predominantly on Western economies and tari�s, our analysis is one of the
�rst ones to address the determinants of NTMs in a developing economy, highlighting the
potential for political capture of trade policy by crony entrepreneurs in a context characterised
by limited rule of law and the absence of democratic accountability. We also contribut to
the literature on cronyism, which has thus far chie�y been concerned by the e�ects political
connections have on crony entrepreneurs themselves. Our study, in turn, breaks new ground
in that we demonstrate how policies themselves can be endogenous to crony in�uence. Finally,
this study represents a detailed empirical case study of elite co-optation in an authoritarian
political system, detailing at the micro level how policies can be used to tie economic elites
34

to the regime.
35

References
Abdel-Latif, Abla and Hubert Schmitz. 2010. �Growth Alliances: Insights from Egypt.�
Business and Politics 12(4):1�27.
Alissa, Sufyan. 2007. The Political Economy of Reform in Egypt: Understanding the Role of
Institutions. Technical Report 5 Carnegie Endowment for International Peace Washington,
D.C.: .
Ancharaz, Vinaye D. 2003. �Determinants of Trade Policy Reform in Sub-Saharan Africa.�
Journal of African Economies 12(3):417�443.
Arafat, Alaa Al-Din. 2009. The Mubarak Leadership and Future of Democracy in Egypt. New
York: Palgrave Macmillan.
Arellano, Manuel and Olympia Bover. 1995. �Another Look at the Instrumental Variable
Estimation of Error-Components Models.� Journal of Econometrics 68(1):29�51.
Arellano, Manuel and Stephen Bond. 1991. �Some Tests of Speci�cation for Panel dData:
Monte Carlo Evidence and an Application to Employment Equations.� The Review of
Economic Studies 58:277�297.
Augier, Patricia, Olivier Cadot, Julien Gourdon and Mariem Malouche. 2012. �Non-tari�
measures in the MNA region: Improving Governance for Competitiveness.�.
Azrak, Paul and Kevin Wynne. 1995. �Protectionism and Japanese direct investment in the
United States.� Journal of Policy Modeling 17(3):293�305.
Bauer, Raymond A, Ithiel de Sola Pool and Lewis Anthony Dexter. 1972. American Business
and Public Policy: The Politics of Foreign Trade. Aldine-Atherton.
Baum, Christopher F, Mark E Scha�er and Steven Stillman. 2003. �Instrumental variables
and GMM: Estimation and testing.� Stata journal 3(1):1�31.
Beck, Nathaniel L., Jonathan N. Katz and Richard Tucker. 1998. �Taking Time Seriously:
Time-Series-Cross-Section Analysis with a Binary Dependent Variable.� American Journal
of Political Science 42(4):1260�1288.
Bhagwati, Jagdish N. 1982. �Directly unproductive, pro�t-seeking (DUP) activities.� The
journal of political economy pp. 988�1002.
36

Blonigen, Bruce A and David N Figlio. 1998. �Voting for Protection: Does Direct Foreign
Investment In�uence Legislator Behavior?� The American Economic Review 88(4):1002�
1014.
Blundell, Richard and Stephen Bond. 1998. �Initial Conditions and Moment Restrictions in
Dynamic Panel Data Models.� Journal of Econometrics 87(1):115�143.
Boubakri, Narjess, Jean-Claude Cosset and Walid Sa�ar. 2008. �Political connections of
newly privatized �rms.� Journal of Corporate Finance 14(5):654�673.
Bureau van Dijk. 2013. �Orbis Database.�.
URL: https://orbis.bvdinfo.com/
Cammett, Melani Claire. 2007. Globalization and Business Politics in Arab North Africa: a
comparative perspective. Cambridge: Cambridge University Press.
URL: http://www.loc.gov/catdir/toc/ecip075/2006037803.html
Carter, David B. and Curtis Ss Signorino. 2010. �Back to the Future: Modeling Time
Ddependence in Bbinary Data.� Political Analysis 18:271�292.
Caves, Richard E. 1976. �Economic models of political choice: Canada's tari� structure.�
Canadian Journal of Economics pp. 278�300.
Chau�our, Jean-pierre. 2011. Trade Integration as a Way Forward for the Arab World. A
Regional Agenda. Technical Report WPS 5581 The World Bank Washington, D.C: .
Chekir, Hamouda and Ishac Diwan. 2013. �Distressed Whales on the Nile - Egypt Capitalists
in the Wake of the 2010 Revolution.�.
URL: http://www.erf.org.eg/CMS/uploads/pdf/747.pdf
Claessens, Stijn, Erik Feijen and Luc Laeven. 2008. �Political connections and preferential
access to �nance: The role of campaign contributions.� Journal of Financial Economics
88(3):554�580.
Coughlin, Cletus C. 1985. �Domestic content legislation: House voting and the economic
theory of regulation.� Economic Inquiry 23(3):437�448.
Demmelhuber, Thomas and Stephan Roll. 2007. Herrschaftssicherung in Ägypten. Zur Rolle
von Reformen und Wirtschaftsoligarchen. Technical Report S 20 Berlin: .
URL: http://www.swp-berlin.org/common/get_document.php?asset_id=4176
37

Esfahani, H and L Squire. 2007. �Explaining trade policy in the Middle East and North
Africa.� The Quarterly Review of Economics and Finance 46(5):660�684.
Esfahani, Hadi Salehi. 2005. �Searching for the (dark) forces behind protection.� Oxford
Economic Papers 57(2):283�314.
Faccio, Mara. 2006. �Politically Connected Firms.� The American Economic Review
96(1):369�386.
Faccio, Mara, Ronald W. Masulis and John J. McConnell. 2006. �Political contributions and
corporate bailouts.� The Journal of Finance 61(6):2597�2635.
Fan, Joseph P. H., T. J. Wong and Tianyu Zhang. 2007. �Politically connected CEOs,
corporate governance, and Post-IPO performance of China's newly partially privatized
�rms.� Journal of Financial Economics 84(2):330�357.
Ferguson, Thomas and Hans-Joachim Voth. 2008. �Betting on Hitler - The Value of Political
Connections in Nazi Germany.� Quarterly Journal of Economics 123(1):101�137.
URL: http://www.mitpressjournals.org/doi/abs/10.1162/qjec.2008.123.1.101
Fisman, Raymond. 2001. �Estimating the Value of Political Connections.� The American
Economic Review 91(4):1095�1102.
URL: http://www.ncbi.nlm.nih.gov/pubmed/20888544
Gawande, Kishore and Usree Bandyopadhyay. 2000. �Is Protection for Sale? Evidence on
the Grossman-Helpman Theory of Endogenous Protection.� The Review of Economics and
Statistics 82(1):139�152.
Goldman, E., J. Rocholl and J. So. 2009. �Do Politically Connected Boards A�ect Firm
Value?� Review of Financial Studies 22(6):2331�2360.
Grether, Jean Marie, Jaime De Melo and Marcelo Olarreaga. 2001. �Who determines Mexican
trade policy?� Journal of Development Economics 64(2):343�370.
Grilli, Enzo. 1988. �Macro-economic Determinants of Trade Protection.� The World Economy
11(3):313�326.
Hertog, Ste�en. 2010. Princes, Brokers, and Bureaucrats. Oil and the State in Saudi Arabia.
London: Cornell University Press.
38

Hillman, Arye L. 1982. �Declining industries and political-support protectionist motives.�
The American Economic Review 72(5):1180�1187.
Hoekman, Bernard and Alessandro Nicita. 2011. �Trade Policy, Trade Costs, and Developing
Country Trade.� World Development 39(12):2069�2079.
Kandil, Magda. 2010. The Subsidy System in Egypt : Alternatives for Reform. Technical
Report 25 The Egyptian Center for Economic Studies (ECES).
URL: http://www.eces.org.eg/Publications/View_Pub.asp?p_id=9&p_detail_id=319#mytop
Kee, Hiau Looi, Alessandro Nicita and Marcelo Olarreaga. 2006. �Estimating Trade Restrict-
iveness Indices.�.
Khwaja, A.I. and A. Mian. 2005. �Do Lenders Favor Politically Connected.� The Quarterly
Journal of Economics 120(4):1371�1411.
King, Stephen J. 2003. Liberalization Against Democracy. The Local Politics of Economic
Reform in Tunisia. Bloomington: Indiana University Press.
Krueger, Anne O. 1974. �The political economy of the rent-seeking society.� The American
economic review 64(3):291�303.
Lee, Jong-Wha and Phillip Swagel. 1997. �Trade Barriers and Trade Flows Across Countries
and Industries.� Review of Economics and Statistics .
Li, Hongbin, Lingsheng Meng, Qian Wang and Li-An Zhou. 2008. �Political connections,
�nancing and �rm performance: Evidence from Chinese private �rms.� Journal of Devel-
opment Economics 87(2):283�299.
Lopez, Rigoberto and Emilio Pagoulatos. 1996. �Trade Protection and the Role of Campaign
Contributions in Us Food and Tobacco Industries.� Economic Inquiry 34(April):237�248.
Magee, Stephen P, William A Brock and Leslie Young. 1989. Black hole tari�s and en-
dogenous policy theory: Political economy in general equilibrium. Cambridge University
Press.
Malik, Adeel. 2015. �From resource-curse to rent curse: Toward a new political economy of
the Middle East.�.
Pack, Howard. 1994. �Productivity or politics: The determinants of the Indonesian tari�
structure.� Journal of Development Economics 44(2):441�451.
39

Ray, Edward John. 1981a. �Tari� and nontari� barriers to trade in the United States and
abroad.� The Review of Economics and Statistics pp. 161�168.
Ray, Edward John. 1981b. �The Determinants of Tari� and Nontari� Trade Restrictions in
the United States.� Journal of Political Economy 89(1):105�121.
Ray, Edward John and Howard P. Marvel. 1984. �The Pattern of Protection in the Industri-
alized World.� Review of Economics and Statistics .
Roll, Stephan. 2010. Geld und Macht: Finanzsektorreformen und politische Bedeutungszun-
ahme der Unternehmer- und Finanzelite in Ägypten. Berlin: Verlag Hans Schiller.
Roll, Stephan. 2013. Ägyptens Unternehmerelite nach Mubarak. Machtvoller Akteur
zwischen Militär und Muslimbruderschaft. Technical report Stiftung Wissenschaft und
Politik Berlin: .
URL: http://www.swp-berlin.org/de/publikationen/swp-studien-de/swp-studien-
detail/article/aegyptens_unternehmerelite_nach_mubarak.html
Roodman, David. 2013. �XTABOND2: Stata module to extend xtabond dynamic panel data
estimator.�.
URL: http://ideas.repec.org/c/boc/bocode/s435901.html
Selim, Tarek H. 2006. �Monopoly : The Case of Egyptian Steel.� Journal of Business Case
Studies 2(3):85�92.
Tre�er, Daniel. 1993. �Trade liberalization and the theory of endogenous protection: an
econometric study of US import policy.� Journal of political Economy pp. 138�160.
UNIDO. 2013. �INDSTAT4 Industrial Statistics Database.�.
URL: http://www.unido.org/en/resources/statistics/statistical-databases.html
Van de Walle, Nicolas. 2001. African Economies and the Politics of Permanent Crisis, 1979-
1999. Cambridge: Cambridge University Press.
World Bank. 2013. �World Integrated Trade Solution (WITS).�.
URL: http://wits.worldbank.org/
Zorn, Christopher J. W. 2000. �Modeling Duration Dependence.� Political Analysis 8(4):367�
380.
URL: http://pan.oxfordjournals.org/content/8/4/367.abstract
40

Table 4: NTM Introduction and Crony Activity
(1) (2) (3) (4) (5)
NTM Intro NTM Intro NTM Intro NTM Intro NTM Intro: First-ever
Crony presence t−1 1.251∗∗∗ 1.202∗∗∗ 1.165∗∗∗ 1.310∗∗∗ 16.86∗∗∗
(0.395) (0.421) (0.430) (0.445) (1.460)
Imports t−1 -0.262 -0.267 -0.291 -0.480(0.195) (0.184) (0.198) (0.566)
Exports t−1 -0.0304 -0.0238 0.342(0.158) (0.159) (0.399)
Tari�s t−1 -0.481 -5.843∗∗∗
(0.313) (1.307)
Time spell 0.684∗∗ 0.593∗∗ 0.699∗∗ 0.761∗∗
(0.286) (0.262) (0.288) (0.304)
Time spell2 -0.262∗∗ -0.257∗∗ -0.280∗∗ -0.289∗∗
(0.116) (0.110) (0.114) (0.120)
Time spell3 0.0312∗∗∗ 0.0311∗∗∗ 0.0318∗∗∗ 0.0316∗∗∗
(0.00949) (0.00920) (0.00948) (0.00989)
Prefail -0.0631∗∗∗ -0.0804∗∗∗ -0.0723∗ -0.117∗∗
(0.0183) (0.0281) (0.0394) (0.0527)
Pseudo R-sq 0.321 0.319 0.285 0.296 0.554Sectors 75 73 66 66 50NxT 1125 1011 892 892 307
Conditional logistic �xed e�ects regression. Cluster-robust standard errors in parentheses.
Crony variable based on broad de�nition of cronies.∗ p < 0.10, ∗∗ p < 0.05, ∗∗∗ p < 0.01
41

Table 5: NTM Density and Crony Activity
(1) (2) (3)
NTM share NTM2 share NTM chapter
Crony presence t−1 0.0661∗∗∗ 0.0675∗∗ 0.0462∗
(0.0256) (0.0264) (0.0281)
Imports t−1 -0.0171∗∗∗ -0.0174∗∗∗ -0.0177∗
(0.00594) (0.00602) (0.00973)
Exports t−1 0.00832∗∗ 0.00823∗∗ 0.000656(0.00368) (0.00367) (0.00666)
MFN t−1 0.00519 0.00485 -0.00981(0.00671) (0.00671) (0.00927)
NxT 653 646 591Sectors 75 75 75Sector FEs Yes Yes YesYear FEs Yes Yes YesLags of DV 3 3 5AR(2) 0.639 0.877 0.345
System GMM estimates with sector and year �xed e�ects and cluster-
robust standard errors. Crony variable based on broad de�nition of
cronies. Sample restricted to sectors with NTMs. Reported numbers
for AR(2) test are p-values.∗ p < 0.10, ∗∗ p < 0.05, ∗∗∗ p < 0.01
42

Table 6: Results for Di�erence-in-Di�erence Model
(1) (2) (3) (4) (5) (6)
NTM cum NTM cum NTM new NTM new NTM cum NTM new
Initial crony count x Post 0.153∗∗ 0.143∗∗ 0.148∗∗ 0.174∗∗ 0.132∗∗ 0.0725∗∗
(0.0663) (0.0652) (0.0632) (0.0678) (0.0613) (0.0288)
Two-period No No No No Yes YesControls No Yes No Yes Yes YesSector trends Yes Yes Yes Yes Yes YesAdj R-sq 0.745 0.767 0.422 0.421 0.851 0.568Sectors 119 119 119 119 119 119NxT 1309 1102 1309 1102 238 238
Observations are at the sector-year level. The dependent variable is either the cumulative number of NTMs
(NTM cum) or number of new NTMs applied in a given sector-year(NTM new). All regressions include year and
sector �xed e�ects. Coe�cients are reported with robust standard errors, clustered at the sector level,
in parentheses. The estimation period is 2001-2011. Post dummy is equal to 1 if year is greater than 2004
and 0, otherwise. Controls include total imports, exports and MFN tari�s, all measured in natural log and
weighted by number of products. Crony variable is based on broad de�nition of cronies.∗ p < 0.10, ∗∗ p < 0.05, ∗∗∗ p < 0.01
43

Table 7: Robustness Tests for DID: NTM cumulative
(1) (2) (3) (4) (5)
Initial crony count x Post 0.133∗∗ 0.147∗∗ 0.190∗∗∗ 0.108∗ 0.111∗
(0.0645) (0.0664) (0.0634) (0.0638) (0.0621)
Sector x Time Yes Yes Yes Yes YesControls (x Year FE):Employees Yes No No No NoImports No Yes No No NoTari�s No No Yes No NoNTM chap No No No Yes NoFull set No No No No Yes
Adj R-sq 0.762 0.754 0.763 0.766 0.790Sectors 116 116 116 116 116NxT 1245 1245 1245 1245 1245
Observations are at the sector-year level. The dependent variable is the cumulative number of
NTMs (NTM cum) applied in a given sector-year. All regressions include year and sector �xed
e�ects. Coe�cients are reported with robust standard errors, clustered at the sector level, in
parentheses. The estimation period is 2001-2011. Post dummy is equal to 1 if year is greater
than 2004 and 0, otherwise. All controls are measured in natural log and averaged over the
period, 1996-98. Crony variable is based on broad de�nition of cronies.∗ p < 0.10, ∗∗ p < 0.05, ∗∗∗ p < 0.01
44

Table 8: Placebo Tests
(1) (2) (3) (4)
NTM cum NTM cum NTM new NTM new
Initial crony count x Post -0.00696 -0.0105(0.00811) (0.0555)
Initial crony dummy x Post -0.0230 -0.0129(0.0235) (0.0891)
Controls Yes Yes Yes YesSector x Time Yes Yes Yes YesAdj R-sq 0.0991 0.103 0.134 0.134Sectors 119 119 119 119NxT 446 446 446 446
Observations are at the sector-year level. The dependent variable is the cumulative number of NTMs
(NTM cum) applied in a given sector-year. All regressions include year and sector �xed e�ects.
Coe�cients are reported with robust standard errors, clustered at the sector level, in parentheses.
The estimation period is 2001-2004. The de�nition of Post dummy varies across columns. Controls
include total imports, exports and MFN tari�s, all measured in natural log and weighted by
number of products. Crony variable is based on broad de�nition of cronies.∗ p < 0.10, ∗∗ p < 0.05, ∗∗∗ p < 0.01
45

Table 9: Di�erence-in-Di�erence Regressions with IV
(1) (2) (3) (4) (5)
Dep. Variable: Cumulative number of NTMs applied
Initial crony count x Post 0.125∗∗ 0.200∗∗ 0.261∗∗ 0.247∗∗∗ 0.192∗∗
(0.052) (0.102) (0.126) (0.0954) (0.0870)
First stageNeighour-crony ratio -.709∗∗∗ -.734∗∗∗ -.859∗∗∗
(0.079) (0.080) (0.082)Crony presence in Tunisia .632∗∗∗ .316∗∗∗ .348∗∗∗
(0.114) (0.118) (0.120)
First stage F-statistic 81.38 30.29 41.92 54.87Kleibergen-Paap LM (p-value) 0.000 0.000 0.000 0.000
Kleibergen-Paap Wald-statistic 81.382 30.289 41.992 54.871Stock-Yogo Critical Values:(10 percent) 16.38 16.38 19.93 19.93(25 percent) 5.53 5.53 7.25 7.25Hansen-J test (p-value) 0.21 0.43
Sector x Time Yes Yes Yes Yes YesControls Yes No No No YesAdj. R-sq 0.776 0.744 0.715 0.744 0.760Sectors 85 85 119 85 85NxT 783 935 1309 935 783
Observations are at the sector-year level. The dependent variable is the cumulative number
of NTMs applied in a given sector-year. All regressions include year and sector �xed e�ects.
Coe�cients are reported with robust standard errors, clustered at the sector level, in
parentheses. The estimation period is 2001-2011. Post dummy is equal to 1 if year is greater
than 2004 and 0, otherwise. Controlsinclude imports, exports, and tari� rates, all weighted
by products in a given sector-year and expressed in natural log. Crony variable is based on
broad de�nition of cronies.∗ p < 0.10, ∗∗ p < 0.05, ∗∗∗ p < 0.01
46