Embed Size (px)
Citation preview

The Plasma Speaker:
Construction and Characterization of Both Full-
bridge and Single-ended Driving Circuits
Michael Hopkins & Thomas Houlahan
PHYS 406
Class Project – Final Report
May 11, 2012

Introduction
A plasma speaker uses a high-voltage-pulse generator to produce a rapidly occurring series of
plasma arcs, through which an audio signal can be transduced from an electrical signal into an
overpressure wave, capable of being heard by a human. A picture of our working plasma
speaker is shown below.
This particular speaker produces arcs triggered at approximately 50 kHz. The energy deposited
into the air with each pulse is controlled, such that the series of arcs can amplitude can be
modulated with an audio signal to produce sound.
Theory of Operation
A plasma speaker uses one of a variety of methods to produce a series of high-voltage pulses
between two electrodes, ionizing the air between them with each pulse. This serves as a
mechanism to deposit energy into a thin, cylindrical region of air between the electrodes on a

time-scale that is much faster than the pulse-to-pulse delay. Since the internal energy of a
diatomic gas (air, consisting of mostly N2 and O2) is linear in temperature, we can write,
, (1)
where ΔT and ΔU are the changes in temperature and internal energy of a diatomic gas,
respectively, and R is the ideal gas constant. Thus, if one the amount of energy deposited into
the air is known, so too is it’s change in temperature.
Also occurring on a time-scale much faster than the pulse-to-pulse delay of the high-voltage
pulses, is the cooling of the air back down to room temperature. As a result of this, the
temperature of the air as a function of time is a series of impulses, each occurring when a high-
voltage pulse arrives at the electrodes.
Since the air is heated rapidly and does not have time to expand, it is effectively at a constant
volume for the duration of the heating, allowing the use of the well-known ideal gas law to
equate a change in temperature to a change in pressure for this thin, cylindrical region of air,
which yields,
. (2)
Combining Equations (1) and (2) gives a relationship between the pulse energy and the change in
pressure.
. (3)
Thus, if high-voltage pulses arrive with constant pulse-to-pulse timing (of period, T, and
corresponding frequency, 1/T = f0), the change in internal energy has the form of an infinite
impulse train in time, which is described by,
( ) ∑ [ ( )] , (4)
where the impulses have been modeled as simple delta functions. The Fourier transform of an
infinite impulse train of frequency, f0, is itself an infinite impulse train, whose peaks are spaced
at intervals of f0 in the frequency domain. This is mathematically described by,
( ) ∑ [ ( )] , (5)
and shown below, in Figure 1.

Figure 1: The first three modes of an infinite impulse train, having a pulse repetition frequency, f0.
If we then modulate the pulse energies with a sinusoid having a frequency, f1, which is less than
f0, we have,
( ) {( ( )) ( )}
( ) ( ( ) ( )), (6)
which can be explicitly written as,
( ) ∑ [ ( ) ( ( ( )) ( ( )))] . (7)
This is shown in Figure 2, below.
Figure 2: Sidebands occurring as the result of modulating an impulse train, having a pulse repetition frequency f0,
with a sinusoid of frequency f1.
Thus, for carrier frequencies (f0) ≥ 40 kHz (twice the upper bound of human hearing), the
sidebands of the DC peak, located at ± f1, are the only peaks to fall within the range of
frequencies able to be heard by humans. Thus, we have that for a given modulation frequency,
f1, the plasma arc outputs that same frequency (plus others outside the range of human hearing)
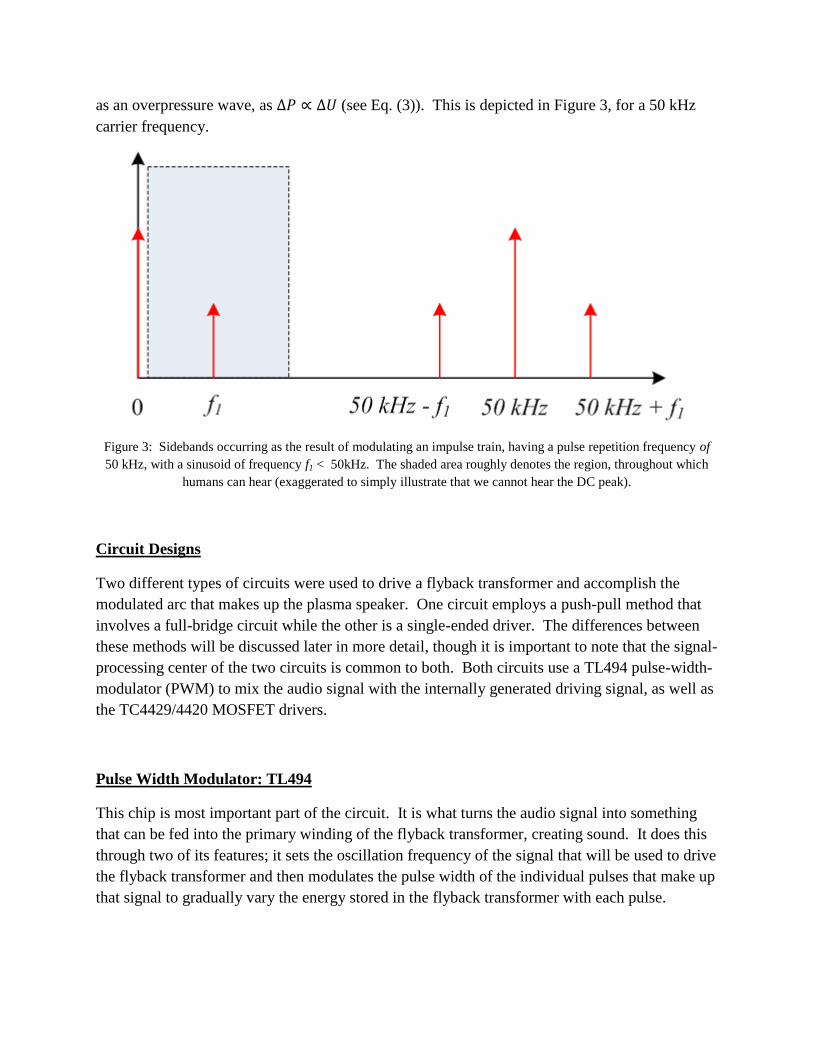
as an overpressure wave, as (see Eq. (3)). This is depicted in Figure 3, for a 50 kHz
carrier frequency.
Figure 3: Sidebands occurring as the result of modulating an impulse train, having a pulse repetition frequency of
50 kHz, with a sinusoid of frequency f1 < 50kHz. The shaded area roughly denotes the region, throughout which
humans can hear (exaggerated to simply illustrate that we cannot hear the DC peak).
Circuit Designs
Two different types of circuits were used to drive a flyback transformer and accomplish the
modulated arc that makes up the plasma speaker. One circuit employs a push-pull method that
involves a full-bridge circuit while the other is a single-ended driver. The differences between
these methods will be discussed later in more detail, though it is important to note that the signal-
processing center of the two circuits is common to both. Both circuits use a TL494 pulse-width-
modulator (PWM) to mix the audio signal with the internally generated driving signal, as well as
the TC4429/4420 MOSFET drivers.
Pulse Width Modulator: TL494
This chip is most important part of the circuit. It is what turns the audio signal into something
that can be fed into the primary winding of the flyback transformer, creating sound. It does this
through two of its features; it sets the oscillation frequency of the signal that will be used to drive
the flyback transformer and then modulates the pulse width of the individual pulses that make up
that signal to gradually vary the energy stored in the flyback transformer with each pulse.

The frequency that is output by the TL494 is controlled by pins 5 and 6, labeled CT and RT
respectively. CT is the total capacitance, in Farads, input into pin 5 and RT is the total resistance,
in Ohms, input into pin 6. The output frequency, Fosc, can be calculated with the following
equation:
The output frequency can then be controlled by using a potentiometer as RT. The idea here is to
set Fosc well above the audible range for humans (20 Hz to 20 KHz) so that all that is heard from
the arc is the audio signal, created by the pulse width modulation of this signal.
For the sake of explanation, let’s assume the output wave looks like a pure square wave that
varies between 0V and 12V (in reality, there are transient phenomena that distort the edges of the
square wave, but we’ll ignore that here):
The duty cycle of the wave is the amount of time the wave is on, at 12V, versus the amount of
time it is off, at 0V. In the wave above the duty cycle is 50%.
For a given voltage and frequency, as the duty cycle is increased, the flyback transformer spends
more time building up energy to release into each arc. The audio input is connected to the
TL494 to slightly vary the duty cycle, such that—over the course of many arcs—the energy
released with each arc is gradually changing. It is in this way that the audio signal is modulated
into the arc.
Also connected to the duty cycle pin is a potentiometer, which is used to set the neutral pulse
width, around which the audio signal modulates.
MOSFET Drivers: TC4429/4420
The TC4420 and TC 4429 are both MOSFET drivers. Their purpose is to quickly overcome the
gate capacitance of the MOSFETs, quickly turning them on or off. This leads to cleaner turn-
on/turn-off transitions in the MOSFETs and results a signal with less jitter. They also help to cut
down on switching losses, which can add to the problem of overheating in the MOSFETs. The
12V
0V
Vavg

MOSFET drivers are connected directly to the output of the TL494 chip. The TC4429 takes the
signal fed to it from the TL494 and inverts it whereas the TC4420 just passes the input signal.
High-Voltage Pulse Generator: Flyback Transformer
The output of the TL494 is passed through the MOSFET drivers, and then to the MOSFETs
themselves, which are used to switch the voltage across the primary windings of the flyback
transformer. What the transformer then does is takes the voltage put into the primary windings
and increases it drastically on the secondary coil through induction. Theoretically it should
follow this equation:
Where Vs and Vp represent the voltage at the secondary and primary, respectively, and Ns and Np
represent the number of turns of wire on the secondary and primary coils, respectively. The two
ends of the secondary coil are then where the high voltage arc that makes up the plasma speaker
is created.
Full-Bridge Circuit
Here is a schematic of the full-bridge circuit used.

Important Parts List:
- IRFZ46NPBF – N Channel MOSFET
- MBR1645G Diode (for D2 and D5)
- UF4002 Diode (for all other diodes)
This circuit has a signal coming in from both ends of the flyback primary. One side goes
through the TC4429 MOSFET driver while the other goes through the TC4420 MOSFET driver.
Therefore, when they reach the primary they are exactly 180o out of phase. This phase
difference results in the push-pull operation that characterizes the full-bridge driver. During the
first half-cycle, the driver is holding one end of the flyback transformer’s primary winding high,
while grounding the other end. During the second half-cycle, this is reversed.
Single-ended Circuit
The single-ended circuit is slightly less complex in comparison to the full-bridge circuit. The
single ended circuit is shown below.

Succinctly put, the single ended driver alternates between pulling one end of the flyback
transformer’s primary winding to ground (closed circuit), and letting it float (open circuit). The
arc occurs when as the circuit switches from closed (current flowing through the primary
winding) to open (no current flowing through the primary winding).
Electrode Assembly:
Due to the similarities between a plasma speaker and a TIG welder, we chose to use TIG welder
electrode rods (thoriated tungsten; 2% Th, 98% W). They were held by set screws embedded in
a machinable glass-ceramic (known as MACOR), which was then mounted to a plastic slide-rail,
constructed using machinable variant of polyethylene terephthalate (known as PETG). This
assembly is shown below, actively generating an arc triggered at 50 kHz.

Experimental Setup
Tests were run on the two circuits so that comparisons could be made. A function generator was
hooked into the audio input of the circuit so the audio frequency and amplitude could be
controlled. A pressure microphone was then placed close to the plasma arc to pick up the
fundamental and harmonic frequencies that the speaker put out. The microphone was then
connected to a spectrum analyzer which sent the data to a program in LabVIEW to be stored
onto a computer. A schematic of the setup is shown below. It should be noted that each circuit
used a different flyback transformer but everything else was identical for each circuit.
Results
Both circuits were tested throughout the entire audible range using the experimental setup
described above. Figures 4 and 5 show the spectral response of the two circuits for inputs
ranging from 100 Hz to 1 kHz, and at an input voltage of 700 mV (line-level).
Pressure
Microphone
Flyback
Transformer
7.0cm
1 cm

Figure 4: Frequency response of the full-bridge driver.
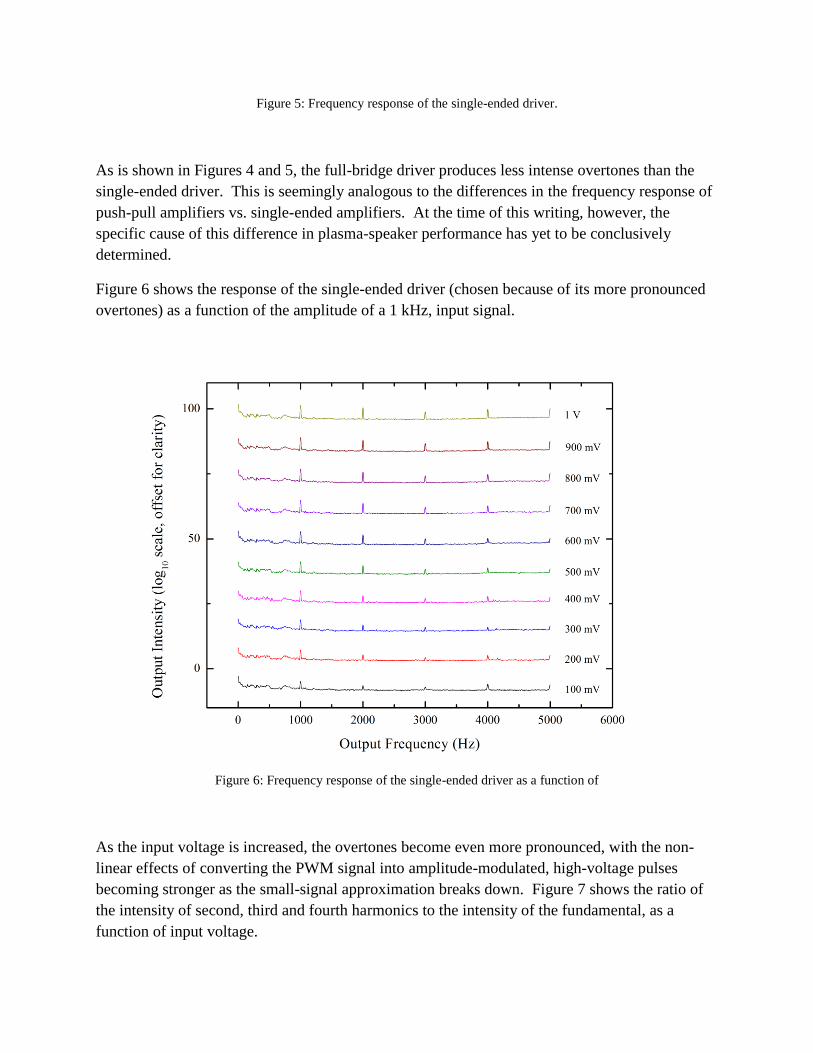
Figure 5: Frequency response of the single-ended driver.
As is shown in Figures 4 and 5, the full-bridge driver produces less intense overtones than the
single-ended driver. This is seemingly analogous to the differences in the frequency response of
push-pull amplifiers vs. single-ended amplifiers. At the time of this writing, however, the
specific cause of this difference in plasma-speaker performance has yet to be conclusively
determined.
Figure 6 shows the response of the single-ended driver (chosen because of its more pronounced
overtones) as a function of the amplitude of a 1 kHz, input signal.
Figure 6: Frequency response of the single-ended driver as a function of
As the input voltage is increased, the overtones become even more pronounced, with the non-
linear effects of converting the PWM signal into amplitude-modulated, high-voltage pulses
becoming stronger as the small-signal approximation breaks down. Figure 7 shows the ratio of
the intensity of second, third and fourth harmonics to the intensity of the fundamental, as a
function of input voltage.

Figure 7: Frequency response of the single-ended driver as a function of
From Figure 7, one we can see that the second and fourth harmonics are considerably stronger
than the third, with all three gaining in intensity (relative to the fundamental) as the input voltage
is increased. By the time the input amplitude reaches 1 V, the sum of the intensities of the first
three overtones reaches ~20% of the intensity of the fundamental. For a 1 kHz input signal, the
ratio of the intensity of the fundamental to the sum of the intensities of the overtones appears to
be minimized for inputs having an amplitude of 250 mV.
Conclusion:
Two different circuits for driving a plasma speaker were tested. Both circuits were capable of
amplitude-modulating a high-voltage impulse train, though they accomplished this task in
slightly different ways. The full-bridge driver was found to have lower-intensity overtones,
especially in the vicinity of 100 Hz to 1 kHz. Additionally, the spectral response of the single-
ended driver was measured while varying the amplitude of the input signal. It was found that for

a 1 kHz input signal, the ratio of the intensity of the fundamental to the sum of the intensities of
the overtones was minimized for an input amplitude of approximately 250 mV.