Embed Size (px)
Citation preview
The PharmaceuticalIndustry in Figures
2000 Edition
EFPIA represents the pharmaceutical industry operating in Europe.
Its mission is to promote pharmaceutical research and development in Europe in order to find better cures thatimprove human health worldwide.
Founded in 1978, its members consist of 18 national pharmaceutical industry associations and 45 pharmaceuticalcompanies involved in the research, development and manufacturing of medicinal products in Europe for human use.
Further details about the Federation and its activities can be obtained from:
EFPIAAvenue Louise 250, Box 91 - B-1050 Brussels - Belgium
Tel: +32.2.626.25.55 - Fax: +32.2.626.25.66www.efpia.org

5
CONTENTS
EFPIA members................................................................................................6
Key Figures .....................................................................................................9
Short and long term trends..............................................................................10
Structure of the pharmaceutical industry in Europe .............................................15
Pharmaceutical output ....................................................................................17
Pharmaceutical sales.......................................................................................19
Pharmaceutical Research & Development ...........................................................21
Biosciences ...................................................................................................25
Pharmaceutical trade ......................................................................................29
Employment ..................................................................................................35
Pharmaceutical reimbursement .........................................................................37
Pharmaceutical spending (as a share of health spending).....................................39
Health care expenditure ..................................................................................41
Value of medicines in the overall healthcare context ...........................................43
VAT rates applicable to medicines .....................................................................45
European Union enlargement ...........................................................................47
GDP, population, inflation, Euro rate.................................................................48
Notes ...........................................................................................................49
6
EEFPIA MEMBERS
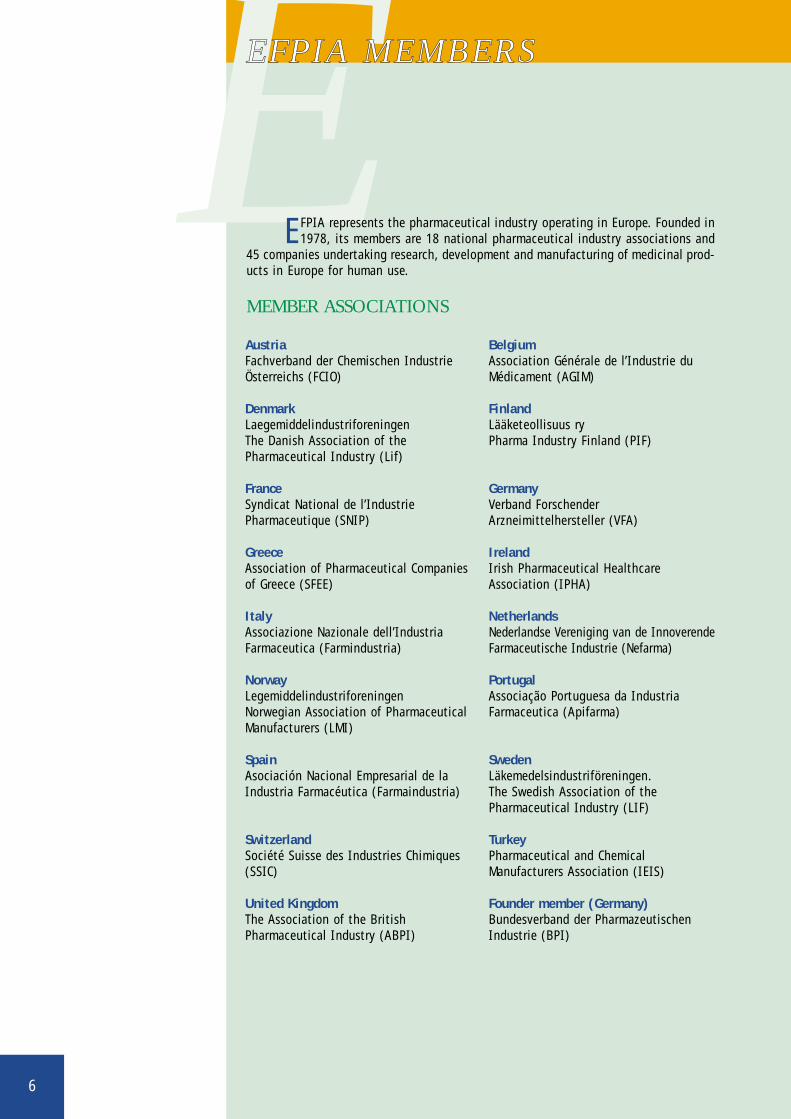
EFPIA represents the pharmaceutical industry operating in Europe. Founded in1978, its members are 18 national pharmaceutical industry associations and
45 companies undertaking research, development and manufacturing of medicinal prod-ucts in Europe for human use.
MEMBER ASSOCIATIONS
AustriaFachverband der Chemischen IndustrieÖsterreichs (FCIO)
DenmarkLaegemiddelindustriforeningenThe Danish Association of thePharmaceutical Industry (Lif)
FranceSyndicat National de l’IndustriePharmaceutique (SNIP)
GreeceAssociation of Pharmaceutical Companiesof Greece (SFEE)
ItalyAssociazione Nazionale dell’IndustriaFarmaceutica (Farmindustria)
NorwayLegemiddelindustriforeningenNorwegian Association of PharmaceuticalManufacturers (LMI)
SpainAsociación Nacional Empresarial de laIndustria Farmacéutica (Farmaindustria)
SwitzerlandSociété Suisse des Industries Chimiques(SSIC)
United KingdomThe Association of the BritishPharmaceutical Industry (ABPI)
BelgiumAssociation Générale de l’Industrie duMédicament (AGIM)
FinlandLääketeollisuus ryPharma Industry Finland (PIF)
GermanyVerband ForschenderArzneimittelhersteller (VFA)
IrelandIrish Pharmaceutical HealthcareAssociation (IPHA)
NetherlandsNederlandse Vereniging van de InnoverendeFarmaceutische Industrie (Nefarma)
PortugalAssociação Portuguesa da IndustriaFarmaceutica (Apifarma)
SwedenLäkemedelsindustriföreningen. The Swedish Association of thePharmaceutical Industry (LIF)
TurkeyPharmaceutical and ChemicalManufacturers Association (IEIS)
Founder member (Germany)Bundesverband der PharmazeutischenIndustrie (BPI)

7
MEMBER COMPANIES
FULL MEMBERS
Akzo Nobel Pharma The NetherlandsAlmirall-Prodesfarma SpainAres-Serono SwitzerlandAstraZeneca United KingdomAventis Pharma France / GermanyBaxter United StatesBayer GermanyBeaufour Ipsen FranceBoehringer Ingelheim GermanyBristol-Myers Squibb United StatesChiesi Farmaceutici ItalyDuPont Pharmaceuticals United StatesEli Lilly & Co United StatesLaboratorios Esteve SpainGlaxoWellcome United KingdomGrünenthal GermanyJohnson & Johnson United StatesKnoll GermanyLeo Pharmaceutical Products DenmarkH. Lundbeck DenmarkMenarini ItalyMerck KGaA GermanyMerck & Co United StatesNovartis SwitzerlandNovo Nordisk DenmarkPfizer United StatesPharmacia-Upjohn United StatesRoche SwitzerlandSanofi-Synthélabo FranceSchering GermanySchering-Plough United StatesSchwarz Pharma GermanySearle United StatesLaboratoires Servier FranceSigma-Tau ItalySmithKline Beecham United KingdomSolvay BelgiumUCB Pharma BelgiumWarner Lambert United StatesWyeth-Ayerst (AHP) United StatesZambon Group Italy
AFFILIATE MEMBERS
Amgen United StatesGruppo Ferrer SpainRecordati ItalyJ. Uriach & Cia Spain
8
1890 1900 1910 1920 1930 1940 1950 1960 1970 1980 1990 2000 2010
Focus on Molecular Structure
Accumulated Knowledge of Human, Cell and Molecular Biology
Com
plexit
y
Focus on Cell Biochemistry
Focus on Tissue Biochemistry
Serendipitous Observation
CNS drugs
Treatment for autoimmune disease
Cancer therapies
Beta-blockers
Anti-arthritis
Tranquilizers
Antihypertensives
Aspirin
Antibiotics
Sulfonamides
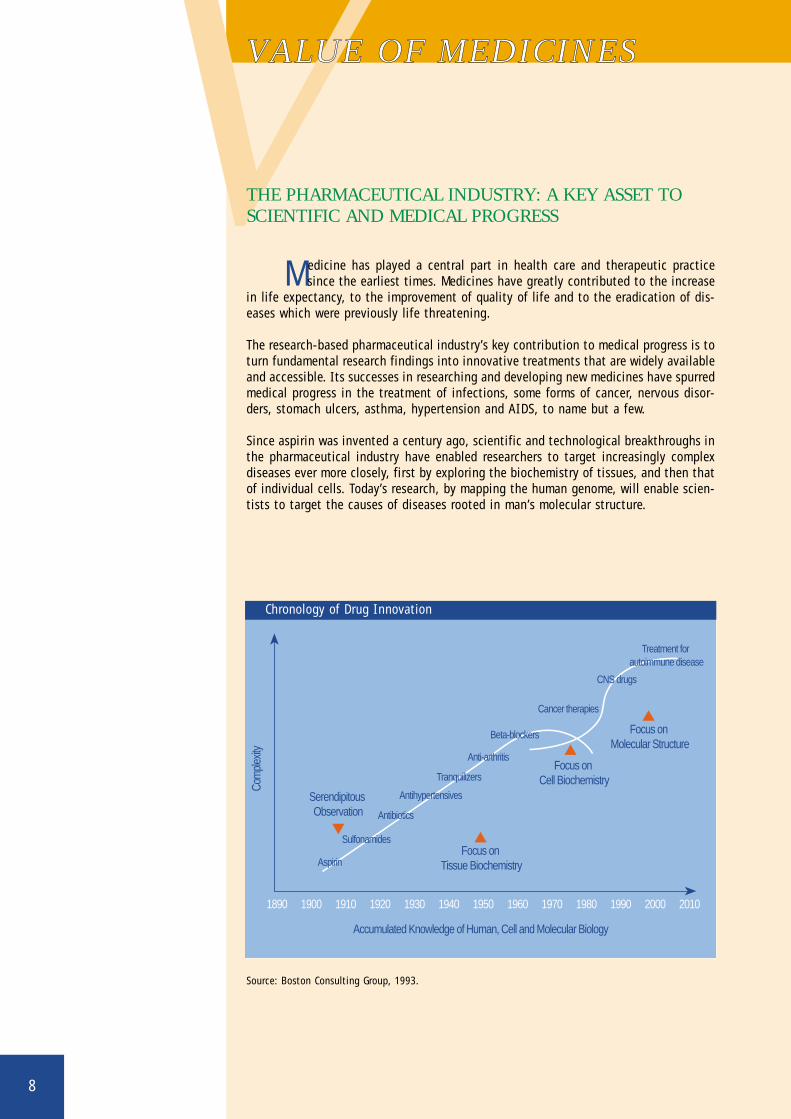
Chronology of Drug Innovation
VVALUE OF MEDICINES
THE PHARMACEUTICAL INDUSTRY: A KEY ASSET TOSCIENTIFIC AND MEDICAL PROGRESS
Medicine has played a central part in health care and therapeutic practicesince the earliest times. Medicines have greatly contributed to the increase
in life expectancy, to the improvement of quality of life and to the eradication of dis-eases which were previously life threatening.
The research-based pharmaceutical industry’s key contribution to medical progress is toturn fundamental research findings into innovative treatments that are widely availableand accessible. Its successes in researching and developing new medicines have spurredmedical progress in the treatment of infections, some forms of cancer, nervous disor-ders, stomach ulcers, asthma, hypertension and AIDS, to name but a few.
Since aspirin was invented a century ago, scientific and technological breakthroughs inthe pharmaceutical industry have enabled researchers to target increasingly complexdiseases ever more closely, first by exploring the biochemistry of tissues, and then thatof individual cells. Today’s research, by mapping the human genome, will enable scien-tists to target the causes of diseases rooted in man’s molecular structure.
Source: Boston Consulting Group, 1993.
9
KKEY FIGURES
THE PHARMACEUTICAL INDUSTRY: A KEY ASSET TOTHE EUROPEAN ECONOMY
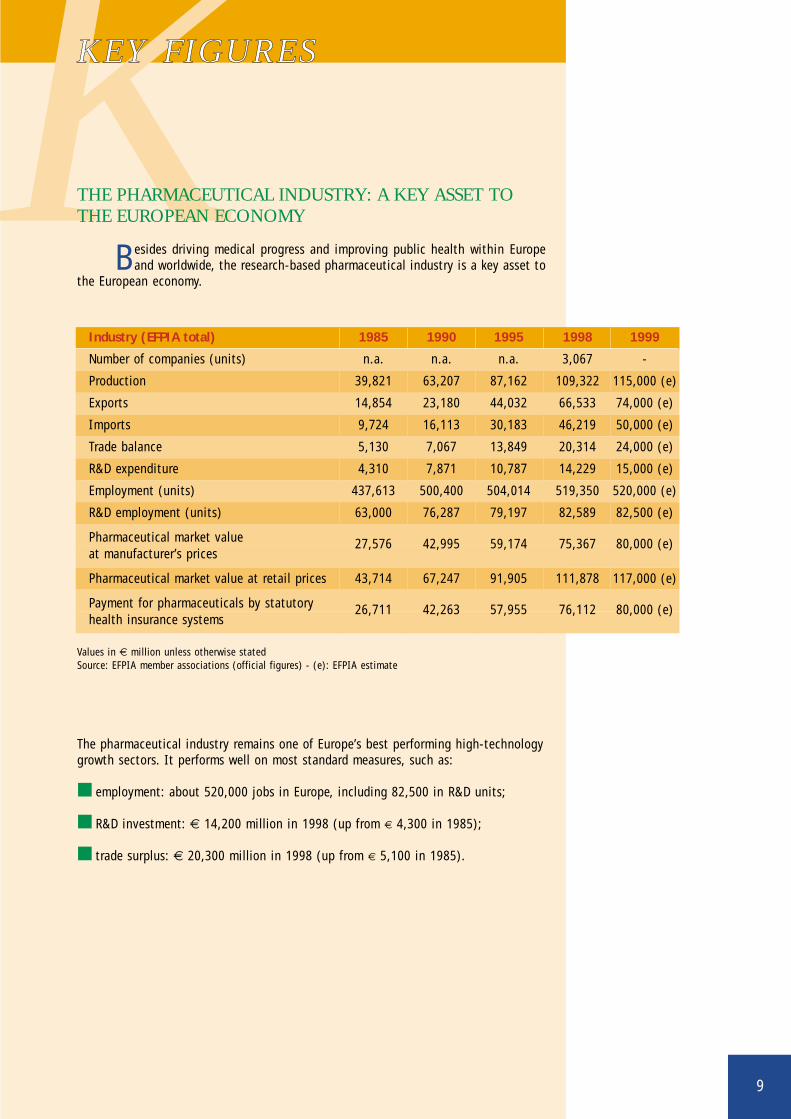
Besides driving medical progress and improving public health within Europeand worldwide, the research-based pharmaceutical industry is a key asset to
the European economy.
The pharmaceutical industry remains one of Europe’s best performing high-technologygrowth sectors. It performs well on most standard measures, such as:
■ employment: about 520,000 jobs in Europe, including 82,500 in R&D units;
■ R&D investment: € 14,200 million in 1998 (up from € 4,300 in 1985);
■ trade surplus: € 20,300 million in 1998 (up from € 5,100 in 1985).
Values in € million unless otherwise statedSource: EFPIA member associations (official figures) - (e): EFPIA estimate
Industry (EFPIA total) 1985 1990 1995 1998 1999
Number of companies (units) n.a. n.a. n.a. 3,067 -
Production 39,821 63,207 87,162 109,322 115,000 (e)
Exports 14,854 23,180 44,032 66,533 74,000 (e)
Imports 9,724 16,113 30,183 46,219 50,000 (e)
Trade balance 5,130 7,067 13,849 20,314 24,000 (e)
R&D expenditure 4,310 7,871 10,787 14,229 15,000 (e)
Employment (units) 437,613 500,400 504,014 519,350 520,000 (e)
R&D employment (units) 63,000 76,287 79,197 82,589 82,500 (e)
Pharmaceutical market value 27,576 42,995 59,174 75,367 80,000 (e)at manufacturer’s prices
Pharmaceutical market value at retail prices 43,714 67,247 91,905 111,878 117,000 (e)
Payment for pharmaceuticals by statutory 26,711 42,263 57,955 76,112 80,000 (e)health insurance systems
10
SSHORT AND LONG TERMTRENDS
GROWING PRESSURE ON EARNINGS
Constraints on the industry have tightened in recent years. In many countries,medicines have been the prime target of health cost containment measures,
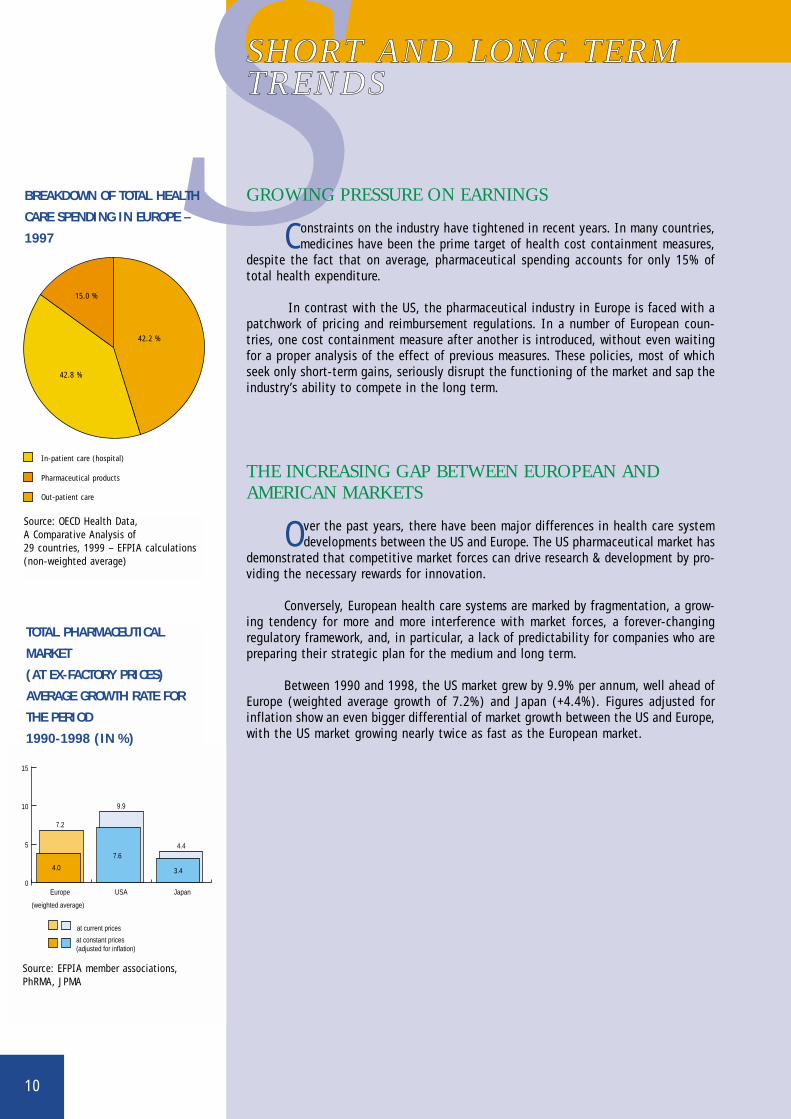
despite the fact that on average, pharmaceutical spending accounts for only 15% oftotal health expenditure.
In contrast with the US, the pharmaceutical industry in Europe is faced with apatchwork of pricing and reimbursement regulations. In a number of European coun-tries, one cost containment measure after another is introduced, without even waitingfor a proper analysis of the effect of previous measures. These policies, most of whichseek only short-term gains, seriously disrupt the functioning of the market and sap theindustry’s ability to compete in the long term.
THE INCREASING GAP BETWEEN EUROPEAN ANDAMERICAN MARKETS
Over the past years, there have been major differences in health care systemdevelopments between the US and Europe. The US pharmaceutical market has
demonstrated that competitive market forces can drive research & development by pro-viding the necessary rewards for innovation.
Conversely, European health care systems are marked by fragmentation, a grow-ing tendency for more and more interference with market forces, a forever-changingregulatory framework, and, in particular, a lack of predictability for companies who arepreparing their strategic plan for the medium and long term.
Between 1990 and 1998, the US market grew by 9.9% per annum, well ahead ofEurope (weighted average growth of 7.2%) and Japan (+4.4%). Figures adjusted forinflation show an even bigger differential of market growth between the US and Europe,with the US market growing nearly twice as fast as the European market.
42.8 %
42.2 %
15.0 %
Pharmaceutical products
In-patient care (hospital)
Out-patient care
Source: OECD Health Data, A Comparative Analysis of 29 countries, 1999 – EFPIA calculations(non-weighted average)
0
5
10
15
at constant prices(adjusted for inflation)
(weighted average)
at current prices
Japan
3.4
4.4
USA
9.9
Europe
7.2
4.0
7.6
BREAKDOWN OF TOTAL HEALTH
CARE SPENDING IN EUROPE –
1997
TOTAL PHARMACEUTICAL
MARKET
(AT EX-FACTORY PRICES)
AVERAGE GROWTH RATE FOR
THE PERIOD
1990-1998 (IN %)
Source: EFPIA member associations,PhRMA, JPMA
11
SOARING R&D COSTS
Pharmaceutical R&D is lengthy, costly and very risky. Due to the growingsophistication of products, the complexity of regulatory requirements and
"administrative" delays, it now takes an average of 12-13 years to turn a newly syn-thesized active substance into a marketable medicinal product.
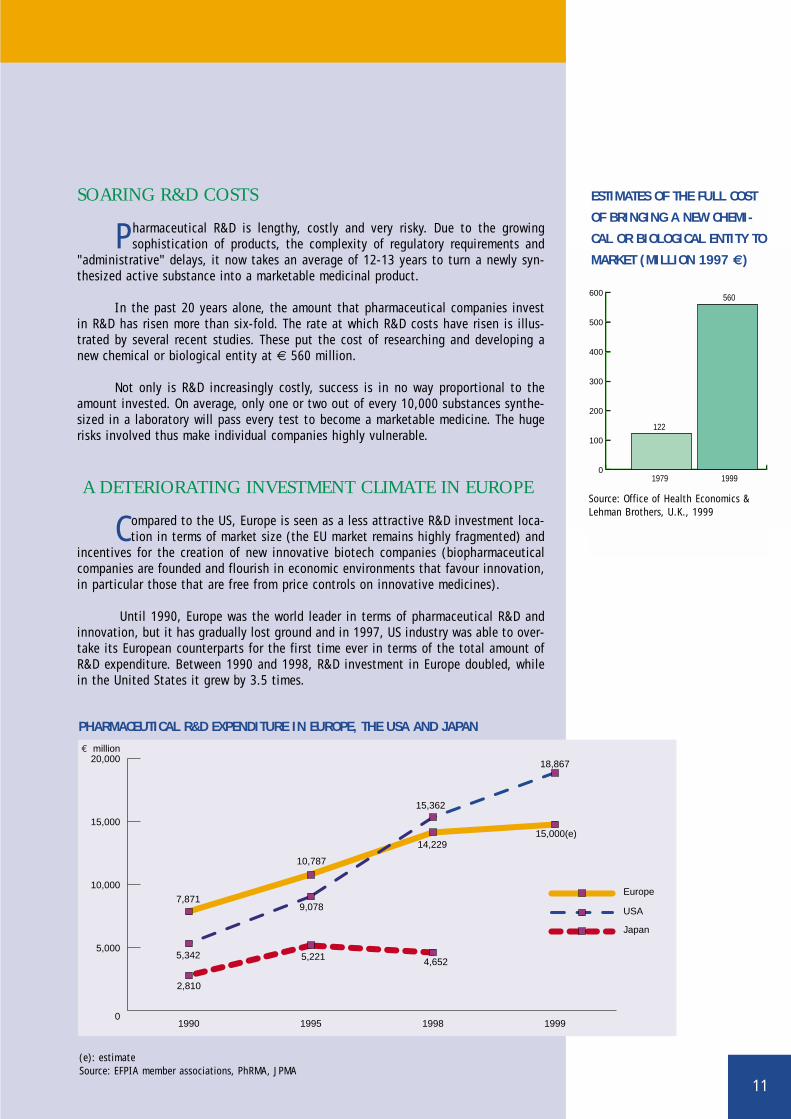
In the past 20 years alone, the amount that pharmaceutical companies investin R&D has risen more than six-fold. The rate at which R&D costs have risen is illus-trated by several recent studies. These put the cost of researching and developing anew chemical or biological entity at € 560 million.
Not only is R&D increasingly costly, success is in no way proportional to theamount invested. On average, only one or two out of every 10,000 substances synthe-sized in a laboratory will pass every test to become a marketable medicine. The hugerisks involved thus make individual companies highly vulnerable.
A DETERIORATING INVESTMENT CLIMATE IN EUROPE
Compared to the US, Europe is seen as a less attractive R&D investment loca-tion in terms of market size (the EU market remains highly fragmented) and
incentives for the creation of new innovative biotech companies (biopharmaceuticalcompanies are founded and flourish in economic environments that favour innovation,in particular those that are free from price controls on innovative medicines).
Until 1990, Europe was the world leader in terms of pharmaceutical R&D andinnovation, but it has gradually lost ground and in 1997, US industry was able to over-take its European counterparts for the first time ever in terms of the total amount ofR&D expenditure. Between 1990 and 1998, R&D investment in Europe doubled, whilein the United States it grew by 3.5 times.
0
100
200
300
400
500
600
1979 1999
122
560
Source: Office of Health Economics &Lehman Brothers, U.K., 1999
ESTIMATES OF THE FULL COST
OF BRINGING A NEW CHEMI-
CAL OR BIOLOGICAL ENTITY TO
MARKET (MILLION 1997 €)
0
5,000
10,000
15,000
20,000€ million
Japan
USA
Europe
1999199819951990
2,810
5,342
7,871
5,221
9,078
10,787
4,652
14,22915,000(e)
18,867
15,362
(e): estimateSource: EFPIA member associations, PhRMA, JPMA
PHARMACEUTICAL R&D EXPENDITURE IN EUROPE, THE USA AND JAPAN
12
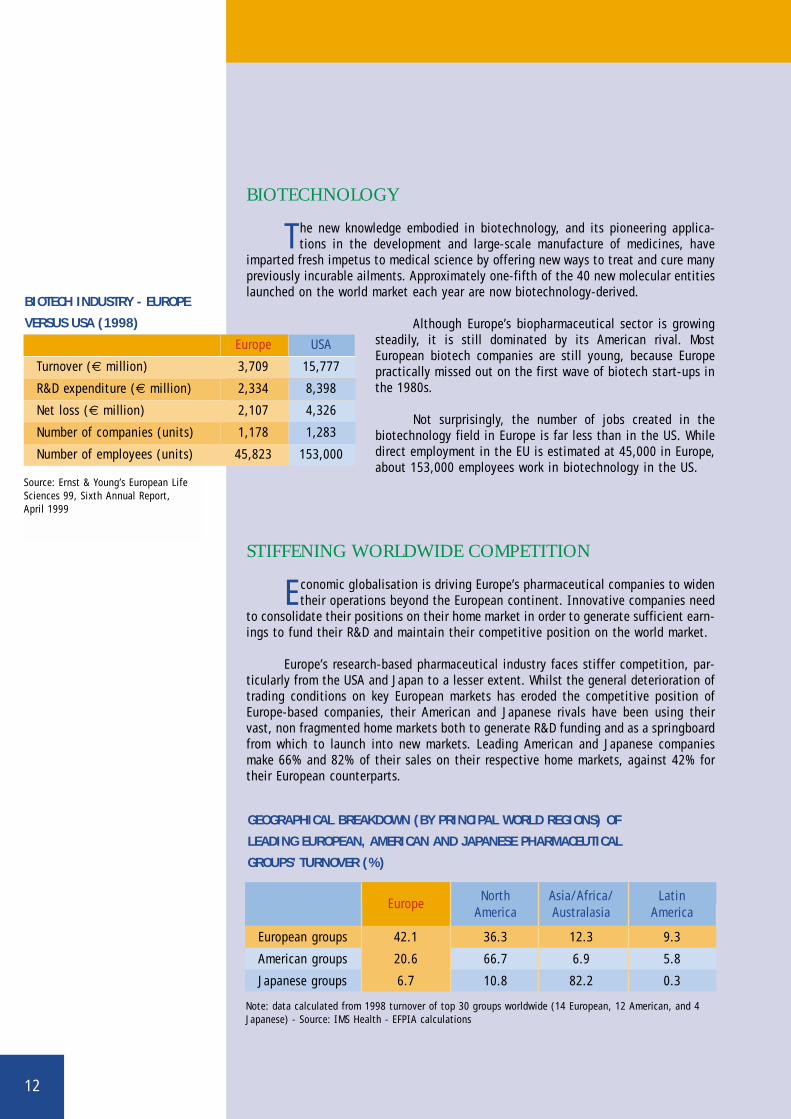
BIOTECHNOLOGY
The new knowledge embodied in biotechnology, and its pioneering applica-tions in the development and large-scale manufacture of medicines, have
imparted fresh impetus to medical science by offering new ways to treat and cure manypreviously incurable ailments. Approximately one-fifth of the 40 new molecular entitieslaunched on the world market each year are now biotechnology-derived.
Although Europe’s biopharmaceutical sector is growingsteadily, it is still dominated by its American rival. MostEuropean biotech companies are still young, because Europepractically missed out on the first wave of biotech start-ups inthe 1980s.
Not surprisingly, the number of jobs created in thebiotechnology field in Europe is far less than in the US. Whiledirect employment in the EU is estimated at 45,000 in Europe,about 153,000 employees work in biotechnology in the US.
STIFFENING WORLDWIDE COMPETITION
Economic globalisation is driving Europe’s pharmaceutical companies to widentheir operations beyond the European continent. Innovative companies need
to consolidate their positions on their home market in order to generate sufficient earn-ings to fund their R&D and maintain their competitive position on the world market.
Europe’s research-based pharmaceutical industry faces stiffer competition, par-ticularly from the USA and Japan to a lesser extent. Whilst the general deterioration oftrading conditions on key European markets has eroded the competitive position ofEurope-based companies, their American and Japanese rivals have been using theirvast, non fragmented home markets both to generate R&D funding and as a springboardfrom which to launch into new markets. Leading American and Japanese companiesmake 66% and 82% of their sales on their respective home markets, against 42% fortheir European counterparts.
Source: Ernst & Young’s European LifeSciences 99, Sixth Annual Report, April 1999
BIOTECH INDUSTRY - EUROPE
VERSUS USA (1998)
GEOGRAPHICAL BREAKDOWN (BY PRINCIPAL WORLD REGIONS) OF
LEADING EUROPEAN, AMERICAN AND JAPANESE PHARMACEUTICAL
GROUPS’ TURNOVER (%)
Note: data calculated from 1998 turnover of top 30 groups worldwide (14 European, 12 American, and 4Japanese) - Source: IMS Health - EFPIA calculations
Europe USA
Turnover (€ million) 3,709 15,777
R&D expenditure (€ million) 2,334 8,398
Net loss (€ million) 2,107 4,326
Number of companies (units) 1,178 1,283
Number of employees (units) 45,823 153,000
EuropeNorth Asia/Africa/ Latin
America Australasia America
European groups 42.1 36.3 12.3 9.3
American groups 20.6 66.7 6.9 5.8
Japanese groups 6.7 10.8 82.2 0.3
13
MERGERS AND ACQUISITIONS
The soaring cost of pharmaceutical R&D, the need to tap economies of scaleand achieve critical mass at international level, as well as the need to adapt
to change in the health care environment are the key factors behind restructuring andconsolidating the pharmaceutical industry.
The drive to pool R&D efforts and manufacturing at international level is set tocontinue in coming years. The wave of mergers and acquisitions now sweeping throughthe pharmaceutical industry in Europe should be viewed not as profit maximization, jobshedding or the destruction of the industrial fabric, but as an essential element of theindustry’s long-term competitiveness.
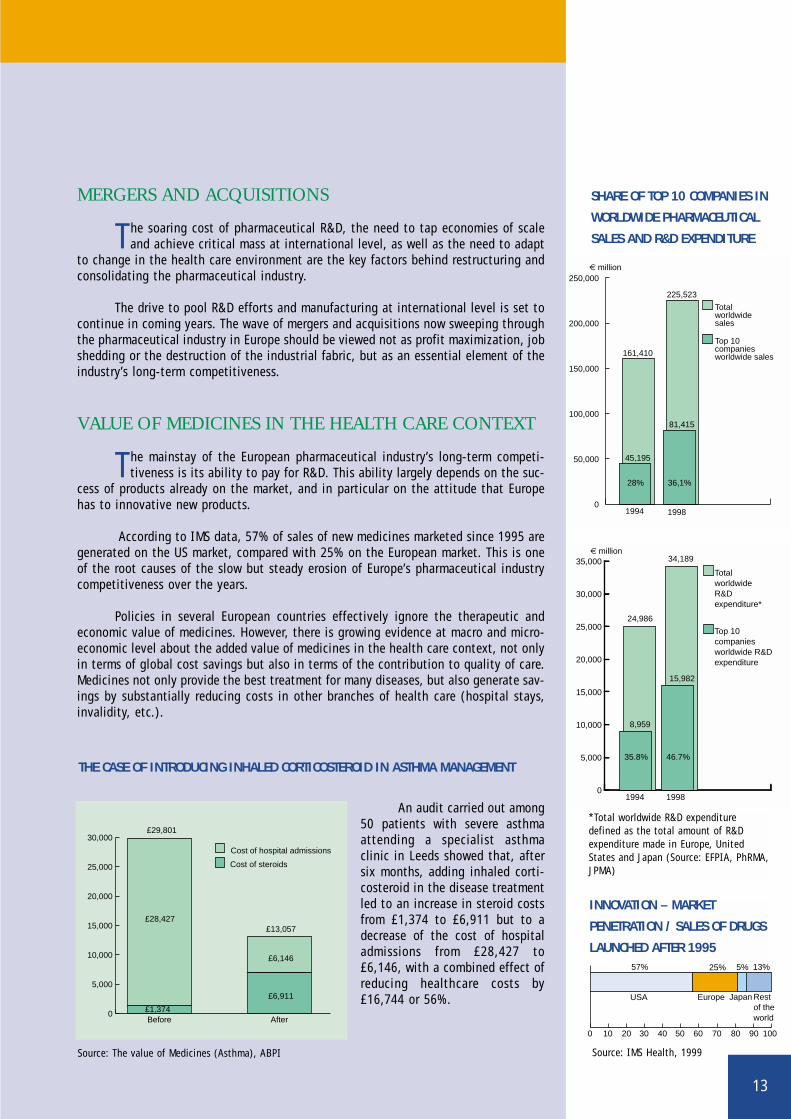
VALUE OF MEDICINES IN THE HEALTH CARE CONTEXT
The mainstay of the European pharmaceutical industry’s long-term competi-tiveness is its ability to pay for R&D. This ability largely depends on the suc-
cess of products already on the market, and in particular on the attitude that Europehas to innovative new products.
According to IMS data, 57% of sales of new medicines marketed since 1995 aregenerated on the US market, compared with 25% on the European market. This is oneof the root causes of the slow but steady erosion of Europe’s pharmaceutical industrycompetitiveness over the years.
Policies in several European countries effectively ignore the therapeutic andeconomic value of medicines. However, there is growing evidence at macro and micro-economic level about the added value of medicines in the health care context, not onlyin terms of global cost savings but also in terms of the contribution to quality of care.Medicines not only provide the best treatment for many diseases, but also generate sav-ings by substantially reducing costs in other branches of health care (hospital stays,invalidity, etc.).
An audit carried out among50 patients with severe asthmaattending a specialist asthmaclinic in Leeds showed that, aftersix months, adding inhaled corti-costeroid in the disease treatmentled to an increase in steroid costsfrom £1,374 to £6,911 but to adecrease of the cost of hospitaladmissions from £28,427 to£6,146, with a combined effect ofreducing healthcare costs by£16,744 or 56%.
0
50,000
100,000
150,000
200,000
250,000
Top 10companies worldwide sales
Totalworldwidesales
19981994
36,1%28%
45,195
81,415
225,523
161,410
€ million
0
5,000
10,000
15,000
20,000
25,000
30,000
35,000
Top 10 companies worldwide R&D expenditure
Total worldwide R&D expenditure*
19981994
46.7%35.8%
8,959
15,982
34,189
24,986
€ million
SHARE OF TOP 10 COMPANIES IN
WORLDWIDE PHARMACEUTICAL
SALES AND R&D EXPENDITURE
THE CASE OF INTRODUCING INHALED CORTICOSTEROID IN ASTHMA MANAGEMENT
Rest of the world
JapanEuropeUSA
0 10 20 504030 70 8060 90 100
25% 5% 13%57%
INNOVATION – MARKET
PENETRATION / SALES OF DRUGS
LAUNCHED AFTER 1995
Source: IMS Health, 1999
0
5,000
10,000
15,000
20,000
25,000
30,000
Cost of hospital admissions
Cost of steroids
£6,911
£6,146
£13,057
£1,374
£28,427
£29,801
AfterBefore
*Total worldwide R&D expendituredefined as the total amount of R&Dexpenditure made in Europe, UnitedStates and Japan (Source: EFPIA, PhRMA,JPMA)
Source: The value of Medicines (Asthma), ABPI
14
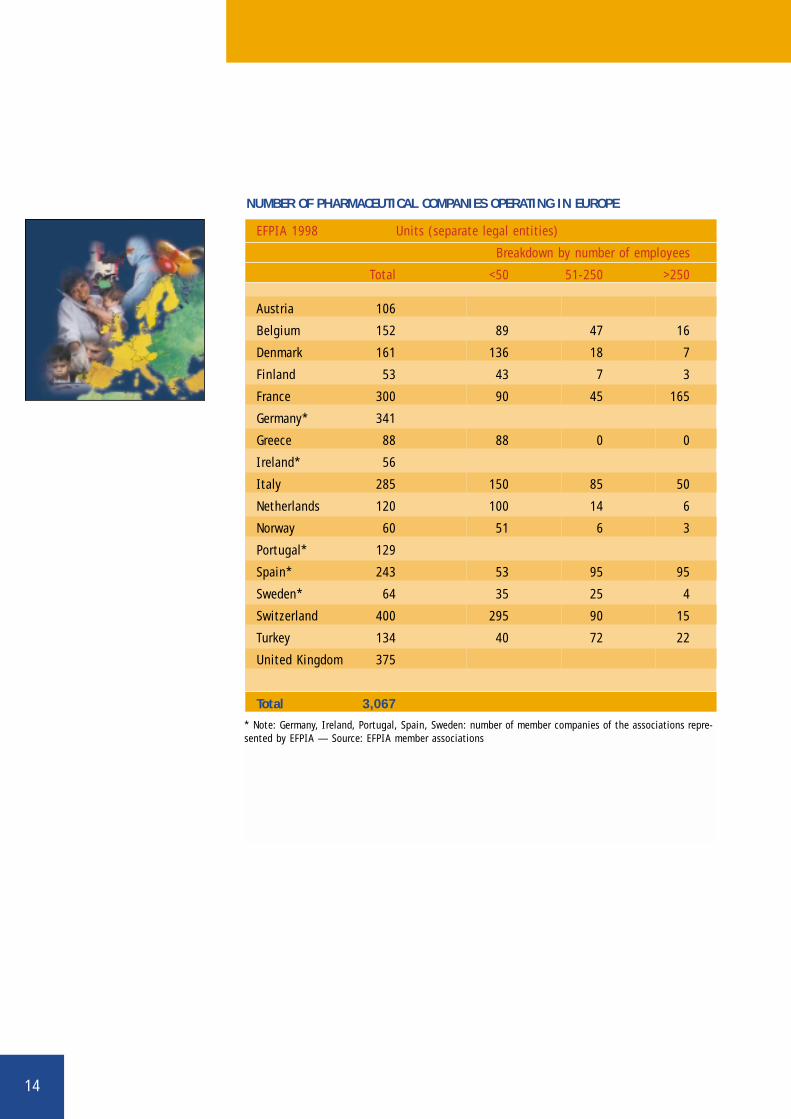
NUMBER OF PHARMACEUTICAL COMPANIES OPERATING IN EUROPE
EFPIA 1998 Units (separate legal entities)
Breakdown by number of employees
Total <50 51-250 >250
Austria 106
Belgium 152 89 47 16
Denmark 161 136 18 7
Finland 53 43 7 3
France 300 90 45 165
Germany* 341
Greece 88 88 0 0
Ireland* 56
Italy 285 150 85 50
Netherlands 120 100 14 6
Norway 60 51 6 3
Portugal* 129
Spain* 243 53 95 95
Sweden* 64 35 25 4
Switzerland 400 295 90 15
Turkey 134 40 72 22
United Kingdom 375
Total 3,067
* Note: Germany, Ireland, Portugal, Spain, Sweden: number of member companies of the associations repre-sented by EFPIA — Source: EFPIA member associations
15
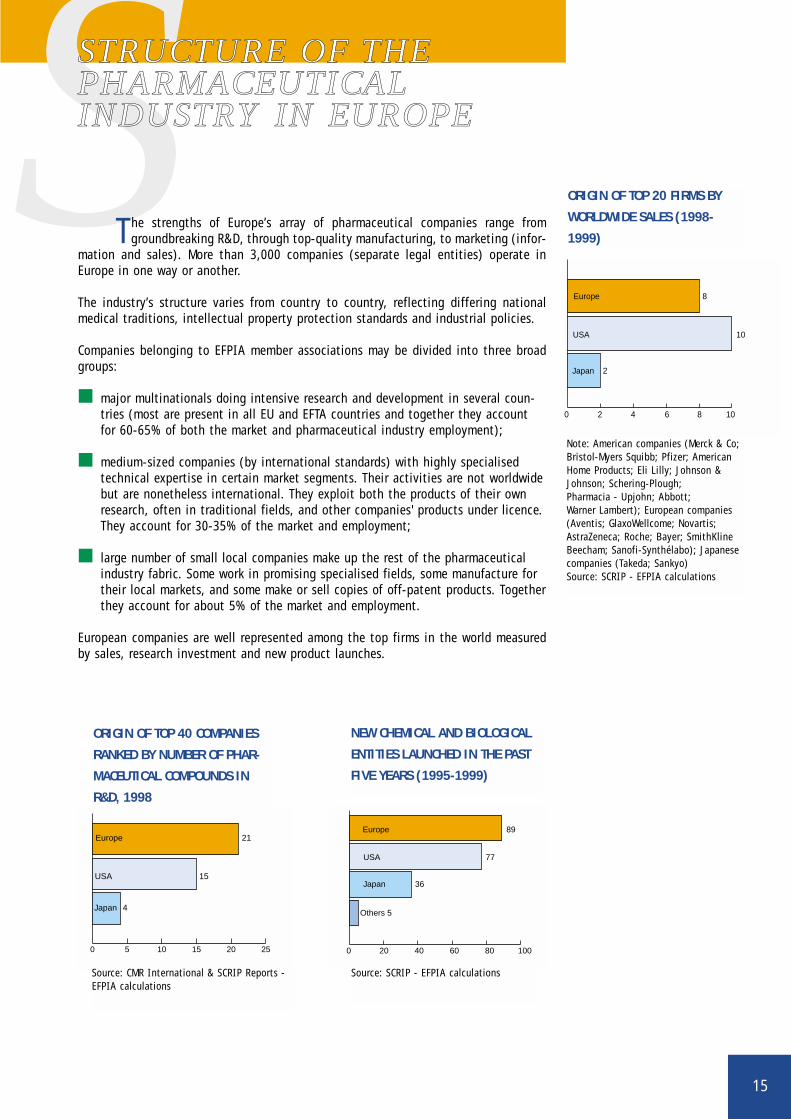
SSTRUCTURE OF THEPHARMACEUTICAL INDUSTRY IN EUROPE
The strengths of Europe’s array of pharmaceutical companies range fromgroundbreaking R&D, through top-quality manufacturing, to marketing (infor-
mation and sales). More than 3,000 companies (separate legal entities) operate inEurope in one way or another.
The industry’s structure varies from country to country, reflecting differing nationalmedical traditions, intellectual property protection standards and industrial policies.
Companies belonging to EFPIA member associations may be divided into three broadgroups:
■ major multinationals doing intensive research and development in several coun-tries (most are present in all EU and EFTA countries and together they accountfor 60-65% of both the market and pharmaceutical industry employment);
■ medium-sized companies (by international standards) with highly specialisedtechnical expertise in certain market segments. Their activities are not worldwidebut are nonetheless international. They exploit both the products of their ownresearch, often in traditional fields, and other companies' products under licence.They account for 30-35% of the market and employment;
■ large number of small local companies make up the rest of the pharmaceuticalindustry fabric. Some work in promising specialised fields, some manufacture fortheir local markets, and some make or sell copies of off-patent products. Togetherthey account for about 5% of the market and employment.
European companies are well represented among the top firms in the world measuredby sales, research investment and new product launches.
0 2 4 6 8 10
Japan
Europe
USA
2
8
10
ORIGIN OF TOP 20 FIRMS BY
WORLDWIDE SALES (1998-
1999)
0 5 10 15 20 25
Japan 4
Europe 21
USA 15
ORIGIN OF TOP 40 COMPANIES
RANKED BY NUMBER OF PHAR-
MACEUTICAL COMPOUNDS IN
R&D, 1998
0 20 40 60 80 100
Others 5
Japan 36
USA 77
Europe 89
NEW CHEMICAL AND BIOLOGICAL
ENTITIES LAUNCHED IN THE PAST
FIVE YEARS (1995-1999)
Note: American companies (Merck & Co;Bristol-Myers Squibb; Pfizer; AmericanHome Products; Eli Lilly; Johnson &Johnson; Schering-Plough; Pharmacia - Upjohn; Abbott; Warner Lambert); European companies(Aventis; GlaxoWellcome; Novartis;AstraZeneca; Roche; Bayer; SmithKlineBeecham; Sanofi-Synthélabo); Japanesecompanies (Takeda; Sankyo)Source: SCRIP - EFPIA calculations
Source: CMR International & SCRIP Reports -EFPIA calculations
Source: SCRIP - EFPIA calculations
16
EFPIA 1998 € million
Austria 1,274
Belgium 3,450
Denmark 2,447
Finland 575
France 21,305
Germany 17,691
Greece 438
Ireland 4,439
Italy 12,448
Netherlands 4,533
Norway 228
Portugal 396
Spain 6,275
Sweden 3,749
Switzerland 11,899
Turkey 1,623
United Kingdom 16,552
Total 109,322
Note: All data based on SITC 54 (SITC54 Rev.3 + sulphonamides);Portugal: 1995 data;Sweden: 1997 data;Belgium, Denmark, France,Greece, Ireland, Italy,Netherlands, Portugal, Spain,Switzerland, United Kingdom:estimate;Denmark, Portugal, Spain,Switzerland, Turkey: veterinaryproducts excluded.
Source: EFPIA member associations(official figures)
PHARMACEUTICAL PRODUCTION
17
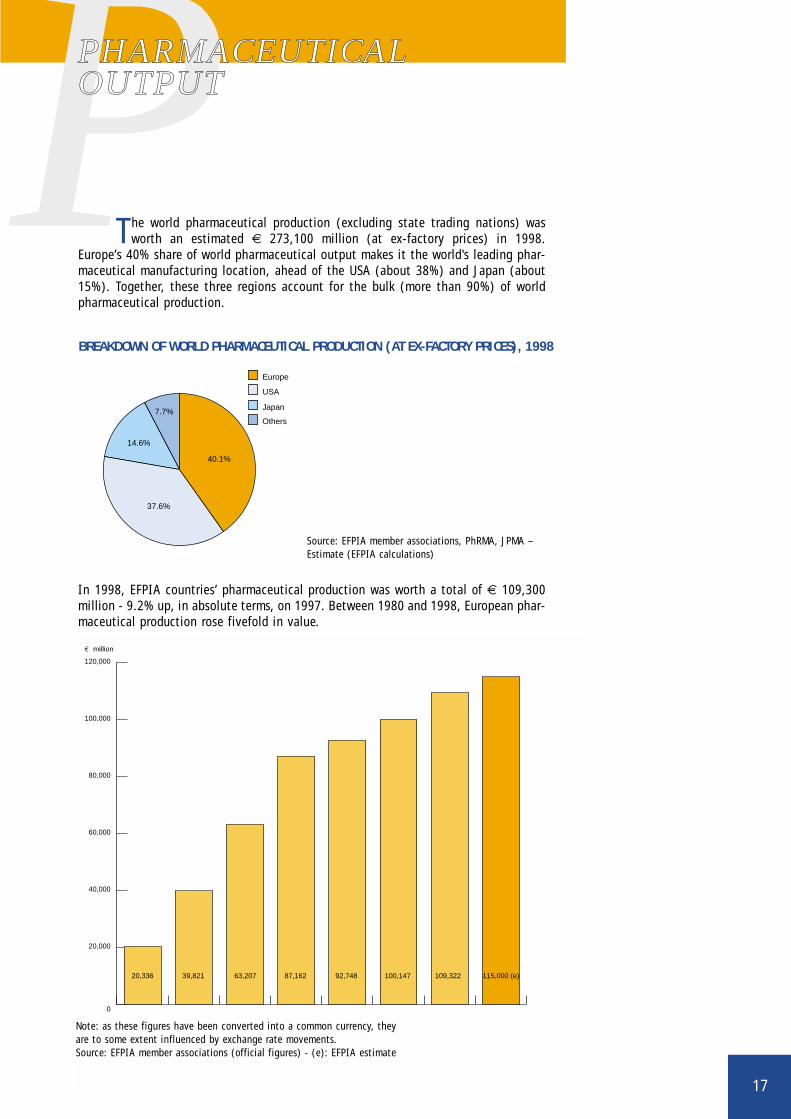
P40.1%
7.7%
14.6%
37.6%
Europe
USA
Japan
Others
BREAKDOWN OF WORLD PHARMACEUTICAL PRODUCTION (AT EX-FACTORY PRICES), 1998
Source: EFPIA member associations, PhRMA, JPMA – Estimate (EFPIA calculations)
0
20,000
40,000
60,000
80,000
100,000
120,000
20,336 39,821 63,207 87,162 92,748 100,147 109,322 115,000 (e)
€ million
Note: as these figures have been converted into a common currency, theyare to some extent influenced by exchange rate movements.Source: EFPIA member associations (official figures) - (e): EFPIA estimate
PHARMACEUTICAL OUTPUT
The world pharmaceutical production (excluding state trading nations) wasworth an estimated € 273,100 million (at ex-factory prices) in 1998.
Europe’s 40% share of world pharmaceutical output makes it the world's leading phar-maceutical manufacturing location, ahead of the USA (about 38%) and Japan (about15%). Together, these three regions account for the bulk (more than 90%) of worldpharmaceutical production.
In 1998, EFPIA countries’ pharmaceutical production was worth a total of € 109,300million - 9.2% up, in absolute terms, on 1997. Between 1980 and 1998, European phar-maceutical production rose fivefold in value.
18
Note: Medicinal products as defined by Directive65/65/EEC;France, Greece, Ireland, Spain, Sweden:estimate
Source: EFPIA member associations (official figures)
The figures above are for pharmaceutical sales, at ex-factory prices, through all distribution channels(pharmacies, hospitals, dispensing doctors, supermar-kets, etc.), whether dispensed on prescription or atthe patient’s request. Samples and sales of veterinarymedicines are excluded.
PHARMACEUTICAL MARKET VALUE (AT EX-FACTORY PRICES)
EFPIA 1998 € million
Austria 1,481
Belgium 2,274
Denmark 872
Finland 959
France 14,950
Germany 16,528
Greece 1,271
Ireland 523
Italy 9,662
Netherlands 2,025
Norway 673
Portugal 1,794
Spain 5,891
Sweden 1,795
Switzerland 1,627
Turkey 1,981
United Kingdom 11,061
Total 75,367
19
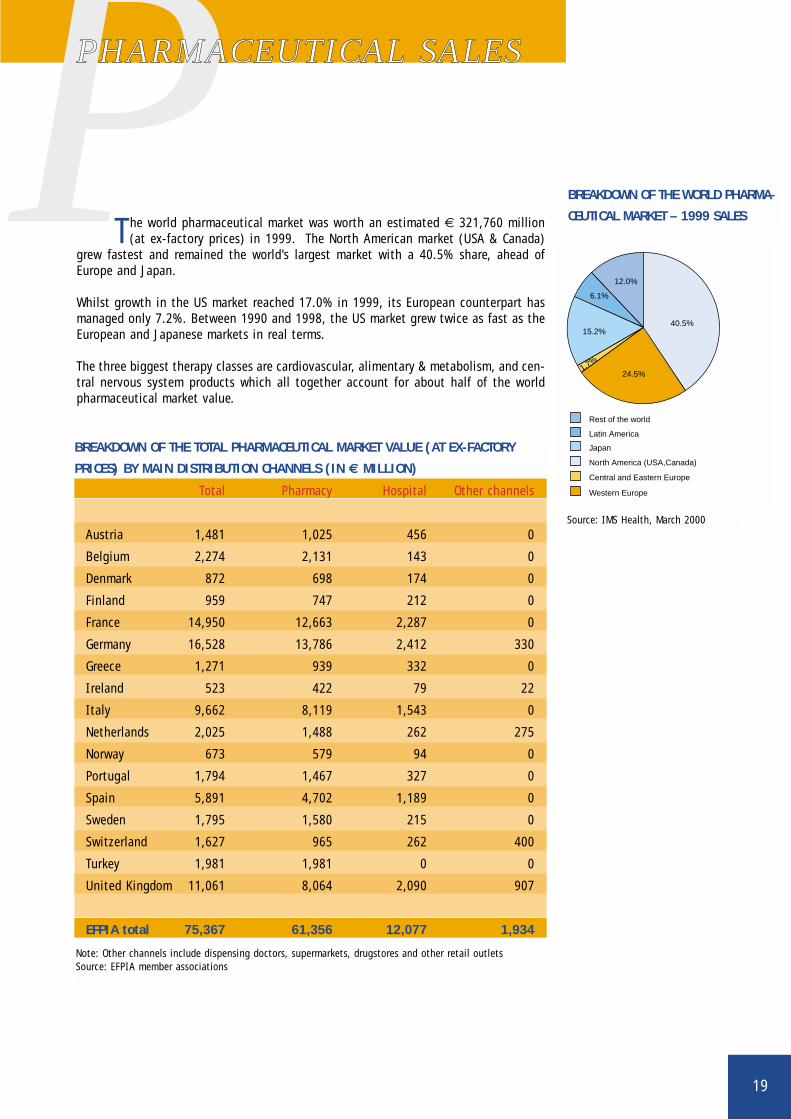
PPHARMACEUTICAL SALES
The world pharmaceutical market was worth an estimated € 321,760 million(at ex-factory prices) in 1999. The North American market (USA & Canada)
grew fastest and remained the world's largest market with a 40.5% share, ahead ofEurope and Japan.
Whilst growth in the US market reached 17.0% in 1999, its European counterpart hasmanaged only 7.2%. Between 1990 and 1998, the US market grew twice as fast as theEuropean and Japanese markets in real terms.
The three biggest therapy classes are cardiovascular, alimentary & metabolism, and cen-tral nervous system products which all together account for about half of the worldpharmaceutical market value.
Total Pharmacy Hospital Other channels
Austria 1,481 1,025 456 0
Belgium 2,274 2,131 143 0
Denmark 872 698 174 0
Finland 959 747 212 0
France 14,950 12,663 2,287 0
Germany 16,528 13,786 2,412 330
Greece 1,271 939 332 0
Ireland 523 422 79 22
Italy 9,662 8,119 1,543 0
Netherlands 2,025 1,488 262 275
Norway 673 579 94 0
Portugal 1,794 1,467 327 0
Spain 5,891 4,702 1,189 0
Sweden 1,795 1,580 215 0
Switzerland 1,627 965 262 400
Turkey 1,981 1,981 0 0
United Kingdom 11,061 8,064 2,090 907
EFPIA total 75,367 61,356 12,077 1,934
BREAKDOWN OF THE TOTAL PHARMACEUTICAL MARKET VALUE (AT EX-FACTORY
PRICES) BY MAIN DISTRIBUTION CHANNELS (IN € MILLION)
Note: Other channels include dispensing doctors, supermarkets, drugstores and other retail outletsSource: EFPIA member associations
BREAKDOWN OF THE WORLD PHARMA-
CEUTICAL MARKET – 1999 SALES
Source: IMS Health, March 2000
Rest of the world
Latin America
Japan
Central and Eastern Europe
Western Europe
North America (USA,Canada)
40.5%
24.5%
15.2%
12.0%
6.1%
1.7%
20
EFPIA 1998 € million
Austria n.a.
Belgium 617
Denmark 473
Finland 130
France 2,424
Germany 2,758
Greece n.a.
Ireland 25
Italy 759
Netherlands 225
Norway 78
Portugal n.a.
Spain 296
Sweden 1,022
Switzerland 1,726
Turkey n.a.
United Kingdom 3,696
Total 14,229
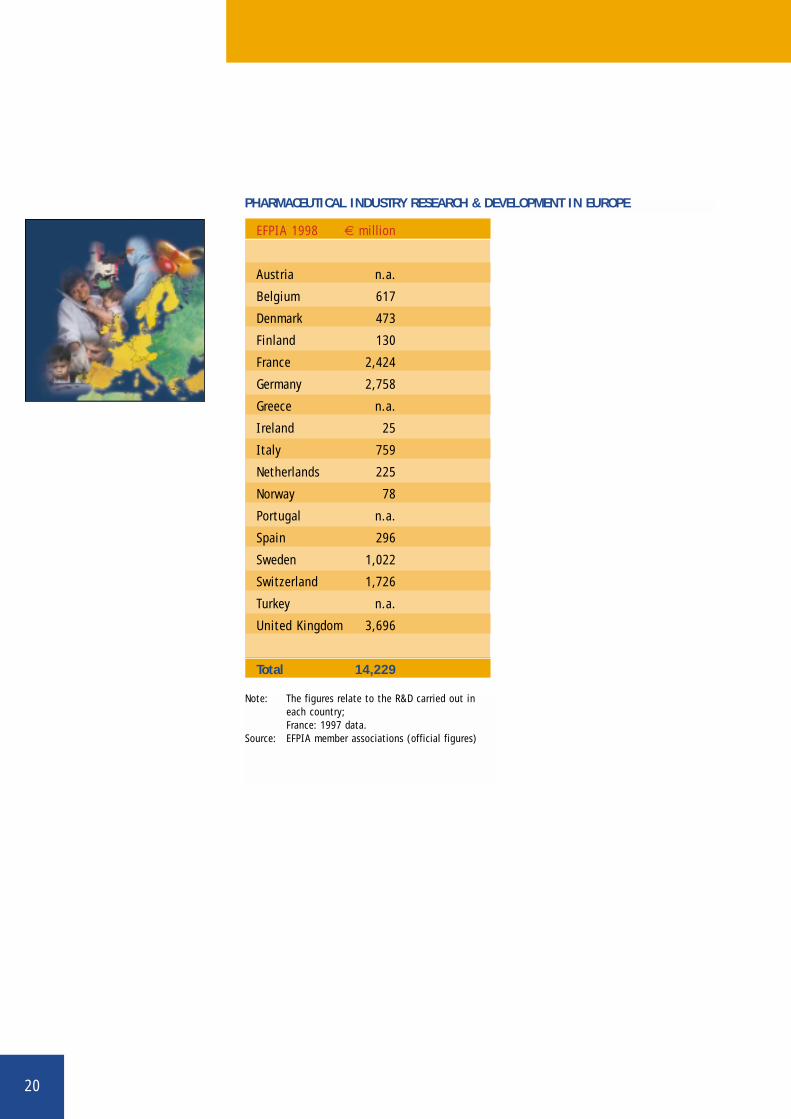
PHARMACEUTICAL INDUSTRY RESEARCH & DEVELOPMENT IN EUROPE
Note: The figures relate to the R&D carried out ineach country;France: 1997 data.
Source: EFPIA member associations (official figures)
21
PPHARMACEUTICALRESEARCH & DEVELOPMENT
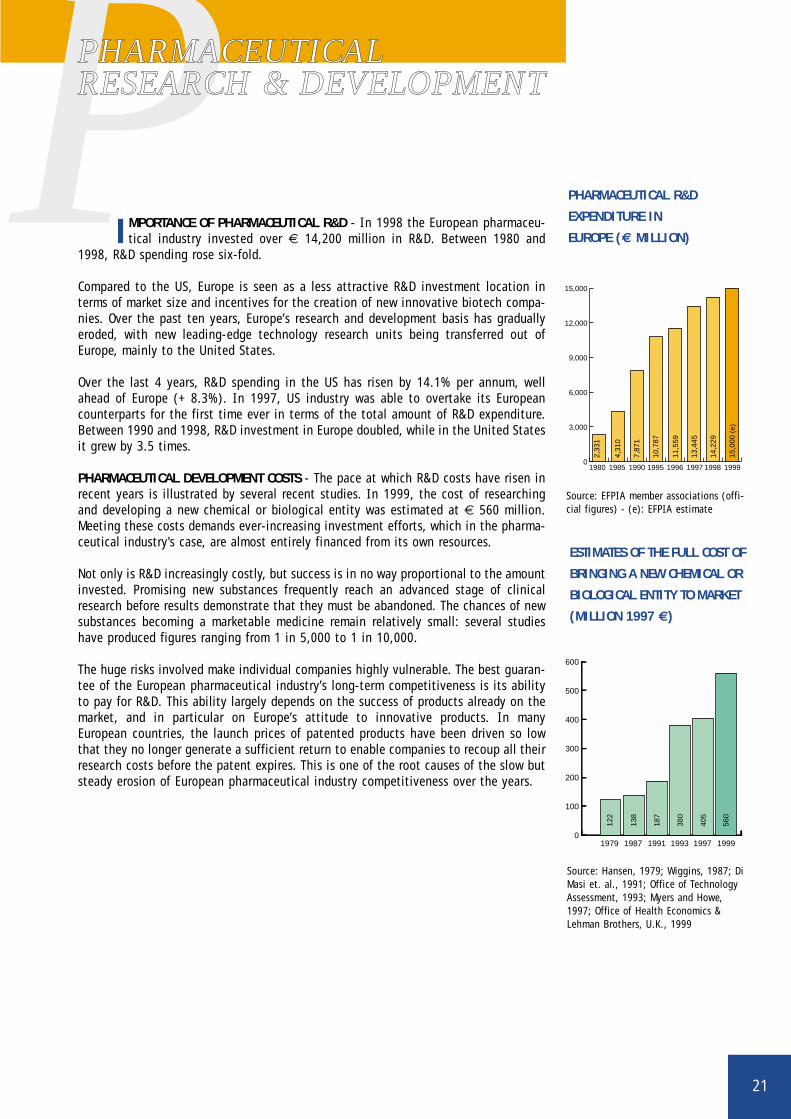
IMPORTANCE OF PHARMACEUTICAL R&D - In 1998 the European pharmaceu-tical industry invested over € 14,200 million in R&D. Between 1980 and
1998, R&D spending rose six-fold.
Compared to the US, Europe is seen as a less attractive R&D investment location interms of market size and incentives for the creation of new innovative biotech compa-nies. Over the past ten years, Europe’s research and development basis has graduallyeroded, with new leading-edge technology research units being transferred out ofEurope, mainly to the United States.
Over the last 4 years, R&D spending in the US has risen by 14.1% per annum, wellahead of Europe (+ 8.3%). In 1997, US industry was able to overtake its Europeancounterparts for the first time ever in terms of the total amount of R&D expenditure.Between 1990 and 1998, R&D investment in Europe doubled, while in the United Statesit grew by 3.5 times.
PHARMACEUTICAL DEVELOPMENT COSTS - The pace at which R&D costs have risen inrecent years is illustrated by several recent studies. In 1999, the cost of researchingand developing a new chemical or biological entity was estimated at € 560 million.Meeting these costs demands ever-increasing investment efforts, which in the pharma-ceutical industry's case, are almost entirely financed from its own resources.
Not only is R&D increasingly costly, but success is in no way proportional to the amountinvested. Promising new substances frequently reach an advanced stage of clinicalresearch before results demonstrate that they must be abandoned. The chances of newsubstances becoming a marketable medicine remain relatively small: several studieshave produced figures ranging from 1 in 5,000 to 1 in 10,000.
The huge risks involved make individual companies highly vulnerable. The best guaran-tee of the European pharmaceutical industry’s long-term competitiveness is its abilityto pay for R&D. This ability largely depends on the success of products already on themarket, and in particular on Europe’s attitude to innovative products. In manyEuropean countries, the launch prices of patented products have been driven so lowthat they no longer generate a sufficient return to enable companies to recoup all theirresearch costs before the patent expires. This is one of the root causes of the slow butsteady erosion of European pharmaceutical industry competitiveness over the years.
Source: Hansen, 1979; Wiggins, 1987; DiMasi et. al., 1991; Office of TechnologyAssessment, 1993; Myers and Howe,1997; Office of Health Economics &Lehman Brothers, U.K., 1999
ESTIMATES OF THE FULL COST OF
BRINGING A NEW CHEMICAL OR
BIOLOGICAL ENTITY TO MARKET
(MILLION 1997 €)
0
100
200
300
400
500
600
1979 1987 1991 1993 1997 1999
122
138
187
380
405
560
0
3,000
6,000
9,000
12,000
15,000
19991998199719961995199019851980
2,33
1
4,31
0
7,87
1
10,7
87
11,5
59
13,4
45
14,2
29
15,0
00 (
e)
Source: EFPIA member associations (offi-cial figures) - (e): EFPIA estimate
PHARMACEUTICAL R&D
EXPENDITURE IN
EUROPE (€ MILLION)
22
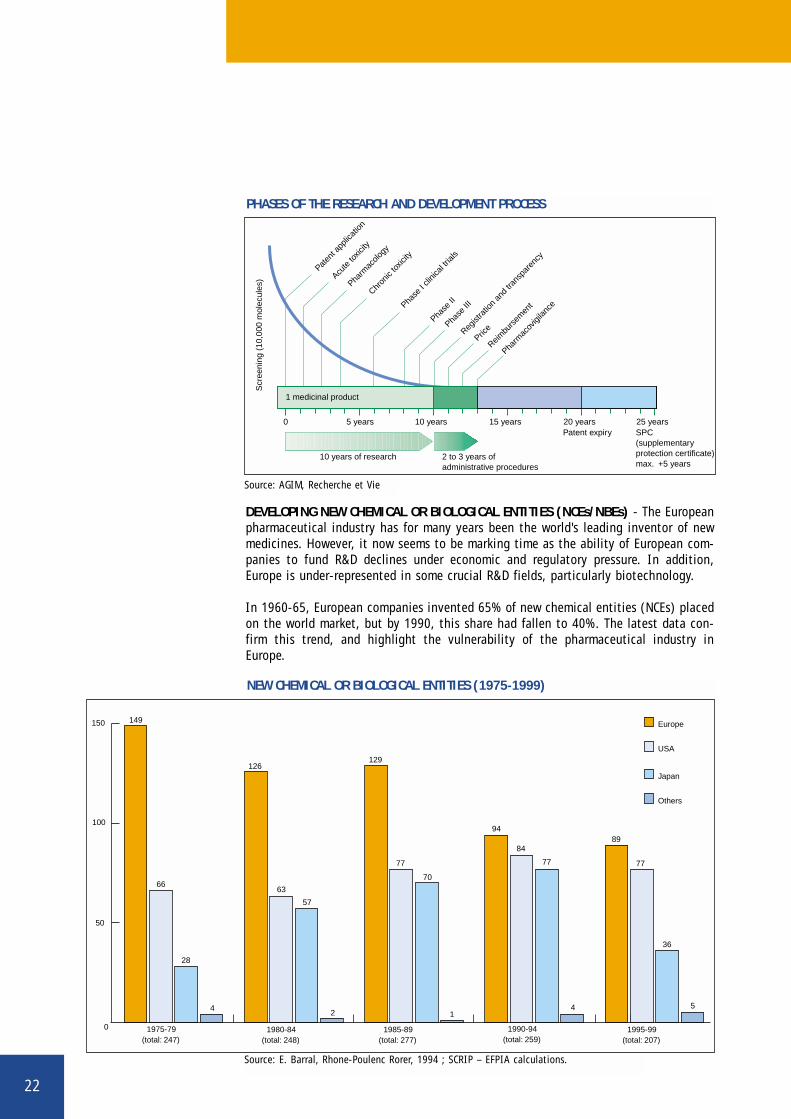
DEVELOPING NEW CHEMICAL OR BIOLOGICAL ENTITIES (NCEs/NBEs) - The Europeanpharmaceutical industry has for many years been the world's leading inventor of newmedicines. However, it now seems to be marking time as the ability of European com-panies to fund R&D declines under economic and regulatory pressure. In addition,Europe is under-represented in some crucial R&D fields, particularly biotechnology.
In 1960-65, European companies invented 65% of new chemical entities (NCEs) placedon the world market, but by 1990, this share had fallen to 40%. The latest data con-firm this trend, and highlight the vulnerability of the pharmaceutical industry inEurope.
PHASES OF THE RESEARCH AND DEVELOPMENT PROCESS
Paten
t app
licat
ion
Acute
toxic
ity
1 medicinal product
10 years of research
Scr
eeni
ng (
10,0
00 m
olec
ules
)
2 to 3 years ofadministrative procedures
Patent expiry SPC (supplementary protection certificate) max. +5 years
0 10 years 15 years 20 years 25 years5 years
Pharm
acolo
gy
Chron
ic tox
icity
Phase
I cli
nical
trials
Phase
II
Phase
III
Regist
ratio
n an
d tra
nspa
renc
y
Price
Reimbu
rsem
ent
Pharm
acov
igilan
ce
NEW CHEMICAL OR BIOLOGICAL ENTITIES (1975-1999)
0
50
100
150
Others
Japan
USA
Europe
1995-991990-941985-891980-841975-79(total: 207)(total: 259)(total: 277)(total: 248)(total: 247)
28
4
66
149
126
63
57
2
129
77
70
94
84
77
4
89
77
36
51
Source: AGIM, Recherche et Vie
Source: E. Barral, Rhone-Poulenc Rorer, 1994 ; SCRIP – EFPIA calculations.
23
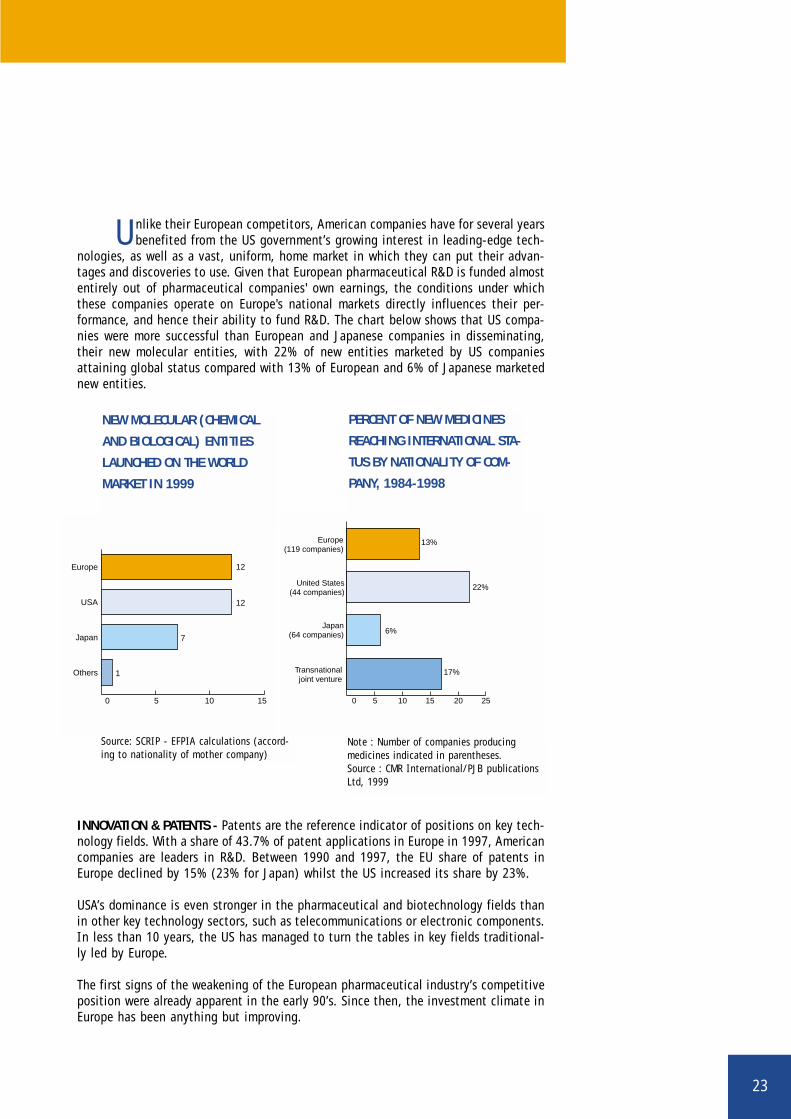
Unlike their European competitors, American companies have for several yearsbenefited from the US government’s growing interest in leading-edge tech-
nologies, as well as a vast, uniform, home market in which they can put their advan-tages and discoveries to use. Given that European pharmaceutical R&D is funded almostentirely out of pharmaceutical companies' own earnings, the conditions under whichthese companies operate on Europe's national markets directly influences their per-formance, and hence their ability to fund R&D. The chart below shows that US compa-nies were more successful than European and Japanese companies in disseminating,their new molecular entities, with 22% of new entities marketed by US companiesattaining global status compared with 13% of European and 6% of Japanese marketednew entities.
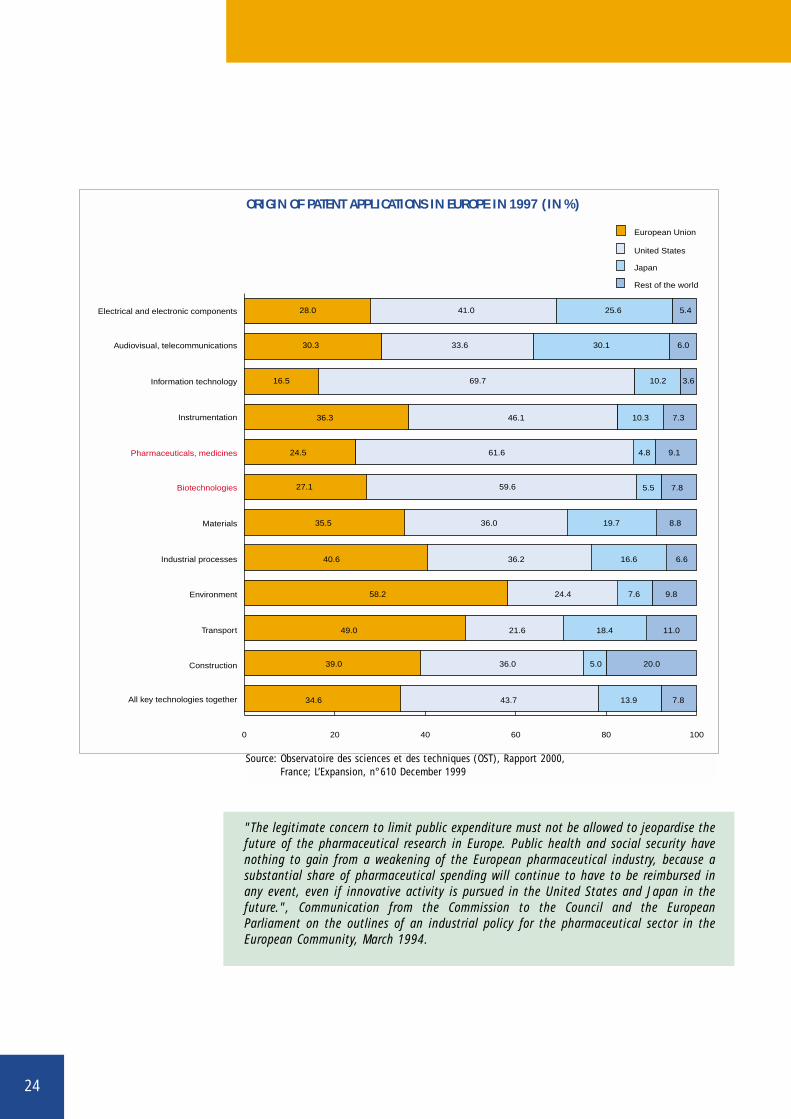
INNOVATION & PATENTS - Patents are the reference indicator of positions on key tech-nology fields. With a share of 43.7% of patent applications in Europe in 1997, Americancompanies are leaders in R&D. Between 1990 and 1997, the EU share of patents inEurope declined by 15% (23% for Japan) whilst the US increased its share by 23%.
USA’s dominance is even stronger in the pharmaceutical and biotechnology fields thanin other key technology sectors, such as telecommunications or electronic components.In less than 10 years, the US has managed to turn the tables in key fields traditional-ly led by Europe.
The first signs of the weakening of the European pharmaceutical industry’s competitiveposition were already apparent in the early 90’s. Since then, the investment climate inEurope has been anything but improving.
NEW MOLECULAR (CHEMICAL
AND BIOLOGICAL) ENTITIES
LAUNCHED ON THE WORLD
MARKET IN 1999
0 5 10 15
Others
Japan
USA
Europe 12
12
7
1
PERCENT OF NEW MEDICINES
REACHING INTERNATIONAL STA-
TUS BY NATIONALITY OF COM-
PANY, 1984-1998
0 5 10 15 20 25
Transnationaljoint venture
Japan(64 companies)
Europe(119 companies)
United States(44 companies)
22%
13%
6%
17%
Note : Number of companies producing medicines indicated in parentheses. Source : CMR International/PJB publicationsLtd, 1999
Source: SCRIP - EFPIA calculations (accord-ing to nationality of mother company)
24
0 20 40 60 80 100
Rest of the world
Japan
United States
European Union
All key technologies together
Construction
Transport
Environment
Industrial processes
Materials
Biotechnologies
Pharmaceuticals, medicines
Instrumentation
Information technology
Audiovisual, telecommunications
Electrical and electronic components 41.0 25.6 5.428.0
33.6 30.1 6.030.3
69.7 10.2 3.616.5
36.3 46.1 10.3 7.3
24.5 61.6 4.8 9.1
27.1 59.6 5.5 7.8
35.5 36.0 19.7 8.8
34.6 43.7 13.9 7.8
39.0 36.0 5.0 20.0
49.0 21.6 18.4 11.0
58.2 24.4 7.6 9.8
40.6 36.2 16.6 6.6
"The legitimate concern to limit public expenditure must not be allowed to jeopardise thefuture of the pharmaceutical research in Europe. Public health and social security havenothing to gain from a weakening of the European pharmaceutical industry, because asubstantial share of pharmaceutical spending will continue to have to be reimbursed inany event, even if innovative activity is pursued in the United States and Japan in thefuture.", Communication from the Commission to the Council and the EuropeanParliament on the outlines of an industrial policy for the pharmaceutical sector in theEuropean Community, March 1994.
Source: Observatoire des sciences et des techniques (OST), Rapport 2000, France; L’Expansion, n°610 December 1999
ORIGIN OF PATENT APPLICATIONS IN EUROPE IN 1997 (IN %)
25
BBIOSCIENCES
New technologies represent the most compelling means to meet major healthchallenges that European countries are faced with. Scientific aspirations are
grander than ever, as the techniques and methods of biotechnology are applied to agrowing knowledge of the genetics of living matter.
In the health field, biotechnology is breeding new knowledge at breathtaking rate. Ithas already enabled researchers to:
■ Identify new pathogenic agents, such as viruses (HIV, hepatitis, etc;);■ Describe the mechanisms of diseases through the identification of genes and their
effect on disease (oncogenes and cancers, Alzheimer’s disease, genetic diseases)and characterise the normal functioning of the organism (hormones, receptors,cytokines);
■ Provide new tools for manufacturing medicinal products as well as for therapy anddiagnosis.
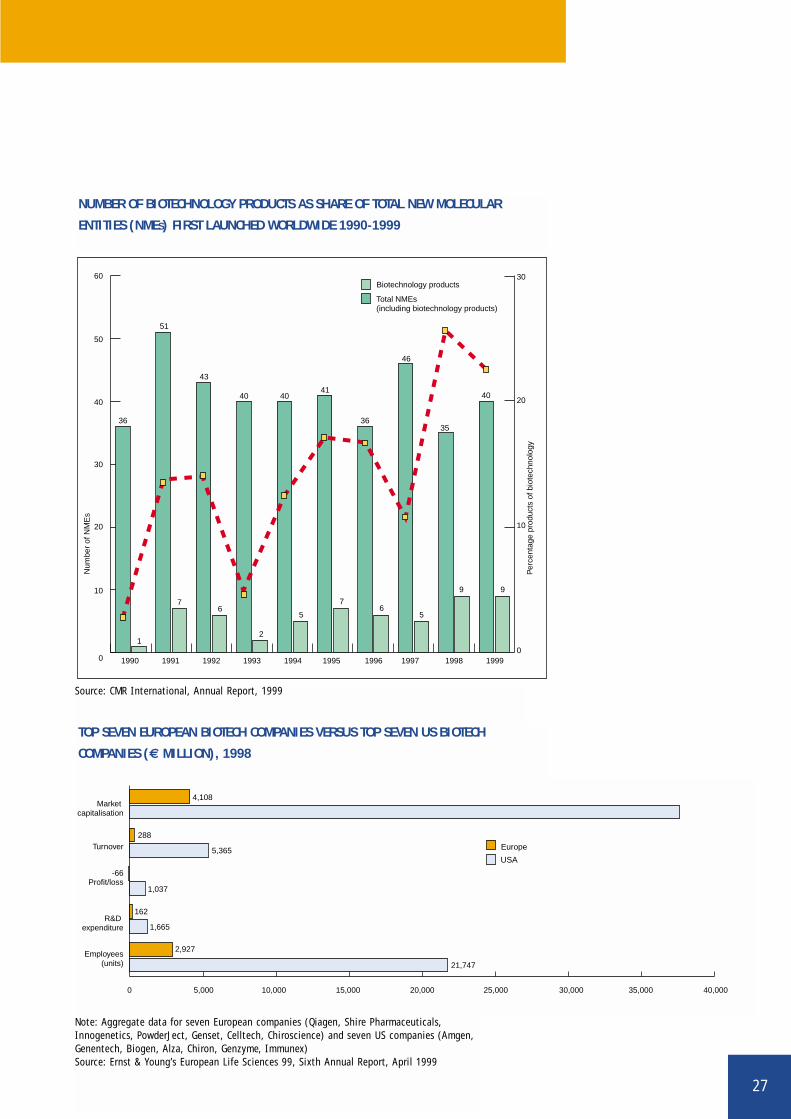
Approximately one-fifth of new molecular entities launched on the world market eachyear are now biotechnology-derived. Total world sales of the top 10 biopharmaceuticalsamounted to € 6,378 million in 1997, i.e. an increase of 17.5% over 1996 sales(source: Ernst & Young’s European Life Sciences 99, Sixth Annual Report, April 1999).
Biotechnology research approaches to chronic diseases in the future will exploit theunderstanding of the basic mechanisms of disease acquired from the internationalhuman genome project and other high-tech genetic studies. The application of thehuman genomics knowledge to clinical practice and drug development will allow us topredict a patient’s reponse to treatment and create new "personalised" medicinesaccording to genetic variations. The application of these new medicines will not onlyaffect the global burden of disease but the typical pattern of care and patient man-agement, with an operational shift from acute treatment to prevention and cure.Disease prediction and prevention will be the foundation to healthcare in the next cen-tury.
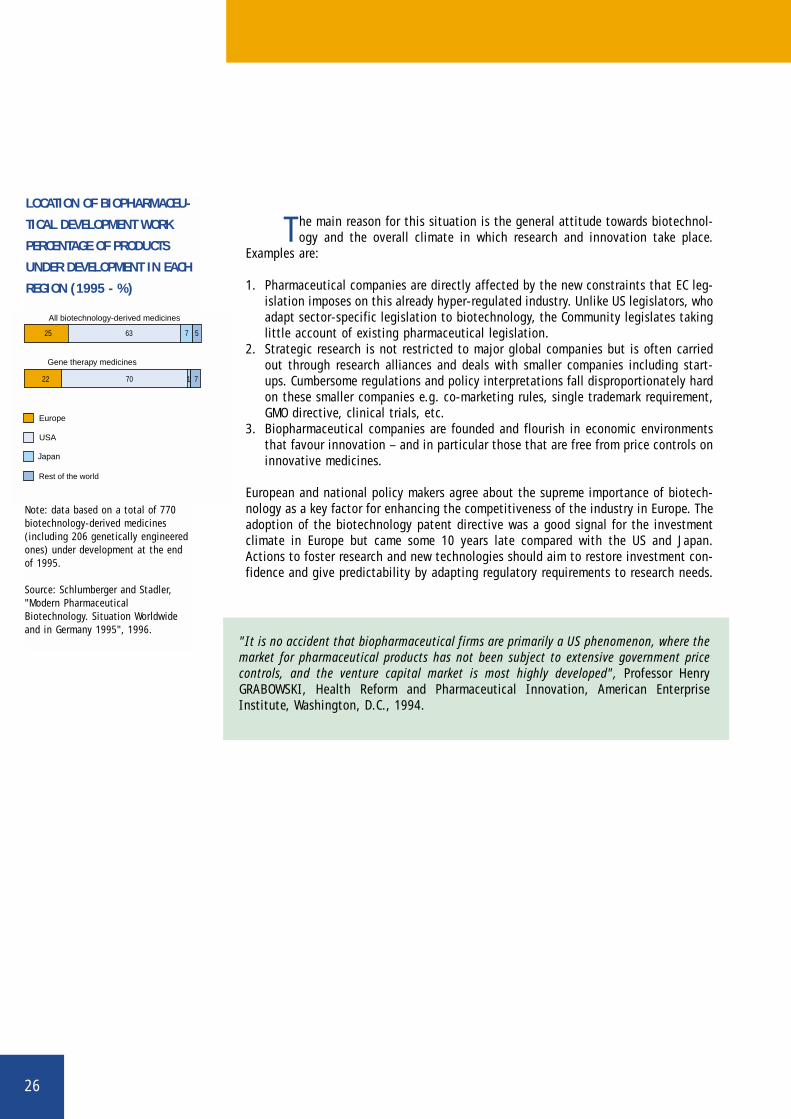
After a late start, Europe’s biotechnology sector is growing fast, although still not asfast as its US counterpart. To judge by the number of biotechnology patents granted,or by biopharmaceutical sales, Europe is still lagging far behind the USA. The latestdata on the location of biopharmaceutical development work show that 63% of medi-cines are currently under development in the United States compared with 25% inEurope. Furthermore, a brief review of major biotechnology deals and research allianceswithin the industry reveal that European companies increasingly deploy resources forinvestment in research and development towards the US.
26
The main reason for this situation is the general attitude towards biotechnol-ogy and the overall climate in which research and innovation take place.
Examples are:
1. Pharmaceutical companies are directly affected by the new constraints that EC leg-islation imposes on this already hyper-regulated industry. Unlike US legislators, whoadapt sector-specific legislation to biotechnology, the Community legislates takinglittle account of existing pharmaceutical legislation.
2. Strategic research is not restricted to major global companies but is often carriedout through research alliances and deals with smaller companies including start-ups. Cumbersome regulations and policy interpretations fall disproportionately hardon these smaller companies e.g. co-marketing rules, single trademark requirement,GMO directive, clinical trials, etc.
3. Biopharmaceutical companies are founded and flourish in economic environmentsthat favour innovation – and in particular those that are free from price controls oninnovative medicines.
European and national policy makers agree about the supreme importance of biotech-nology as a key factor for enhancing the competitiveness of the industry in Europe. Theadoption of the biotechnology patent directive was a good signal for the investmentclimate in Europe but came some 10 years late compared with the US and Japan.Actions to foster research and new technologies should aim to restore investment con-fidence and give predictability by adapting regulatory requirements to research needs.
Note: data based on a total of 770biotechnology-derived medicines(including 206 genetically engineeredones) under development at the endof 1995.
Source: Schlumberger and Stadler,"Modern PharmaceuticalBiotechnology. Situation Worldwideand in Germany 1995", 1996.
LOCATION OF BIOPHARMACEU-
TICAL DEVELOPMENT WORK
PERCENTAGE OF PRODUCTS
UNDER DEVELOPMENT IN EACH
REGION (1995 - %)
7022 71
6325 7 5
Japan
USA
Europe
All biotechnology-derived medicines
Gene therapy medicines
Rest of the world
"It is no accident that biopharmaceutical firms are primarily a US phenomenon, where themarket for pharmaceutical products has not been subject to extensive government pricecontrols, and the venture capital market is most highly developed", Professor HenryGRABOWSKI, Health Reform and Pharmaceutical Innovation, American EnterpriseInstitute, Washington, D.C., 1994.
27
NUMBER OF BIOTECHNOLOGY PRODUCTS AS SHARE OF TOTAL NEW MOLECULAR
ENTITIES (NMES) FIRST LAUNCHED WORLDWIDE 1990-1999
0
10
Num
ber
of N
ME
s
Per
cent
age
prod
ucts
of b
iote
chno
logy
20
30
40
50
60
0
10
20
30Biotechnology products
Total NMEs (including biotechnology products)
1999199819971996199519941993199219911990
1
36
51
43
40 4041
36
46
35
40
76
2
5
76
5
9 9
Source: CMR International, Annual Report, 1999
TOP SEVEN EUROPEAN BIOTECH COMPANIES VERSUS TOP SEVEN US BIOTECH
COMPANIES (€ MILLION), 1998
5,0000
4,108
5,365
1,037
1,665
21,747
288
-66
162
2,927
10,000 15,000 20,000 25,000 30,000 35,000 40,000
Employees(units)
R&D expenditure
Profit/loss
Turnover
Market capitalisation
USA
Europe
Note: Aggregate data for seven European companies (Qiagen, Shire Pharmaceuticals,Innogenetics, PowderJect, Genset, Celltech, Chiroscience) and seven US companies (Amgen,Genentech, Biogen, Alza, Chiron, Genzyme, Immunex)Source: Ernst & Young’s European Life Sciences 99, Sixth Annual Report, April 1999

28
EFPIA 1998 € million
Austria 1,380
Belgium 4,898
Denmark 2,202
Finland 206
France 7,069
Germany 12,682
Greece 121
Ireland 4,227
Italy 4,705
Netherlands 3,688
Norway 200
Portugal 183
Spain 1,587
Sweden 3,263
Switzerland 11,341
Turkey 115
United Kingdom 8,666
Total 66,533
PHARMACEUTICAL EXPORTS
Note: All data based on SITC 54 (SITC 54 Rev.3 + sulphonamides);Exports free on board (FOB);Italy, Spain, Switzerland, Turkey: veterinary products excluded.
Source : EFPIA member associations (official figures)
29
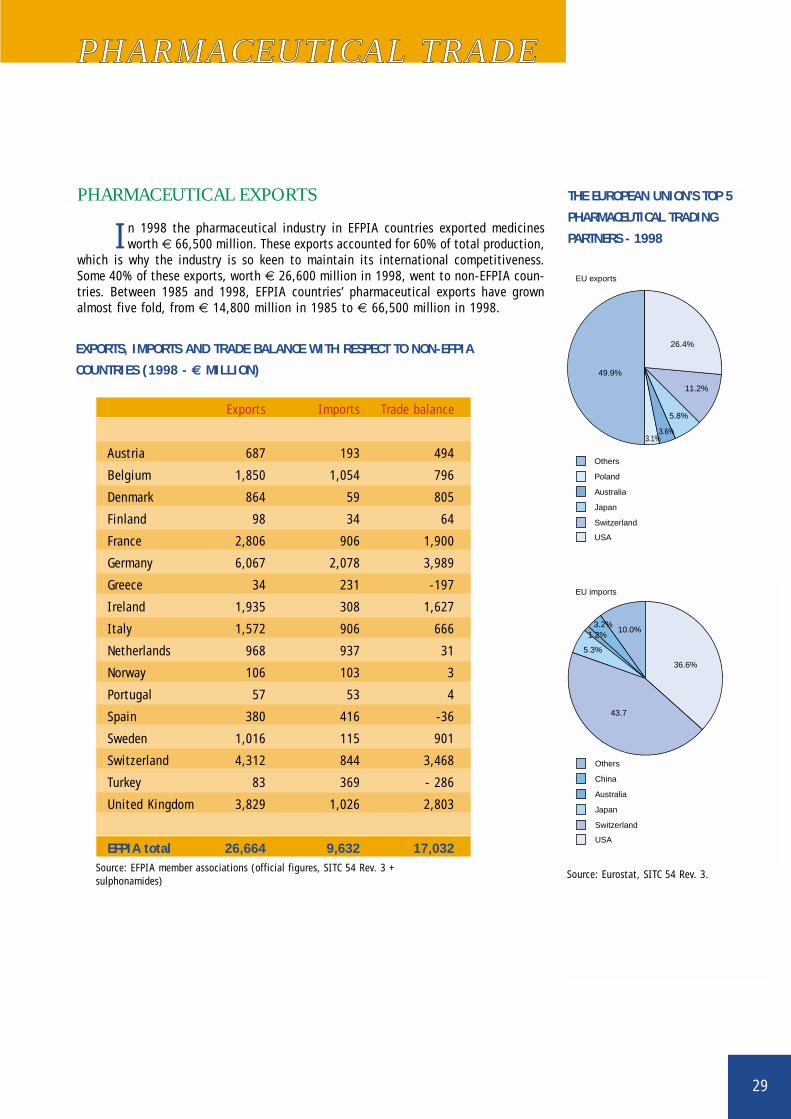
THE EUROPEAN UNION’S TOP 5
PHARMACEUTICAL TRADING
PARTNERS - 1998
Others
EU exports
49.9%
11.2%
26.4%
5.8%
3.6%3.1%
Poland
Australia
Japan
Switzerland
USA
EU imports
36.6%
10.0%
43.7
5.3%
1.2%3.2%
Others
China
Australia
Japan
Switzerland
USA
PHARMACEUTICAL TRADE
PHARMACEUTICAL EXPORTS
In 1998 the pharmaceutical industry in EFPIA countries exported medicinesworth € 66,500 million. These exports accounted for 60% of total production,
which is why the industry is so keen to maintain its international competitiveness.Some 40% of these exports, worth € 26,600 million in 1998, went to non-EFPIA coun-tries. Between 1985 and 1998, EFPIA countries’ pharmaceutical exports have grownalmost five fold, from € 14,800 million in 1985 to € 66,500 million in 1998.
Exports Imports Trade balance
Austria 687 193 494
Belgium 1,850 1,054 796
Denmark 864 59 805
Finland 98 34 64
France 2,806 906 1,900
Germany 6,067 2,078 3,989
Greece 34 231 -197
Ireland 1,935 308 1,627
Italy 1,572 906 666
Netherlands 968 937 31
Norway 106 103 3
Portugal 57 53 4
Spain 380 416 -36
Sweden 1,016 115 901
Switzerland 4,312 844 3,468
Turkey 83 369 - 286
United Kingdom 3,829 1,026 2,803
EFPIA total 26,664 9,632 17,032Source: EFPIA member associations (official figures, SITC 54 Rev. 3 +sulphonamides)
EXPORTS, IMPORTS AND TRADE BALANCE WITH RESPECT TO NON-EFPIA
COUNTRIES (1998 - € MILLION)
Source: Eurostat, SITC 54 Rev. 3.
30
EFPIA 1998 € million
Austria 1,982
Belgium 4,197
Denmark 823
Finland 585
France 4,529
Germany 7,472
Greece 819
Ireland 906
Italy 5,184
Netherlands 3,501
Norway 623
Portugal 709
Spain 2,958
Sweden 1,202
Switzerland 4,620
Turkey 1,054
United Kingdom 5,055
Total 46,219
PHARMACEUTICAL IMPORTS
Note: All data based on SITC 54 (SITC 54 Rev.3 +sulphonamides);Imports CIF (Cost - Insurance - Freight);Italy, Spain, Switzerland, Turkey: veterinaryproducts excluded.
Source : EFPIA member associations (official figures)
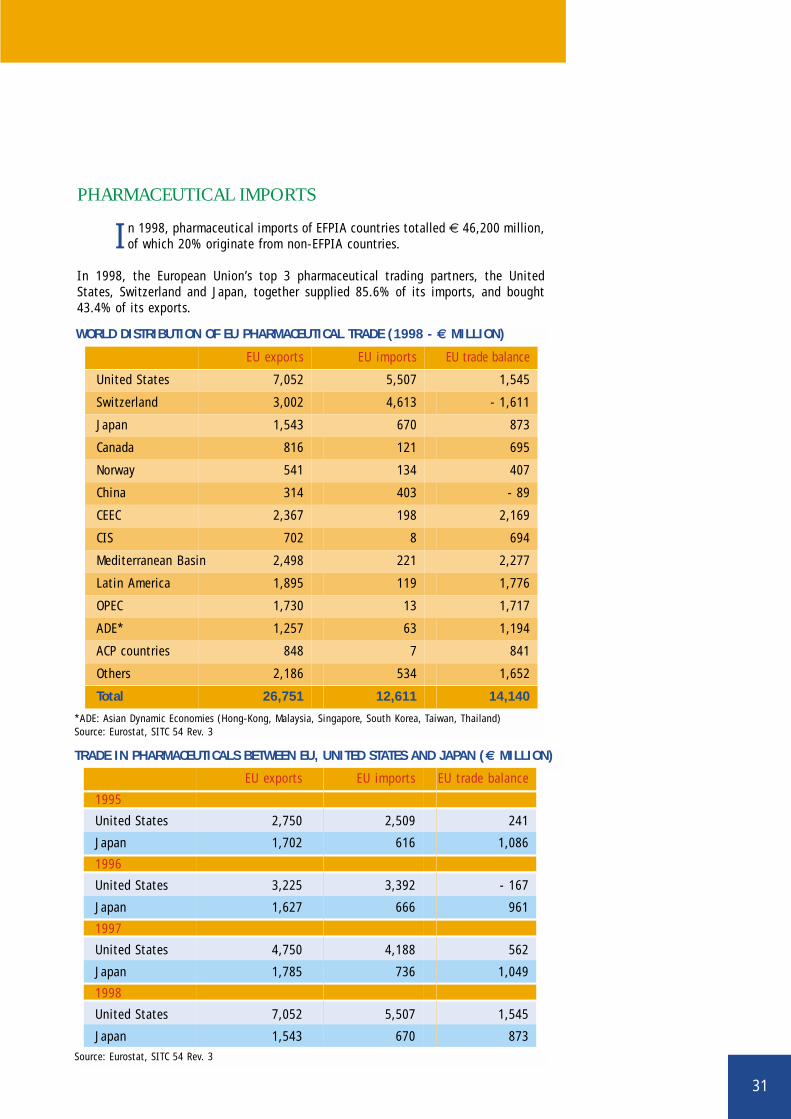
TRADE IN PHARMACEUTICALS BETWEEN EU, UNITED STATES AND JAPAN (€ MILLION)
31
PHARMACEUTICAL IMPORTS
In 1998, pharmaceutical imports of EFPIA countries totalled € 46,200 million,of which 20% originate from non-EFPIA countries.
In 1998, the European Union’s top 3 pharmaceutical trading partners, the UnitedStates, Switzerland and Japan, together supplied 85.6% of its imports, and bought43.4% of its exports.
EU exports EU imports EU trade balance
United States 7,052 5,507 1,545
Switzerland 3,002 4,613 - 1,611
Japan 1,543 670 873
Canada 816 121 695
Norway 541 134 407
China 314 403 - 89
CEEC 2,367 198 2,169
CIS 702 8 694
Mediterranean Basin 2,498 221 2,277
Latin America 1,895 119 1,776
OPEC 1,730 13 1,717
ADE* 1,257 63 1,194
ACP countries 848 7 841
Others 2,186 534 1,652
Total 26,751 12,611 14,140
WORLD DISTRIBUTION OF EU PHARMACEUTICAL TRADE (1998 - € MILLION)
*ADE: Asian Dynamic Economies (Hong-Kong, Malaysia, Singapore, South Korea, Taiwan, Thailand) Source: Eurostat, SITC 54 Rev. 3
EU exports EU imports EU trade balance
1995
United States 2,750 2,509 241
Japan 1,702 616 1,086
1996
United States 3,225 3,392 - 167
Japan 1,627 666 961
1997
United States 4,750 4,188 562
Japan 1,785 736 1,049
1998
United States 7,052 5,507 1,545
Japan 1,543 670 873Source: Eurostat, SITC 54 Rev. 3

32
EFPIA 1998 € million
Austria - 602
Belgium 701
Denmark 1,379
Finland - 379
France 2,540
Germany 5,210
Greece - 698
Ireland 3,321
Italy - 479
Netherlands 187
Norway - 423
Portugal - 526
Spain - 1,371
Sweden 2,061
Switzerland 6,721
Turkey - 939
United Kingdom 3,611
Total 20,314
PHARMACEUTICAL BALANCE OF TRADE
Note: All data based on SITC 54 (SITC 54 Rev.3 +sulphonamides).Italy, Spain, Switzerland, Turkey: veterinaryproducts excluded.
Source: EFPIA member associations (official figures)
33
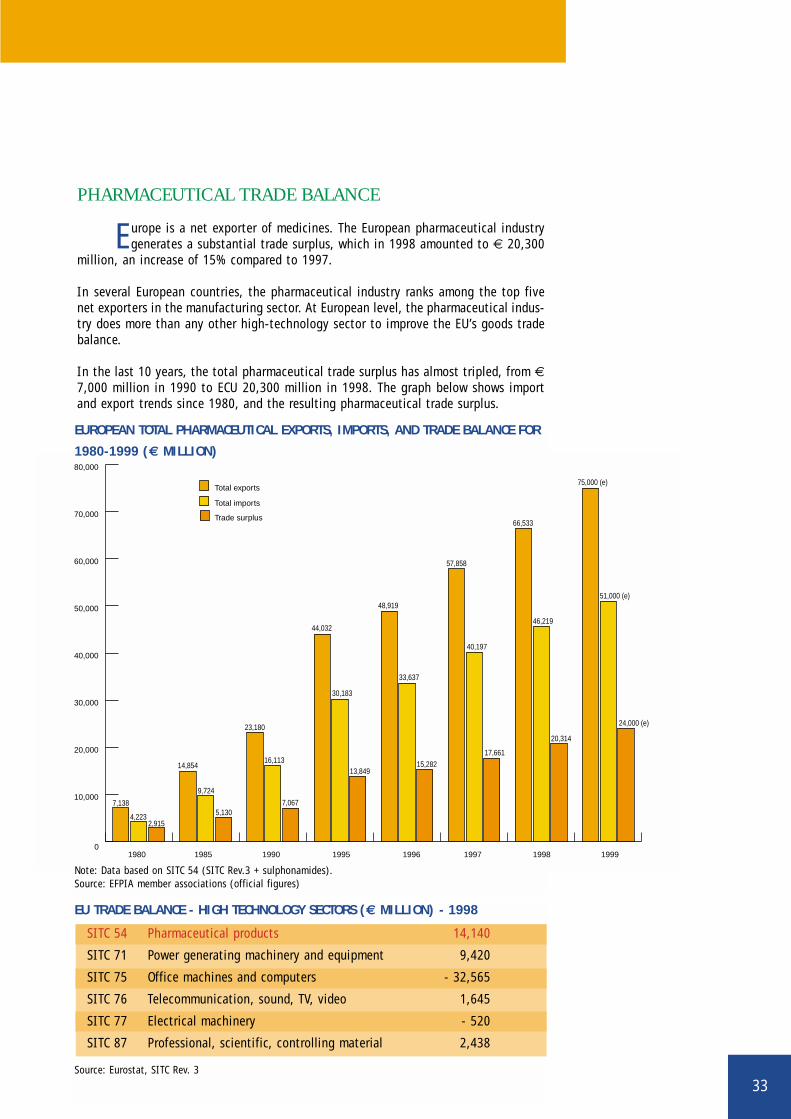
PHARMACEUTICAL TRADE BALANCE
Europe is a net exporter of medicines. The European pharmaceutical industrygenerates a substantial trade surplus, which in 1998 amounted to € 20,300
million, an increase of 15% compared to 1997.
In several European countries, the pharmaceutical industry ranks among the top fivenet exporters in the manufacturing sector. At European level, the pharmaceutical indus-try does more than any other high-technology sector to improve the EU’s goods tradebalance.
In the last 10 years, the total pharmaceutical trade surplus has almost tripled, from €7,000 million in 1990 to ECU 20,300 million in 1998. The graph below shows importand export trends since 1980, and the resulting pharmaceutical trade surplus.
0
10,000
20,000
30,000
40,000
50,000
60,000
70,000
80,000
Trade surplus
Total imports
Total exports
19991998199719961995199019851980
7,138
4,2232,915
14,854
9,724
5,130
23,180
16,113
7,067
44,032
30,183
13,849
48,919
33,637
57,858
66,533
46,219
20,314
75,000 (e)
51,000 (e)
24,000 (e)
40,197
17,66115,282
SITC 54 Pharmaceutical products 14,140
SITC 71 Power generating machinery and equipment 9,420
SITC 75 Office machines and computers - 32,565
SITC 76 Telecommunication, sound, TV, video 1,645
SITC 77 Electrical machinery - 520
SITC 87 Professional, scientific, controlling material 2,438
EUROPEAN TOTAL PHARMACEUTICAL EXPORTS, IMPORTS, AND TRADE BALANCE FOR
1980-1999 (€ MILLION)
EU TRADE BALANCE - HIGH TECHNOLOGY SECTORS (€ MILLION) - 1998
Source: Eurostat, SITC Rev. 3
Note: Data based on SITC 54 (SITC Rev.3 + sulphonamides).Source: EFPIA member associations (official figures)
34
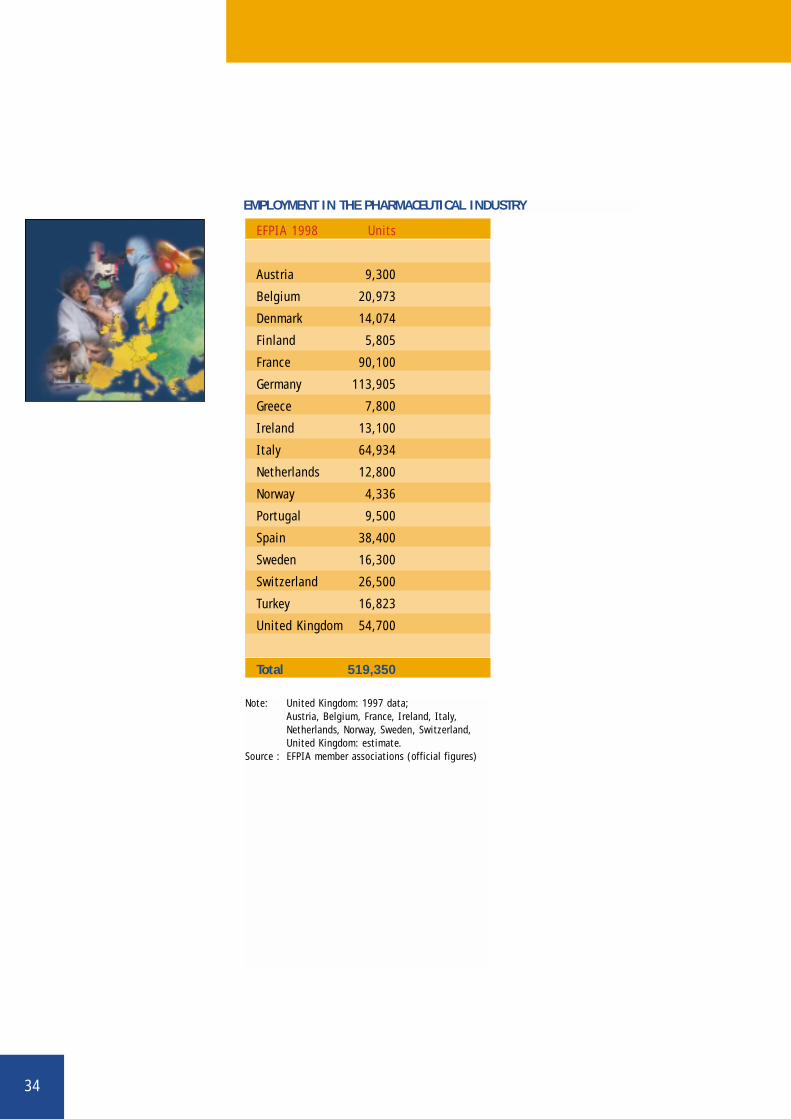
EFPIA 1998 Units
Austria 9,300
Belgium 20,973
Denmark 14,074
Finland 5,805
France 90,100
Germany 113,905
Greece 7,800
Ireland 13,100
Italy 64,934
Netherlands 12,800
Norway 4,336
Portugal 9,500
Spain 38,400
Sweden 16,300
Switzerland 26,500
Turkey 16,823
United Kingdom 54,700
Total 519,350
EMPLOYMENT IN THE PHARMACEUTICAL INDUSTRY
Note: United Kingdom: 1997 data;Austria, Belgium, France, Ireland, Italy,Netherlands, Norway, Sweden, Switzerland,United Kingdom: estimate.
Source : EFPIA member associations (official figures)
35
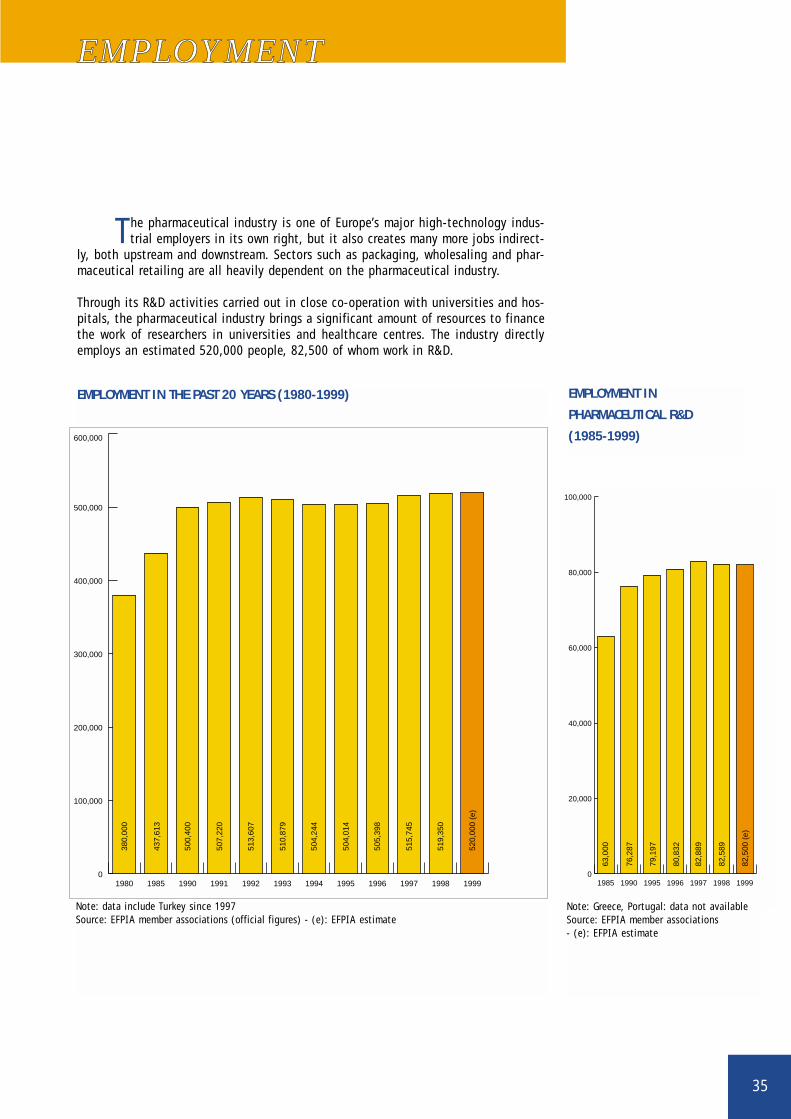
EMPLOYMENT
The pharmaceutical industry is one of Europe’s major high-technology indus-trial employers in its own right, but it also creates many more jobs indirect-
ly, both upstream and downstream. Sectors such as packaging, wholesaling and phar-maceutical retailing are all heavily dependent on the pharmaceutical industry.
Through its R&D activities carried out in close co-operation with universities and hos-pitals, the pharmaceutical industry brings a significant amount of resources to financethe work of researchers in universities and healthcare centres. The industry directlyemploys an estimated 520,000 people, 82,500 of whom work in R&D.
0
100,000
200,000
300,000
400,000
500,000
600,000
199919981997199619951994199319921991199019851980
380,
000
437,
613
500,
400
507,
220
513,
607
510,
879
504,
244
504,
014
505,
398
515,
745
519,
350
520,
000
(e)
EMPLOYMENT IN THE PAST 20 YEARS (1980-1999) EMPLOYMENT IN
PHARMACEUTICAL R&D
(1985-1999)
0
20,000
40,000
60,000
80,000
100,000
1999199819971996199519901985
63,0
00
76,2
87
79,1
97
80,8
32
82,8
89
82,5
89
82,5
00 (
e)
Note: Greece, Portugal: data not availableSource: EFPIA member associations - (e): EFPIA estimate
Note: data include Turkey since 1997Source: EFPIA member associations (official figures) - (e): EFPIA estimate
36
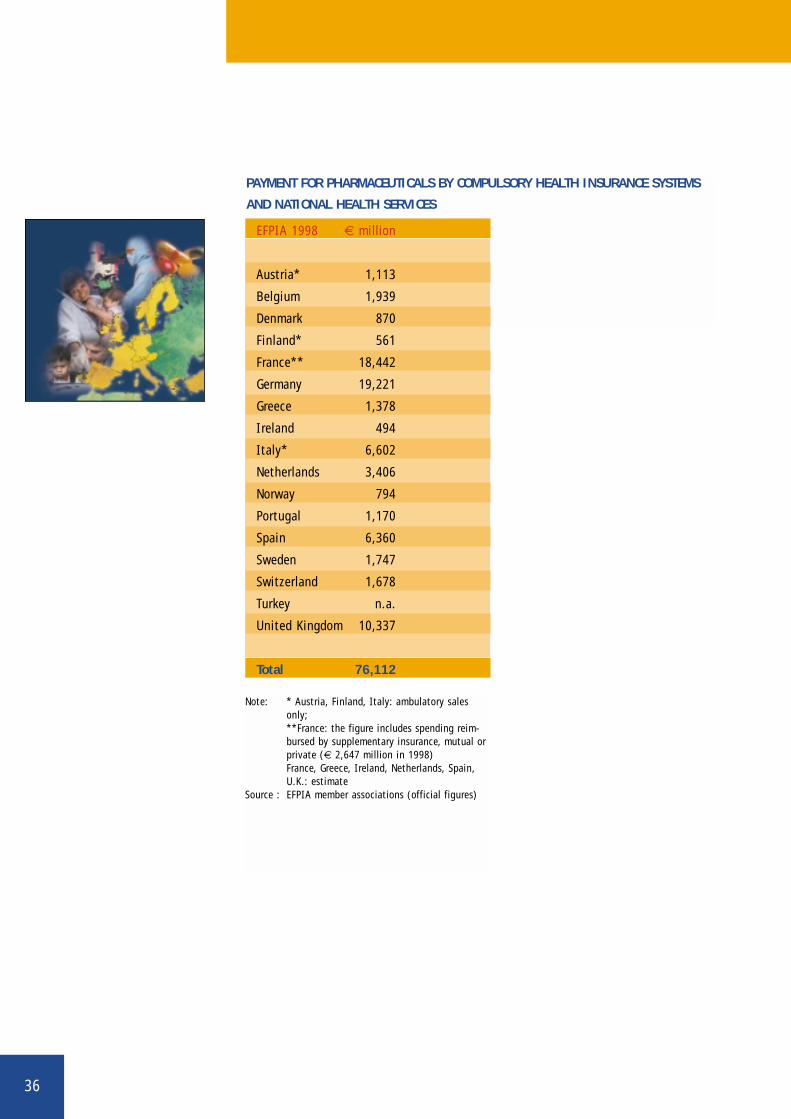
PAYMENT FOR PHARMACEUTICALS BY COMPULSORY HEALTH INSURANCE SYSTEMS
AND NATIONAL HEALTH SERVICES
EFPIA 1998 € million
Austria* 1,113
Belgium 1,939
Denmark 870
Finland* 561
France** 18,442
Germany 19,221
Greece 1,378
Ireland 494
Italy* 6,602
Netherlands 3,406
Norway 794
Portugal 1,170
Spain 6,360
Sweden 1,747
Switzerland 1,678
Turkey n.a.
United Kingdom 10,337
Total 76,112
Note: * Austria, Finland, Italy: ambulatory salesonly;**France: the figure includes spending reim-bursed by supplementary insurance, mutual orprivate (€ 2,647 million in 1998)France, Greece, Ireland, Netherlands, Spain,U.K.: estimate
Source : EFPIA member associations (official figures)
37
PHARMACEUTICAL REIMBURSEMENT
Pharmaceutical reimbursement refers to the share of medicine costs paid bythe state through the compulsory social security system or by health insur-
ance funds, according to the statutory national system.
Since the early 1950s, Europe's social history has been marked by the progressive set-ting up of social security systems which cover more and more people and offer an everwider range of services. At first, these systems covered only workers, but their cover-age was later extended, with a few exceptions, to the entire population. However,where health insurance protection cover is comprehensive and widespread, the Staterarely bears the full cost of medicines.
In most European countries only prescribed products are reimbursed, although reim-bursement arrangements differ widely from country to country. In fact not all medicinesare reimbursed, and few are reimbursed in full. Some countries limit reimbursement toa proportion of the price of the prescribed medicine, others to a flat-rate amountaccording to packaging or prescription. Most countries operate a co-payment system,which requires patients to meet part of the cost of their prescribed treatment. Thereare also over-the-counter (OTC) products, which are bought by patients at their owninitiative and their own expense.
For several years, medicines have been the prime target of health cost containmentmeasures. Policies in several European countries effectively ignore the therapeutic andeconomic value of medicines. Medicines not only provide the best treatment for manydiseases, but also generate savings, by substantially reducing costs in other branchesof health care (hospital stays, invalidity, etc.).
SHARE OF MEDICINE COSTS PAID BY THE PATIENT
The fundamental purpose of health insurance systems is to ensure publicaccess to health care. Although these systems were built on the principle of
social solidarity (and, in post-war economic and welfare conditions, rightly so) it is nowclear that the individual's needs and ability to bear the costs of disease have bothevolved. Today, higher average incomes enable patients to bear a larger share of thesecosts, and demand for health care is no longer limited to "satisfactory" public healthstandards, but encompasses the wider notion of "well-being".
38
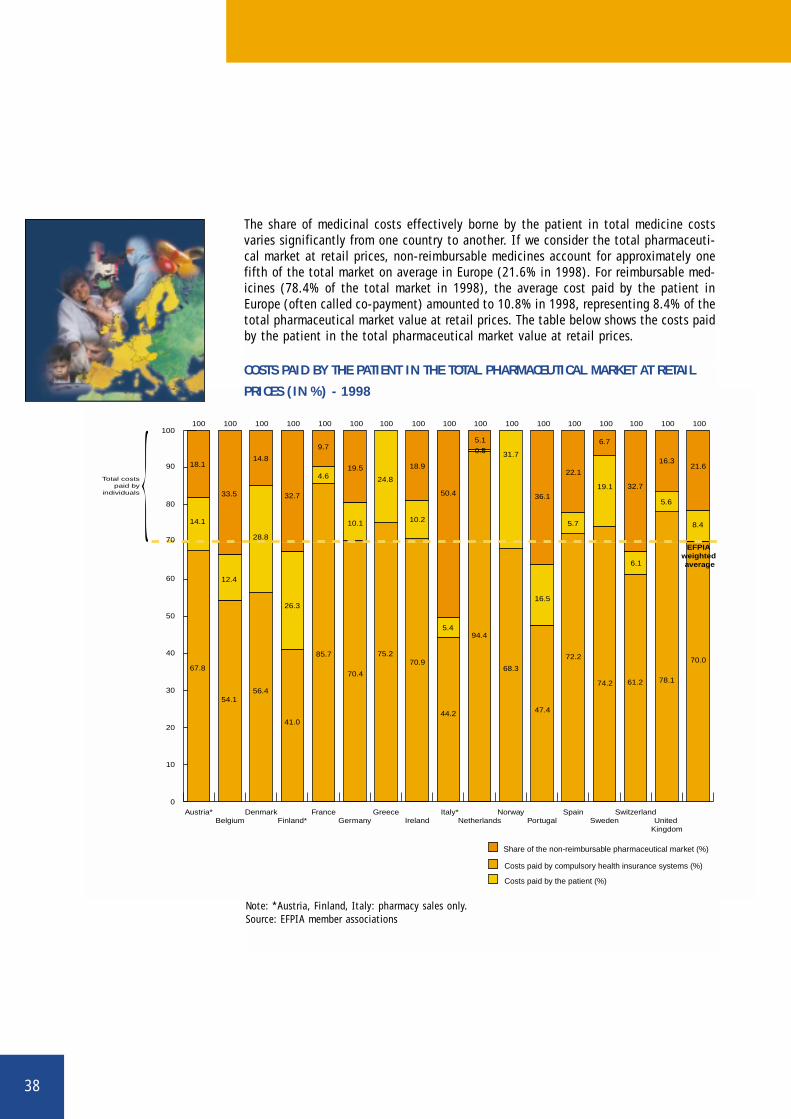
Note: *Austria, Finland, Italy: pharmacy sales only.Source: EFPIA member associations
Share of the non-reimbursable pharmaceutical market (%)
Costs paid by the patient (%)
Costs paid by compulsory health insurance systems (%)
0
20
30
10
40
50
60
80
90
100
EFPIA weighted average
United Kingdom
SwitzerlandSweden
SpainPortugal
NorwayNetherlands
Italy*Ireland
GreeceGermany
FranceFinland*
DenmarkBelgium
Austria*
67.8
54.156.4
41.0
85.7
70.4
75.270.9
44.2
94.4
68.3
47.4
72.2
74.2 61.2 78.1
70.0
18.1
33.5
14.8
32.7
9.7
19.5 18.9
50.4
5.1
31.7
36.1
22.1
6.7
32.7
16.321.6
100
Total costspaid by
individuals
100 100 100 100 100 100 100 100 100 100 100 100 100 100 100 100
14.1
12.4
28.8
26.3
4.6
10.1
24.8
10.2
5.4
0.5
16.5
5.7
19.1
6.1
5.6
8.4
70
The share of medicinal costs effectively borne by the patient in total medicine costsvaries significantly from one country to another. If we consider the total pharmaceuti-cal market at retail prices, non-reimbursable medicines account for approximately onefifth of the total market on average in Europe (21.6% in 1998). For reimbursable med-icines (78.4% of the total market in 1998), the average cost paid by the patient inEurope (often called co-payment) amounted to 10.8% in 1998, representing 8.4% of thetotal pharmaceutical market value at retail prices. The table below shows the costs paidby the patient in the total pharmaceutical market value at retail prices.
COSTS PAID BY THE PATIENT IN THE TOTAL PHARMACEUTICAL MARKET AT RETAIL
PRICES (IN %) - 1998
39
PHARMACEUTICALSPENDING (AS A SHAREOF HEALTH SPENDING)
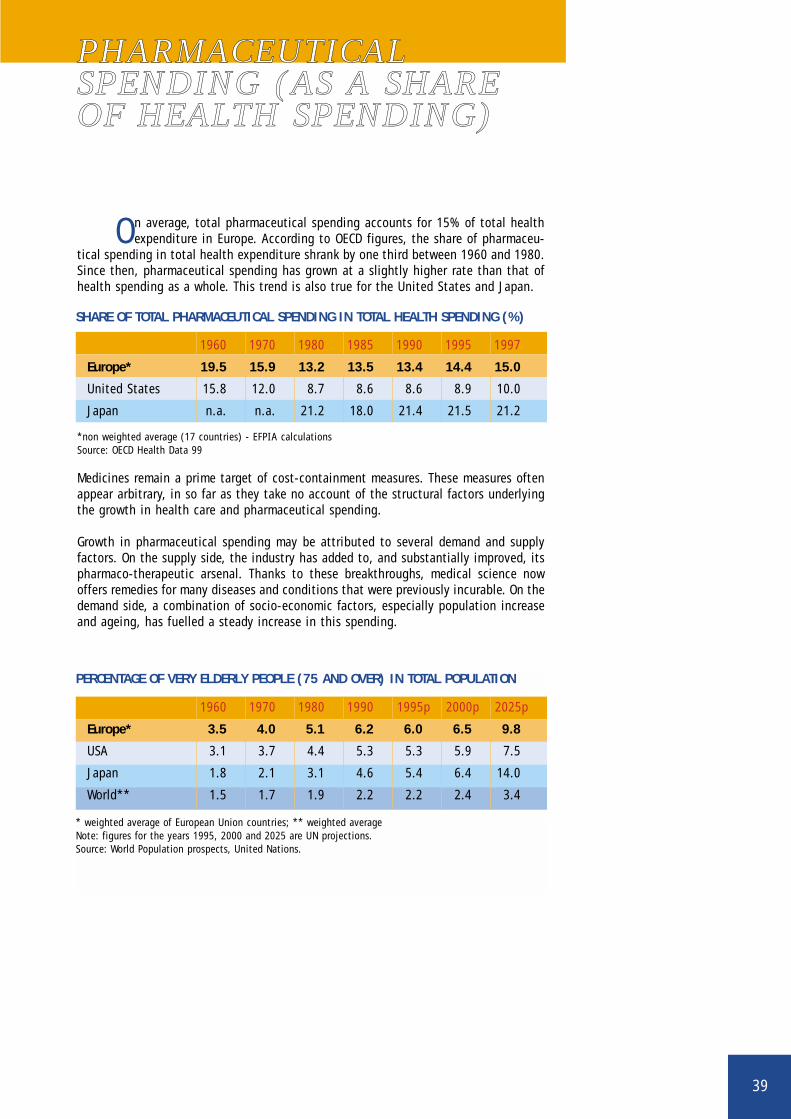
On average, total pharmaceutical spending accounts for 15% of total healthexpenditure in Europe. According to OECD figures, the share of pharmaceu-
tical spending in total health expenditure shrank by one third between 1960 and 1980.Since then, pharmaceutical spending has grown at a slightly higher rate than that ofhealth spending as a whole. This trend is also true for the United States and Japan.
Medicines remain a prime target of cost-containment measures. These measures oftenappear arbitrary, in so far as they take no account of the structural factors underlyingthe growth in health care and pharmaceutical spending.
Growth in pharmaceutical spending may be attributed to several demand and supplyfactors. On the supply side, the industry has added to, and substantially improved, itspharmaco-therapeutic arsenal. Thanks to these breakthroughs, medical science nowoffers remedies for many diseases and conditions that were previously incurable. On thedemand side, a combination of socio-economic factors, especially population increaseand ageing, has fuelled a steady increase in this spending.
SHARE OF TOTAL PHARMACEUTICAL SPENDING IN TOTAL HEALTH SPENDING (%)
1960 1970 1980 1985 1990 1995 1997
Europe* 19.5 15.9 13.2 13.5 13.4 14.4 15.0
United States 15.8 12.0 8.7 8.6 8.6 8.9 10.0
Japan n.a. n.a. 21.2 18.0 21.4 21.5 21.2
*non weighted average (17 countries) - EFPIA calculationsSource: OECD Health Data 99
PERCENTAGE OF VERY ELDERLY PEOPLE (75 AND OVER) IN TOTAL POPULATION
* weighted average of European Union countries; ** weighted averageNote: figures for the years 1995, 2000 and 2025 are UN projections.Source: World Population prospects, United Nations.
1960 1970 1980 1990 1995p 2000p 2025p
Europe* 3.5 4.0 5.1 6.2 6.0 6.5 9.8
USA 3.1 3.7 4.4 5.3 5.3 5.9 7.5
Japan 1.8 2.1 3.1 4.6 5.4 6.4 14.0
World** 1.5 1.7 1.9 2.2 2.2 2.4 3.4
40
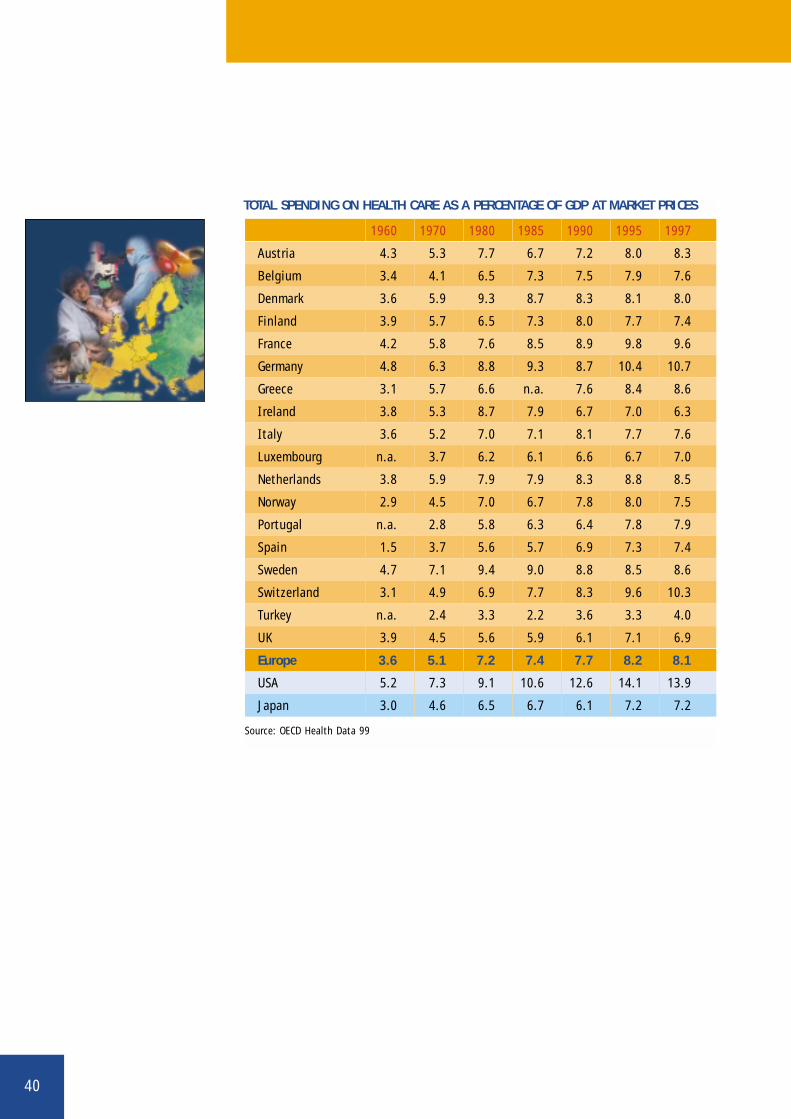
1960 1970 1980 1985 1990 1995 1997
Austria 4.3 5.3 7.7 6.7 7.2 8.0 8.3
Belgium 3.4 4.1 6.5 7.3 7.5 7.9 7.6
Denmark 3.6 5.9 9.3 8.7 8.3 8.1 8.0
Finland 3.9 5.7 6.5 7.3 8.0 7.7 7.4
France 4.2 5.8 7.6 8.5 8.9 9.8 9.6
Germany 4.8 6.3 8.8 9.3 8.7 10.4 10.7
Greece 3.1 5.7 6.6 n.a. 7.6 8.4 8.6
Ireland 3.8 5.3 8.7 7.9 6.7 7.0 6.3
Italy 3.6 5.2 7.0 7.1 8.1 7.7 7.6
Luxembourg n.a. 3.7 6.2 6.1 6.6 6.7 7.0
Netherlands 3.8 5.9 7.9 7.9 8.3 8.8 8.5
Norway 2.9 4.5 7.0 6.7 7.8 8.0 7.5
Portugal n.a. 2.8 5.8 6.3 6.4 7.8 7.9
Spain 1.5 3.7 5.6 5.7 6.9 7.3 7.4
Sweden 4.7 7.1 9.4 9.0 8.8 8.5 8.6
Switzerland 3.1 4.9 6.9 7.7 8.3 9.6 10.3
Turkey n.a. 2.4 3.3 2.2 3.6 3.3 4.0
UK 3.9 4.5 5.6 5.9 6.1 7.1 6.9
Europe 3.6 5.1 7.2 7.4 7.7 8.2 8.1
USA 5.2 7.3 9.1 10.6 12.6 14.1 13.9
Japan 3.0 4.6 6.5 6.7 6.1 7.2 7.2
TOTAL SPENDING ON HEALTH CARE AS A PERCENTAGE OF GDP AT MARKET PRICES
Source: OECD Health Data 99
41
HEALTH CARE EXPENDITURE
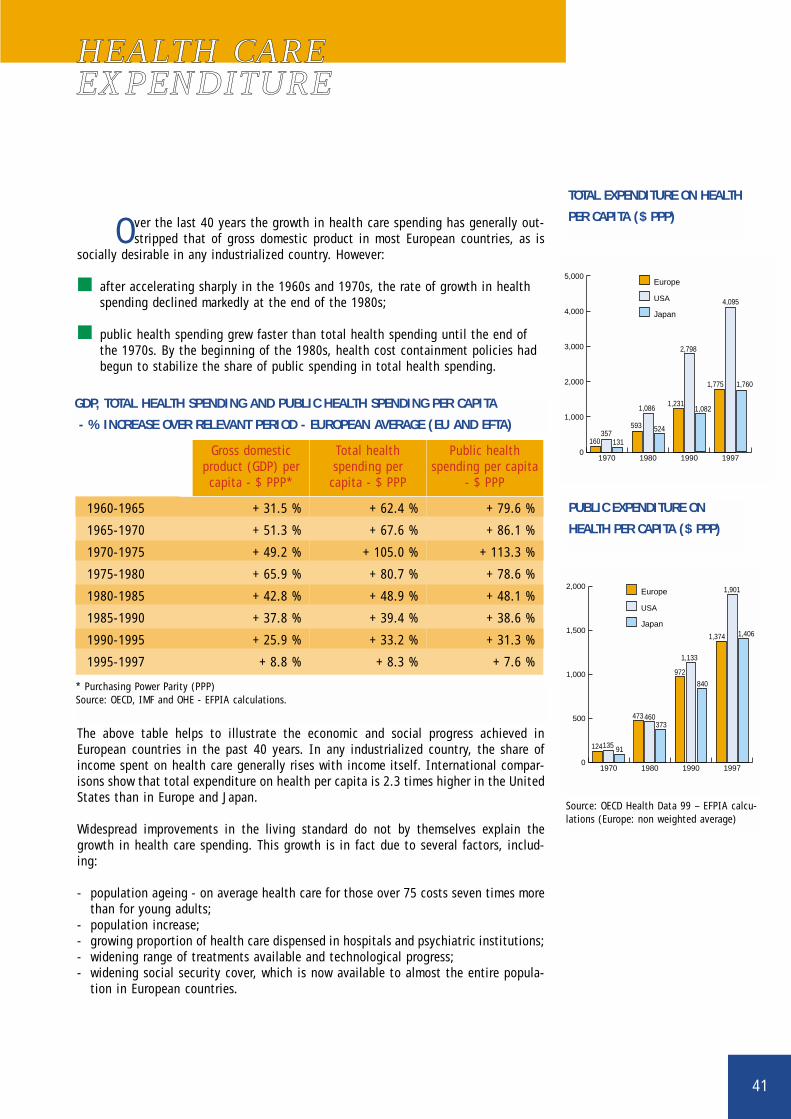
Over the last 40 years the growth in health care spending has generally out-stripped that of gross domestic product in most European countries, as is
socially desirable in any industrialized country. However:
■ after accelerating sharply in the 1960s and 1970s, the rate of growth in healthspending declined markedly at the end of the 1980s;
■ public health spending grew faster than total health spending until the end ofthe 1970s. By the beginning of the 1980s, health cost containment policies hadbegun to stabilize the share of public spending in total health spending.
The above table helps to illustrate the economic and social progress achieved inEuropean countries in the past 40 years. In any industrialized country, the share ofincome spent on health care generally rises with income itself. International compar-isons show that total expenditure on health per capita is 2.3 times higher in the UnitedStates than in Europe and Japan.
Widespread improvements in the living standard do not by themselves explain thegrowth in health care spending. This growth is in fact due to several factors, includ-ing:
- population ageing - on average health care for those over 75 costs seven times morethan for young adults;
- population increase; - growing proportion of health care dispensed in hospitals and psychiatric institutions;- widening range of treatments available and technological progress;- widening social security cover, which is now available to almost the entire popula-
tion in European countries.
GDP, TOTAL HEALTH SPENDING AND PUBLIC HEALTH SPENDING PER CAPITA
- % INCREASE OVER RELEVANT PERIOD - EUROPEAN AVERAGE (EU AND EFTA)
Gross domesticproduct (GDP) percapita - $ PPP*
Total health spending per capita - $ PPP
Public healthspending per capita
- $ PPP
1960-1965 + 31.5 % + 62.4 % + 79.6 %
1965-1970 + 51.3 % + 67.6 % + 86.1 %
1970-1975 + 49.2 % + 105.0 % + 113.3 %
1975-1980 + 65.9 % + 80.7 % + 78.6 %
1980-1985 + 42.8 % + 48.9 % + 48.1 %
1985-1990 + 37.8 % + 39.4 % + 38.6 %
1990-1995 + 25.9 % + 33.2 % + 31.3 %
1995-1997 + 8.8 % + 8.3 % + 7.6 %
* Purchasing Power Parity (PPP)Source: OECD, IMF and OHE - EFPIA calculations.
TOTAL EXPENDITURE ON HEALTH
PER CAPITA ($ PPP)
0
1,000
2,000
3,000
4,000
5,000
1997199019801970
160357
131
593
1,086
524
1,231
2,798
1,082
1,775
4,095
1,760
Europe
Japan
USA
PUBLIC EXPENDITURE ON
HEALTH PER CAPITA ($ PPP)
0
500
1,000
1,500
2,000
1997199019801970
Europe
Japan
USA
124135 91
473 460373
972
1,133
840
1,374 1,406
1,901
Source: OECD Health Data 99 – EFPIA calcu-lations (Europe: non weighted average)
42
1960 1970 1980 1990 1995p 2000p 2020p
Austria 12.0 14.1 15.4 15.0 14.7 14.4 18.7
Belgium 12.0 13.4 14.3 15.1 15.8 16.4 20.0
Denmark 10.6 12.3 14.4 15.6 15.1 14.7 19.0
Finland 7.2 9.2 12.0 13.4 14.1 14.6 21.0
France 11.6 12.9 14.0 14.0 15.2 16.2 20.8
Germany 11.5 13.7 15.6 15.0 15.2 15.9 20.0
Greece 8.3 11.1 13.1 14.0 15.9 17.8 21.6
Ireland 11.2 11.2 10.8 11.4 11.3 11.4 15.9
Italy 9.3 10.9 13.1 14.5 16.1 17.7 23.6
Luxembourg 10.8 12.4 13.7 13.4 13.8 14.3 17.9
Netherlands 9.0 10.2 11.5 12.8 13.2 13.6 20.1
Norway 11.1 12.9 14.8 16.3 15.9 15.0 18.2
Portugal 8.0 9.2 10.5 13.1 14.8 15.7 19.0
Spain 8.2 9.8 10.7 13.4 15.0 16.5 20.4
Sweden 12.0 13.7 16.3 17.8 17.3 16.7 21.0
Switzerland 10.1 11.3 13.8 14.3 14.3 14.7 20.5
Turkey 3.5 4.4 4.7 4.3 5.1 5.9 8.5
UK 11.7 12.9 15.1 15.7 15.8 15.8 19.1
Europe* 10.2 11.8 13.4 14.3 14.9 15.4 19.9
USA 9.2 9.8 11.3 12.5 12.6 12.4 16.3
Japan 5.7 7.1 9.0 12.0 14.2 16.5 25.4
World** 5.3 5.4 5.9 6.2 6.5 6.8 8.9
* weighted average for European Union countries; ** weighted averageFigures for the years 1995, 2000 and 2020 are UN projections.Source: World Population prospects (United Nations)
PERCENTAGE OF ELDERLY PEOPLE (65 AND OVER) IN TOTAL POPULATION
43
VALUE OF MEDICINES IN THE OVERALL HEALTHCARE CONTEXT
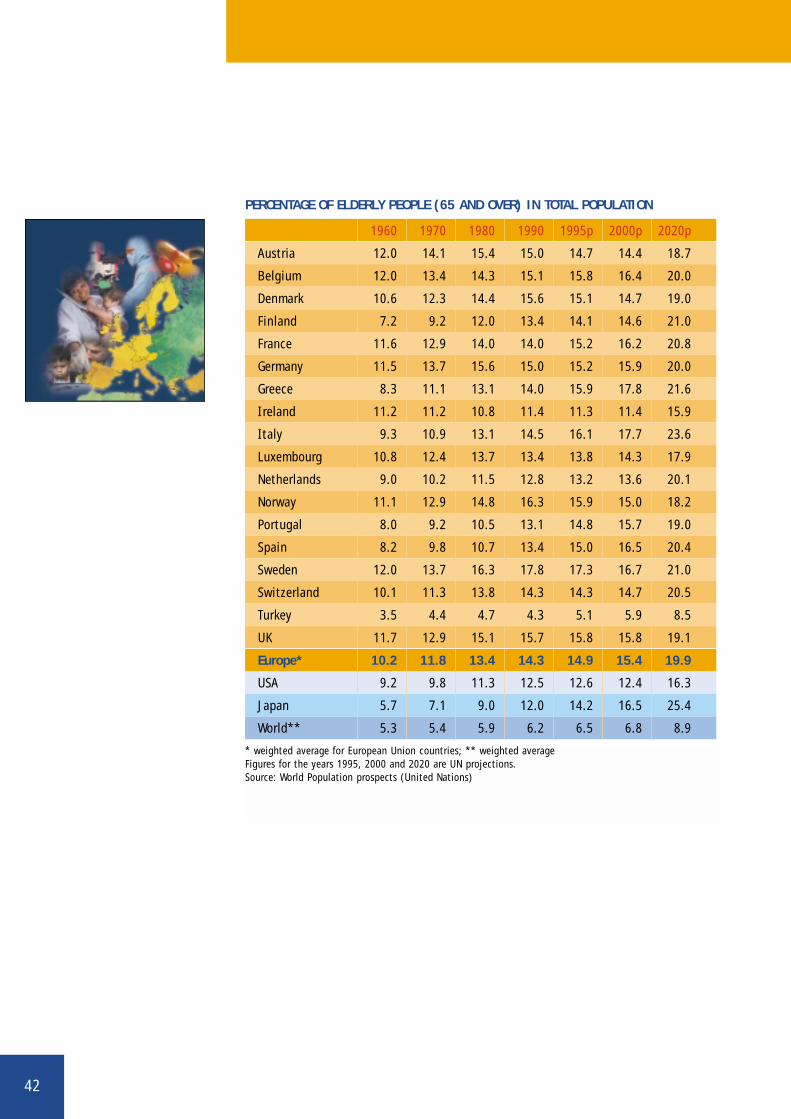
Over the last 40 years, health care expenditure in most industrialised coun-tries has grown faster than the national income. This trend will continue due
to the combination of several factors including population ageing, rising expectationsof patients and medical progress. The table opposite details United Nations projectionsof the proportion of elderly people in the total population for various European coun-tries. The projections for the next 25 years are based principally on two factors:increases in life expectancy and the post-war "baby boom".
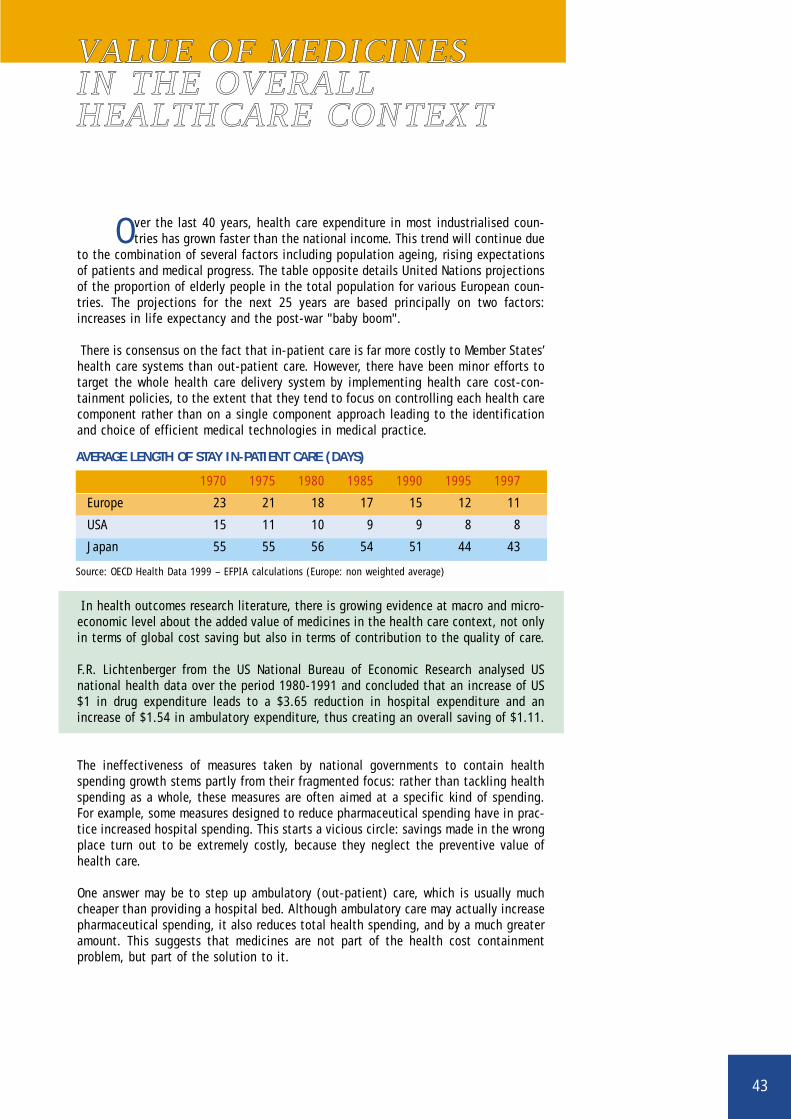
There is consensus on the fact that in-patient care is far more costly to Member States’health care systems than out-patient care. However, there have been minor efforts totarget the whole health care delivery system by implementing health care cost-con-tainment policies, to the extent that they tend to focus on controlling each health carecomponent rather than on a single component approach leading to the identificationand choice of efficient medical technologies in medical practice.
In health outcomes research literature, there is growing evidence at macro and micro-economic level about the added value of medicines in the health care context, not onlyin terms of global cost saving but also in terms of contribution to the quality of care.
F.R. Lichtenberger from the US National Bureau of Economic Research analysed USnational health data over the period 1980-1991 and concluded that an increase of US$1 in drug expenditure leads to a $3.65 reduction in hospital expenditure and anincrease of $1.54 in ambulatory expenditure, thus creating an overall saving of $1.11.
The ineffectiveness of measures taken by national governments to contain healthspending growth stems partly from their fragmented focus: rather than tackling healthspending as a whole, these measures are often aimed at a specific kind of spending.For example, some measures designed to reduce pharmaceutical spending have in prac-tice increased hospital spending. This starts a vicious circle: savings made in the wrongplace turn out to be extremely costly, because they neglect the preventive value ofhealth care.
One answer may be to step up ambulatory (out-patient) care, which is usually muchcheaper than providing a hospital bed. Although ambulatory care may actually increasepharmaceutical spending, it also reduces total health spending, and by a much greateramount. This suggests that medicines are not part of the health cost containment problem, but part of the solution to it.
AVERAGE LENGTH OF STAY IN-PATIENT CARE (DAYS)
Source: OECD Health Data 1999 – EFPIA calculations (Europe: non weighted average)
1970 1975 1980 1985 1990 1995 1997
Europe 23 21 18 17 15 12 11
USA 15 11 10 9 9 8 8
Japan 55 55 56 54 51 44 43
44
The pharmaceutical industry plays a vital role by turning fundamental researchfindings into innovative treatments that are widely available and accessible.
Its successes in researching and developing new medicines have spurred medicalprogress, in the treatment of infections, some forms of cancer, nervous disorders, stom-ach ulcers, asthma, hypertension and AIDS, to name but a few. Medicines have helpedto raise life expectancy, and to eradicate previously fatal diseases such as tuberculosis,syphilis, diphtheria and polio. However, some diseases still defy the medical world, andthe best hopes of defeating them lie in pharmaceutical research.
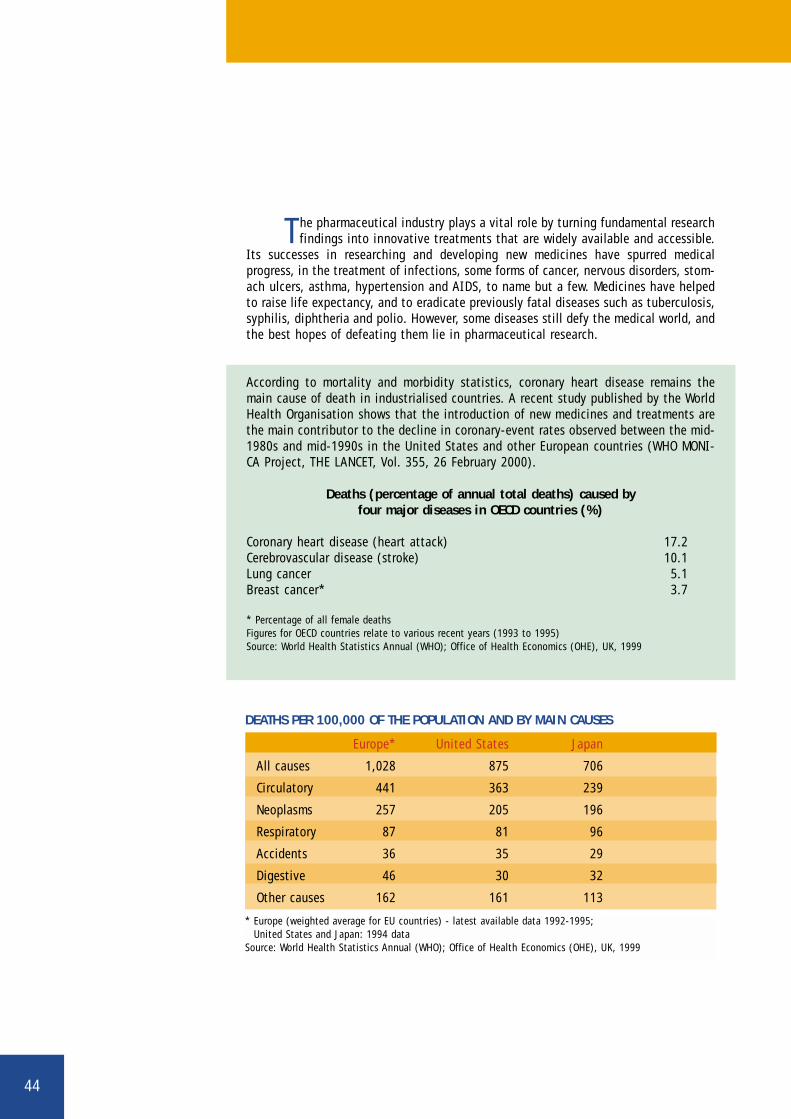
According to mortality and morbidity statistics, coronary heart disease remains themain cause of death in industrialised countries. A recent study published by the WorldHealth Organisation shows that the introduction of new medicines and treatments arethe main contributor to the decline in coronary-event rates observed between the mid-1980s and mid-1990s in the United States and other European countries (WHO MONI-CA Project, THE LANCET, Vol. 355, 26 February 2000).
Deaths (percentage of annual total deaths) caused by four major diseases in OECD countries (%)
Coronary heart disease (heart attack) 17.2Cerebrovascular disease (stroke) 10.1Lung cancer 5.1Breast cancer* 3.7
* Percentage of all female deathsFigures for OECD countries relate to various recent years (1993 to 1995)Source: World Health Statistics Annual (WHO); Office of Health Economics (OHE), UK, 1999
Europe* United States Japan
All causes 1,028 875 706
Circulatory 441 363 239
Neoplasms 257 205 196
Respiratory 87 81 96
Accidents 36 35 29
Digestive 46 30 32
Other causes 162 161 113
DEATHS PER 100,000 OF THE POPULATION AND BY MAIN CAUSES
* Europe (weighted average for EU countries) - latest available data 1992-1995; United States and Japan: 1994 data
Source: World Health Statistics Annual (WHO); Office of Health Economics (OHE), UK, 1999
45
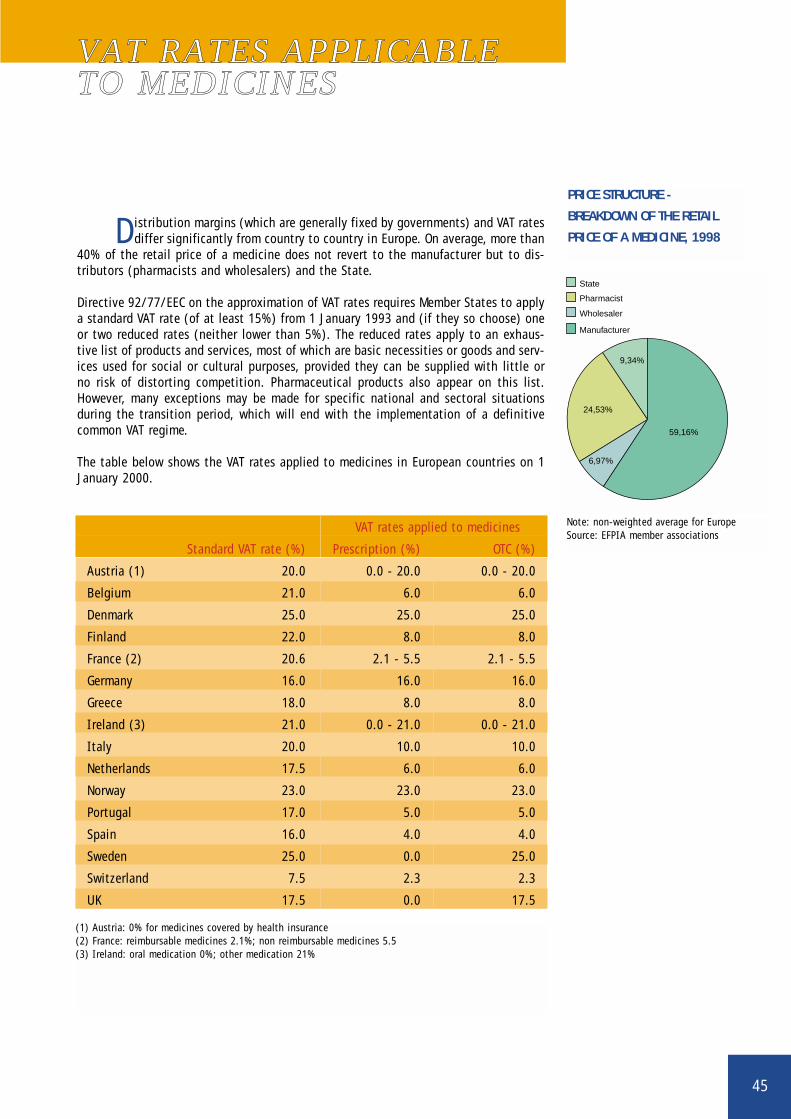
Note: non-weighted average for EuropeSource: EFPIA member associations
VAT RATES APPLICABLETO MEDICINES
Distribution margins (which are generally fixed by governments) and VAT ratesdiffer significantly from country to country in Europe. On average, more than
40% of the retail price of a medicine does not revert to the manufacturer but to dis-tributors (pharmacists and wholesalers) and the State.
Directive 92/77/EEC on the approximation of VAT rates requires Member States to applya standard VAT rate (of at least 15%) from 1 January 1993 and (if they so choose) oneor two reduced rates (neither lower than 5%). The reduced rates apply to an exhaus-tive list of products and services, most of which are basic necessities or goods and serv-ices used for social or cultural purposes, provided they can be supplied with little orno risk of distorting competition. Pharmaceutical products also appear on this list.However, many exceptions may be made for specific national and sectoral situationsduring the transition period, which will end with the implementation of a definitivecommon VAT regime.
The table below shows the VAT rates applied to medicines in European countries on 1January 2000.
PRICE STRUCTURE -
BREAKDOWN OF THE RETAIL
PRICE OF A MEDICINE, 1998
State
Pharmacist
Wholesaler
Manufacturer
24,53%
59,16%
6,97%
9,34%
VAT rates applied to medicines
Standard VAT rate (%) Prescription (%) OTC (%)
Austria (1) 20.0 0.0 - 20.0 0.0 - 20.0
Belgium 21.0 6.0 6.0
Denmark 25.0 25.0 25.0
Finland 22.0 8.0 8.0
France (2) 20.6 2.1 - 5.5 2.1 - 5.5
Germany 16.0 16.0 16.0
Greece 18.0 8.0 8.0
Ireland (3) 21.0 0.0 - 21.0 0.0 - 21.0
Italy 20.0 10.0 10.0
Netherlands 17.5 6.0 6.0
Norway 23.0 23.0 23.0
Portugal 17.0 5.0 5.0
Spain 16.0 4.0 4.0
Sweden 25.0 0.0 25.0
Switzerland 7.5 2.3 2.3
UK 17.5 0.0 17.5
(1) Austria: 0% for medicines covered by health insurance(2) France: reimbursable medicines 2.1%; non reimbursable medicines 5.5(3) Ireland: oral medication 0%; other medication 21%
46
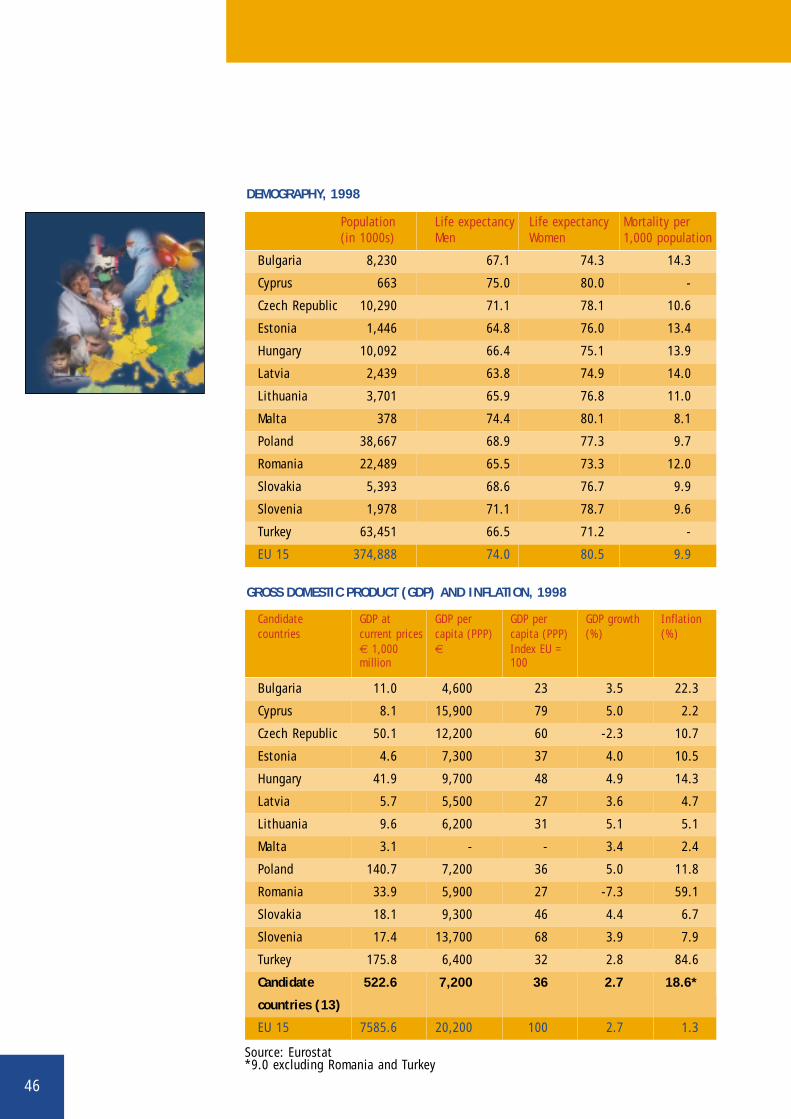
DEMOGRAPHY, 1998
Population Life expectancy Life expectancy Mortality per(in 1000s) Men Women 1,000 population
Bulgaria 8,230 67.1 74.3 14.3
Cyprus 663 75.0 80.0 -
Czech Republic 10,290 71.1 78.1 10.6
Estonia 1,446 64.8 76.0 13.4
Hungary 10,092 66.4 75.1 13.9
Latvia 2,439 63.8 74.9 14.0
Lithuania 3,701 65.9 76.8 11.0
Malta 378 74.4 80.1 8.1
Poland 38,667 68.9 77.3 9.7
Romania 22,489 65.5 73.3 12.0
Slovakia 5,393 68.6 76.7 9.9
Slovenia 1,978 71.1 78.7 9.6
Turkey 63,451 66.5 71.2 -
EU 15 374,888 74.0 80.5 9.9
GROSS DOMESTIC PRODUCT (GDP) AND INFLATION, 1998
Candidate GDP at GDP per GDP per GDP growth Inflationcountries current prices capita (PPP) capita (PPP) (%) (%)
€ 1,000 € Index EU =million 100
Bulgaria 11.0 4,600 23 3.5 22.3
Cyprus 8.1 15,900 79 5.0 2.2
Czech Republic 50.1 12,200 60 -2.3 10.7
Estonia 4.6 7,300 37 4.0 10.5
Hungary 41.9 9,700 48 4.9 14.3
Latvia 5.7 5,500 27 3.6 4.7
Lithuania 9.6 6,200 31 5.1 5.1
Malta 3.1 - - 3.4 2.4
Poland 140.7 7,200 36 5.0 11.8
Romania 33.9 5,900 27 -7.3 59.1
Slovakia 18.1 9,300 46 4.4 6.7
Slovenia 17.4 13,700 68 3.9 7.9
Turkey 175.8 6,400 32 2.8 84.6
Candidate 522.6 7,200 36 2.7 18.6*
countries (13)
EU 15 7585.6 20,200 100 2.7 1.3
Source: Eurostat*9.0 excluding Romania and Turkey
47
EUROPEAN UNIONENLARGEMENT
EU accession negotiations with Cyprus, the Czech Republic, Estonia, Hungary,Poland and Slovenia got into full swing in 1999. This saw a first round of dis-
cussions with the candidates on key areas of legislation relevant to the pharmaceuti-cal industry, including intellectual property and pharmaceutical legislation. Theenlargement process was given a new spin at the Helsinki European Summit at the endof 1999, which extended the accession negotiations to include Bulgaria, Latvia,Lithuania, Malta, Romania and the Slovak Republic. Turkey will be brought into the for-mal accession process, although at a later date which has yet to be fixed.
The starting point for these negotiations is the association agreements signed by theEU and accession candidates. These agreements, which rely on the principle of reci-procity, aim to strengthen the EU’s (economic) links with candidate countries, so as toenable them to participate in the process of European integration. They require, interalia, the establishment of a new economic order, founded on the market economy, themonitoring of the economic and social consequences of structural readjustment, andrespect for rights and obligations under the General Agreement on Tariffs and Trade(GATT).
The negotiating process will be spread over several years, considering that the pace ofaccession will be determined both by political events and by the ability of candidatecountries to comply with the acquis communautaire. This means that EU accessionentails not only adopting the acquis communautaire in its entirety, but also putting inplace the institutional, administrative and other machinery necessary to enforce it.
Given the economic gulf separating them from candidate countries, some suggest thata suitable transition period is necessary before candidate countries actually join theEU. The fact that their economic conditions (see tables opposite), health standards andintellectual property enforcement records still differ significantly from those of EUMember States suggests that adopting and enforcing the acquis will take several yearsof intensive effort, in particular for the effective implementation of European pharma-ceutical legislation.
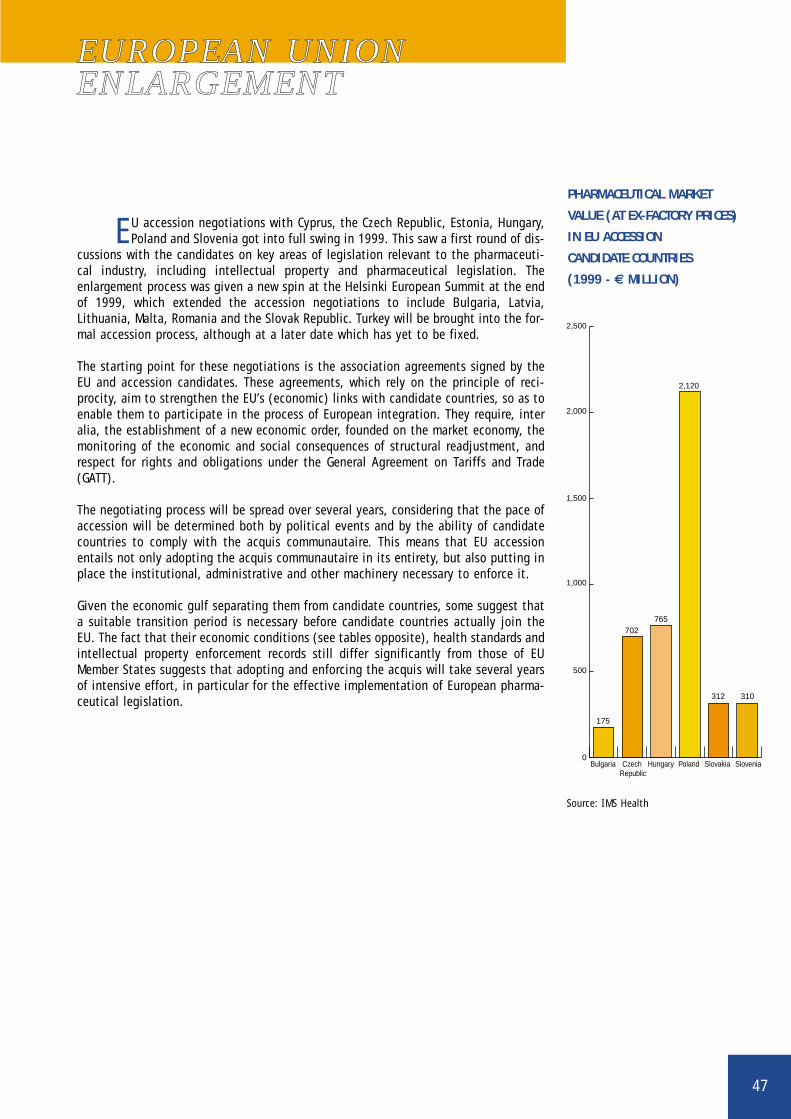
PHARMACEUTICAL MARKET
VALUE (AT EX-FACTORY PRICES)
IN EU ACCESSION
CANDIDATE COUNTRIES
(1999 - € MILLION)
0
500
175
702765
2,120
312 310
1,000
1,500
2,000
2,500
SloveniaSlovakiaPolandHungaryCzech Republic
Bulgaria
Source: IMS Health
48
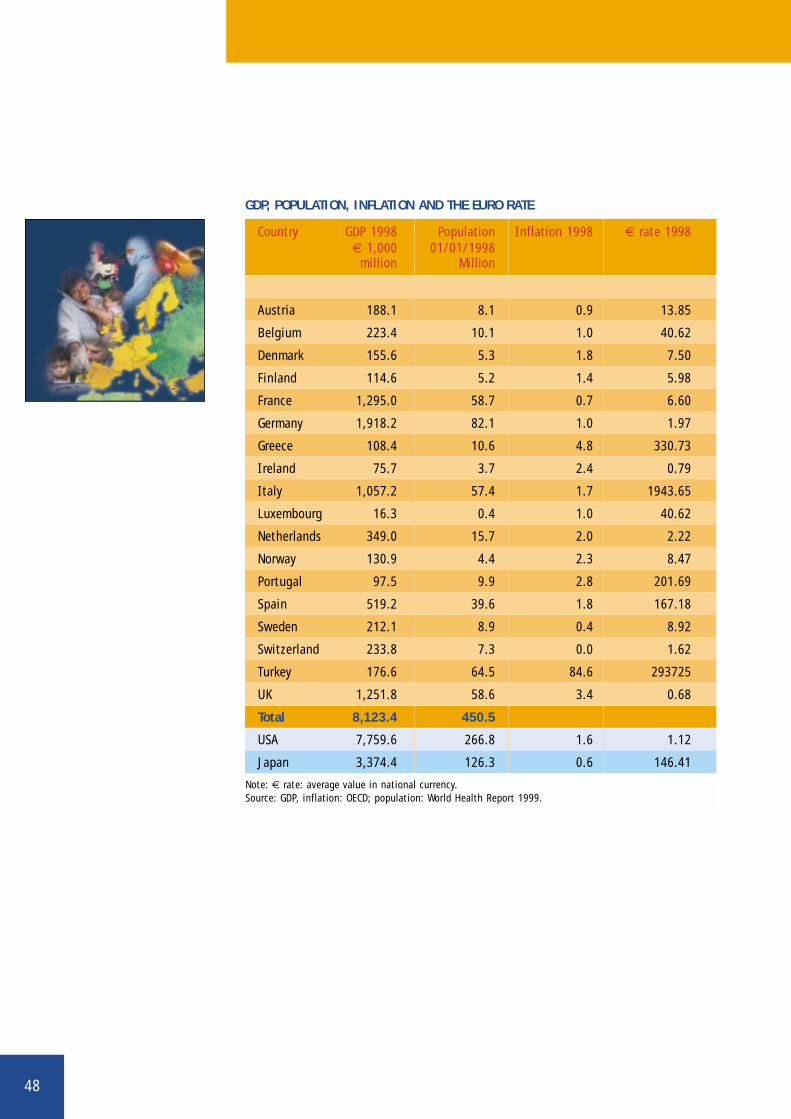
Country GDP 1998 Population Inflation 1998 € rate 1998€ 1,000 01/01/1998 million Million
Austria 188.1 8.1 0.9 13.85
Belgium 223.4 10.1 1.0 40.62
Denmark 155.6 5.3 1.8 7.50
Finland 114.6 5.2 1.4 5.98
France 1,295.0 58.7 0.7 6.60
Germany 1,918.2 82.1 1.0 1.97
Greece 108.4 10.6 4.8 330.73
Ireland 75.7 3.7 2.4 0.79
Italy 1,057.2 57.4 1.7 1943.65
Luxembourg 16.3 0.4 1.0 40.62
Netherlands 349.0 15.7 2.0 2.22
Norway 130.9 4.4 2.3 8.47
Portugal 97.5 9.9 2.8 201.69
Spain 519.2 39.6 1.8 167.18
Sweden 212.1 8.9 0.4 8.92
Switzerland 233.8 7.3 0.0 1.62
Turkey 176.6 64.5 84.6 293725
UK 1,251.8 58.6 3.4 0.68
Total 8,123.4 450.5
USA 7,759.6 266.8 1.6 1.12
Japan 3,374.4 126.3 0.6 146.41
Note: € rate: average value in national currency.Source: GDP, inflation: OECD; population: World Health Report 1999.
GDP, POPULATION, INFLATION AND THE EURO RATE
49
NOTES
This booklet provides some general statistical data on the pharmaceuticalindustry's activity, and on the context in which it operates. The statistics
have been compiled principally on the basis of information supplied by EFPIA's mem-ber associations, supplemented with additional data from various other sources, suchas the OECD, Eurostat and the United Nations.
Every effort has been made to compile these statistics on a common basis. For sever-al years, EFPIA has based its work in this area on the OECD Standard International TradeClassification (SITC) heading 54, which covers the entire chapter on medicinal productsand some sections on specific active substances produced by the pharmaceutical indus-try. Since the SITC was last revised (SITC Rev.3 - 1988), division 54 no longer coverssulphonamides, which are now included in division 51 (5158). These statistics havetherefore been compiled on the basis of SITC 54 Rev.3 including sulphonamides (SITC5158).
It should be noted that:
■ any differences between these statistics and those published by EFPIA's nationalmember associations are almost certainly due to the choice of SITC 54 and theneed to establish definitions common to all the countries represented by EFPIA.As it does not include certain basic substances, SITC division 54 may in somecases be too restrictive to provide an accurate picture of pharmaceutical industryactivity in several countries;
■ certain data have been updated and revised, and concepts clarified. As a result,the data in this edition may not be strictly comparable with those in precedingones;
■ since 1991, the figures for Germany have included the territory of the easternLänders;
■ all data have been converted into a single currency, the EURO (€). Any properanalysis should therefore take account of the impact of exchange rate movementson the figures in this booklet;
■ by ratifying the Maastricht Treaty, 12 European Community Member Statesbrought the European Union into existence on 1 November 1993. The EuropeanUnion is composed of 15 Member States since Austria, Finland and Swedenjoined it on 1 January 1995;
■ since 1997, EFPIA aggregate figures have covered Turkey.
50
DEFINITION OF A MEDICINAL PRODUCT
Any survey of the pharmaceutical sector requires a definition of what is meantby medicinal products. Within the European Community, Article 1 of Directive
65/65/EEC defines medicinal products as follows:
1. Proprietary medicinal product:Any ready-prepared medicinal product placed on the market under a special nameand in a special pack.
2. Medicinal Product:Any substance or combination of substances presented for treating or preventingdiseases in human beings or animals. Any substance or combination of substanceswhich may be administered to human beings or animals with a view to making amedical diagnosis or to restoring, correcting or modifying physiological functionsin human beings is likewise considered a medicinal product.
3. Substance:Any matter, irrespective of origin, which may be:- human, e.g. human blood and human blood products- animal, e.g. micro-organisms, whole animals, parts or organs, animal secretions,toxins, extracts, blood products, etc.
- vegetable, e.g. micro-organisms, plants, parts of plants, vegetable secretions,extracts, etc.
- chemical, e.g. elements, naturally occurring chemical materials and chemicalproducts obtained by chemical change or synthesis.
Directive 65/65/EEC sets out the framework of the pharmaceutical regulation, anddefines the "proprietary medicinal products" to which it applies.
The EC rules cover new and existing medicinal products. Products such as vaccines, tox-ins and sera, allergens, blood products, homeopathic medicines and radiopharmaceuti-cals were initially exempt from EC rules. However, on 1 January 1992 they were extend-ed to cover all these products (directives 89/341/EEC, 89/342/EEC, 89/343/EEC and89/381/EEC); homeopathic medicines have been covered by Directive 92/73/EEC since1 January 1994.
Composition of SITC heading 54 Combined Nomenclature Code (CN)
Provitamins 29.36
Hormones 29.37
Heterosides 29.38
Alkaloids 29.39
Antibiotics 29.41
Pharmaceutical products 30.01-30.06
COMPOSITION OF OECD SITC HEADING 54
OECD SITC heading 54 covers Chapter 30 and several sections of Chapter 29 of
the Code of Combined Nomenclatures:
Since the SITC was last revised (SITC Rev.3 - 1988), heading 54 no longer covers sulphonamides; these arenow included in heading 51 (SITC 5158).