Embed Size (px)
Citation preview

THE JOURNAL OF BIOLOGICAL CHEMISTRY Vol. 244, No. 13, Issue of July 10, pp. 3625-31334, 1969
Printed in U.S.A.
The pH Dependence of the Individual Steps in the Glucose Oxidase Reaction*
(Received for publication, September 3, 1968)
HAROLD J. BRIGHTS AND MARYANNE APPLEBY
From the Department of Biochemistry, School of Medicine, University of Pennsylvania, Philadelphia, Pennsyl- vania 19104
SUMMARY
The kinetics of oxidation of n-mannose, Z-deoxy-n-glu- case, and D-glucose by glucose oxidase from PeniciZZium nofafum has been studied in the pH range from 3 to 8 at 25”, in the presence of 0.2 M KCI. The pH dependence of the individual steps in the catalytic mechanism was determined by stopped flow spectrophotometric measurements of each half-reaction, in conjunction with conventional steady state kinetic measurements of the over-all reaction. The follow- ing scheme, originally deduced by Gibson, Swoboda, and Massey (J. Biol. Chem., 239, 3927 (1964)) for the enzyme from Aspergillus niger at pH 5.6 and 25”, was found to commodate the results at any value of pH in the range amined.
kt kz Eo + S A E,-S __f E, -I- d-lactone
k-1
L ks Er + 0s - E,-P, - Eo + HzOz
ac- ex-
where E,, E,, S, and P are, respectively, oxidized enzyme, reduced enzyme, substrate, and product.
The pH dependence and other characteristics of each step in turn are as follows.
1. The pH profile for kl is sigmoid, and indicates that the combination of substrate with EO is dependent upon a basic group (pK1 = 5.00 for mannose and glucose; pK1 = 5.35 for 2-deoxyglucose) in the enzyme. There is a small solvent deuterium isotope effect on kl. Halides have a specitic effect on SKI, causing it to increase markedly, but have no effect on &I.
2. Flavin reduction, controlled by kz and measured with 2-deoxyglucose, is relatively insensitive to pH in the range from 3 to 8. Halides also specifically decrease the rate of flavin reduction.
3. The pH profile for k, is sigmoid and indicates that the
* This project was supported by Grant GM11040 from the National Institutes of Health, United States Public Health Service. A preliminary report of this investigation appears in Reference 1.
$ R.esearch Career Development Awardee (5-K3-GM-34960), United States Public Health Service.
combination of O2 with Er is dependent upon an acidic group @I(4 = 6.90) in the enzyme.
4. The pH profile for ks is bell shaped and indicates that this terminal, tirst order process (which may consist of more than one step) is dependent upon an acidic (pK’s = 7.40) and a basic @KG = 4.10) group in the enzyme.
Based on these findings, a kinetic scheme is presented which accounts for the pH dependence of the steady state velocity of oxidation of the three sugars in the pH range from 3 to 8. Analogue simulation of the partition of the enzyme between oxidized and reduced forms during turnover at different values of pH, with experimentally determined values of acid dissociation and rate constants, agreed with turn- over patterns obtained in stopped flow spectrophotometric experiments at 450 rnp.
The flavoprotein glucose oxidase (EC 1.1.3.4) from Penicil- lium notatum and other fungi catalyzes the irreversible oxidation of a number of aldoses to the corresponding la&ones according to Equation 1.
R&OH + 02 -+ R&=0 +
‘H
H 0 9 2 (1)
Although some differences have been noted in physical and chemi- cal properties of the enzyme from various fungi (2), no significant differences in kinetic properties appear to have been reported. Glucose oxidase from P. m&turn has a molecular weight of 152,000, and contains 2 moles of firmly bound FAD (3). A recent review article on flavoproteins (4) includes a short discus- sion of glucose oxidase.
The kinet,ic mechanism of the reaction catalyzed by glucose oxidase from Aspergd~us niger was convincingly deduced in 1964 by Gibson, Swoboda, and Massey (5) from the results of system- atic stopped flow spectrophotometric experiments and mano- metric measurements carried out at pH 5.6 and over the tempera- ture range from 0” to 38”. No evidence was obtained for kinetically significant flavin semiquinoid intermediates, and all their kinetic data could be quantitatively analyzed in terms of
3625
by guest on May 27, 2018
http://ww
w.jbc.org/
Dow
nloaded from

3626 pH Dependence of Glucose Oxidase Reaction Vol. 244, No. 13
the partition of the enzyme between two spectrophotometric forms only, namely, fully oxidized (E,) and fully reduced (E,).1 The results from all sugar substrates tested were accommodated by a general scheme, which consists of a reductive half-reaction (Equation 2) and an oxidative half-reaction (Equation 3).
kl k, E, + S a E,-S -
k-1 (2)
kt -%-PI ----+ E, + lactone
k4 kc E, + 02 - E,-Pz __+ Eo + HzOz (3)
The adequacy of this scheme was shown by quantitative regener- ation of substrate competition and stopped flow turnover experi- ments. Nakamura and Ogura (6) have also studied this reaction by kinetic and other techniques, and their results, including the failure to identify semiquinoid intermediates, are in substantial agreement with those of Gibson, Swoboda, and Massey (5).
Using an experimental approach similar to that used at pH 5.6 by Gibson, Swoboda, and Massey (5), we have been able to determine the pH dependence of the individual steps in the cata- lytic mechanism at 25”. We find that Equations 2 and 3 de- scribe the kinetic behavior of glucose oxidase from P. no&&m over the pH range from 3 to 8, and in the particular case of pH 5.6, our results are in agreement with those described previously (5). Our studies have been facilitated by the fact that the prin- cipal rate-determining steps, both in the reductive half-reaction and in the over-all reaction, vary remarkably depending upon the structure of the sugar substrate.
EXPERIMENTAL PROCEDURE
Materials
Glucose oxidase (P. notatum), A grade, obtained from Boeh- ringer Mannheim, was commonly stored at 4”, at concentrations ranging from 1 to 10 mg per ml, in 0.005 M pOfW3iUm citrate, pH 5.5, containing 0.2 M KCl. Free flavin was effectively re- moved by repeated concentration of the enzyme solution in the Schleicher and Schuell collodion bag apparatus to a volume of about 0.5 ml. This method was also used, with good quantita- tive recovery, to reclaim enzyme from solutions used in stopped flow experiments. Solutions of the enzyme, and of all other reagents, were routinely treated with Millipore filters before use in any kinetic experiment.
2-Deoxy-n-glucose was obtained from Calbiochem (A grade and “glucose-free”) and also from Sigma; D-mannOSe was ob- tamed from Mann. Contamination of these chemicals by D-
glucose was reduced to acceptable levels by methods described previously (5). Samples of 2-deoxy-n-glucose, from either purveyor, contained variable amounts of a yellow impurity which absorbed quite strongly in the ultraviolet region. This impurity had no effect on glucose oxidase kinetics, however, since 2-deoxyglucose from batches having none or Iittle of the impurity (either as received or after extensive charcoal treat-
‘The abbreviations used in equations are: ET, sum of all en- zyme species; E,, oxidized enzyme; E,, reduced enzyme; X, sugar substrate; P, product; M, n-mannose; 2DG, 2-deoxy-n-glucose; G, n-glucose.
ment) behaved no differently than batches which were visibly contaminated.
n-Glucose, obtained from Pfanstiehl Laboratories, was used without further treatment.
Equilibrium mixtures of OL and /3 forms of the sugars were used in all experiments, and the kinetic data are therefore expressed in terms of analytical sugar concentrations. The total concen- tration of sugar oxidized in the kinetic experiments was always much less than the equilibrium concentration of the p isomer, for which glucose oxidase is specific (7).
The following buffers were used: 0.02 M potassium citrate for pH 3.1, 4.75, and 5.4; 0.05 M potassium citrate for pH 3.5, 3.75, 4.5, and 5.1; 0.05 M potassium acetate for pH 4.0, 4.25, and 4.5; 0.02 M potassium phosphate for pH 6.0 and 6.4; 0.05 M imidazole hydrochloride for pH 6.65 and 7.0; and 0.02 M Tris hydrochloride for pH 7.8 and 8.5.
A variety of tests, involving the use of different buffers at different concentrations but at a constant ionic strength of 0.2, maintained with KCl, failed to reveal specific buffer effects. The enzyme is, however, subject to specific halide effects, particu- larly at pH values below 6.
Mefhods
Enzyme Concentration-Enzyme concentrations in stock solu- tions, expressed as molarity of E-FAD, were routinely estimated by assay of catalytic activity at 25”, with the use of 0.1 M 2-de- oxy-n-glucose and about 1 InM 02 in 0.1 M potassium acetate, pH 5.4, containing 1 mM KCN. The details of such measure- ments are described below, under “Spectrophotometric Turnover Experiments.” The advantage of this assay is that the reaction is fairly rapid and is zero order in 02. The concentration of E-FAD in any stock enzyme solution which had been assayed in this manner was then determined by comparing its catalytic activity with that of a “standard” solution of glucose oxidase (freed of unbound flavin), the absorbance of which in a well aerated citrate-KC1 solution (see “Materials”) had been carefully measured at 450 mp. The extinction coefficient for E-FAD was taken to be e450 = 10.9 rnM-l cm-’ (2).
Enzyme Stability-The enzyme was stable for at least 8 hours, at 25” and in the presence of 0.2 M KCI, over the pH range from 3 to 8. Therefore, within the pH range none of our results is attributed to irreversible, or slowly reversible, effects of solvent on the enzyme.
Xpectrophotomefric Turnover ExperimentsThese were con- ventional steady state kinetic experiments in which the rate of H202 formation was measured at 235 rnp (~235 = 0.058 mM-1 cm-l) as a function of the concentrations of sugar and O2 at selected pH values between 3 and 8. Measurements were made on a Cary 15 spectrophotometer with 0 to 0.1 absorbance slide- wire and with cell compartments and holders maintained by thermostats at 25”. A slit width of 0.5 mm was used in all ex- periments. The effects of ionic strength, 2H~0, and slit width on es5 for Hz02 were found to be small. Furthermore, the species Hot-, which has a larger extinction coefficient than Hz02, was never present in significant amounts, since the pK, value for its formation is 11.7 (8).
Reactions were carried out in completely filled, and sealed, quartz cuvettes of 3.4 ml capacity containing a small glass bead to aid mixing. Purified oxygen was bubbled through the buffered sugar solution, containing 0.2 M KCl, for 10 min, be- fore addition to the cuvette. Enzyme and KCN were then
by guest on May 27, 2018
http://ww
w.jbc.org/
Dow
nloaded from

Issue of July 10, 1969 H. J. Bright and M. Appleby 3627
added separately (usually in 0.02 ml volumes). KCN, at a final concentration of 1 mM, was present in all turnover experi- ments to inhibit traces of catalase in the glucose ox&se solu- tions. The final concentration of glucose oxidase was in the range from 7.0 x 10Fg to 7.4 x 10-v M, depending on the nature of the sugar (which determines the rapidity of turnover).
Each reaction was allowed to proceed until the 02 had been completely consumed. Since the initial concentration of sugar always greatly exceeded that of oxygen, the sugar concentration could be regarded as constant throughout the experiment. The oxygen concentration at any time is equal to 0.058 (Am - At) mM, with the initial value usually about 1 mM. No less than four experiments, spanning at least a 5-fold range in sugar concentra- tion, were carried out at each pH value.
Because the reaction is for all practical purposes irreversible, and because there is no significant product inhibition, any spec- trophotometric trace having curvature (owing to dependence on the rate of the concentration of 02) was accurately fitted to the following equation.
rET1=A+B V LO21
(4)
The kinetic significance of A depends on the nature of the sugar, whereas B is equal to l/k, for all sugars. The values of l/A and B/A (the Michaelis constant for 02) which best describe the spectrophotometric trace were obtained by a digital computer procedure.2
Xfopped Flow Experiments-These were carried out at 450 rnp (corresponding to an absorption maximum of the oxidized form of glucose oxidase) and 25” with the Gibson-Durrum stop- ped flow apparatus, with the use of adequate time constants. The light path was 2.0 cm and the concentration of E-FAD ranged from 4 to 8 j.iM after mixing. Ordinate millivoltages were converted manually to AA460 values.
Stopped flow measurements of the reductive half-reaction are based on the decrease in absorbance at 450 rnp accompanying the reduction of the enzyme by the sugar substrates. Buffered enzyme and sugar solutions containing 0.2 M KC1 were introduced into the drive syringes from tonometers after having been deoxy- genated by repeated evacuation and flushing with nitrogen. At least four sugar concentrations were used at each pH value.
Stopped flow measurements of the oxidative half-reaction utilize the increase in absorbance at 450 rnp which occurs when 02 interacts with the reduced enzyme. An anaerobic solution of buffered enzyme in 0.2 M KC1 in a tonometer was reduced by a slight molar excess of n-glucose before being introduced
2 R. 0. Viale, manuscript in preparation. The time course of 1021 can be found by integrating Equation 4, yielding
Equation 4a is a special case of
?%#I (4b)
where a, b, and the subscript terms are constants. Equation 4b describes the time course of many steady state enzyme reac- tions, and the constants a(- l/A) and b(- B/A) can be evaluated with regression techniques.
into the drive syringe. Solutions containing known concentra- tions of 0% were obtained by carefully transferring appropriate volumes of an anaerobic buffered solution, containing 0.2 M KCI, from a tonometer to an air-equilibrated solution of the same composition in a syringe containing a small glass bead to aid mixing. The drive syringe was then filled from this syringe. At least three O2 concentrations (all of which were sufficiently high to attain pseudofirst order conditions) were used at each pH value.
All stopped flow measurements of, the half-reactions could be accurately analyzed as pseudofirst order reactions by standard graphic procedures, with half-times in the range from 0.006 to 2.56 sec.
RESULTS
dkfannose
Xpectrophotometric Turnover Experiments-Rates of HzOz for- mation were measured as a function of the concentrations of mannose (0.1 M to 0.5 M) and of 02 over a wide range of pH at 25”. The concentration of enzyme was in the range, 2.7 to 7.4 x 10-T M. We used higher enzyme concentrations at low pH values in order to compensate for the small turnover numbers encoun- tered under these conditions.
Over the entire range of pH in which the enzyme was com- pletely stable, and at all mannose concentrations, each spectro- photometric trace consisted of a linear increase in absorbance which was terminated by a small and abrupt decrease in absorb- ance just prior to the cessation of the reaction. This indicates that the turnover rate is independent of the concentration of oxygen within the sensitivity of the experiments. During turn- over with mannose, the enzyme flavin remains completely oxi- dized until oxygen is exhausted, whereupon the flavin becomes completely reduced. This reduction is accompanied by a de- crease in the extinction coefficient of enzyme-bound flavin at 235 rnp.
At pH 5.6, the combination of mannose with E, is completely rate-determining in turnover (5), and the kinetic scheme is simply
E, + M ----+ E, + lactone + HzOz (02)
(5)
for which the rate equation is
1 [ET] 1 -= _=- k
(6) ohs V k&II
When values of [Er]/v were plotted against the reciprocal of the concentrations of mannose, the experimental points fitted a straight line passing through the origin at all pH values. These results indicate that turnover was accurately bimolecular (first order in enzyme and first order in mannose) at all pH values and mannose concentrations used. The values of the apparent bi- molecular rate constants, kl ,*rD, were obtained from the slope of the plots and are shown as a function of pH in Fig. 1.
Stopped Flow Reductive Half-reaction Experiments-The kinetics of reduction of the enzyme by mannose at 450 mp was measured spectrophotometrically at 25” at several pH values which were selected on the basis of the results from the turnover experiments just described. Mannose was varied from 0.02 to 0.3 M, and the enzyme concentration was 6 pM. Double
by guest on May 27, 2018
http://ww
w.jbc.org/
Dow
nloaded from
3628 pH Dependence of Glucose Oxidase Reaction Vol. 244, No. 13
1.3
Lo-
-- ’ 0 0.7 %
3 -ii
e Y 0.4 0
$ -I
0.1
-a2
c
-
I
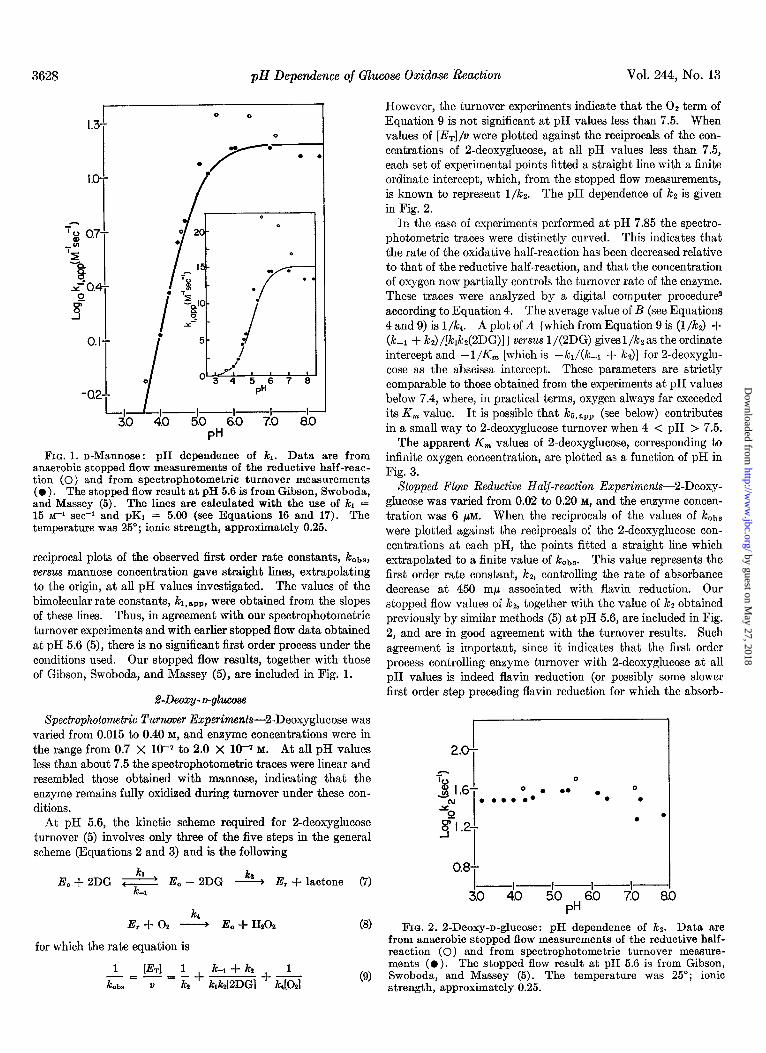
FIG. 1. n-Mannose: pH dependence of kl. Data are from anaerobic stopped flow measurements of the reductive half-reac- tion (0) and from spectrophotometric turnover measurements ( l ). The stopped flow resmt at pH 5.6 is from Gibson, Swoboda, and Massey (5). The lines are calculated with the use of /cl = 15 ~-1 set-1 and pK1 = 5.00 (see Equations 16 and 17). The temperature was 25”; ionic strength, approximately 0.25.
reciprocal plots of the observed first order rate constants, kobs, versus mannose concentration gave straight lines, extrapolating to the origin, at all pH values investigated. The values of the bimolecular rate constants, kr,,,,, were obtained from the slopes of these lines. Thus, in agreement with our spectrophotometric turnover experiments and with earlier stopped flow data obtained at pH 5.6 (5), there is no significant first order process under the conditions used. Our stopped flow results, together with those of Gibson, Swoboda, and Massey (5), are included in Fig. 1.
.%Deox y- D-ghme
Spectrophotometric Turnover Expm’ments-2-Deoxyglucose was varied from 0.015 to 0.40 M, and enzyme concentrations were in the range from 0.7 X 10-T to 2.0 X 10-v M. At all pH values less than about 7.5 the spectrophotometric traces were linear and resembled those obtained with mannose, indicating that the enzyme remains fully oxidiied during turnover under these con- ditions.
At pH 5.6, the kinetic scheme required for 2-deoxyglucose turnover (5) involves only three of the five steps in the general scheme (Equations 2 and 3) and is the following
E,+ 2DG & E, - 2DG -% E, + lactone (7) 1
t Er + Oe - E, + IIs02 (8)
for which the rate equation is
1 -=-= k obs
(9)
However, the turnover experiments indicate that the 01 term of Equation 9 is not significant at pH values less than 7.5. When values of [E-J/v were plotted against the reciprocals of the con- centrations of 2-deoxyglucose, at all pH values less than 7.5, each set of experimental points fitted a straight line with a finite ordinate intercept, which, from the stopped flow measurements, is known to represent I/&. The pH dependence of ks is given in Fig. 2.
In the case of experiments performed at pH 7.85 the spectro- photometric traces were distinctly curved. This indicates that the rate of the oxidative half-reaction has been decreased relative to that of the reductive half-reaction, and that the concentration of oxygen now partially controls the turnover rate of the enzyme. These traces were analyzed by a digital computer procedure2 according to Equation 4. The average value of B (see Equations 4 and 9) is l/lcr. A plot of A (which from Equation 9 is (l/&J + (kPl + kt) /[k&(2DG)] ) versus 1/(2DG) gives 1 /k~ as the ordinate intercept and -l/Km [which is -kr/(k-1 + kz)] for 2-deoxyglu- case as the abscissa intercept. These parameters are strictly comparable to those obtained from the experiments at pH values below 7.4, where, in practical terms, oxygen always far exceeded its Km value. It is possible that k~,~,,r (see below) contributes in a small way to 2-deoxyglucose turnover when 4 < pH > 7.5.
The apparent Km values of 2-deoxyglucose, corresponding to infinite oxygen concentration, are plotted as a function of pH in Fig. 3.
Stopped Flow Reductive Half-reaction Experiments-2-Deoxy- glucose was varied from 0.02 to 0.20 M, and the enzyme concen- tration was 6 PM. When the reciprocals of the values of kobs were plotted against the reciprocals of the 2-deoxyglucose con- centrations at each pH, the points fitted a straight line which extrapolated to a finite value of kobs. This value represents the first order rate constant, kz, controlling the rate of absorbance decrease at 450 rnp associated with flavin reduction. Our stopped flow values of kz, together with the value of kt obtained previously by similar methods (5) at pH 5.6, are included in Fig. 2, and are in good agreement with the turnover results. Such agreement is important, since it indicates that the first order process controlling enzyme turnover with 2-deoxyglucose at all pH values is indeed flavin reduction (or possibly some slower first order step preceding flavin reduction for which the absorb-
0.8+
0
. . . . 0
.
.
FIG. 2. %Deoxy-n-glucose: pH dependence of kz. Data are from anaerobic stopped flow measurements of the reductive half- reaction (0) and from spectrophotometric turnover measure- ments (0). The stopped flow result at pH 5.6 is from Gibson, Swoboda, and Massey (5). The temperature was 25”; ionic strength, approximately 0.25.
by guest on May 27, 2018
http://ww
w.jbc.org/
Dow
nloaded from

Issue of July 10, 1969 H. J. Bright and M. Appbby 3629
1.5-
Id-
I g07-
e I go*
3 I ' -0.F
I -05-
I -0%
FIG. 3. 2-Deoxy-n-glucose: pH dependence of K,. Data are from anaerobic stopped flow measurements of the reductive half- reaction (0) and from spectrophotometric turnover measure- ments (O ). The stopped flow result at pH 5.6 is from Gibson, Swoboda, and Massey (5). The lines were calculated with the use of K, = 0.0286 M and pK1 = 5.35 (see Equations 13 and 15). The temperature was 25’; ionic strength, approximately 0.25.
3.8L ./
d 16- . . .
5 6 7 8
1
FIG. 4. n-Glucose: pH dependence of /cl. Data are from anaero- bic stopped flow measurements of the reductive half-reaction (0) and from spectrophotometric turnover measurements (0). The stopped flow result at pH 5.6 and 27” is from Gibson, Swoboda, and Massey (5). The lines were calculated with the use of k~ = 12,600 M-I see-l and pK1 = 5.00 (see Equation 18). The tempera- ture was 25”; ionic strength, approximately 0.25.
ante change at 450 rnp acts as a spectrophotometric indicator) and not some other step which follows flavin reduction.
The plots of kobs versus the reciprocals of 2-deoxyglucose con- centration also yielded apparent Km values. These are included in Fig. 3, together with the apparent Km at pH 5.6 determined previously (5). Once again, the agreement between the results of turnover and those of stopped flow experiments is quite good.
D-Glucose
Spectrophotometric Turnover ExperimentsGlucose was varied from 0.03 to 0.8 M, and enzyme concentrations were in the range from 5.1 X 10Vg to 2.0 X 1O-s M. Curvature in the glucose traces becomes significant at pH values greater than 4.2. In the cases of 2-deoxy-n-glucose, for which the reductive half-reaction is much slower than that for n-glucose, analogous curvature in the spectrophotometric traces became evident only at much higher pH values (around 7.8). These facts by themselves, taken together with the pH dependence of the first and second steps in the reductive half-reaction, strongly suggest that 02 must com- bine with a protonated form of E,.
The curvature of traces from glucose turnover experiments can be increased (i.e. the combination of 02 with E, becomes in- creasingly rate-limiting) either by increasing the concentration of glucose at a given pH value or by increasing the pH at a given concentration of glucose. The rationale for analysis of such spectrophotometric traces is based entirely on the kinetic scheme for glucose deduced from a variety of stopped flow spectro- photometric experiments at pH 5.6 (5). At 25”, the kinetic scheme which is required again involves only three of the five steps in the general scheme (Equations 2 and 3), and is the following
b Eo + G - E, + la&one 00)
h ks Er + 02 - E,-Pz - Eo + HzOz 01)
for which the rate equation is
[ET] -= V (12)
The spectrophotometric traces from glucose turnover experi-
-l
30 40 5.0 PH
6.0 70 a0
FIG. 5. The pH dependence of kr. Data are from stopped flow measurements of the oxidative half-reaction (0), and from spectrophotometric turnover measurements with n-glucose (0) and 2-deoxy-n-glucose (X). The stopped flow result at pH 5.6 and 27” is from Gibson, Swoboda, and Massey (5). The stopped flow result at pH 8.5 fits the log-log plot quite well, although this is not shown. The lines are calculated with ka = 2.5 X IO6 Me1 see-1 and pKa = 6.90 (see Equation 19). The temperature was 25”; ionic strength, approximately 0.25.
by guest on May 27, 2018
http://ww
w.jbc.org/
Dow
nloaded from

3630 pH Dependence of Glucose Oxidase Reaction Vol. 244, No. 13
FIG. 6. The pH dependence of kb. Data are from spectrophoto- metric turnover measurements with n-glucose (0) and from the stopped flow turnover measurements (0) of Gibson, Swoboda, and Massey (5) at pH 5.6 and 27’, with n-glucose. The lines were calculated with kg = 1200 see-I, pKS = 4.10, and pK’s = 7.40 (see Equation 20). The temperature was 25”; ionic strength, 0.25.
merits at all pH values greater than 4.2 were analyzed by the digital computer method,2 yielding the optimal values of the parameters A [which from Equation 12 is (I/&) + [l/kl(G)]) and B (I/@ for each of four concentrations of n-glucose. A plot of A versus l/[G] gave a straight line, with ordinate value l/k5 and slope l/kl. Figs. 4 to 6 show the pH dependence of k ~,~rr, kd,app, and ks,,,,, respectively, determined from the glucose spectrophotometric turnover experiments. The results obtained previously (5) at pH 5.6 are also included in these figures. Below pH 4.2, k4,aBp could not be evaluated with glucose because of insufficient dependence of the turnover rate on 02 concentration. It was also found that the precise evaluation of JCg,api, at the highest pH values is quite difficult, owing to the extensive cur- vature of the spectrophotometric traces.
Stopped Flm Reductive Half-reaction Experiments-Glucose was varied from 0.002 to 0.02 M, and the enzyme concentration was 6 pM. As with mannose, the kinetics of reduction of glucose oxidase by glucose, within the time resolution of stopped flow experiments, gives no evidence for a rate-determining first order process involving flavin reduction. The values of lcl,aBp for glucose determined in stopped flow experiments are plotted as a function of pH in Fig. 4. The agreement with the results from spectrophotometric turnover experiments is satisfactory.
Stopped Flow Oxidafive Half-reaction Experiments-Because of the marked pH dependence of the individual steps in the reaction, we have reinvestigated the possibility that proton transfer might be rate-limiting in one or more of these steps by spectrophotomet- ric turnover experiments in 2Hz0 (0.9 mole fraction 2H) at 25’. The value of ki,,,,, measured with glucose at pH and pD 6.0, was found to be decreased about 30% in 2H20. At pH and pD 7.0, the value of Km,.pP [(k-l + k2) @J for 2-deoxyglucose was increased about 30% in 2H~0, while there was a negligible effect on k2 measured with this sugar.3 Since the pH and pD values
3 The small solvent deuterium isotope effect on kl, which was not detected previously (lo), was first observed by D. S. Page and R. L. VanEtten of Purdue University, who kindly allowed us to read their manuscript before publication.
used are close to the plateau region for ki,,,, (see Fig. 4), the solvent isotope effect observed here is probably due to a decrease in kl itself, and not to the increase in pK1 which is anticipated in 2Hs0 (9). Neither kd nor JGg, measured with glucose, was signifi- cantly affected by 2Hz0, as reported previously (10).
DISCUSSION
Step 1: Combination of sugar with Enzyme-2-Deoxyglucose is the only sugar of the three examined for which there is kinetic evidence for the existence of a conventional Michaelis complex of the form E,-S. However, it should be noted that this is a reflec- tion only of the relative rates of formation and decomposition of the complex, and not of any intrinsic difference in the chemical pathways of oxidation of the three sugars. Thus glucose-l-2H (Equation 8 of Reference 10) behaves kinetically like 2-deoxy- glucose (Equation 9 of this paper) as a result of a lo- to 15-fold kinetic isotopic effect on the rate of decomposition (kJ of E,-S.
From Equation 9, the limiting value of K, at high pH values (Fig. 3) is (k....l + k2)/k1. Since k2 is essentially insensitive to pH (Fig. 2), the pH dependence of Km,rtpp can be accounted for by a scheme involving the obligatory combination of the sugar with a basic form of the enzyme.
Kl k@DGl H+& = Eo +.----J
k-1 (13)
E, - 2DG --?- E, + lactone
The value of pK1, from Fig. 3, is 5.35. The pH dependence of the kinetics of oxidation of 2-deoxyglucose, both in the over-all reaction (except for pH values above 7.5) and in the reductive half-reaction, is therefore expressed by Equation 14
1 l&l -=-= k obs 21
from which the pH dependence of Km,app (Fig. 3) is seen to be
K k-1 + k, -___ m,alw - kl
(15)
The interpretation of the pH dependence of Km for 2-deoxy- glucose as the consequence of the combination of the sugar with a basic form of the enzyme (Equation 13) is entirely substantiated by all the kinetic results obtained with both mannose and glucose. For each of these sugars it has been established (5) that k2 >> kl[S],le-l. In the case of mannose, the rather bizarre, but not unique, finding (5) that the combination of sugar with enzyme is entirely rate-limiting in turnover at pH 5.6 (with the result that V,,, cannot be experimentally evaluated) has been found to be true for all pH values. The pH dependence of kl,app for mannose (Fig. 1) reveals a pKl value of 5.00, and is simply accom- modated, in analogy with the treatment of the 2-deoxyglucose results, by the following scheme, which describes both turnover and the reductive half-reaction (although, of course, in the latter case 02 is not present)
Kl kJM1 H+E, d -% -
(02) E, + lactone + Hz02 (16)
for which the rate equation is
[H+l 1 [&I z+l
-zz -=- k obs 2) k&W
(17)
by guest on May 27, 2018
http://ww
w.jbc.org/
Dow
nloaded from

Issue of July 10, 1969 H. J. Bright and M. Appleby 3631
The spectrophotometric turnover data for glucose, when inter- preted in terms of the special case of the general scheme repre- sented by Equations 10 and 11, yield values of kl,,,, for this sugar which show a pH dependence (Fig. 4) which is identical with that observed for 17~1,~~~ in the mannose reaction. Thus pK1 for glucose is 5.00, even though the value of k for glucose is lo* times larger than kl for mannose. The pH dependence of the combination of glucose with the enzyme is therefore entirely analogous to that required for the combination of mannose with the enzyme.
Kl MGI H+E, a E, B E,-PI
X&n I: Flavin Reduction-The rate of reduction of flavin, relative to the rates of other steps in the over-all reaction, is sufficiently small to be a rate-limiting step only in the cases of 2-deoxyglucose and glucose-L2H (5, 10). Within the accessible pH range, namely from 3.2 to 7.85, kz shows very little pH de- pendence, as shown in Fig. 2. It should be noted, from the results of the glucose experiments, that k~,~rr probably controls the turnover kinetics of 2-deoxyglucose to a small extent at the extreme values of pH. The precision of the data shown in Fig. 2 is not sufficient to show the decrease in the turnover number (at the highest and lowest values of pH) which would be antic- ipated if k~,~rr were to become important.
Step 3: Terminul First Or&r Process in Reductive Half-reaction -The terminal first order process governed by ks in the reductive half-reaction, which has a relatively large heat of activation (5), is kinetically important only in glucose turnover at temperatures below 15”. Although a terminal first order process in the re- ductive half-reaction involving no spectrophotometric change was necessary for the interpretation of stopped flow turnover experi- ments, it was not positively identified as a product release step, nor is it required to be such (5). Since all of the experiments described here were carried out at 25”, the pH dependence of kl has not been studied.
Step 4: Combination of O2 with Reduced Enzyme-In contrast to the combination of sugar with E,, the combination of 02 with E, is an acid-catalyzed process. The evidence for this conclusion is the pH profile of k4,&PD, shown in Fig. 5. The evaluation of kq from spectrophotometric turnover experiments with glucose is again based on the kinetic turnover scheme for this sugar represented by Equations 10, 11, and 12. It is in- teresting to note in Fig. 5 that the evaluation of Jcq,aPp from 2- deoxyglucose turnover experiments, which is possible only at pH 7.8 and above, is consistent with the idea that lo (and prob- ably k~) are identical for all sugar substrates, although these two steps are in general too rapid to exert any kinetic control in the turnover of sugars other than glucose.
The interaction of 02 with E, is most simply explained by the obligatory combination of 02 with an acidic form of E,, as follows.
K4 k4[Ozl Er I E,H+ A E, -Pz
The value of pK4 from the profile given in Fig. 5 is 6.90. Step 5: Terminal Step in Oxidafive Half-reaction-Fig. 6 shows
that k5. rPp, computed from glucose turnover experiments on the basis of Equation 8, has a bell shaped pH profile. Whether this is a consequence of two consecutive intramolecular conversions of the oxidized enzyme (one being base-catalyzed and the other acid-catalyzed) or concerted acid-base catalysis in a single ele- mentary step cannot be decided by the types of kinetic measure-
ments described here and previously. However, since there is no evidence for more than one first order process in the oxidative half-reaction we shall invoke concerted acid-base catalysis in a single step. When interpreted in this manner, the bell shaped pH profile for k~,&,,~ requires that the terminal first order step involve two ionizable residues, one of which must be in the con- jugate base form, the other in the conjugate acid form, before the enzyme can be converted to a form (EO) which interacts with the sugar substrate. This is represented most simply as follows.
EO 11 + Hz& (20)
+HE.
Although there are thermodynamic constraints governing the values of equilibrium constants in a loop, we have no evidence that the two acid dissociation constants labeled KS, for example, are numerically different. The values of pK5 and pK’s necessary to generate the profile of Fig. 6 are 4.10 and 7.40, respectively.
Complete pH Dependence of Over-all Reaction-Taken together, the kinetic results from all sugars tested by Gibson, Swoboda, and Massey (5) required the general scheme represented by Equations 2 and 3. Using the evidence that we have presented for each step in turn, we may now express the kinetic behavior of the general scheme in the pH range from 3 to 8 as follows.
Ha02 k.JOJ (21)
In this, and all other schemes presented here, we have made no attempt to depict the total number of proton transfer equi- libria that can be envisioned. Rather, we have shown only those states of ionization of the enzyme which directly determine the rate of the subsequent chemical process in the catalytic mech- anism.
The steady state rate equation which describes the pH de- pendence of the total scheme (Equation 21) is given by Equation 22.
[H+l LETI
K, + gl + 1 1 kz.4 + k&s + ksks --I V k&&s
(2% %+1
+ lH+l -- kJOa1
The values of the acid dissociation constants and rate con-
by guest on May 27, 2018
http://ww
w.jbc.org/
Dow
nloaded from

3632 pH Dependence of Glucose Oxidase Reaction Vol. 244, No. 13
TABLE I Kinetic and acid dissociation constants evaluated for Equation 21 (26’ and 0.2 M KCI) as described in text
Substrate
n-Glucose %Deoxy-n-glucose D-Mannose
kl
M-1 set-
12,600 1,400
15
k-1 4- kt kl
M
0.029
k%
set-
3,40@ 40
kh ks
M-1 se.0 set
2.5 x 10⁶ 1,200
PK~
5.00 5.35 5.00 4.0”
PKP
6.90
PIG
4.10
pK’6
7.40
a Rough estimate based on temperature dependence of k, for 2-deoxyglucose (5) and on estimate of kz for n-glucose at 3” (16). b Determined in the absence of KCl.
0.08-
0.06-
A 450
0.04-
FIG. 7. Andogue computer simulation (lines) of stopped flow turnover experiments (points) with 4.65 PM glucose oxidase, 1O-2 M n-glucose, and 2.5 X 10m4 M 02 (all concentrations after mixing). The temperature was 25”; ionic strength, approximately 0.25. The scheme which was simulated involved the steps /cl, kq, and kg of Equation 21. The values used for kl, kd, kg, pK1, pK4, pKs, and PK’~ are given in Table I.
stants determined for glucose, 2deoxyglucose, and mannose are summarized in Table I.
We have tested the adequacy of the over-all scheme (Equations 21 and 22) by analogue computer regeneration of stopped flow turnover experiments with glucose at 25” and selected pH values. In these experiments, which are shown in Fig. 7, the oxidized fraction of the enzyme (& + &,-Pz) is measured as a function of time at 450 mp. The turnover patterns reflect primarily the dominance of Ic i,aPP[G] at low pH values and the dominance of k 4,&pP[O~] at high pH values. The step controlled by JCg,app is of some importance only at high pH values with the particular substrate concentrations used. The rapid reduction of the fully oxidized enzyme in the presteady state portion of the reaction seen at pH 5.0 and 7.8 corresponds to kl,.,,[G]. Except for the results at pH 7.8, the correspondence between the com- puted and experimental traces is excellent. The discrepancy at pH 7.8 may be due to a trace of uninhibited catalase.
In comparing our results with the bell shaped initial velocity- pH profile obtained by Keilin and Hartree (3) at 39” with 0.056 M glucose and approximately 1.8 X 1P4 M 02, we noted that we could qualitatively regenerate the basic limb but that the com- puted acidic limb was displaced approximately 1 pH unit in the basic direction. This discrepancy is too great to be caused by the heats of ionization of the two residues (corresponding to
pK1 and pK5) which have to be in the conjugate base form for catalysis to occur. We therefore re-evaluated K1 and k1 under experimental conditions similar to those used by Keilin and Hartree, namely, 0.2 M acetate and phosphate-citrate buffers with no KCl. Under these conditions the value of pK1 in the case of mannose was 4.0 (compared to 5.0 in the presence of 0.2 M KCI), whereas the value of /cl was unchanged. The pres- ence of 0.2 M KC1 therefore shifts the acidic limb of the initial velocity-pH profile approximately 1 pH unit upwards. KCI, NaCl, and KBr, at a concentration of 0.2 M, were found to inhibit mannose turnover to the same extent at pH 4.15. These results indicate that it is the anion, rather than the cation, which interacts with the enzyme and stabilizes the conjugate acid species, +HE,. Chloride ion effects have also been noted with L-amino acid oxidase (11).
The effects of added salt on the first two steps of the reductive half-reaction were investigated more fully. With 2-deoxy- glucose at pH 3.65 (0.02 M citrate), the values of kz and K,,.,, were unaffected by the addition of 0.167 M KzS04. This indi- cates, barring fortuitous compensatory effects on rate and equilibrium constants, that K,, ki, k+ and kl are not sensitive to ionic strength. The insensitivity of ki to ionic strength (and to Cl-) was confirmed with mannose at pH 7.3 with the use of 0.1 M imidazole hydrochloride. However, Cl- was shown to markedly decrease kz and K, to approximately the same extent in the case of 2-deoxyglucose at pH 7.3. This result suggests that K, = k&i, in which case we can estimate that the value of kl for 2-deoxyglucose is 1400 M-l see-l. This is approximately one-tenth of the rate at which glucose combines with E,. In summary, therefore, halides have a specific acid-weakening effect on the enzyme, causing pKi to increase markedly, and also specifically inhibit the rate of flavin reduction, controlled by ks, whereas K1, kl, k-1, and kz are almost completely insensitive to ionic strength.
Our results clearly show that the shape and position of the velocity-pH profile will be determined by the relative contri- butions of three pH-dependent processes. Furthermore, since two of these processes (ki and &) are bimolecular steps, the shape and position of the profile will in general be very dependent on the substrate concentrations as well as the values of pK1, pK4, pKs, and pK’6 and the relative values of ki, kz, kd, and ks. This is illustrated for each sugar in Fig. 8 for the range of pH used here. The pH corresponding to the maximum value of v/LET] (if this exists) may be readily computed by differentiation of Equation 22. Thus, for n-glucose, at 25”, we have the fol- lowing.
by guest on May 27, 2018
http://ww
w.jbc.org/
Dow
nloaded from

Issue of July 10, 1969
0.15
0.10
gl (see')
0.05
C
H. J. Bright and M. Appleby 3633
PH PH FIG. 8. The pH dependence of the initial turnover velocity predicted for various concentrations of sugar and 02. A, n-Mannose;
B, 2-deoxy-n-glucose; c, n-glucose.
(23)
The identification of the four ionizable groups involved in the catalytic mechanism on the basis of their pK, values is equivocal because of the possibility of perturbation by the protein environ- ment. The following assignments are therefore tentative. The pK1 of around 4, which is increased to 5 in the presence of chlo- ride, most probably represents the ionization of a carboxyl group. The value of p&, namely 6.90, is in the range most frequently spanned by the ionization of the imidazolium group of histidine in proteins, although an unusually acidic sulfhydryl or ammonium group might be responsible. However, as we shall discuss later, pKq may represent the ionization of reduced flavin. The value of 4.10 for pK, is again most likely to be due to the car- boxylate group, whereas pK’6, with a value of 7.40, may be due to imidazolium, with sulfhydryl and ammonium remaining as possibilities. In all cases, these ionizable groups may either function directly as general acid-base catalysts in the mechanism, or they may be involved in some structural transition in the protein which is essential for catalytic activity.
The combination of the sugar with the enzyme, which is charac- terized by pK1 and does not involve an oxidation, may involve an ionization of the hydroxyl group of carbon atom 1 of the sub- strate which is assisted by a carboxylate group at the active site. The solvent deuterium effect on kl would be consistent with this idea. Examples of base-catalyzed proton abstraction preceding oxidation are known (12), and it is of interest that the nonen- zymatic reduction of flavins by diiydrolipoic acid is both specific and general base catalyzed (13).
The evidence bearing on the mechanism of flavin reduction is that kg is independent of pH in the range from 3 to 8 and the
process involves the breaking of the bond between hydrogen and carbon l(l0). Hydrogen atom transfer from carbon atom 1 seems unlikely because of the consistent failure to obtain any evidence for semiquinoid intermediates and because the stabilization of a glucose radical would be difficult. Arguments were advanced to support the idea that hydrogen atom 1 is removed as a proton following a glycoside Ii&age with the flavin and concurrent with electron transfer into the flavin (10). These arguments were in the form of analogies, drawn from a mechanism for bromine oxidation of glucose (14) and from a scheme proposed for D- amino acid oxidase which was based on the isolation of an en- zyme-substrate derivative after borohydride treatment and hydrolysis (15). Subsequently, this derivative was shown to be that expected if a Schiff base were formed between the cr-keto (or oc-imino) acid product and the e-amino group of a lysine resi- due in the enzyme (16). The mechanistic significance of such a structure is not at all clear, especially since borohydride treat- ment was later shown to have no effect upon the catalytic ac- tivity of the enzyme (17). In any case, the fact that flavin reduction per se is not general base-catalyzed (at least within the limits of our measurements) makes the idea of proton abstrac- tion from carbon 1 of the substrate in the glucose oxidase reaction less attractive. The alternative mechanism, namely, hydride transfer to flavin from carbon 1 of the sugar anion formed in the first step of the reaction, has the advantageous feature of expul- sion of a negative species from a negative, rather than a neutral, substrate. Furthermore, calculations quoted in Reference 18 favor hydride transfer in the oxidation of methoxide and other species. The pH insensitivity of kz may indicate that the developing negative charge on the flavin, resulting from hydride transfer from substrate, is neutrahzed by proton transfer from HzO.
The function of the acid group with an apparent pK, of 6.85 which is essential for the reduction of oxygen in the step con-
by guest on May 27, 2018
http://ww
w.jbc.org/
Dow
nloaded from

3634 pH Dependence of Glucose Oxidase Reaction Vol. 244, No. 13
trolled by kd is particularly interesting since this represents one of the few cases where the crucial biological function of 02, namely its reduction (albeit at the Z-electron level), can be studied in a stepwise fashion. Two experimental facts are worth emphasizing. First, this step, although far from being diffusion-controlled, is very insensitive to temperature (5). This suggests that electron transfer, rather than the breaking of a covalent bond, may be involved; in addition, since the major kinetic barrier in the interaction of E, with 02 must be entropic, a significant structural rearrangement is implicated. The flattening of the flavin molecule which occurs upon oxidation (together with protein conformation changes which might be induced by this process) may account for these results. Second, comparison of the rate of this bimolecular process with the cor- responding rate of the nonenzymatic oxidation of FMNHg (19) suggests that no enzymatic catalysis may be involved. Further- more, since the observed pK4 of 6.85 corresponds rather closely with the pK, measured for free FMNHz (20), it would be of great interest to know whether the pH dependence of the oxida- tion of free FADHz resembles the pH dependence we have ob- tained with reduced glucose oxldase. Until this question is resolved, it is not possible to conclude whether the enzyme provides a general acid-catalyzed pathway for the combination of bound FADHz with 02, or whether such a pathway is rather an intrinsic property of FADHz oxidation.
The interpretation of the bell shaped pH dependence of k6,app is likewise difficult because the nature of this process is unknown, except for the fact that it involves the interconversion of two oxidized forms of the enzyme (5). Thus the process might consist of the final step (or steps) in the synthesis of free Hz02 (including its release from the enzyme) or a structural isomeri- zation of the enzyme. An answer to this question has to await the measurement of the rate of formation of free Hz02 in the oxidative half-reaction. It is of interest to note that the nonen- zymatic oxidation of reduced flavin by 02 involves in part a saturation phenomenon (19,21) indicative of complex formation between O2 and reduced flavin, with a subsequent first order decay of this complex which involves a solvent deuterium effect (21).
It was pointed out previously (10) that a possible reason for the fact that E,-02 (the analogue of FMNHQ-02 in the non- enzymatic reaction) is not a kinetically significant species in the glucose oxidase oxidative half-reaction is that the rate of con- version of E,-02 to E,-Ps may be much greater than the largest value of k4[02] which is attainable experimentally. I f this is the case, the catalytic efficiency of the enzymatic pathway can be judged from the fact that, whereas the rate of the nonen- zymatic conversion of FMNHt-02 to FMN and Hz02 is 24 set+
(19), the rate-limiting first order process in the enzymatic oxida- tive half-reaction (controlled by ks, and involving the intercon- version of two ozidixed forms of the enzyme) proceeds at. a rate of about 1150 see+ under similar conditions. Thus, if the en- zymatic pathway involves the step E,-02 --f E,-P2, the rate of this process must be at least 100 times greater than the non- enzymatic decay of FMNHZ-02.
It is clear that further studies of the pH and temperature dependence of the nonenzymatic oxidation of reduced flavin by 02, as well as the determination of whether HzOz is released enzymatically in the step controlled by kd or in that controlled by kg, would help to clarify the extent and mechanism by which the oxidation of E-FADH2 by 02 is aided by the protein.
Acknowledgmenfs-We are indebted to Dr. Richard 0. Viale for many helpful discussions. We also thank Dr. Joseph J. Higgins for the use of the analogue computer of the .Johnson Foundation, University of Pennsylvania.
REFERENCES
1. BRIGHT, H. J., Fed. Proc., 27, 782 (1968). 2. SWOBODA, B. E. P., AND MASSEY, V., J. Biol. Chem., 240, 2269
(1965). 3. KEILIN, D., AND HARTREE, E. F., Biochem. J., 42, 221 (1948). 4. WELLNER, D., Annu. Rev. Biochem., 36, 669 (1967). 5. GIBSON, Q. H., SWOBODA, B. E. P., AND MASSEY, V., J. Biol.
Chem., 239, 3927 (1964). 6. NAKAMURA, S., AND OGURA, Y., J. Biochem. (Tokyo), 63, 308
(1968). 7. KEILIN, D., AND HARTREE, E. F., Biochem. J., 60, 331 (1952). 8. CHANCE, B.. Methods Biochem. Anal.. 1. 412 (1954). 9. BELL, R: P.; The proton in chemistry, ho&e11 University Press,
Ithaca, New York, 1959, p. 188. 10. BRIGHT, H. J., AND GIBSON, Q. H., J. Biol. Chem., 242, 994
(1967). 11. DUKE, F. R., AND WEISKOPF, E. A., Ann. N. Y. Acad. Sci.,
136, 123 (1966). 12. INGRAHAM, L. L., Biochemical mechanisms, John Wiley and
Sons, Inc., New York, 1962, p. 56. 13. GASCOIGNE, I. M., AND RADDA, G. K., Biochim. Biophys. Acta,
131, 498 (1967). 14. BARKER, I. R. L., OVEREND, W. G., AND REES, C. W., Chem.
Ind. (London), 1297, 1298 (1960). 15. COFFEY, D. S., NEIMS, A. H., AND KELLERMAN, L., J. Biol.
Chem., 240, 4058 (1965). 16. KELLERMAN, L., AND COFFEY, D. S., J. Biol. Chem., 242,
582 (1967). 17. MASSEY, V., CURTI, B., MULLER, F., AND MAYHEW, S. G., J.
Biol. Chem., 243, 1329 (1968). 18. JONES, P., AND SUGGETT, A., Biochem. J., 110, 621 (1968). 19. GIBSON, Q. H., AND HASTINGS, J. W., Biochem. J., 83, 368
(1962). 20. DRAPER, R. D., AND INGRAHAM, L. L., Arch. Biochem. Bio-
phys., 126, 802 (1968). 21. GUTFREUND, H., Biochem. J., 74, 17P (1960).
by guest on May 27, 2018
http://ww
w.jbc.org/
Dow
nloaded from

Harold J. Bright and Maryanne ApplebyThe pH Dependence of the Individual Steps in the Glucose Oxidase Reaction
1969, 244:3625-3634.J. Biol. Chem.
http://www.jbc.org/content/244/13/3625Access the most updated version of this article at
Alerts:
When a correction for this article is posted•
When this article is cited•
to choose from all of JBC's e-mail alertsClick here
http://www.jbc.org/content/244/13/3625.full.html#ref-list-1
This article cites 0 references, 0 of which can be accessed free at
by guest on May 27, 2018
http://ww
w.jbc.org/
Dow
nloaded from