Embed Size (px)
Citation preview

Chapter 6
The performanceassessment process
Businessstrategy
• Business vision• Industry and competitive characteristics
Customerstrategy
• Customer choice and customer characteristics• Segment granularity
Information management process
Back-officeapplications
Front-officeapplications
Analysistools
ITsystems
Data repository
Inte
grat
ed c
hann
el m
anag
emen
tSales force
Outlets
Telephony
Electroniccommerce
Direct marketing
Mobilecommerce
Virt
ual
Phy
sica
l
Shareholderresults• Employee value• Customer value• Shareholder value• Cost reduction
Performancemonitoring• Standards• Satisfaction measurement• Results and KPIs
Value customerreceives• Value proposition• Value assessment
Value organizationreceives• Acquisition economics• Retention economics C
usto
mer
seg
men
t life
time
valu
e an
alys
is
Strategy development process:
Multi-channel integration process:
Performance assessmentprocess:
Value creationprocess:
The strategic framework for CRM
The performance assessment process is the final process in the StrategicFramework for CRM. The purpose of this process is to ensure thatthe organization’s strategic aims in terms of CRM are being deliv-ered to an appropriate and acceptable standard and that a basisfor future improvement is firmly established. As shown in the abovefigure the process has a dual focus on shareholder results, which pro-vides a ‘macro-view’ of the key drivers of CRM performance, and onperformance monitoring, which involves a more detailed ‘micro-view’
HCRM-Ch06.qxd 9/16/05 10:57 Page 283

of the key descriptors of CRM performance. This process involvesfocusing on two key issues:
1. How can we create increased profits and shareholder value?2. How should we set standards, develop metrics, measure our results and
improve our performance?
Together these issues provide an understanding of how CRM deliv-ers shareholder results and how CRM performance can be measuredand thus further enhanced.
As emphasized throughout this book, CRM breaks with traditionalmanagement practice in that it involves the whole organization andemphasizes avoiding functional divides. In so doing CRM embracesa new logic for commercial relevance: business success ultimatelyderives from the creation of customer value, which is achievedthrough the skilful management and development of customer rela-tionships involving all key stakeholders. Market leaders will be thosewho can demonstrate an unfailing ability continually and consis-tently to deliver products and services that fulfil customers’ needsand expectations and can do so in a manner that highlights organiza-tional competencies and cost-effectiveness. This is a tall order anddemands the coordinated effort of all company members and part-ners throughout the supply chain.
Likewise, the evaluation and enhancement of performance needsall the required information to be supplied in a timely and accessiblemanner by the information management process. This requires theadoption of a more inclusive and comprehensive perspective. Webelieve that concerns about the effectiveness of CRM solutions are akey factor driving companies to consider CRM in this broader con-text of business strategy and to monitor CRM performance morecarefully against specially selected criteria.
The need for a systematic approach
Historically, firms have tended to organize themselves in terms of func-tional responsibility and thus performance measures have reflected theindividual objectives of departments or strategic business units. Forexample, Finance has been driven by profit, Sales by volume andMarketing by customer acquisition. The movement towards greater
284 Handbook of CRM: Achieving Excellence in Customer Management
HCRM-Ch06.qxd 9/16/05 10:57 Page 284

convergence and consolidation in many industries has blurred thedistinctions among the aims of traditional allocations of organizationalresponsibility. More collaborative work practices have necessitatedmore consultative measurement and monitoring systems. In short, aredefinition of the business model requires a recalibration of businessperformance. Because CRM is a cross-functional activity, CRM per-formance measurement must use a range of metrics that span thegamut of processes and channels used to deliver CRM.
As yet, there is no universally recognized system for measuringthe success of CRM. This is partly due to the fact that every CRMprogramme is unique and cannot be judged identically and partlybecause formalized CRM is a relatively new discipline. Althoughcustomer relationship management is often considered the remit ofmarketing as it builds on the tenets of relationship marketing, inpractice it forms part of the job of every employee in every depart-ment. This sharing of customer responsibility compounds the diffi-culty of agreeing specific measures that will accurately reflect CRMperformance and strategic progress.
Early attempts to measure marketing performance were largelydirected at monitoring financial outputs. These included profit, salesand cash flow. In the 1980s, there was a realization that non-financialmeasures also played a part in delivering the overall performance ofmarketing. Organizations began to recognize that variables such asbrand equity, customer satisfaction and customer loyalty were veryimportant in transforming marketing inputs to organizational out-puts. During the 1990s, the emphasis switched to the use of multiplemeasures that would together provide a more complete picture ofmarketing performance. However, this method raises difficult issuesfor managers, including which measures should be included in per-formance monitoring models and how to account for the interrela-tionships between measures.
Clearly what is needed for the 2000s is a more definitive frame-work that identifies the principal measures of CRM performanceand how these measures organize into a system that can be used con-tinually to monitor, track and improve performance in support of theCRM vision. The performance assessment process, highlighted inthe figure above, provides a structure for developing such a systembased on the following key actions:
1. Understand the key drivers of shareholder results and the significance ofthe linkages between them
The performance assessment process 285
HCRM-Ch06.qxd 9/16/05 10:57 Page 285
2. Identify the appropriate standards, metrics and KPIs against which thevarious CRM activities can be measured
3. Establish an effective CRM performance monitoring system to apply thesemeasures on an ongoing basis.
Each of these key actions is now examined in turn.
Understanding the key drivers ofshareholder results
To achieve the ultimate objective of CRM – the delivery of excellentshareholder results through an increase in shareholder value – anorganization must maximize the main sources of revenue, profit andgrowth within the context of both business and customer strategy.The four main elements are:
● building employee value● building customer value● building shareholder value● reducing costs.
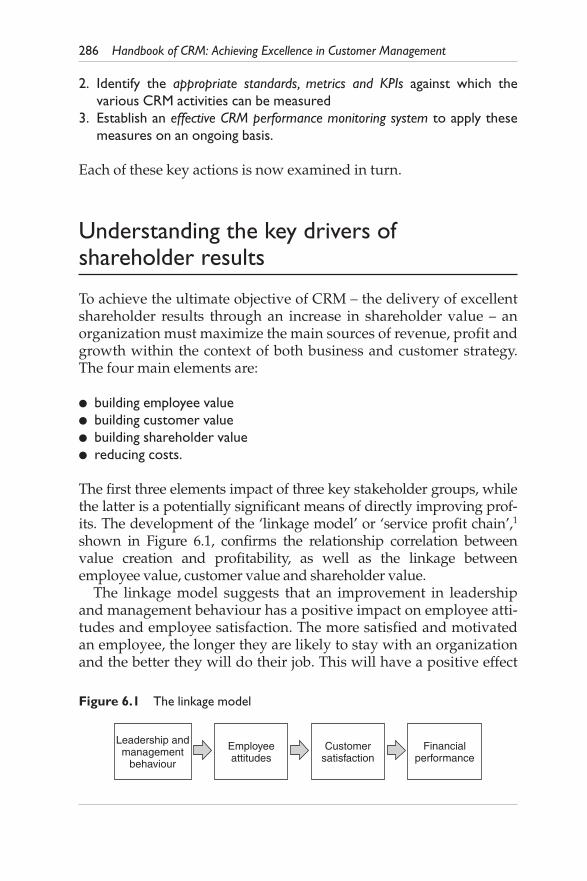
The first three elements impact of three key stakeholder groups, whilethe latter is a potentially significant means of directly improving prof-its. The development of the ‘linkage model’ or ‘service profit chain’,1
shown in Figure 6.1, confirms the relationship correlation betweenvalue creation and profitability, as well as the linkage betweenemployee value, customer value and shareholder value.
The linkage model suggests that an improvement in leadershipand management behaviour has a positive impact on employee atti-tudes and employee satisfaction. The more satisfied and motivatedan employee, the longer they are likely to stay with an organizationand the better they will do their job. This will have a positive effect
286 Handbook of CRM: Achieving Excellence in Customer Management
Leadership andmanagement
behaviour
Employeeattitudes
Customersatisfaction
Financialperformance
Figure 6.1 The linkage model
HCRM-Ch06.qxd 9/16/05 10:57 Page 286

on customer satisfaction, so customers will stay longer and generatehigher sales for the company. The result is stronger profitability andincreased shareholder value. This model provides a key logic to thebroader perspective of CRM. We will return to the model later in thischapter.
Shareholder value, customer value, employee value and cost reduction
Many organizations now recognize the importance of improvingtheir performance by managing the value input and impact of eachmajor stakeholder group. It is obvious that certain stakeholdergroups are more important than others. While this importancewill vary to some extent from organization to organization, threestakeholder groups, shareholders, customers and employees haveemerged as the core focus for most organizations in terms of valuemanagement and performance improvement. Frederick Reichheldof consulting firm, Bain & Company, points out that these three keystakeholders – the ‘forces of loyalty’ – are pivotal in achieving com-mercial success.2 These key drivers of shareholder results are shownin Figure 6.2. This figure emphasizes the need to consider each ofthese stakeholders from the perspective of the value of the stake-holder group to the organization and the value of the organization tothat stakeholder group.
It is useful to make a subtle distinction between building share-holder value and achieving shareholder results. In this context, share-holder value creation may be viewed in a more narrow sense as beingconcerned with identifiable value in terms of returns on capital thatstem from initiatives such as improved customer satisfaction andincreasing customer retention, excluding stock market measures.Shareholder results include how shareholders and the stock marketrespond to these improvements in shareholder value: that is, theyreflect the stock market perspective. Research shows that sharehold-ers take a range of non-financial measures into account whenvaluing companies. For example, the ‘Measures that Matter’ study3
suggests that on average 35 per cent of an investment decision isdriven by non-financial data. Hence, issues such as communicating acoherent and well-planned CRM strategy may have a significantpart to play in achieving improved shareholder results.
The performance assessment process 287
HCRM-Ch06.qxd 9/16/05 10:57 Page 287

Cost reduction is an obvious source of potential increase in profitsand shareholder results. Improving efficiency and the use of lowercost channels are common means of achieving cost reduction.However, as we will discuss shortly it is important that this is notdone at the expense of lowered levels of customer satisfaction andcustomer value.
Employee valueIn addressing CRM performance it is tempting to focus immediatelyon standards for CRM, metrics and key performance indicators(KPIs). However, the need first to focus on the drivers of shareholderresults should be emphasized.
John McKean in his book Information Masters4 made a criticalobservation that typically 92 per cent of the historical investment inCRM expenditure goes into data and technology, but these aspectsonly represent 25 per cent of the competency determinants for suc-cess. Organizations need also to make sure the other most criticalelements that represent 75 per cent of the competency determinantsfor success, such as people, processes, organization, culture and
288 Handbook of CRM: Achieving Excellence in Customer Management
Shareholder value
Employees
Valueemployees
deliverto
organization
Valueorganization
deliversto
employees
Costreduction
Organization
Customers
Valuecustomers
deliverto
organization
Valueorganization
deliversto
customers
Organization
Shareholders
Valueshareholders
deliverto
organization
Valueorganization
deliversto
shareholders
Organization
Employee value Customer value
Figure 6.2 Key drivers of shareholder results
HCRM-Ch06.qxd 9/16/05 10:57 Page 288

leadership actively support CRM activities in a relevant manner.McKean’s research indicates that a total of 60 per cent of the compe-tency determinants for success involve people, organization, cultureand leadership. Thus the people element is absolutely critical inmaking CRM work. These issues are discussed in more detail in thenext chapter.
Employee value needs to be considered from two perspectives –the value employees deliver to the organization and the value theorganization delivers to employees. Further, a motivated employeecan add value to the customer.
The value employees deliver to the organization is usually meas-ured against a number of performance objectives. Often these repre-sent short-term goals, where employee performance is appraisedagainst performance targets. Employee value of this form is closelylinked to employee retention, for long-tenured employees are morelikely to know their jobs and the goals of the organization and arethus able to be more productive.
The value the organization delivers to its employees comprises thebenefits the work force receives in exchange for the opportunity cost,time and labour expended in performing their jobs. This bundle ofbenefits includes the internal service quality created by managementpractices, encompassing reward and appraisal policies, training anddevelopment opportunities and the motivation and empowermentof employees.
Linking employee remuneration to specific customer objectives,such as customer satisfaction and customer retention, supports thecreation of value for both the employees and the organization.
How the company’s leadership, human resources and culture areorganized are therefore key factors in determining employee valuewhich, in turn, has a significant bearing on customer and shareholdervalue. This is evident in the types of measures used to monitor thevalue delivered by employees, for example, product quality measures,employee turnover, recruitment costs and employee satisfaction.
Customer valueCustomer value is concerned with both the value the organizationreceives from the customer and the value the customer receives from theorganization. As the topic of customer value has been already dis-cussed in Chapter 3, only a brief recap is given here.
The value the organization receives from the customer is deter-mined by the profits obtained from the customer over the lifetime of
The performance assessment process 289
HCRM-Ch06.qxd 9/16/05 10:57 Page 289

their relationship with the organization, or their ‘customer lifetimevalue’ and the economics of customer acquisition and retention.
The value the customer receives from the organization is definedby the perceived benefits of the offer made to the customer, whichextend beyond the core product or service. These higher-level ben-efits, or ‘added values’, emanate not from basic product features butfrom intangible factors, such as the provision of better customerservice or association with a quality brand image. A number ofmeasures are used to monitor this aspect of customer value includ-ing customer retention, customer acquisition costs, customer satis-faction and customer profitability.
The key issues relating to customer value, discussed in Chapter 3,include:
The nature of ‘the offer’ a company makes to its customer –Customer value is an inherent part of the product or service offerwhich the company can actively manage to benefit the customer.Customers do not buy goods or services, but rather a bundle of ben-efits in the form of product features and added value. This totaloffering – or ‘the offer’, as it is commonly called – represents thevalue that customers get when they buy goods or services.
The use of relationships and branding to increase customer value –Building better relationships with customers through offeringsuperior customer service is one way of securing competitive advan-tage. The use of customer service as a more important competitiveweapon derives from increasingly sophisticated customer require-ments and the demand for ever-higher standards of service.Developing greater customer involvement with the company’sproducts is a good way to use the brand to enhance customer value.The Harley-Davidson Owners Group, discussed in Chapter 3, pro-vides a good illustration of this.
The value proposition – The value proposition comprises three keysteps: choose the value, provide the value and communicate thevalue. Success rests on the thoroughness and innovation that goesinto developing the value proposition and communicating itthroughout the supplying organization.
The value of customers to the company – To calculate a customer’s realworth, the company must look at the expected profit flow from thecustomer over the customer’s lifetime, rather than the results thisyear: the longer the customer relationship, the greater the profit percustomer.
290 Handbook of CRM: Achieving Excellence in Customer Management
HCRM-Ch06.qxd 9/16/05 10:57 Page 290

Shareholder valueThe growing power and influence of financial analysts has drivenmany company boards to regard the creation of shareholder value astheir primary business objective. However, the emphasis is fre-quently placed on quarterly results rather than the longer term.Balancing long-term and short-term returns and communicating thisbalance to shareholders, is therefore becoming a priority.
Shareholder value is created by achieving a favourable rate ofreturn on capital invested. This can be accomplished in a number ofways. Ian Cornelius and Matt Davies5 have summarized the fiveprincipal strategies that can lead to the creation of shareholder value.These are:
1. increasing the return generated on existing capital invested2. investing more capital where the rate of return exceeds that required3. divesting assets which generate a return lower than that required, thus
releasing capital for more productive use4. extending the period over which returns above the required rate are
generated5. reducing the cost of capital.
These strategies require a ‘value based management’ approach thatemphasizes creating and maximizing the wealth of shareholdersin every aspect of the business. Such an approach involves measur-ing and managing the following key financial variables, or ‘valuedrivers’:
● the opening amount of capital invested● the rate of return generated on capital● the rate of return that investors require● the growth in the value of capital invested● the time horizon over which returns are expected to exceed those
required by shareholders.
Most of what has been written on shareholder value focuses on thevalue the organization delivers to shareholders. Over the last decadethere has been particular emphasis on tools that measure share-holder value creation and shareholder results, including economicvalue added (EVA), shareholder value added (SVA), market valueadded (MVA) and cash flow return on investment (CFROI). A sum-mary of key measures of shareholder value is shown in Figure 6.3.
The performance assessment process 291
HCRM-Ch06.qxd 9/16/05 10:57 Page 291

Although there is an ongoing debate as to which technique mostaccurately measures shareholder value, what is important is toconsider shareholder value in the context of the whole business and,in particular, in relation to customer value. The specific measure-ment of shareholder value is complex and beyond the scope of thisbook. (The interested reader should consult the detailed report byCornelius and Davies.6)
Although the issue of the value the shareholders deliver to the organiza-tion is emphasized much less, the loyalty of shareholders and otherinvestors is an issue of considerable importance. Frederick Reichheldpoints out that shareholder churn in the average public company inthe USA is more than 50 per cent per annum and argues that managersfind it very difficult to pursue long-term value-creation strategieswithout the support of loyal and knowledgeable shareholders. Henotes that many of the world’s leading companies (in terms of highcustomer loyalty and high customer retention) are either privatelyowned, ‘mutual’ or public companies, where there is a high share-holder loyalty and thus a high value delivered by shareholders to theorganization.
Delivering value to shareholders is an increasing concern of CEOs.However, an obsession with maximizing shareholder value hassometimes led to the neglect of other stakeholder groups, causinghigh employee turnover, poor quality products and services andultimately reduced shareholder value. It is therefore crucial thatshareholder value be viewed as a balance between immediate finan-cial return and longer-term sustainability. This will be discussed inthe following chapter.
292 Handbook of CRM: Achieving Excellence in Customer Management
Figure 6.3 Shareholder value measures
Company Shareholder value product
LEK/Alcar Consulting Group Shareholder value added (SVA)Stern Stewart & Co Market value added (MVA)
Economic value added (EVATM)McKinsey & Co Various methodsMarakon Associates Various methodsBraxton Associates Cash flow return on investment (CFROI)The Boston Consulting Group Cash flow return on investment (CFROI)
Cash value added (CVA)Holt Value Associates Cash flow return on investment (CFROI)
Source: Based on ‘Metric Wars’7
HCRM-Ch06.qxd 9/16/05 10:57 Page 292

Cost reductionCost reduction can represent a good source of increase in profits andshareholder results.
Opportunities for cost reduction lie in:
1. exploiting economies of scale2. benchmarking best practice within and outside the industry3. outsourcing non-core activities4. leveraging shared activities across the organization5. improving CRM efficiency and effectiveness.
Better information management can be a primary source of costreduction in CRM. For example, one large US investment bankfound they could redeploy 45 per cent of their staff in marketing,sales and service because the time required to undertake these activ-ities was significantly reduced through gaining a higher level ofinformation competency.8
Deploying electronic systems, such as automated telephony ser-vices, which lower costs by enabling reductions in staff and over-heads, is an attractive potential source of cost reduction. However,an over concentration on cost reduction as a means of deliveringshareholder results can be counterproductive if it decreases customervalue. For example, the creation of a central call centre in a bank willhelp reduce costs but may disenfranchise customers who prefer tointeract with bank employees whom they know. Dealing with bankrepresentatives who are unfamiliar with their individual circum-stances and banking habits can be regarded as an affront to theirlong-standing status as loyal customers. A large UK bank recentlyhad to reverse its new policy of customers only being able to speak toa central call centre, rather than directly to their branch, as a result ofmany complaints from angry customers. Thus, any cost reductionstrategy needs to be considered in the context of its effect on cus-tomer value.
The utilization of new electronic channels, such as online self-servicefacilities on the Internet, which lower the costs of customer acquisi-tion, transaction and servicing offers a further opportunity for costreduction. With its innovative web site Dell places much of thebuying process in its customers’ hands. Using the benefits of webself-service, discussed in Chapter 5, customers can configure ownproduct and place their own orders. This dramatically speeds up thebuying process, improves accuracy, decreases costs of correction and
The performance assessment process 293
HCRM-Ch06.qxd 9/16/05 10:57 Page 293

problem resolution and is considerably less labour intensive for Dell.Further, storage and distribution costs are cut because of moretimely and efficient stock management and delivery.
Achieving a productive balance between cost reduction and cus-tomer satisfaction means understanding the value that may be cre-ated or sacrificed in the management of the customer relationship.This value factor constitutes a central element of CRM, for it is whatdrives success in the organization. A well-managed value processwill lead to a better quality of workforce, in terms of the organiza-tion’s ability to attract and retain highly motivated, committed andappropriately skilled employees. Such a dedicated workforce is morelikely to deliver a better customer experience, which in turn willdeliver better shareholder value through increased sales, repeatorders and customer referrals.
The importance of an appropriate value exchange is clear: concen-trating on how much value (in the form of profits) an organizationcan extract from its customers, without understanding what cus-tomers value from the organization in order to provide it satisfacto-rily, is not a sustainable strategy in today’s competitive environment.Nor is a strategy of profit improvement through cost reductionwhere cost savings are made at the expense of customer value. Thus,an integrated approach is needed to optimize the contribution ofeach stakeholder group and the opportunities for cost reduction, aswell as to exploit the linkages between them.
Linking shareholder value, employee value,customer value and cost reduction
In addition to the profit-enhancing potential of each group’s value con-tribution, there is potential contained in the linkages between them.There is also an obvious connection between cost reduction and thethree key stakeholders discussed above. As Figure 6.3 suggests, costsavings can be used to increase employee value (e.g. through investingin staff training or job incentives), increase customer value (e.g.through augmenting the value proposition) or increase shareholdervalue (e.g. through improving ‘the bottom line’).
Conversely, improvement in these value areas can result insubstantial cost reductions. For example, an improvement in
294 Handbook of CRM: Achieving Excellence in Customer Management
HCRM-Ch06.qxd 9/16/05 10:57 Page 294

customer value may drive increased customer satisfaction, resultingin high levels of advocacy among the customer base and consequentsavings in marketing costs. This knock-on effect is evident in organi-zations such as First Direct, the UK bank, which acquires a third ormore of its customers through customer referrals rather thanthrough traditional marketing activities. Thus its acquisition costsfor each customer are significantly reduced.
We have noted above the linkage between three areas: employeevalue, customer value and shareholder value – but how are theyrelated? The linkage model shown in Figure 6.1 gives insight into thelogic but not the specific relationships between variables withinthese areas. It is not clear for most organizations how much one vari-able needs to improve to achieve a given level of improvement inanother variable. For example, if employee attitudes and satisfactionincrease by a measurable amount, what specific impact will thishave on customer satisfaction and resulting profitability?
As discussed shortly, some leading companies are usingadvanced modelling approaches to verify the exact nature of thelinkages between these sources of added value in their businessesand use them to improve shareholder results. As the search for newand improved ways of measuring the performance of key variablesacross these critical linkages continues, organizations are recogniz-ing the importance of addressing these higher-level driversbefore determining CRM standards, metrics and key performanceindicators (KPIs).
Developing appropriate standards,metrics and KPIs
Despite the increasing focus in businesses on customer-facing activi-ties, there is growing concern that the standards and metrics gener-ally used by companies for assessing CRM performance are not asadvanced as they should be. In particular, more detailed standards,measures and KPIs are needed to ensure CRM activities are plannedand performed effectively and that a feedback loop exists to maxi-mize organizational learning and improvement.
As shown in the Strategic Framework for CRM, assessing CRMperformance involves a consideration of the contribution and
The performance assessment process 295
HCRM-Ch06.qxd 9/16/05 10:57 Page 295
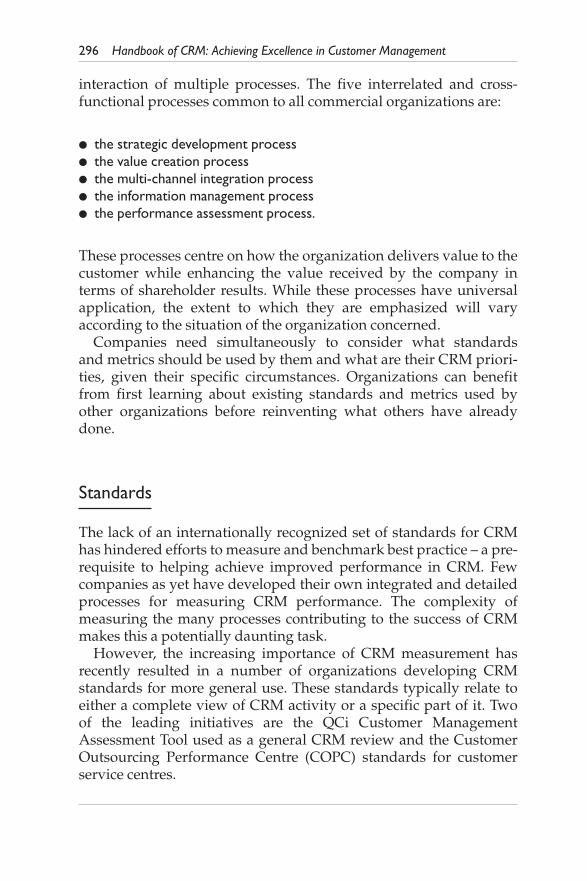
interaction of multiple processes. The five interrelated and cross-functional processes common to all commercial organizations are:
● the strategic development process● the value creation process● the multi-channel integration process● the information management process● the performance assessment process.
These processes centre on how the organization delivers value to thecustomer while enhancing the value received by the company interms of shareholder results. While these processes have universalapplication, the extent to which they are emphasized will varyaccording to the situation of the organization concerned.
Companies need simultaneously to consider what standardsand metrics should be used by them and what are their CRM priori-ties, given their specific circumstances. Organizations can benefitfrom first learning about existing standards and metrics used byother organizations before reinventing what others have alreadydone.
Standards
The lack of an internationally recognized set of standards for CRMhas hindered efforts to measure and benchmark best practice – a pre-requisite to helping achieve improved performance in CRM. Fewcompanies as yet have developed their own integrated and detailedprocesses for measuring CRM performance. The complexity ofmeasuring the many processes contributing to the success of CRMmakes this a potentially daunting task.
However, the increasing importance of CRM measurement hasrecently resulted in a number of organizations developing CRMstandards for more general use. These standards typically relate toeither a complete view of CRM activity or a specific part of it. Twoof the leading initiatives are the QCi Customer ManagementAssessment Tool used as a general CRM review and the CustomerOutsourcing Performance Centre (COPC) standards for customerservice centres.
296 Handbook of CRM: Achieving Excellence in Customer Management
HCRM-Ch06.qxd 9/16/05 10:57 Page 296

The QCi Customer Management Assessment Tool (CMAT)CMAT™ is a proprietary assessment tool for understanding howwell an organization manages its customers. It is carried out bytrained assessors who are experienced CRM practitioners withinQCi Assessment Ltd,9 a specialist CRM consultancy, or one of itspartner organizations.
The model is based on the following elements:
1. analysis and planning2. the proposition3. people and organization4. information technology5. process management6. customer management activity7. measuring the effect8. the customer experience.
Each of these elements is further sub-divided into component parts.For example, ‘people and organization’ covers:
● organizational structure● role identification● competencies definition and gap analysis● training requirements and resources● objective setting and monitoring● supplier selection and management.
CMAT uses over 250 questions to assess the organization’s perform-ance. Each question in the assessment is based on known anddemonstrable good practices from the clients of QCi and fromaccepted industry benchmark organizations. A ‘scoring based onevidence’ approach is taken to answering each question and a broadrange of people, from senior directors to operational level practition-ers, are interviewed. The approach is specifically designed to iden-tify clear plans, real delivery and an identifiable effect of each of thepractices questioned. In this way the all too common gap betweensenior management perception of the situation and the ‘front line’reality is often identified.
Figure 6.4 provides data for ‘United Bank’ in term of its overallperformance and eight component measures of the CMAT model. It
The performance assessment process 297
HCRM-Ch06.qxd 9/16/05 10:57 Page 297

also compares it with the overall average across all industry sectors andalso more interestingly within more direct competitors in banking,insurance and other finance businesses. Thus United Bank can compareitself with its competitors and also best practice across all industries.
The output of the assessment is a report and Board-level presenta-tion that positions the organization against a relevant benchmark ofother organizations. It also provides a quartile positioning for each of27 CRM areas into which the sections of the Customer Managementmodel are divided. The assessment has been carried out in over100 organizations worldwide so provides a rich set of data for a com-pany to benchmark its performance against.
The objective of the CMAT tool is to provide an objective and quan-titative assessment of how well the organization currently manages itscustomers with a score that correlates to business performance andbenchmarks the organization against a relevant set of other organiza-tions. This is especially beneficial when the company can compareitself against competitors in its own vertical industry sector, such asshown in Figure 6.4. It also forms a clear ‘baseline’ against whichimprovements delivered by a CRM programme can be measured andprovides a broad-based check that all the necessary CRM foundationsare in place before investing in specific programmes or technology.
Customer Operations Performance Centre(COPC) StandardOther standards focus on particular aspects of CRM in more detail.One such approach is the COPC Standard developed by users of
298 Handbook of CRM: Achieving Excellence in Customer Management
Figure 6.4 CMAT performance benchmarking for ‘United Bank’
Overall United Insurance Other Retailaverage Bank finance banking
Overall scores 32 40 28 30 41
Analysis & planning 28 28 27 19 37The proposition 30 26 26 24 36People & organization 38 54 31 40 49Information & technology 37 36 32 38 46Process management 29 36 27 36 35Customer management activity 31 37 26 30 37Measuring the effect 35 60 29 36 49The customer experience 28 40 20 16 42
Source: © QCi Assessment Ltd, used with permission
HCRM-Ch06.qxd 9/16/05 10:57 Page 298

customer service centres, call centres and fulfilment services in theUSA. It was initiated by representatives of a number of leading compa-nies – including American Express, Dell Computer Corp., Microsoft,Novell and L.L. Bean – in response to their concerns about the per-formance of call centre providers.
The developers of this standard believed that improvement stan-dards could help augment service quality within a service environ-ment, just as has been seen in manufacturing industries that employedsimilar quality measures. Although some service providers used exist-ing standards such as ISO 9000, these were orientated towards manu-facturing industries and failed to give the operational benefits thatwere needed in service businesses.
The COPC-2000 standard10 is awarded to companies successfullycompleting a formal audit measuring the effectiveness of their inter-nal customer-facing operations. Among its aims is to distinguishbetween excellent service providers and those that are mediocre,enabling companies who are outsourcing call or service centres touse this information before they make their purchasing decision. Thestandard includes developing process specifications based on cus-tomer requirements, so service delivery processes are customer andnot operationally driven.
The COPC standard is based on a number of well-recognized cri-teria used in the Malcolm Baldridge Quality Award. There are fourkey areas used within these standards.
● Performance standards, includes customer satisfaction, product and ser-vice quality, employee satisfaction and supplier performance
● Processes, includes process control, supplier management, internal qualityaudits and product development
● People, includes recruitment and development, compensation, recogni-tion and the work environment of employees
● Planning and leadership, includes leadership, planning and performancereview.
Although COPC does not set specific performance objectives thatevery call centre must meet, it does require that all performance met-rics are tracked by linking them to customer satisfaction drivers. Thisinformation is then used to improve overall call centre performance.
The aim of the COPC standard is to improve performance of all out-sourced call centres through widespread adoption of the standards.The measures have been widely accepted and, although call centres
The performance assessment process 299
HCRM-Ch06.qxd 9/16/05 10:57 Page 299

have often chosen not to pursue accreditation; many employ the per-formance metrics.
While COPC is supported by many call centre providers, only asmall number have as yet been certified. The process is difficult andcostly, so some organizations are choosing to adopt the standards anduse these to benchmark their performance, without going throughthe accreditation process.
While the COPC standards are designed for specific types oforganizations with a strong emphasis on customer service delivery,they are useful as an example of an integrated approach to measur-ing effectiveness within a key area of CRM.
Metrics
The identification of appropriate metrics is another challenge forcompanies seeking to evaluate and enhance their CRM performance.The main problem lies in determining the critical measures of CRM-related activity that are most appropriate to the organization andmanaging them effectively.
It is important at this stage to note the distinction between metricsand KPIs. Metrics involve all those CRM-related activities that shouldbe measured. Key performance indicators are the high-level measuresthat are critical to the success of the business and that should bemonitored closely by the Board and top management.
We consider four main categories of CRM metrics are especiallyimportant – customer metrics, operational (employee and process)metrics, strategic metrics and output and comparative metrics.These key metrics represent the ‘vital statistics’ of healthy CRM, sig-nalling the strength or weakness of the underlying CRM processes.Other more specialized metrics may also be needed to meet specificcompany requirements. In any event, these CRM metrics should beapplied regularly to provide an overall appraisal and monitoring ofCRM effectiveness.
Customer metricsCustomer metrics measure both the value delivered by the organiza-tion to the customer and the value delivered by the customer tothe organization. They are focused around measures of customerattitude and behaviour.
300 Handbook of CRM: Achieving Excellence in Customer Management
HCRM-Ch06.qxd 9/16/05 10:57 Page 300

Customer metrics are used to measure:
1. customer acquisition and customer retention rates2. customer satisfaction measures3. customer lifetime value4. customer experience within channel and across multi-channels5. customer complaints and seriousness of them6. segment and micro-segment profitability7. ‘share of wallet’8. product density (number of products and services used by a customer)9. customer recommendation and advocacy measures
10. increase in customer value through cross-sell and upsell.
People and process metricsPeople and process metrics focus on how well the organization’sresources are managed to optimize CRM at an operational level.People metrics are concerned with standards used to monitor theskills and motivation of employees in delivering the customer expe-rience. Process metrics reflect the efficiency of the organization indelivering CRM, including cost savings secured through processenhancement.
People metrics are used to measure:
1. employee performance against customer service standards2. employee satisfaction3. employee attitudes and motivation4. employee productivity5. staff absenteeism6. employee retention and employee tenure7. recruitment costs.
Process metrics are used to measure:
1. customer service levels2. order fulfilment3. supplier performance targets4. variation within key customer processes5. new product/service development targets6. time to market7. process improvement targets.
The performance assessment process 301
HCRM-Ch06.qxd 9/16/05 10:57 Page 301

Strategic metricsStrategic metrics measure the organization’s success in achieving itsbusiness objectives within the strategic approach to CRM that hasbeen adopted. They measure, for example, the extent to which thebusiness strategies meet the required shareholder value targets andstrengthen the organization’s position in the marketplace.
Strategic metrics are used to measure:
1. shareholder value added/market value added2. profitability and cash flow3. returns on net assets, sales, CRM investments, etc.4. growth rates5. expense ratios6. market positioning7. innovation8. brand equity9. specific targets for other stakeholders.
Output and comparative metricsOutput and comparative metrics measure the output of the organiza-tion’s CRM strategy, especially in relation to competitor activity andrecognized best practice. These comparative measures are frequentlymore important than absolute measures. Sole reliance on internalmetrics can be dangerous for they provide an isolated and insularview of the situation. For example, a market share of 20 per cent maybe advantageous if the largest competitor has a market share of 10 percent; however, it may be risky if the two largest competitors havemarket shares of 30 per cent each. Similarly, high levels of servicequality and customer satisfaction are generally only beneficial if theyare higher than those of the competition.
Output and comparative metrics are used to measure:
1. relative profitability2. relative market share3. relative customer satisfaction4. relative customer retention5. relative employee retention and satisfaction6. relative product or service quality7. cost reduction8. improvements in employee value (in terms of employee retention and
satisfaction)9. increased competitive differentiation.
302 Handbook of CRM: Achieving Excellence in Customer Management
HCRM-Ch06.qxd 9/16/05 10:57 Page 302

Special metricsSpecial metrics are sometimes used in conjunction with the four maincategories of metrics outlined above. For example, companies withintermediaries may need to implement customer performance meas-ures at different channel levels. Businesses with a strong e-commercecomponent may need to address the different characteristics of anInternet channel by developing specific e-metrics. Interestingly,despite the availability of data from web channels, relatively fewcompanies use these data to measure and monitor the effectivenessof their e-CRM activities.
Special e-metrics are used to measure:11
1. stickiness (the web site’s ability to hold visitors’ attention and to getthem to become repeat users of the site)
2. focus (the scope and intensity of site visitor behaviour)3. personalization index (how well the e-business uses personal customer
data captured during site visits)4. lifetime value (the contribution to company profits over the duration of
the customer relationship.Measuring lifetime value is particularly impor-tant as less valuable customers using other channels can be moved toimproved levels of profitability through using the web channel)
5. loyalty value (this includes visitor frequency, visit duration, number ofpages viewed per visit, time elapsed between the user’s first visit andmost recent visit)
6. freshness factor (how often content on a web site is reviewed andrenewed versus how frequently users visit the site).
Key performance indicators
As noted above, it is necessary to make a distinction among the met-rics outlined above. Some of them will be relevant at an operationallevel and some important at a strategic level. The latter metrics arethe key performance indicators that are critical to the success of thebusiness and which need to be monitored regularly at Board level.
Tim Ambler, a leading researcher on performance metrics, madethe following comment about high-level KPIs. ‘Large companieshave too many measures … Ten to 20 external metrics, plus two tofive for the internal market (employees), are enough for the Board ofa large company … Metrics and managing for value, taken together,give the Board the information it needs.’12, 13
The performance assessment process 303
HCRM-Ch06.qxd 9/16/05 10:57 Page 303

The outcome of Ambler’s research into the most commonly usedmarketplace KPIs is summarized in Figure 6.5.
This research is of particular interest because it not only measurescompanies’ use of these KPIs but also the percentage of companieswhere these KPIs reach the Board. The research findings raise con-cern as key aspects of CRM, such as customer satisfaction and cus-tomer retention, only reach the Board in 36 per cent and 51 per centof companies, respectively.
Decisions regarding which CRM metrics and high-level KPIsshould be adopted for measuring the effectiveness of CRM processesand activities should not be taken casually. Using the wrong meas-ures or measuring the wrong things is clearly self-defeating. Manycompanies will therefore need to establish a formalized system formonitoring CRM performance in order to ensure that the right met-rics are used to manage activities at operational level and the rightKPIs drive strategic decisions at Board level.
Multiple measures and linkage models
A relatively new development in measurement and metrics is theuse of multiple metrics and measures and efforts to identify relation-ships between them. There has been a growing recognition of theimportance of considering multiple measures as traditional financialaccounting measures were prone to giving misleading results.Proposals for a more balanced presentation of both financial andoperational measures have begun to proliferate.
304 Handbook of CRM: Achieving Excellence in Customer Management
Figure 6.5 Commonly used key marketplace metrics
Metric % of firms % that reachusing measure the top board
Awareness 78.0 28.0Market share (volume or value) 78.0 33.5Relative price (market share value/volume) 70.0 34.5Number of complaints (level of dissatisfaction) 69.0 30.0Consumer satisfaction 68.0 36.0Distribution/availability 66.0 11.5Total number of customers 65.5 37.4Perceived quality/esteem 64.0 32.0Loyalty/retention 64.0 50.7Relative perceived quality 62.5 52.8
Source: Based on Ambler14
HCRM-Ch06.qxd 9/16/05 10:57 Page 304

A range of other models has been proposed for measuring differentaspects of enterprise-wide performance. These include the MalcolmBaldridge award, the European Foundation for Quality Management(EFQM) Award and The Balanced Scorecard. These models representsystems of measures for monitoring and controlling enterprise per-formance; additionally they act as communication devices. In partic-ular, they emphasize the importance of measuring employeesatisfaction, customer satisfaction and business results in monitoringbusiness performance.
However, there are drawbacks with some of these models. Forexample, although the Baldridge and EFQM quality models encour-aged organizations to measure their performance in terms ofemployee satisfaction, customer satisfaction and financial results, themeasures are not systematically linked together so as to identify therelationships between them.
The balanced scorecardOne of the most popular attempts to provide cross-functional meas-ures is the balanced scorecard approach developed by RobertKaplan and David Norton.15 Their approach advocates the combina-tion of four different perspectives of performance:
1. the customer perspective, which focuses on how the customer sees theorganization
2. the internal perspective,which identifies what an organization must excel at3. the innovation and learning perspective,which focuses on how an organiza-
tion can improve and create value and4. the financial perspective, which considers how an organization appears to
its shareholders.
The ‘balanced scorecard’ has become an important part of manyorganizations’ CRM activities as it contains a customer outcomedimension. However, the mixed focus of the scorecard approach canlead to inadequate levels of customer-responsiveness and lethargicchange-management initiatives. The developers of this model alsopoint out that companies need to create their own unique scorecardswhich reflect the nature of their own businesses and key priorities.In the same way, CRM performance measurement needs to beapproached in an appropriately tailored way. Later in this chapterwe show how the balanced scorecard criteria can be used to create atailored success map for a specific organization.
The performance assessment process 305
HCRM-Ch06.qxd 9/16/05 10:58 Page 305

Linkage models and the service-profit chainLinkage models illustrate the relationships between employees, cus-tomers and organizational performance. The service-profit chainmodel shown in Figure 6.6, the best-known version of the linkagemodel, establishes the relationships between profitability, customerloyalty and employee satisfaction, loyalty and productivity. Theresearchers have described their model, as follows:
The links in the chain, which should be regarded as propositions, are asfollows: Profit and growth are stimulated primarily by customer loyalty.Loyalty is a direct result of customer satisfaction. Satisfaction is largelyinfluenced by the value of services provided to customers.Value is cre-ated by satisfied, loyal and productive employees.Employee satisfaction,in turn, results primarily from high-quality support services and policiesthat enable employees to deliver results to customers.16
The service-profit chain model has shown how the linkagesbetween these metrics are related and how KPIs can be leveraged tosecure improved results. Advances in economic statistical modellingcan now enable companies to identify the various relationships withgreater accuracy and determine where improvements can most prof-itably be made. This work has been pioneered by the internationalconsultancy CFI Group,18 founded by University of Michigan econo-metrician Claes Fornell.
306 Handbook of CRM: Achieving Excellence in Customer Management
Internalservicequality
Employeesatisfaction
Employeeretention
Employeeproductivity
Externalservicevalue
Customersatisfaction
Revenuegrowth
Profitability
• Workplace design• Job design• Employee selection and development• Employee rewards and recognition• Tools for serving customers
• Service concept: results for customer
• Service designed and delivered to meet targeted customers’ needs
• Retention• Repeat business• Referral
Customerloyalty
Source: Based on Heskett et al.17
Figure 6.6 The service-profit chain
HCRM-Ch06.qxd 9/16/05 10:58 Page 306

However, although the concept of using a linkage model is poten-tially very attractive, there are still relatively few examples of com-panies who could be described as ‘advanced’ in terms of adoption ofsuch an approach. This finding may not be surprising as very few ofthe companies involved in the original service-profit chain researchhad explored all the linkages across the model, let alone used causaltechniques of measurement. The two case studies in this chaptershow examples of leading companies who have pioneered thisapproach – one from the business-to-consumer sector and one fromthe business-to-business sector.
The first case study on Sears, Roebuck & Company, the leading USdepartment store, is one of the most outstanding exemplars of theuse of this approach. Sears used a modified version of the serviceprofit chain to predict and manage performance and shareholderresults.
The performance assessment process 307
Case 6.1 Sears, Roebuck & Company – Casestudy overview
Sears has held a position of eminence in the US retail sector for over100 years. During this period, it has become a household name, withAmericans associating it with quality and value. However, over the lastdecade or so, Sears has had to fight hard to overcome the difficulties of amature market and adverse trading conditions.
This case study examines events over the last ten years. It focuses onhow the senior management approached the situation facing thecompany in the 1990s, when Sears faced gigantic financial losses. Theirremedy included adopting a new approach to managing business per-formance. They developed a model that links the performance of man-agement, employees and customers directly to company profits and soprovides some important insights into the value of adopting CRM.
This case study shows how effective CRM depends not only on man-aging relationships with customers, but also with other important stake-holders. It describes the roles played by three stakeholder groups:employees (including senior management and employees), customersand suppliers. The CEO and his top team recognized that to implementsuccessful CRM, it was necessary to change the behaviour of its seniormanagers. The leadership skills of managers were responsible for theculture of Sears and this had an important impact on revenues.
Sears acknowledged that successful relationships with customersare dependent upon successful management of employees. Senior
HCRM-Ch06.qxd 9/16/05 10:58 Page 307

The second case study that illustrates the use of this approach is NortelNetworks, the Canadian telecoms company. It illustrates how suchCRM approaches can be extended to the business-to-business sector.
308 Handbook of CRM: Achieving Excellence in Customer Management
management identified key profit indicators which allowed them tomanage their business more efficiently. Three key areas were monitoredinvolving many metrics, including 25 employee measures, 20 customermeasures and 19 financial performance indicators.
The full case study is at the end of this chapter (see p. 319)
Case 6.2 Nortel Networks – Case studyoverview
Nortel Networks operates in the global telecommunications market.Although Nortel suffered badly from the dramatic downturn of the tele-coms sector at the start of the 2000s, the company’s use of performanceassessment is highly developed. This case describes how Nortel devel-oped a sophisticated CRM performance assessment process.
Understanding how value is created and delivered has played a criti-cal role for the company as Nortel changed from being a manufacturer ofequipment to a primarily service organization offering network solu-tions. This change in focus required very different skills and resources,putting pressure on the organization to be extremely flexible while con-tinuing to deliver high quality customer service.
Initially Nortel focused on the key role of employees within the valuecreation process. It then directed attention to understanding how cus-tomer satisfaction and shareholder value are linked. Nortel understoodthat its relationships with customers would be threatened unless thecompany understood its value creation process. To achieve this, seniormanagement identified that they needed to put in place a sophisticatedmeasurement system. This allowed close monitoring of the value cre-ated by people and processes so that managers could allocate appropri-ately the investment resources of the business.
Nortel found that employee satisfaction accounts for 52 per cent ofcustomer satisfaction, making this measure critical to successful CRM;so the company developed an appropriate employee recognition andreward system that was closely linked to business results and customerloyalty.
The full case study is at the end of this chapter (see p. 324)
HCRM-Ch06.qxd 9/16/05 10:58 Page 308

Although the underlying ideas behind the service profit chainreflect the practices of many leading service organizations, very fewcompanies have sought to develop detailed metrics to understandthe linkages between employee value, customer value and share-holder value and how they contribute to corporate success.
The companies in these two case studies have had significant chal-lenges confronting them, which has affected their recent perform-ance. In common with many retailers, Sears’ performance has beenhit by the adverse economic environment of the early 2000s, intensecompetition and the aftermath of terrorists’ threats and the secondGulf war. Nortel Networks was confronted by the worst downturnthere has been in the history of the telecoms sector. However, theyremain among the best examples of the development and use ofadvanced linkage models in their respective sectors.
Establishing a CRM performance monitoring system
As a company gains a good understanding of existing CRM stand-ards, as well as CRM metrics and models in general use, it shouldalso be considering its own requirements. This involves determiningthe key CRM standards, metrics and KPIs needed for its businessand putting a CRM performance monitoring system in place.
CRM starts with the strategy development process. A key aspectin this process is agreement on the high-level goals and strategy ofthe business. This can then lead to the development of a strategymap or a success map that captures the performance model underly-ing the business strategy.
Developing strategy maps and success maps
Experts in performance measurement have identified a significantbarrier to improved measurement: the need for senior management toagree on the business performance model for their firm before a com-prehensive system of performance measurement can be developed.
A number of authors have pointed out the benefits of developingstrategy, or success, maps. A success map provides a graphic outline
The performance assessment process 309
HCRM-Ch06.qxd 9/16/05 10:58 Page 309

of the highest-level goals the organization is striving to achieve andthe current progress status. By juxtaposing the proposed end goal andthe existing position, it is possible to identify the metrics necessary toensure that the goal is achieved successfully. This process can be usedto distil a wide range of measures down to those that matter most.
Kaplan and Norton have developed one of the best-known ver-sions. Their strategy map involves identifying a chain of ‘cause andeffect’ logic that connects the company’s strategy with the driversthat lead to commercial success. It incorporates each of the four per-spectives of the balanced scorecard.19 Andy Neely and his colleagueshave developed an extension of the strategy map, the success map, toemphasize the need for a broader perspective on stakeholders and aresolute emphasis on end goals.20
These mapping techniques can be extremely helpful in determin-ing the most appropriate metrics and KPIs for monitoring CRM per-formance at any given time. Success maps may be complex orrelatively simple.
Sears, Roebuck’s performance model was built using data fromover 800 stores.21 It used 20 customer measures, 25 employee meas-ures and 19 financial performance indicators by store (theseincluded measures of productivity, revenues, margins, payroll costs,number of transactions, etc). Although the approach to measure-ment used by Sears, Roebuck involves many individual customer,employee and financial measures, these can be summarized in arelatively simple success map based on Sears’ three key strategicobjectives – to become:
● a compelling place to shop at● a compelling place to work at● a compelling place to invest in.
Sears attached to each of these strategic imperatives (aimed at thethree main stakeholder groups: customers, employees and share-holders) a set of high level metrics which when agreed became theKPIs. A summary of the Sears’ success map is shown in Figure 6.7.
A further example of a success map is shown in Figure 6.8. In thiscase, it is based on perspectives from the balanced scorecard anduses the financial, customer, internal and learning perspectives.
This approach provides the business logic for understanding theexplicit levers that top executives need to manage and monitor forsuccess.
310 Handbook of CRM: Achieving Excellence in Customer Management
HCRM-Ch06.qxd 9/16/05 10:58 Page 310

Development of metrics and KPIs for your business
From an examination of the success map and the lists of metricsabove, the most relevant KPIs for your businesss can be identifiedand used to develop a monitoring system. Wherever feasible,
The performance assessment process 311
Figure 6.7 Simplified success map for Sears, Roebuck
Strategic imperatives Metrics
➤ Compelling place to shop ● meeting customer needs● creating customer satisfaction● retaining customers
➤ Compelling place to work ● achieving personal growth and development● empowered teams
➤ Compelling place to invest ● return on assets● sales growth● sales per square foot● operating income margin● inventory turnover
Financialperspective
Improvereturns
Broadenrevenue
mix
Improveoperatingefficiency
Customerperspective
Internalperspective
Learningperspective
Ideas fromemployees
Improvedeliveryreliability
Increaseproductrange
Improvestock
control
Cross-sellthe product
line
Developnew
products
Educatesalesforce
Reduceleadtimes
Source: Based on Neely22
Figure 6.8 Success map based on the balanced scorecard
HCRM-Ch06.qxd 9/16/05 10:58 Page 311

metrics and KPIs should be consistent across the functions, businessunits and territories of the business. While existing measures may beavailable in many areas of the business, it is essential that these arecomplemented by new KPIs and standards that thoroughly assessthe relationship with the enterprise’s customers and which enablebenchmarking of operational efficiency against competitors andother relevant organizations. Self-assessment, benchmarking andcomparisons with external standards such as QCi and COPC areuseful to gain this broader perspective.
One approach to metrics endorsed by a number of CRM seniorexecutives is to get a broad picture of overall CRM activity but thento focus down in a much more detailed way on the most criticalareas for the company. As one financial services executive said:‘I want to have a micro view of how we are doing compared to ourcompetition across the full gamut of CRM; but I also need a sum-mary dashboard of the really important KPIs that I need to focuson’. This is a pragmatic solution as it addresses the need to have anenterprise-wide view of CRM and to focus on the key performanceareas to achieve targets in terms of profits and shareholder value.Once the relevant metrics have been identified, it is important thatthese are communicated clearly and in a visually engaging mannerto management.
The example of a customer experience scorecard visualizationgiven in Figure 6.9 demonstrates how a graphic depiction of CRMstatus can be a powerful tool in communicating progress againstgoals on the basis of those CRM KPIs considered most important. Inthis example, key higher-level CRM metrics for a telecommunica-tions and cable TV company are reported, including customer acqui-sition, customer retention and customer value. Further ‘drill-down’facilities into more detailed subsidiary metrics are available, as indi-cated by the magnifying glass symbol.
312 Handbook of CRM: Achieving Excellence in Customer Management
HCRM-Ch06.qxd 9/16/05 10:58 Page 312

Other formats can also be used. One performance monitoring sys-tem used by companies such as GE involves developing a strategic‘route map’, which gives the overall direction to be followed, togetherwith a metrics ‘dashboard’ that reports the key performance meas-ures, often using a ‘stoplight’ colour scheme of green, yellow and redto indicate whether each key metric is on target or otherwise.
Evaluating and communicating CRM returnon investment
In addition to defining and applying the right standards, metricsand KPIs, an effective CRM performance monitoring system must becapable of measuring and communicating the return on investment(ROI). Because CRM places considerable emphasis on the use of ITin managing customer relationships, it is a potentially costly man-agement option, in terms of both required IT expenditure and inher-ent adjustments to internal infrastructure and existing systems.
The performance assessment process 313
302520151050
35
Jun
79%
Extend customer valueRetain existing customers Acquire new customers
Customer loyalty
Overall satisfaction rating
Contact monitor
Customer experienceratings
01 2 3 4 5 6 7 8 9 10111213
5
10
15
20
25
Week
1 2 3 4 5 6 7 8 9 10 11 12Week
Telewest churnTarget%
Churn
Churn
12%
Target
Target
Installs
Customers
Additions
(#)
(#)
(£)
(£)
(£)
Value of existingcustomers
Jan Mar Sep
JunJan Mar Sep
JunJan Mar Sep
£51 m
Customer lifetimevalue
£1040
Average revenueper customer
£69
Customer advocacy rating
45%
13 023
2.8 m
15 504
Number of Installs
Num
ber
'000
JunJan Mar Sep
JunJan Mar Sep
Source: Neely et al.23; based on Accenture and Telewest Communications
Figure 6.9 Example of a customer experience scorecard visualization
HCRM-Ch06.qxd 9/16/05 10:58 Page 313

Given the number of reported CRM failures, the business case forinvesting in CRM should therefore address the following questions:
● Is an investment in improving CRM likely to lead to improved businessperformance?
● How can investments in CRM be measured?
Relating CRM performance to business performance
Although common sense would suggest that successful CRM per-formance should lead to improved business results, decisions toinvest in CRM must be soundly justified. Companies that have usedsuccess maps to link a range of key CRM metrics to financial andshareholder results, such as those used by Sears, Roebuck, supportthe view that well-based CRM initiatives are worth the often consid-erable investment they entail.
A QCi study showed CMAT results correlate strongly with busi-ness performance. The study examined data from 21 companies (12of these were from financial services, two from utilities, two fromdistribution and three from manufacturing). A panel of independentexperts assessed the business performance of each organizationagainst a broad range of measures such as sales growth, profitabilityand asset growth. The assessors did not know how well each organi-zation had performed in its CMAT assessment.
The ranking of the organization’s business performance was thencompared to its ranking in terms of CMAT score. Figure 6.10 showsthe results of the study in terms of CRM performance (measured bythe CMAT score) and business performance.24
314 Handbook of CRM: Achieving Excellence in Customer Management
Business performance versus customermanagement performance
0
5
10
15
20
25
0 5 10 15 20 25
Business performance rank (1 = highest)
Cus
tom
er m
anag
emen
t ran
k(1
=hi
ghes
t)
Source: © QCi Assessment Ltd, used with permission
Figure 6.10 Comparison of CRM performance to business performance
HCRM-Ch06.qxd 9/16/05 10:58 Page 314

This research supports the view that CRM performance is relatedto overall business performance and concludes that the most impor-tant factors are:
● people and leadership● measurement and deployment processes to action needed results, and● implementing appropriate CRM practices such as targeting high lifetime
value customers.
These findings are encouraging and reinforce what experienced prac-titioners and knowledgeable consultants already know: attention tothe ‘people’ element, implementation of customer-oriented practicesand proper measurement systems constitute the critical success fac-tors (CSFs) for CRM. However, given the incidence of CRM prob-lems, further research is needed in this area.
Measuring CRM return on investment
A further issue of concern is measuring the return on CRM initia-tives. A Cranfield Research Report25 examined how companiesmeasure the payback on their investment in CRM projects and foundthat the following four criteria are typically used when evaluatingthe success of investments in CRM activities. These criteria carryadvantages and disadvantages.
1. Improvements in customer service, satisfaction and retentionThese metrics are of greatest value when specifically linked to approachesthat show their impact on profit and shareholder value.We have notedearlier that customer retention of your best customers has a criticalimpact on profitability.
2. Return on investment (ROI) on the CRM systems adoptedMeasuring ROI on CRM systems is beneficial where there are specificinvestments in certain CRM applications, such as sales force automation(SFA) or campaign management systems which can be directly linked tocustomer metrics, or where there are identifiable efficiencies or costreductions. However, it is important to ensure customer satisfaction isnot adversely affected as a result of introducing such systems.
3. Changes in overall company performanceChanges in overall company performance as a result of investment inCRM may be difficult to evaluate as it can often be hard to tell whatwould have happened without the CRM investment. Performance
The performance assessment process 315
HCRM-Ch06.qxd 9/16/05 10:58 Page 315

improvements, for example, could be the result of many factors such asdecreased promotional activities by competitors.
4. Increases in customer and segment profitabilityMeasuring increases in the profitability of customers and customer seg-ments and understanding how this ultimately impacts on shareholder valueis an area of growing interest. It involves a consideration of both current andfuture profit impact potential. Hence, estimates of potential customer life-time value need to be calculated alongside existing customer lifetime value.
ROI measurement is an important element of CRM. As stressedthroughout this chapter, CRM performance assessment should beviewed in the context of a strategic approach to CRM. The typicalcriteria for measuring CRM ROI listed above clearly embrace thiscompany-wide view of CRM.
Summary
The performance measurement systems adopted by organizations inthe past have tended to be functionally driven. Thus, financial meas-ures were mainly the concern of the Board and the finance depart-ment, marketing measures the domain of the marketing departmentand people measures the responsibility of the HR department. Sucha functional separation of performance measures is inappropriate forCRM, which involves a cross-functional and holistic managementapproach.
The performance assessment process in the Strategic Frameworkfor CRM involves an evaluation of the success of CRM activities inorder that gaps in performance can be identified and improvementsmade. It is this process which ensures that the organization’s strat-egic aims in terms of customer relationship management are beingdelivered to an appropriate and acceptable standard. The keyactions involve understanding the drivers of shareholder value,identifying the appropriate metrics and standards against which thevarious CRM activities can be measured, establishing an effectivemonitoring system to apply these measures on an ongoing basis andcommunicating and acting on resultant learning.
A number of approaches are open to organizations seeking toestablish CRM metrics and KPIs for measuring, monitoring andbenchmarking their CRM performance. They include use of externalbenchmarks such as the QCi and COPC standards and measuring
316 Handbook of CRM: Achieving Excellence in Customer Management
HCRM-Ch06.qxd 9/16/05 10:58 Page 316

and monitoring performance using tools such as the balanced score-card and linkage models. However, in order to improve the perfor-mance of its CRM activities, a company must develop its owncomposite set of measures based on its own success maps. Suchefforts to develop individually tailored and relevant performanceassessment processes are critical, given the high incidence ofreported CRM failure and the impressive returns for those whoachieve CRM success.
Developing a CRM strategy does not conclude with the performanceassessment process – the last of the five processes in the CRM strategyframework. In the final chapter that follows we address organizing forCRM implementation. Here we consider the readiness of the organiza-tion to engage in CRM activities and the issues of change management,project management and employee engagement that play such acrucial role in CRM success.
Checklist for CRM leaders
CRM leaders need to review the following issues about thePerformance Assessment Process.
Shareholder results
1. Our top management recognize the importance of leadership in creat-ing employee, customer and shareholder value
2. The key drivers of shareholder results – employee value, customervalue, shareholder value and cost reduction – are fully understood
3. We place sufficient emphasis in our organization on employee value4. We rank ourselves highly in terms of recruiting, selecting, developing
and empowering our employees5. We place sufficient emphasis in our organization on customer value6. We rank ourselves highly in terms of delivering superior customer
value opportunities in every attractive customer segment7. We place sufficient emphasis in our organization on shareholder value8. We rank ourselves highly in terms of creating shareholder value com-
pared with our major competitors9. We take full advantage of all opportunities for cost reduction. Cost
reduction strategies do not negatively impact customer satisfaction10. We have developed, or are developing, a balanced scorecard or linkage
model in our organization that addresses the relationship betweenemployee satisfaction, customer satisfaction and business results.
The performance assessment process 317
HCRM-Ch06.qxd 9/16/05 10:58 Page 317

Standards, metrics and key performance indicators
1. We have developed our own standards across all the areas of CRM thatare important to us
2. We have adopted standards developed by others (e.g. CMAT or COPCstandards) and used these to benchmark our performance against rele-vant external comparators
3. We have identified and put in place appropriate customer metrics4. We have identified and put in place appropriate people and process
metrics5. We have identified and put in place appropriate strategic metrics6. We have identified and put in place appropriate output and compara-
tive metrics7. A strategy map (or success map) has been developed that identifies the
chain of ‘cause and effect’ logic that connects our company’s strategywith the drivers that lead to commercial success
8. Our organization has identified the most important KPIs and these arereported to senior management on a regular basis
9. Frameworks such as the balanced scorecard are utilized to ensure thereis a focus on all relevant areas of performance, not just financial ones
10. A CRM performance monitoring process is in place and attention hasbeen given to making sure KPIs are communicated in a visually engag-ing manner to management and other relevant employees.
Each issue should be considered in terms of:
Rating for our organization (5 � applies fully; 0 � does not apply at all)Importance to our organization (5 � very important; 0 � no importance)
318 Handbook of CRM: Achieving Excellence in Customer Management
HCRM-Ch06.qxd 9/16/05 10:58 Page 318

Case 6.1 Sears, Roebuck and Company
The company
Sears, Roebuck and Company has been a leading US retailer for over 100years. A household name, Americans associate it with value and quality.When Sears was founded in 1886, there were only 38 states in the USA andmost of its product deliveries were horse drawn. In the ensuing 12 decades,the company laid down a multitude of highly refined business processesand well-automated information systems. However, during the last twentyyears Sears has had to fight hard to overcome the difficulties inherent in amature market, to combat adverse trading conditions and to compete withWal-Mart, a much larger competitor. Sears realized that its familiar ways ofdoing business were no longer enough to keep ahead of competitors.
The challenge
In 1992, Sears, Roebuck and Company reported massive losses of $3.9 bil-lion on sales of $52.3 billion. This was the worst trading year in the com-pany’s history. This resulted from various trends, most of them directlyrelated to the company’s lack of focus. Over the 1980s Sears had diversifiedinto other markets such as insurance, financial services, brokerage and realestate. At the same time other retailers such as Wal-Mart were focusing onthe retail consumer and were taking market share away from Sears. Searsneeded to refocus on its core business and to develop a performance modelthat would help drive a return to profitability.
The solution
A new CEO, Arthur Martinez, was appointed in 1992 to head the merchan-dise group and he undertook a streamlining of the business. He closed 113stores and terminated the 101-year-old Sears catalogue, which was a house-hold institution within the USA. He also set about changing the servicestrategy, focusing on women, who were the most important buying deci-sion makers.
Martinez set up four task forces (customers, employees, financial per-formance and innovation) to define world class status in each specific area,identify obstacles and define metrics for measuring progress. The taskforces spent months listening to customers and employees, observing bestpractice in other organizations and establishing measures against objectives.Gradually it became apparent that what was needed was a model to showdirect causation from employee attitudes, through customer satisfaction to
The performance assessment process 319
HCRM-Ch06.qxd 9/16/05 10:58 Page 319

profits. The company needed to know how management action, such asinvestment in sales force training, would directly translate into improvedcustomer satisfaction, retention and higher revenues. What was neededwas an operationalization of what they termed the employee-customer-profitchain. The revised model of this is shown in the figure below.
320 Handbook of CRM: Achieving Excellence in Customer Management
Employee focus Customer focus
Investor focus
Attitudeabout the
Job
Attitudeabout thecompany
Employeebehaviour
Employeeretention
Servicehelpfulness
Merchandisevalue
Customerimpression
Customerrecommendations
Customerretention
Return on assetsOperating marginRevenue growth
Source: based on Sears, Roebuck and Company.
Figure 1 The revised employee-customer-profit chain at Sears
Sears defined a set of measures based on its objectives. These were brokendown into three objectives which focused on making Sears ‘a compellingplace to work at, to shop at and to invest in’. This represented a focus on threevalue domains: employees, customers and shareholders. Relationshipsbetween changes in key metrics were identified using causal pathway mod-elling. The econometric modelling of the relationships was undertaken byCFI Group.
Sears’ enterprise performance model was built using data from over 800stores. It used 20 customer measures, 25 employee measures and 19 finan-cial performance indicators by store (these included measures of productiv-ity, revenues, margins, payroll costs, number of transactions).
The results
The results of this work were impressive. Direct causal links were identifiedbetween employee measures, customer measures and revenues so totalprofit indicators for the company could be established. Employee attitudetowards the job and company were found to be critical to employee loyalty
HCRM-Ch06.qxd 9/16/05 10:58 Page 320

and behaviour towards customers, while customer impression directlyaffected customer retention and the likelihood of recommendations. Afterfurther refinement, the model was used as a predictor of revenue growth: a5 unit increase in employee attitude drives a 1.3 unit increase in customerimpression, a 0.5 increase in revenue growth and a quantifiable increase instore profitability.
To implement the service-profit chain model successfully it was neces-sary for Sears to change the behaviour of its senior managers and encour-age them to take responsibility for the company’s culture and understandhow this impacted on revenues. In addition, employee rewards needed tobe aligned to the model for financial and non-financial measures.
Later, a further change was made by streamlining its CRM systems.Previously there were 18 separate legacy databases; there is now a single,integrated data warehouse of over seven terabytes, as shown in Figure 2.
As a result, in 1993 the company reported a net income of $752 million – adramatic reversal of fortunes for a mature company such as Sears. In theperiod following the implementation of the enterprise performance model,employee satisfaction at Sears rose by 4 per cent and customer satisfactionby almost 4 per cent. More than $200 million additional revenues wereachieved through this value creation process.
Figure 3 shows the relative performance improvement on selected meas-ures including profitability, customer satisfaction and associate (their termfor employees) attitudes between 1992 and 1998.
Confidence in the data was such that Sears computed 30 per cent to70 per cent of its executive compensation from these measures. Sears deliv-ered earnings of US$1.3 billion in 1997. In terms of shareholder value, the
The performance assessment process 321
Strategic performance reporting system(sales, inventory, margin, distribution)
approximately 7 terabytes
Sales Distrib Finance Inventory
AfterBefore
Source: R Swift, NCR Teradata
Figure 2 The IT transformation at Sears
HCRM-Ch06.qxd 9/16/05 10:58 Page 321

total return to investors between September 1992 and April 1997 was298 per cent. This was a remarkable improvement for a firm in such amature business. Sears is now using this measurement system to improvefuture revenues and profits.
By 1998 a new challenge had emerged, the lack of sales momentum. Searswas in a very difficult and highly competitive sector and to address thesechallenges, the business needed a fresh approach to managing its relation-ships with customers. In 1999, President and CEO Arthur Martinez said,‘Now, what we need is renewed energy. We need what I’m calling a SecondRevolution – a second revolution in our marketing communications to ourcustomer to send a stronger message about who we are and what our valueproposition is’. To address these challenges Sears responded with a new re-organization, a major new marketing campaign and other initiatives.
Martinez was also a driving force behind e-commerce activities at Sears.These began in 1996 with the launch of Sears.com and by 1999, it was ratedby Nielsen as the fourth fastest growing shopping site. However, the sitewas not user friendly and in 2000 it was relaunched with enhanced capabili-ties. These included facilities that improved searches, smoothed navigationand simplified shopping. The results were very encouraging with Sears.comnamed the number one e-retailer in the world.
Another important development was the creation and development ofGlobalNetXchange. This was launched in 2000 and was the first B2B mar-ketplace for retail. Its success is due to uniting technology partners withretailers and in so doing, making the supply chain more efficient. Initially,the company has focused on the relationships of Sears and other retailgiants, with their suppliers, partners and distributors. The exchange allowsthese companies to have a common place to buy, sell, trade or auctiongoods and services online. The result has been that companies have
322 Handbook of CRM: Achieving Excellence in Customer Management
1992 1993 1994 1995 1996 1997 1998
Profitability
Customersatisfaction
Associateattitudes
Figure 3 Sears, Roebuck – selected performance measures, 1992–1998
Source: Sears, Roebuck and Company.
HCRM-Ch06.qxd 9/16/05 10:58 Page 322

been able to buy more effectively and to manage their supply chain better.These advantages are passed on to the customer in creating a better valueproposition. Sears knows that this is critical to driving sales and profits inthe company.
In 2001 Alan Lacy, a new chief executive, was appointed. His radicalnew initiatives included the acquisition of Lands End, a $1.6 billion retailerand the largest catalogue and Internet specialty clothier in the USA, in 2002and putting the profitable but troubled credit card division up for sale in2003. The acquisition of Lands End was met favourably by financial ana-lysts. However, analysts agree that the retail giant must continue focusingon a growth strategy to overcome the difficulties of this troubled sector.Central to their CRM strategy in the future will be performance measuringand management of critical relationships with employees, customers andshareholders.
The performance assessment process 323
HCRM-Ch06.qxd 9/16/05 10:58 Page 323