Embed Size (px)
Citation preview

© 2016 International Monetary Fund
IMF Country Report No. 16/270
THE PEOPLE’S REPUBLIC OF CHINA 2016 ARTICLE IV CONSULTATION—PRESS RELEASE; STAFF REPORT; AND STATEMENT BY THE EXECUTIVE DIRECTOR FOR THE PEOPLE’S REPUBLIC OF CHINA
Under Article IV of the IMF’s Articles of Agreement, the IMF holds bilateral discussions with
members, usually every year. In the context of the 2016 Article IV consultation with the People’s
Republic of China, the following documents have been released and are included in this
package:
A Press Release summarizing the views of the Executive Board as expressed during its
July 27, 2016 consideration of the staff report that concluded the Article IV consultation
with the People’s Republic of China.
The Staff Report prepared by a staff team of the IMF for the Executive Board’s
consideration on July 27, 2016, following discussions that ended on June 14, 2016, with the
officials of the People’s Republic of China on economic developments and policies. Based
on information available at the time of these discussions, the staff report was completed on
July 7, 2016.
An Informational Annex prepared by the IMF staff.
A Staff Statement updating information on recent developments.
A Statement by the Executive Director for the People’s Republic of China
The documents listed below have been or will be separately released.
Selected Issues
The IMF’s transparency policy allows for the deletion of market-sensitive information and
premature disclosure of the authorities’ policy intentions in published staff reports and other
documents.
Copies of this report are available to the public from
International Monetary Fund Publication Services
PO Box 92780 Washington, D.C. 20090
Telephone: (202) 623-7430 Fax: (202) 623-7201
E-mail: [email protected] Web: http://www.imf.org
Price: $18.00 per printed copy
International Monetary Fund
Washington, D.C.
August 2016

Press Release No. 16/374
FOR IMMEDIATE RELEASE
August 12, 2016
IMF Executive Board Concludes 2016 Article IV Consultation with
the People’s Republic of China
On July 27, 2016, the Executive Board of the International Monetary Fund (IMF) concluded the
Article IV consultation1 with China.
China continues its transition to sustainable growth, with progress on many fronts yet also many
challenges. Growth slowed to 6.9 percent in 2015 and is projected to moderate to 6.6 percent this year
owing to slower private investment and weak external demand. The economy is advancing on many
dimensions of rebalancing, particularly switching from industry to services and from investment to
consumption. But other aspects are lagging, such as strengthening SOE and financial governance and
containing rapid credit growth.
Inflation dipped below 1.5 percent in 2015 and is expected to pick up to around 2 percent this year,
reflecting the rebound in commodity prices and the exchange rate depreciation since mid-2015.
Infrastructure spending picked up and credit growth accelerated in the second half of 2015.
Accommodative macro policies are projected to continue supporting activity over the remainder of
2016.
The current account surplus is projected to decline to 2.5 percent of GDP this year (from 3 percent of
GDP in 2015) as imports increase and the services deficit widens with continued outbound tourism.
The balance of payments came under pressure in 2015 due to large capital outflows, mainly related to
repayment of external debt. The volume of outflows is expected to moderate this year. After
appreciating 10 percent in real effective terms through mid-2015, the renminbi has depreciated some
4.5 percent since then and remains broadly in line with fundamentals.
1 Under Article IV of the IMF's Articles of Agreement, the IMF holds bilateral discussions with members, usually
every year. A staff team visits the country, collects economic and financial information, and discusses with officials
the country's economic developments and policies. On return to headquarters, the staff prepares a report, which
forms the basis for discussion by the Executive Board.
International Monetary Fund 700 19th Street, NW Washington, D. C. 20431 USA

Executive Board Assessment2
Executive Directors commended the Chinese authorities for their strong determination to achieve
more balanced, sustainable growth. They noted that economic growth continues to moderate and
is driven increasingly by services and consumption. Directors welcomed the impressive progress
on structural reforms in many areas, notably interest rate liberalization, internationalization of the
renminbi, and urbanization. They also welcomed the 13th Five-Year Plan, with its ambitious
goals centered on economic rebalancing.
Directors noted that China’s economic transition will continue to be complex, challenging, and
potentially bumpy, against the backdrop of heightened downside risks and eroding buffers. They
stressed the need for decisive action to tackle rising vulnerabilities; reduce the reliance on
credit-financed, state-led investment; and improve governance, risk pricing, and resource
allocation in the state-owned enterprise (SOE) and financial sectors. Directors emphasized that
consistent, well-coordinated, and clearly-communicated policies are key to a smooth, successful
transition, which will eventually benefit the global economy.
Directors highlighted the urgency of addressing the corporate debt problem through a
comprehensive approach. They encouraged the authorities to harden budget constraints on SOEs;
triage and restructure or liquidate over-indebted firms; and recognize losses and share them
among relevant parties, including the government if necessary. Piloting a few SOEs would make
a strong start to the process. Directors recommended that the authorities complement these
measures with targeted social assistance for displaced workers, and initiatives to facilitate entry
of new, dynamic private firms.
Directors concurred that macroeconomic policies should be geared at lowering vulnerabilities,
which would likely entail somewhat slower growth in the short term. They welcomed the
authorities’ intention to rely on fiscal support if growth falls sharply in the near term. To this
end, they saw merit in using on-budget, pro-consumption measures, which would help promote
internal and external rebalancing. Measures could include raising pensions; increasing social,
education and health spending; providing restructuring funds; and cutting minimum social
security contributions. Continued efforts are also needed to ensure full implementation of the
new budget law, improve fiscal transparency, and modernize the tax system.
Directors underscored the importance of further enhancing financial stability. Priorities include
encouraging banks to proactively recognize loan losses and strengthen capital ratios; enhancing
supervisory focus on liquidity risk management and funding stability risks; and addressing
vulnerabilities in shadow products. Directors also recommended a major upgrade of the
supervisory framework to foster cross-agency information sharing and policy coordination,
2 At the conclusion of the discussion, the Managing Director, as Chairman of the Board, summarizes the views of
Executive Directors, and this summary is transmitted to the country's authorities. An explanation of any qualifiers
used in summings up can be found here: http://www.imf.org/external/np/sec/misc/qualifiers.htm.

reduce the scope for regulatory arbitrage, and enhance crisis management capabilities. They
looked forward to the forthcoming Financial Sector Assessment Program Update.
Directors noted the staff’s assessment that the renminbi is broadly in line with fundamentals,
although the external position in 2015 was moderately stronger than consistent with
fundamentals. They welcomed steps toward an effectively floating exchange rate regime and
encouraged the authorities to build on this progress while carefully managing the transition, and
with the support of a more market-based monetary framework. Directors supported a cautious
approach to capital account liberalization that is carefully sequenced with the progress on
exchange rate flexibility and financial sector reforms.
Directors encouraged the authorities to continue to improve data quality and policy
communications, which would help reduce uncertainty, align expectations, and guard against
market turbulence.
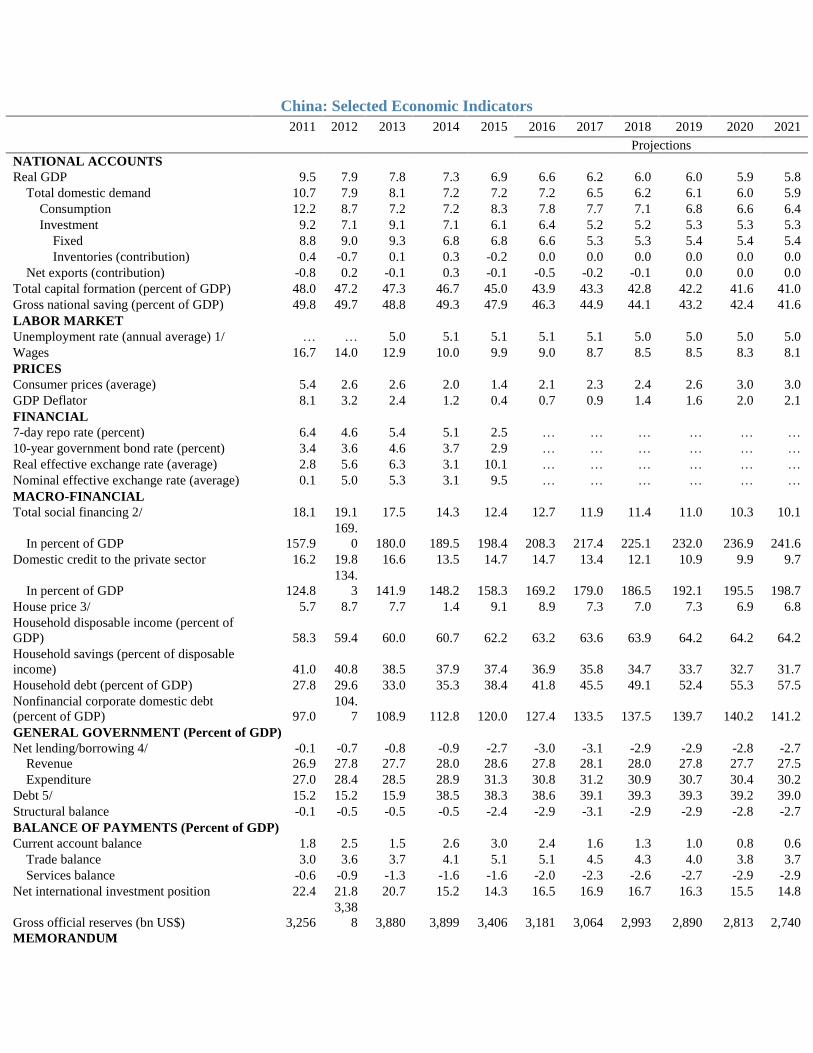
China: Selected Economic Indicators
2011 2012 2013 2014 2015 2016 2017 2018 2019 2020 2021
Projections
NATIONAL ACCOUNTS
Real GDP 9.5 7.9 7.8 7.3 6.9 6.6 6.2 6.0 6.0 5.9 5.8
Total domestic demand 10.7 7.9 8.1 7.2 7.2 7.2 6.5 6.2 6.1 6.0 5.9
Consumption 12.2 8.7 7.2 7.2 8.3 7.8 7.7 7.1 6.8 6.6 6.4
Investment 9.2 7.1 9.1 7.1 6.1 6.4 5.2 5.2 5.3 5.3 5.3
Fixed 8.8 9.0 9.3 6.8 6.8 6.6 5.3 5.3 5.4 5.4 5.4
Inventories (contribution) 0.4 -0.7 0.1 0.3 -0.2 0.0 0.0 0.0 0.0 0.0 0.0
Net exports (contribution) -0.8 0.2 -0.1 0.3 -0.1 -0.5 -0.2 -0.1 0.0 0.0 0.0
Total capital formation (percent of GDP) 48.0 47.2 47.3 46.7 45.0 43.9 43.3 42.8 42.2 41.6 41.0
Gross national saving (percent of GDP) 49.8 49.7 48.8 49.3 47.9 46.3 44.9 44.1 43.2 42.4 41.6
LABOR MARKET
Unemployment rate (annual average) 1/ … … 5.0 5.1 5.1 5.1 5.1 5.0 5.0 5.0 5.0
Wages 16.7 14.0 12.9 10.0 9.9 9.0 8.7 8.5 8.5 8.3 8.1
PRICES
Consumer prices (average) 5.4 2.6 2.6 2.0 1.4 2.1 2.3 2.4 2.6 3.0 3.0
GDP Deflator 8.1 3.2 2.4 1.2 0.4 0.7 0.9 1.4 1.6 2.0 2.1
FINANCIAL
7-day repo rate (percent) 6.4 4.6 5.4 5.1 2.5 … … … … … …
10-year government bond rate (percent) 3.4 3.6 4.6 3.7 2.9 … … … … … …
Real effective exchange rate (average) 2.8 5.6 6.3 3.1 10.1 … … … … … …
Nominal effective exchange rate (average) 0.1 5.0 5.3 3.1 9.5 … … … … … …
MACRO-FINANCIAL
Total social financing 2/ 18.1 19.1 17.5 14.3 12.4 12.7 11.9 11.4 11.0 10.3 10.1
In percent of GDP 157.9
169.
0 180.0 189.5 198.4 208.3 217.4 225.1 232.0 236.9 241.6
Domestic credit to the private sector 16.2 19.8 16.6 13.5 14.7 14.7 13.4 12.1 10.9 9.9 9.7
In percent of GDP 124.8
134.
3 141.9 148.2 158.3 169.2 179.0 186.5 192.1 195.5 198.7
House price 3/ 5.7 8.7 7.7 1.4 9.1 8.9 7.3 7.0 7.3 6.9 6.8
Household disposable income (percent of
GDP) 58.3 59.4 60.0 60.7 62.2 63.2 63.6 63.9 64.2 64.2 64.2
Household savings (percent of disposable
income) 41.0 40.8 38.5 37.9 37.4 36.9 35.8 34.7 33.7 32.7 31.7
Household debt (percent of GDP) 27.8 29.6 33.0 35.3 38.4 41.8 45.5 49.1 52.4 55.3 57.5
Nonfinancial corporate domestic debt
(percent of GDP) 97.0
104.
7 108.9 112.8 120.0 127.4 133.5 137.5 139.7 140.2 141.2
GENERAL GOVERNMENT (Percent of GDP)
Net lending/borrowing 4/ -0.1 -0.7 -0.8 -0.9 -2.7 -3.0 -3.1 -2.9 -2.9 -2.8 -2.7
Revenue 26.9 27.8 27.7 28.0 28.6 27.8 28.1 28.0 27.8 27.7 27.5
Expenditure 27.0 28.4 28.5 28.9 31.3 30.8 31.2 30.9 30.7 30.4 30.2
Debt 5/ 15.2 15.2 15.9 38.5 38.3 38.6 39.1 39.3 39.3 39.2 39.0
Structural balance -0.1 -0.5 -0.5 -0.5 -2.4 -2.9 -3.1 -2.9 -2.9 -2.8 -2.7
BALANCE OF PAYMENTS (Percent of GDP)
Current account balance 1.8 2.5 1.5 2.6 3.0 2.4 1.6 1.3 1.0 0.8 0.6
Trade balance 3.0 3.6 3.7 4.1 5.1 5.1 4.5 4.3 4.0 3.8 3.7
Services balance -0.6 -0.9 -1.3 -1.6 -1.6 -2.0 -2.3 -2.6 -2.7 -2.9 -2.9
Net international investment position 22.4 21.8 20.7 15.2 14.3 16.5 16.9 16.7 16.3 15.5 14.8
Gross official reserves (bn US$) 3,256
3,38
8 3,880 3,899 3,406 3,181 3,064 2,993 2,890 2,813 2,740
MEMORANDUM

Nominal GDP (bn RMB) 6/ 48,604
54,0
99
59,69
6 64,849
69,63
0
74,71
5
80,11
8
86,15
9 92,834
100,24
4
108,2
46
Augmented debt (percent of GDP) 7/ 45.8 47.1 51.0 51.8 55.8 60.4 64.5 67.8 70.4 72.2 73.5
Augmented net lending/borrowing (percent
of GDP) 7/ -6.0 -5.1 -7.6 -7.2 -7.8 -8.4 -8.2 -7.8 -7.4 -7.0 -6.6
Augmented fiscal balance (percent of
GDP) 8/ -8.2 -7.8 -10.3 -9.8 -9.5 -10.1 -9.8 -9.3 -8.8 -8.4 -8.0
Sources: CEIC Data Co., Ltd.; IMF, Information Notice System; and IMF staff estimates and projections.
1/ Surveyed unemployment rate.
2/ After adjusting local government debt swap, staff estimate that TSF stood at 203 percent of GDP in 2015.
3/ Average selling prices estimated by IMF staff based on housing price data (Commodity Building Residential Price) of 70 large and mid-sized
cities published by National Bureau of Statistics (NBS).
4/ Adjustments are made to the authorities' fiscal budgetary balances to reflect consolidated general government balance, including government-
managed funds, state-administered SOE funds, adjustment to the stabilization fund, and social security fund.
5/ Estimates of debt levels before 2015 include central government debt and explicit local government debt (identified by MoF and NPC in Sep
2015). The large increase in general government debt in 2014 reflects the authorities' recognition of the off-budget local government debt borrowed
previously. The estimation of debt levels after 2015 assumes zero off-budget borrowing from 2015 to 2021.
6/ Expenditure side nominal GDP.
7/ Augmented fiscal data expand the perimeter of government to include local government financing vehicles and other off-budget activity.
8/ "Augmented fiscal balance" = "augmented net lending/borrowing" - "net land sales proceeds" (in percent of GDP) as we treat net land sales
proceeds as financing.
PEOPLE’S REPUBLIC OF CHINA STAFF REPORT FOR THE 2016 ARTICLE IV CONSULTATION
KEY ISSUES
Context. China continues its transition to a sustainable growth path. Rebalancing has progressed
on many dimensions, particularly switching from industry to services and from investment to
consumption, but less on reining in rapid credit growth. Reforms have advanced impressively
across a wide domain, but lagged in some critical areas, and the transition to sustainable growth
is proving difficult, with sizable economic and financial volatility. Vulnerabilities are still rising on a
dangerous trajectory and fiscal and foreign exchange buffers, while still adequate, are eroding.
Outlook. The near-term growth outlook has improved due to recent policy support. But the
medium-term outlook is clouded by continued resource misallocation, high and rising corporate
debt, structural excess capacity, and the increasingly large, opaque, and interconnected financial
sector. The apparent challenges in implementing a clear and decisive reform path add to
concerns that China may exhaust its still-sizable buffers before the economy changes course
sufficiently.
Strategy. While the challenges are still manageable, urgent action is needed to ensure they
remain so by reducing vulnerabilities while supporting new, market-based growth. This means
slowing credit growth by tackling its root causes—the pursuit of unsustainably-high growth
targets, soft budget constraints on SOEs and local governments, the web of implicit and explicit
guarantees, and excessive risk taking in parts of the financial sector—while maintaining macro
stability. Key elements:
Tackling the corporate debt problem, with a comprehensive plan and concrete action to
harden budget constraints (especially on SOEs), restructure/liquidate weak firms, recognize
and allocate losses, improve governance, and facilitate market entry.
Adjusting macro policies for a moderate slowdown, by allowing growth to settle at a level
consistent with sustainable macro policies, substantially slowing credit expansion and
switching from off-budget investment to on-budget, pro-reform and pro-consumption fiscal
measures.
Guarding against financial risks, by boosting bank buffers, recognizing losses, improving
funding resilience, reining in risks in shadow banks/products, and improving the supervisory
framework and crisis preparedness.
Continuing progress toward an effectively floating exchange rate regime, combining an
overarching drive toward progressively greater market-determination and skillful short-term
management to avoid excessive volatility.
Strengthening transparency, especially in communications and data quality.
July 7, 2016

PEOPLE’S REPBULIC OF CHINA
2 INTERNATIONAL MONETARY FUND
Approved By Markus Rodlauer and
Alfred Kammer
Discussions took place in Hohhot, Shanghai, and Beijing during
June 1-14. The team comprised J. Daniel (head), S. Guo, J. Kang,
M. Nabar, L. Zhang (all APD), P. Wingender (FAD), J. Caparusso, T.
Harjes (both MCM), G. Gottlieb (SPR), A. Schipke, W. Lam, and S. Chen
(Resident Representatives). Z. Jin and J. Chen (both OED) joined the
official meetings. M. Rodlauer (APD) joined for the second week of the
mission, and FDMD D. Lipton for June 12–14 high-level policy
meetings. D. Ma (COM) coordinated media activities. I. Parry (FAD)
joined for outreach related to the background paper on environment.
T. Law, J. Meng, Q. Shan, J. Li, R. Li, Y. Liu, L. Yee, and J. Yu supported the
mission.
CONTENTS
CONTEXT_________________________________________________________________________________________ 4
OUTLOOK AND RISKS _________________________________________________________________________ 11
SPILLOVERS ____________________________________________________________________________________ 17
POLICIES TO SECURE THE TRANSITION ________________________________________________________ 18
A. Tackling the Corporate Debt Problem _________________________________________________________ 18
B. Accepting the Slowdown ______________________________________________________________________ 21
C. Guarding Against Financial Stability Risks _____________________________________________________ 24
D. Progressing Toward an Effectively-Floating Exchange Rate Regime ___________________________ 26
E. Enhancing Transparency and Communications ________________________________________________ 29
STAFF APPRAISAL _____________________________________________________________________________ 31
BOXES
1. What’s Behind the Import Slowdown? __________________________________________________________ 6
2. Recent Reforms ________________________________________________________________________________ 7
3. How Reliable is China’s Output Data? _________________________________________________________ 30
FIGURES
1. Activity: Slowing Trend, Bumpy ________________________________________________________________ 33
2. Rebalancing: Some Progress __________________________________________________________________ 34
3. Corporate Sector: Rising Stress ________________________________________________________________ 35
4. Credit: Seeking Yield __________________________________________________________________________ 36
5. External Sector: A Reversal of Trends? _________________________________________________________ 37
6. FX and Stock Markets: Pressures Easing? ______________________________________________________ 38
PEOPLE’S REPUBLIC OF CHINA
INTERNATIONAL MONETARY FUND 3
TABLES
1. Selected Economic Indicators _________________________________________________________________ 39
2. Balance of Payments __________________________________________________________________________ 40
3. External Vulnerability Indicators _______________________________________________________________ 41
4. Monetary and Credit Developments ___________________________________________________________ 42
5. General Government Fiscal Data ______________________________________________________________ 43
6. Nonfinancial Sector Debt ______________________________________________________________________ 44
APPENDICES
I. External Sector Report _________________________________________________________________________ 45
II. Debt Sustainability Analysis ___________________________________________________________________ 47
III. Risk Assessment Matrix _______________________________________________________________________ 54
IV. Implementation of Main Recommendations from the 2010–11 FSAP for China ______________ 55

PEOPLE’S REPUBLIC OF CHINA
4 INTERNATIONAL MONETARY FUND
CONTEXT
“The new normal means… a farewell to the unbalanced, uncoordinated and unsustainable growth
model” (Premier Li, 2016). But the transition is proving difficult and bumpy.
Macro and policy developments
1. Activity slowed modestly through early 2016, shored up by accommodative policies,
and rebalancing progressed (see Selected Issues; Figures 1 and 2).
Supply-side indicators. Industrial production has moderated steadily, with a needed rotation from
excess-capacity upstream sectors (cement, steel, glass) to more consumer-oriented manufacturing
(autos, computers, home appliances). Service
sector activity has remained strong, even after
stripping out the outsized contribution from
financial services. Supply rebalancing—the
switch from industry to services—continued its
trend traced over the period of the previous
five-year plan (2011–2015).
Demand-side indicators. Retail sales have
remained strong on the back of steady growth
in household income. Investment has stabilized
following the recovery in real estate in recent
months. Demand rebalancing progressed, with consumption accounting for two-thirds of growth
in 2015 and 2016:Q1.
Inflation remained well anchored. Core inflation has been stable around 1½ percent. Headline CPI
inflation accelerated recently due to food prices. Producer price deflation is still sizable (though
moderated recently), reflecting excess capacity in real estate and heavy industry, and weak
commodity prices.
Policy support. Benchmark lending rates were cut five times in 2015, and in the second half of the
year, fiscal policy turned expansionary, infrastructure spending picked up (supported by policy
bank lending and the local government debt/loan swap), and credit growth accelerated.
External sector. Exports have been subdued, reflecting weak external demand and real exchange
rate appreciation through mid-2015. But import volumes have been weak as well, in line with
slower domestic demand growth (Box 1). Positive terms of trade effects lifted the current account
surplus in 2015 to 3 percent of GDP, but the external accounts came under substantial pressure
due to large capital outflows.
-5
0
5
10
15
20
-5
0
5
10
15
20
10Q1 11Q1 12Q1 13Q1 14Q1 15Q1 16Q1
Net exports
Gross capital formation
Final consumption expenditure
GDP growth (In percent, y/y, RHS)
Rising Consumption Contribution to Growth(In percentage points, yoy contribution)
Sources: CEIC Data Company Ltd.; and IMF staff estimates.

PEOPLE’S REPUBLIC OF CHINA
INTERNATIONAL MONETARY FUND 5
Exchange rate. The real effective rate appreciated by close to 10 percent from mid-2014 through
mid-2015 due to the (then) tight link to the U.S. dollar, and has declined 4½ percent since then.
The renminbi remains broadly in line with fundamentals (Appendix I). Reform progress
2. Reform progress continued on many fronts, especially in improving the monetary and
fiscal frameworks, and supporting urbanization (Box 2).
Monetary framework. Interest rate liberalization
was formally completed and the PBC advanced
toward an interest rate corridor centered on the
seven-day repo rate (see Selected Issues). The
more market-based fixing mechanism for the
RMB in August 2015 and the greater reference
to a currency basket from December 2015 have
allowed more flexibility against the U.S. dollar.
Together, these reforms help move China
towards an independent, market-based,
monetary policy.
Fiscal framework. A wide range of reforms are underway: the new budget law is being
implemented (aimed at improving transparency and accountability of local government finances);
the VAT extension to services was completed; a carbon emission trading scheme (the largest in the
world) will be rolled out nationwide in 2017; social security reforms to unify pension schemes for
urban/rural residents and public/private employees were announced, as was a review of revenue
and spending responsibilities across levels of government (which should help address the large
vertical imbalances that currently limit local governments’ ability to implement social spending
reform).
Urbanization. The government has continued to encourage rural residents to settle in urban
areas—key for boosting productivity through specialization and knowledge spillovers—including
by advancing rural land reforms, allocating basic public education spending to the central budget
and improving the portability of pensions. Several provinces are rolling out a new household
registration system whereby migrants can gradually qualify for basic social welfare and residency
benefits.
Corporate restructuring. The restructuring of unviable “zombie” state-owned enterprises (SOEs) has
begun on a small scale at the local level, led by provinces with relative strength in public finances
and more diverse economic structures.
3. The government adopted a new five-year plan (2016-20), centered on rebalancing the
economy. It aims to boost consumption, expand the service sector, protect the environment, further
open up the economy, expand public services, and reduce poverty. The government has also
announced elements of a reform plan for SOEs and capacity reduction targets in the coal and steel
sectors (10–15 percent of existing capacity over the next 3‒5 years), together with a RMB 100 billion
restructuring fund to re-employ and resettle an expected 1.8 million affected workers. However, in
many areas, especially SOE reform, more details and guidelines are awaited.
0
0.1
0.2
0.3
0.4
0.5
0.6
Jan-15 Apr-15 Jul-15 Oct-15 Jan-16 Apr-16
Std of CFETS Index
Daily Change
Std of CNY/USD Parity Rate
Daily Change
Sources: Bloomberg LP; and IMF staff estimates.
1/ Standard deviation caculated on a 30-business-day forward rolling window.
.
RMB Increasingly Referencing a Basket 1/
PBC's
announcement
of CFETS
basket

PEOPLE’S REPBULIC OF CHINA
6 INTERNATIONAL MONETARY FUND
Box 1. What’s Behind the Import Slowdown? 1/
Chinese imports have slowed significantly over the past two years in real terms. Weaker investment,
partly due to progress in rebalancing from investment to consumption, accounts for about 40–50 percent
of this slowdown. Weaker exports also account for about 40 percent of slowdown, of which about a
quarter is due to stronger RMB.
The sharp decline in nominal imports has been largely due to prices. In 2015, goods imports were
down 9½ percent in RMB nominal terms, mostly driven by lower import prices, of which two thirds is
due to the sharp fall in commodity prices (which alone improves the trade balance by about
1½ percent of GDP). Real imports were up by only 1 percent (compared to about 9 percent on average
over the previous three years), accounting for about half of the deceleration in real imports globally.
The weakness in goods imports is broad based. Machinery and transport imports (accounting for
about 40 percent of total imports) are decelerating as re-export demand is falling and rebalancing
away from investment-based growth continues. Electronics is relatively more resilient. Commodities
(accounting for about 30 percent of total imports) have also decelerated as a result of the slowdown in
industry and weak real estate and infrastructure investment.
Several factors have contributed to the slowdown in real imports. Overall domestic demand has
moderated after the strong surge following the fiscal stimulus in response to the global financial crisis.
The economy is undergoing structural change to a model driven increasingly by consumption, with
lower import intensity than investment and exports. China has also been substituting imports of higher
value-added products with its own production. In addition, sizable currency appreciation has eroded
price competitiveness of exports, and thus lowered demand for processing imports.
Staff analysis finds that weaker investment and
exports have been the key drivers. Estimation for the
post-WTO accession period (2002:Q1–2015:Q3)
suggests that weaker investment has been the main
factor, accounting for about 40–50 percent of the
slowdown over the last two years. Weaker exports also
account for about 40 percent of the slowdown, of which
about a quarter is due to stronger RMB. Substitution of
imported intermediate inputs with domestic production
(“onshoring” measured as the ratio of processing
imports to total exports) has not been an additional
drag over this period but it continues to slow import growth at a constant pace.
–––––––––––––––––––
1/ See J. Kang and W. Liao, IMF Working Paper 16/106.
-10
-5
0
5
10
15
20
06Q1-13Q4 14Q1-15Q3
Dummy & Residuals Onshoring
Exchange rates Exports
Investment Consumption
Constant Imports
Contribution to Import Growth(In percent, year-on-year growth)
Sources: CEIC Data Company Ltd.; and IMF staff estimates.
PEOPLE’S REPUBLIC OF CHINA
INTERNATIONAL MONETARY FUND 7
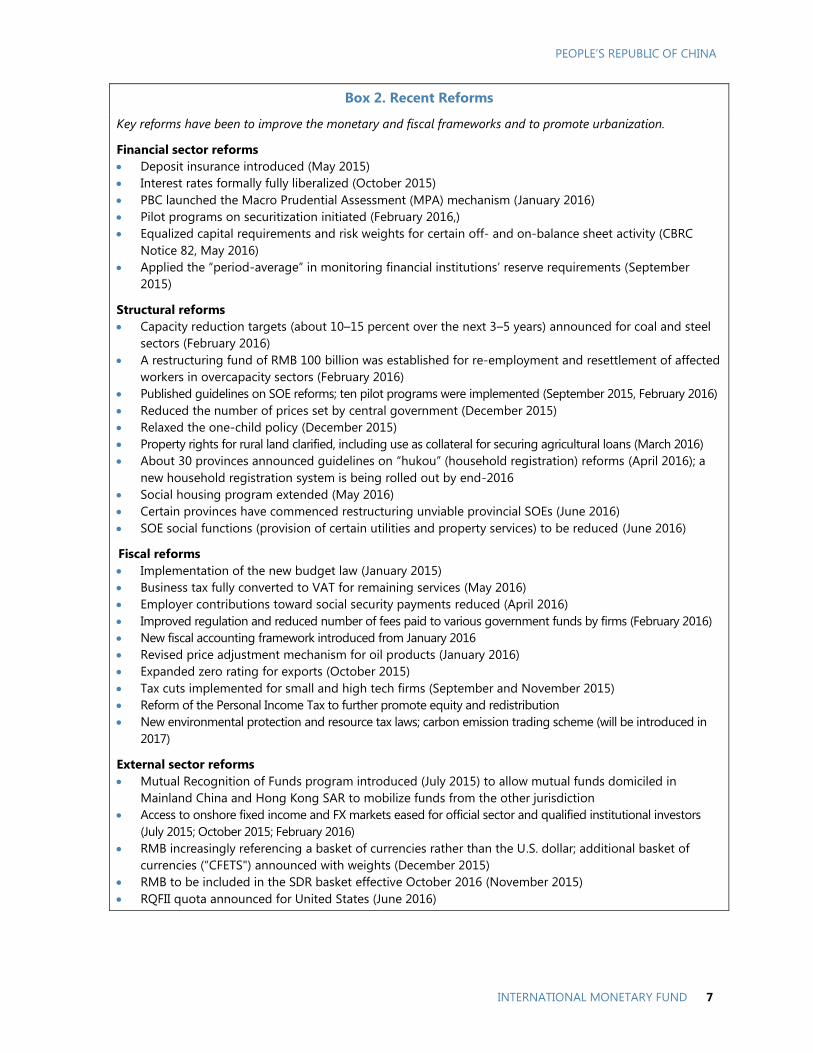
Box 2. Recent Reforms
Key reforms have been to improve the monetary and fiscal frameworks and to promote urbanization.
Financial sector reforms
Deposit insurance introduced (May 2015)
Interest rates formally fully liberalized (October 2015)
PBC launched the Macro Prudential Assessment (MPA) mechanism (January 2016)
Pilot programs on securitization initiated (February 2016,)
Equalized capital requirements and risk weights for certain off- and on-balance sheet activity (CBRC
Notice 82, May 2016)
Applied the “period-average” in monitoring financial institutions’ reserve requirements (September
2015)
Structural reforms
Capacity reduction targets (about 10–15 percent over the next 3–5 years) announced for coal and steel
sectors (February 2016)
A restructuring fund of RMB 100 billion was established for re-employment and resettlement of affected
workers in overcapacity sectors (February 2016)
Published guidelines on SOE reforms; ten pilot programs were implemented (September 2015, February 2016)
Reduced the number of prices set by central government (December 2015)
Relaxed the one-child policy (December 2015)
Property rights for rural land clarified, including use as collateral for securing agricultural loans (March 2016)
About 30 provinces announced guidelines on “hukou” (household registration) reforms (April 2016); a
new household registration system is being rolled out by end-2016
Social housing program extended (May 2016)
Certain provinces have commenced restructuring unviable provincial SOEs (June 2016)
SOE social functions (provision of certain utilities and property services) to be reduced (June 2016)
Fiscal reforms
Implementation of the new budget law (January 2015)
Business tax fully converted to VAT for remaining services (May 2016)
Employer contributions toward social security payments reduced (April 2016)
Improved regulation and reduced number of fees paid to various government funds by firms (February 2016)
New fiscal accounting framework introduced from January 2016
Revised price adjustment mechanism for oil products (January 2016)
Expanded zero rating for exports (October 2015)
Tax cuts implemented for small and high tech firms (September and November 2015)
Reform of the Personal Income Tax to further promote equity and redistribution
New environmental protection and resource tax laws; carbon emission trading scheme (will be introduced in
2017)
External sector reforms
Mutual Recognition of Funds program introduced (July 2015) to allow mutual funds domiciled in
Mainland China and Hong Kong SAR to mobilize funds from the other jurisdiction
Access to onshore fixed income and FX markets eased for official sector and qualified institutional investors
(July 2015; October 2015; February 2016)
RMB increasingly referencing a basket of currencies rather than the U.S. dollar; additional basket of
currencies (“CFETS") announced with weights (December 2015)
RMB to be included in the SDR basket effective October 2016 (November 2015)
RQFII quota announced for United States (June 2016)

PEOPLE’S REPBULIC OF CHINA
8 INTERNATIONAL MONETARY FUND
Policy obstacles
4. While strategic announcements have been in the right direction, obstacles impede
implementation and vulnerabilities are rising.
Traditional stimulus. In response to slowing growth in mid-2015, the government boosted
infrastructure spending, real estate activity and credit, supporting near-term growth but
raising vulnerabilities. It also set a growth target for 2016 of 6½‒7 percent, above staff’s
recommended sustainable range of 6–6½ percent.
Uneven reform progress. A corollary of the focus on near-term growth is less focus on reforms
critical for medium-term growth, but growth detracting in the short term. Progress has been
relatively slow on some key structural reforms, especially strengthening governance and
imposing hard budget constraints for SOEs, tackling excessive corporate debt, and opening
up state-dominated service sectors. As a result, resource misallocation continues.
Lack of policy clarity. Government policy and pronouncements seem to alternate between
prioritizing reform and growth. Some of these difficulties are to be expected, as the transition
from the ‘old growth model’ is complex and politically challenging. In particular, the task of
further liberalizing the economy while disentangling the still-pervasive web of distortions
requires a broad set of well-timed and carefully designed policies and will involve learning-
by-doing along the way. Nevertheless, the seeming lack of consistency at times feeds market
concerns about the commitment to reform (e.g., the heavy-handed response to the equity
market correction in June 2015) and prospects for engineering a smooth transition to
sustainable growth. In part, this reflects inherent tension in an economic strategy that
simultaneously aims to allow the market a “decisive” role in the allocation of resources, yet
also affirms the “dominant” role of the state.
Rising vulnerabilities
‘Hard landing’ in overcapacity sectors/regions. Overcapacity sectors were simultaneously hit
by falling demand from real estate, lower global commodity prices, exchange rate
appreciation, and higher labor costs. The stress is most pronounced in SOEs, where profits
have fallen sharply, and in the north.
0
5
10
15
20
25
10Q1 11Q3 13Q1 14Q3 16Q1
Two-speed Economy(In percent, year-on-year growth)
Nominal growth of
industrial sector
Nominal growth of
services sector
Sources: CEIC Data Company Ltd.; and IMF staff estimates.
Nominal GDP growth
Wide Regional Growth Disparity(In percent, year-on-year growth, 2015)
Sources: CEIC Data Company Ltd.; and IMF staff estimates.
PEOPLE’S REPUBLIC OF CHINA
INTERNATIONAL MONETARY FUND 9
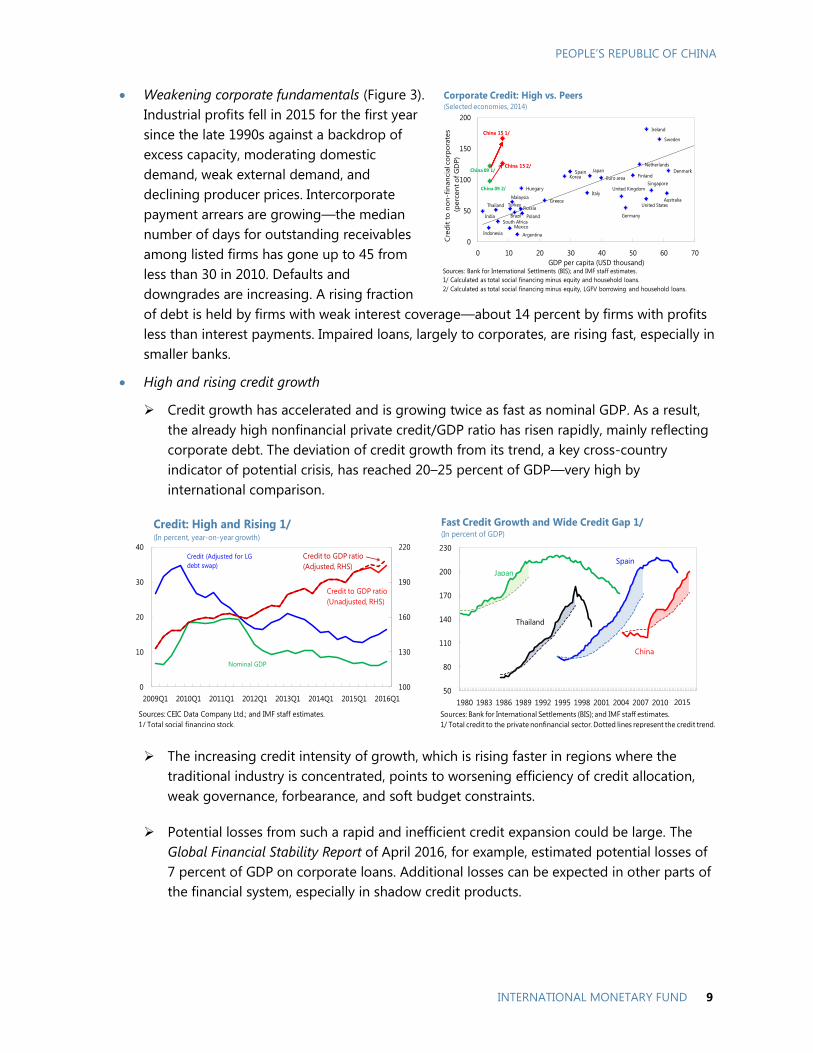
Weakening corporate fundamentals (Figure 3).
Industrial profits fell in 2015 for the first year
since the late 1990s against a backdrop of
excess capacity, moderating domestic
demand, weak external demand, and
declining producer prices. Intercorporate
payment arrears are growing—the median
number of days for outstanding receivables
among listed firms has gone up to 45 from
less than 30 in 2010. Defaults and
downgrades are increasing. A rising fraction
of debt is held by firms with weak interest coverage—about 14 percent by firms with profits
less than interest payments. Impaired loans, largely to corporates, are rising fast, especially in
smaller banks.
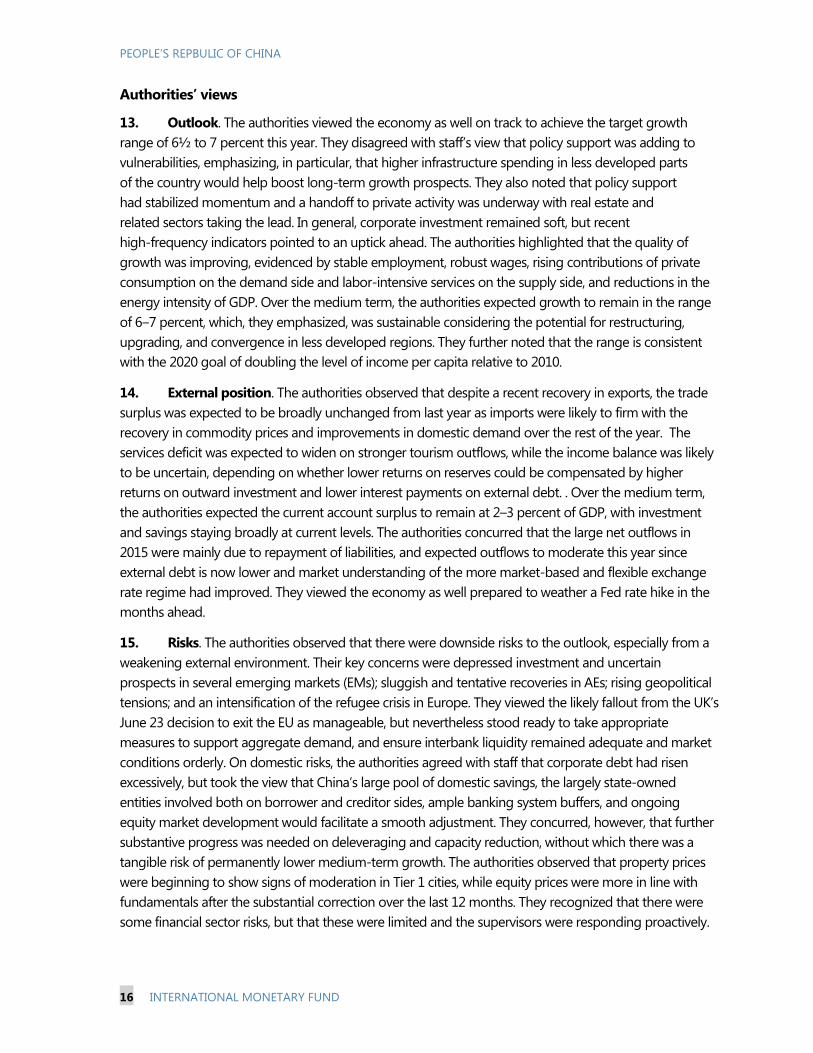
High and rising credit growth
Credit growth has accelerated and is growing twice as fast as nominal GDP. As a result,
the already high nonfinancial private credit/GDP ratio has risen rapidly, mainly reflecting
corporate debt. The deviation of credit growth from its trend, a key cross-country
indicator of potential crisis, has reached 20–25 percent of GDP—very high by
international comparison.
The increasing credit intensity of growth, which is rising faster in regions where the
traditional industry is concentrated, points to worsening efficiency of credit allocation,
weak governance, forbearance, and soft budget constraints.
Potential losses from such a rapid and inefficient credit expansion could be large. The
Global Financial Stability Report of April 2016, for example, estimated potential losses of
7 percent of GDP on corporate loans. Additional losses can be expected in other parts of
the financial system, especially in shadow credit products.
100
130
160
190
220
0
10
20
30
40
2009Q1 2010Q1 2011Q1 2012Q1 2013Q1 2014Q1 2015Q1 2016Q1
Credit (Adjusted for LG
debt swap)
Nominal GDP
Sources: CEIC Data Company Ltd.; and IMF staff estimates.
1/ Total social financing stock.
Credit: High and Rising 1/(In percent, year-on-year growth)
Credit to GDP ratio
(Unadjusted, RHS)
Credit to GDP ratio
(Adjusted, RHS)
50
80
110
140
170
200
230
1980 1983 1986 1989 1992 1995 1998 2001 2004 2007 2010 20132015
Fast Credit Growth and Wide Credit Gap 1/(In percent of GDP)
Japan
Thailand
Spain
Sources: Bank for International Settlements (BIS); and IMF staff estimates.
1/ Total credit to the private nonfinancial sector. Dotted lines represent the credit trend.
China
2015
Argentina
Australia
Brazil
Denmark
Euro area Finland
Germany
Greece
Hungary
India
Indonesia
Ireland
Italy
Japan
Korea
Malaysia
Mexico
Netherlands
Poland
Russia
Singapore
South Africa
Spain
Sweden
Thailand Turkey
United Kingdom
United States
China 15 2/
China 15 1/
0
50
100
150
200
0 10 20 30 40 50 60 70
Cre
dit
to
no
n-f
inan
cia
l co
rpo
rate
s
(perc
en
t o
f G
DP)
GDP per capita (USD thousand)
Corporate Credit: High vs. Peers(Selected economies, 2014)
Sources: Bank for International Settlments (BIS); and IMF staff estimates.
1/ Calculated as total social financing minus equity and household loans.
2/ Calculated as total social financing minus equity, LGFV borrowing and household loans.
China 09 1/
China 09 2/

PEOPLE’S REPBULIC OF CHINA
10 INTERNATIONAL MONETARY FUND
An increasingly large, leveraged, interconnected, and opaque financial system (see Selected
Issues; Figure 4). Behind the rapid credit growth of recent years lies a complex network of
links between banks and nonbanks and a proliferation of investment products. Such
innovation can enhance financial inclusion. But it also reflects regulatory arbitrage, makes it
more difficult for supervisors to identify emerging vulnerabilities, increases the potential for
contagion across market segments, and could amplify financial stress in a downturn. The
growing interconnectedness across asset classes and intermediaries is seen through a variety
of channels:
The sharp increase in bank balance sheets
(by 22 percentage points of GDP in 2015),
particularly the claims on other financial
institutions (up from 5 percent of GDP in
2010 to 26 percent of GDP in 2015), and
off- and on-balance sheet bank exposure
to ‘shadow’ credit products.
The rapid expansion of pledged repo
borrowing in the interbank market, with
trading volume more than doubling in
2015 (mostly overnight lending), as large banks lent to smaller banks and nonbanks
(including securities firms, trust companies, and asset management companies).
The increasing role of smaller and
provincial banks, especially city
commercial banks, which have greater
exposure to shadow credit products and
have grown rapidly.
A propensity for asset price booms. China has
recently experienced a sequence of booms in
various asset prices—property, equity and
bonds. This propensity is a symptom of a large
stock of savings searching for yield, rising
0
1
2
3
4
1993 1995 1997 1999 2001 2003 2005 2007 2009 2011 2013 2015
Sources: CEIC Data Company Ltd.; and World Economic Outlook (WEO) and IMF staff estimates.
1/ Plotted as 3-year rolling average.
Pre-crisis average
Post-crisis average
Credit Intensity Rising Further 1/(New credit per unit of additional GDP)
-25
-10
5
20
35
50
65
-25
-10
5
20
35
50
65
2008 2009 2010 2011 2012 2013 2014 2015 2016
Booming Tier 1 House Prices(In percent, year-on-year growth, 3mma)
May-16
Tier I
Tier II
NBS: Floor space selling price
Tier III or IV
Sources: Fangguanju; and IMF staff estimates.
180
200
220
240
260
280
300
320
-20
0
20
40
07 08 09 10 11 12 13 14 15
Foreign and reserve assets Claims on government and central bank
Claims on other depository corporations Claims on other finanical institutions
Claims on nonfinanical institutions Claims on other residential sectors
Other assets Total assets
Commercial Bank Balance Sheets Expanding Rapidly(In percentage points of GDP, year-on-year growth)
Sources: Haver Analytics; and IMF staff estimates.
Total assets (stock, % of GDP, RHS)
-5
5
15
25
-5 0 5 10 15 20 25
Credit Increasingly Outpacing GDP Growth In Most Provinces(Differential between year-on-year growth rates of credit and GDP, by province)
Sources: CEIC Data Company Ltd.; and IMF staff estimates.
Average during 2011Q1-2013Q4
Avera
ge d
uri
ng
20
14
Q1
-20
16
Q1
Least-developed provinces Northeastprovinces (Traditional state industrial base)
Middle provinces Coastal provinces
Differential widening
over time
Differential narrowing
over time

PEOPLE’S REPUBLIC OF CHINA
INTERNATIONAL MONETARY FUND 11
leverage, and a belief that the web of implicit guarantees will limit losses. This distorts the
pricing of risk and facilitates bouts of speculative excess. Most recently, Tier-1 cities such as
Shenzhen, Shanghai, and Beijing, are seeing large housing price increases as bank lending for
home purchases increased strongly.
Capital outflows. Despite an external position moderately stronger than fundamentals
(Figures 5 and 6), capital outflows in 2015 and early 2016 were in excess of the current
account surplus, prompting a substantial fall in FX reserves. The degree of outflows suggests
a de facto more porous capital account than de jure restrictions would suggest. Several factors
appear behind these outflows (see Selected Issues), including:
A shift in expectations about relative near-term returns on RMB assets, as domestic rate
cuts, higher FX volatility, and the approaching Fed liftoff reduced the attractiveness of the
carry trade. Many investors and market analysts expected the growth slowdown last year
to trigger progressive policy easing and, eventually, RMB depreciation—an expectation
seemingly reinforced by the August 2015 change in the exchange rate system.
Rising investor concerns about the growth outlook, near and longer term. Some also
questioned China’s longer-term growth prospects amidst doubts about the government’s
ability to carry out the reform agenda. Such concerns may explain, in part, the surge in
outward investment during the last year.
OUTLOOK AND RISKS
In staff’s baseline growth falls to about 6 percent by 2018 and continues declining thereafter. The lack of
decisive progress on addressing corporate debt and governance in SOEs in the baseline implies that the
credit-to-GDP ratio continues to rise, with increasing risk of a disruptive adjustment. The baseline does,
however, assume continued pro-consumption and pro-service reforms, including strengthening the social
safety net and deregulating the service sector; as a result, the structure of demand and production would
shift further toward consumption and services.
5. Near-term growth. The economy is expected to grow by 6.6 percent in 2016, slowing to
6.2 percent in 2017. This assumes:
Domestic demand holds up on generally robust labor market conditions, with consumption
contributing more than half of overall growth. Investment growth is expected to pick up slightly in
2016—as strong infrastructure spending and a rebound in real estate and SOE investment offset
weakness in manufacturing and non-SOE investment—but to moderate in 2017 as stimulus
measures wane.
External demand is expected to remain subdued, with net exports dragging growth in 2016‒17.
Export growth will stay tepid, while imports are likely to pick up in line with investment.
Policy support provides a positive fiscal impulse in 2016, returning to gradual consolidation in
2017. The projection assumes a slightly higher ‘augmented’ deficit relative to last year, resulting

PEOPLE’S REPBULIC OF CHINA
12 INTERNATIONAL MONETARY FUND
from a larger on-budget deficit as well as slightly stronger off-budget local government
spending supported through policy bank lending and the new special construction fund
(Appendix II).1
Credit growth is assumed at 15 percent year-on-year in 2016, based on the authorities’ total
social financing (TSF) projection and staff adjustments for local government debt/loan
swaps.2 In 2017, credit growth is assumed to slow to 13 percent as investment growth
moderates and corporate profitability improves with the pick-up in producer price inflation
and progress in reducing overcapacity.
6. Inflation is expected to gradually pick up reflecting the rebound in commodity prices,
the exchange rate depreciation since mid-2015, and progress in cutting overcapacity, but to
remain contained at 2–2½ this year and next. Over the medium term, inflation is expected to rise
gradually to around 3 percent as commodity prices recover and wage pressures build with the
slower growth of the labor force.
7. Current Account. The current account surplus is expected to narrow to just under
2½ percent of GDP in 2016, driven by an increase in the services and income deficit.
The trade surplus is projected to remain stable in 2016 at slightly over 5 percent of GDP, with
terms of trade effects broadly offsetting the pick-up in imports. Over the medium term, as
the economy rotates further toward private consumption and away from external demand,
the trade surplus is expected to decline to below 4 percent of GDP. The services deficit is
expected to continually rise with healthy outward tourism, while the income deficit is
expected to remain broadly stable.
Over the medium term, the current account surplus is expected to fall to around ½ percent
of GDP by 2021. Savings are projected to decline from 48 percent of GDP in 2015 to around
42 percent by 2021. This reflects an expected fall in household savings, owing to
demographic effects and a stronger social safety net, lower corporate savings as factor costs
rise and efficiency diminishes, and a decline in public savings as social spending increases.
Investment is expected to decline from 45 percent of GDP in 2015 to around 41 percent of
GDP by 2021, reflecting both moderating private investment, as returns diminish in a slowing
economy, and less excess in public investment.
8. Capital flows. The volume of capital outflows is expected to be broadly similar to last
year as a percent of GDP. The large outflow seen in 2015:Q3–2016:Q1 will gradually moderate as
the pressure from external debt repayment peters out. The secular trend of residents’ acquisition
1 See IMF Working Paper 14/4 for an explanation of augmented deficit and debt:
http://www.imf.org/external/pubs/cat/longres.aspx?sk=41204.0.
2 Under the new budget law, around RMB 14 trillion of existing local government financing vehicle (LGFV)
borrowing has been recognized as explicit local government debt, of which nearly a quarter has already been
swapped into LG bonds. Since the swapped portion is no longer counted in TSF, the reported TSF growth
underestimates credit growth. Staff adjust the official TSF statistics for this swapped amount to correct the
underestimate. Unadjusted for this swap, TSF is projected to grow by 12.7 percent in 2016.

PEOPLE’S REPUBLIC OF CHINA
INTERNATIONAL MONETARY FUND 13
of foreign assets to balance their investment portfolio is expected to continue, but not materially
accelerate from current levels.
9. Rebalancing. The high national savings rate, the crux of China’s internal and external
imbalance, is expected to fall gradually due to aging and a stronger social safety net. Household
consumption is expected to continue to pick up on the back of falling household savings and
rising disposable income, which, in turn, derives from labor-intensive services increasingly
replacing industry as the main fulcrum of activity on the supply side (which should also reduce
the carbon intensity of output and income inequality). But the baseline assumes only modest
progress on corporate restructuring and SOE reform; hence credit rebalancing is projected to
progress only slowly.
10. Medium-term growth prospects. The near-term reliance on policy easing and
credit-financed investment, and the lack of decisive progress on addressing corporate debt
restructuring, SOE reform, and entry of dynamic private firms is expected to add to the existing
stock of vulnerabilities and worsen resource allocation. The price of achieving stronger near-term
growth in this way is that the economy will likely encounter further diminishing returns, slowing to
6 percent by 2018 and declining further into the medium term. In particular, the credit intensity of
growth is projected to decrease only modestly, resulting in a continuously rising nonfinancial private
sector credit/GDP ratio. This gives rise to an increasing risk of disruptive adjustment (banking crisis
and/or sharply slower growth), as credit booms often have in other countries.
11. Despite the relatively benign near-term outlook, downside risks dominate
(Appendix III).
Downside:
Near term: the key risks are a loss of
investor confidence, disorderly corporate
defaults, a sharp fall in asset prices, and a
quicker fading of the stimulus impact.
With high leverage, corporates are
especially sensitive to declines in
profitability and higher borrowing costs
(but less so to FX risk given low aggregate
0
10
20
30
40
30
40
50
60
70
2001 2003 2005 2007 2009 2011 2013 2015 2017 2019
Source: IMF staff estimates and projections.
Disposable income
Private consumption
Consumption growing, but slowly
Household saving
(RHS)
Consumption Share to Rise...(In percent of GDP)
0
10
20
30
40
50
60
2000 2003 2006 2009 2012 2015 2018 2021
... and Services(In percent of total employment)
Sources: CEIC Data Company Ltd.; and IMF staff estimates and projections.
Primary industry
Tertiary industry
Secondary industry
United Kingdom
BelgiumDenmark
Italy
NorwaySweden
Finland
Greece
Ireland
Portugal
Spain
Argentina
Brazil
Uruguay
UruguayMalaysia
Philippines
Thailand
0
20
40
60
80
-10 -8 -6 -4 -2 0 2 4Cre
dit
-to
-GD
P rati
o c
han
ge in
fiv
e y
ears
GDP growth change 1/
Followed by banking crisis
Credit Booms Tend to End Badly(In percentage points)
Source: IMF staff estimates.
1/ Average growth differential between 5-year post-boom and 5-year pre-boom periods.
2/ No growth change as China's boom has not ended.
China 2/

PEOPLE’S REPBULIC OF CHINA
14 INTERNATIONAL MONETARY FUND
FX exposure). These could be amplified by the financial system, with renewed capital
outflows and exchange rate pressure.
Medium term: the key risk is slow progress on reform and continued reliance on policy
stimulus and unsustainable credit growth, which would add to vulnerabilities, worsen
resource misallocation, and lead to permanently lower growth. While near-term growth
will be temporarily boosted, medium-term growth would continuously fall under an
illustrative “no-reform” scenario, reflecting a sustained TFP growth slowdown. The
nonfinancial private credit/GDP ratio would rise significantly higher than under the
baseline, as would the risk of a disruptive adjustment.
UK / European Union. The direct impact of UK voters’ June 23 decision to exit the European
Union (EU) is likely to be limited (for example, the UK accounts for 2½ percent of China’s
exports). However, should growth in the EU be affected significantly, the adverse effect
on China could be material (exports to the
EU, including those routed via Hong Kong
SAR, are equivalent to almost 4 percent of
China’s GDP). Staff estimates suggest that a
1 percentage point growth slowdown in the
EU is associated with a reduction in
Chinese growth by about 0.3 percentage
points. Financial spillovers are also expected
to be contained, given the modest direct
financial exposures to the EU and the
authorities’ readiness to respond.
Upside:
Near term: the stimulus may have a bigger and more sustained impact, with a larger
pick-up in real estate and a slower reduction in overcapacity investment (though this
would increase medium-term risks).
Medium term: Faster progress on enacting structural reform (especially SOE reform),
curbing credit growth, and improving overall resource efficiency would lift medium-term
growth prospects. Under an illustrative “proactive” scenario, near-term growth could dip
to 6 percent reflecting the faster adjustment partially offset by high-quality fiscal support
(without such support, growth would fall to about 5½ percent), while medium-term
growth would rise to 6½ percent driven by higher TFP growth. The improved efficiency
would reduce credit intensity further, and stabilize the nonfinancial private debt/GDP
ratio by 2021 significantly lower compared to the baseline. The pace of rebalancing from
investment to consumption would also be faster.
0
2
4
Trade Resident banks
Sources: CEIC Data Company Ltd.; and IMF staff estimates.
Brexit: Limited Direct Exposure(In percent of Chinese GDP)
UK
EU (Including
trade via Hong
Kong SAR)
UK
EU

PEOPLE’S REPUBLIC OF CHINA
INTERNATIONAL MONETARY FUND 15
Explaining the “Fan” in the Illustrative Growth Scenarios Graphic
In the no-reform growth scenario (left chart), the upper bound of the “fan” is the growth rate
absent a disruptive adjustment. The lower bound is growth in an illustrative disruptive adjustment
simulated by staff, adjusted by the probability of such an event.
The probability of the disruptive adjustment is derived from cross-country evidence linking
disruptive adjustments to the size and duration of credit booms (Dell’Ariccia and others, 2016).
The baseline, and especially the “proactive” reform scenario, would have lower risk, but still
significant given the growing credit/GDP ratio even under these scenarios.
12. Buffers, while still adequate, are shrinking fast, calling for urgent action to address
these rising risks. China used around 20 percent of its FX reserves (relative to the mid-2014 peak) in
supporting the currency, but the buffer remains above reserve adequacy metrics. Similarly, despite
high public spending on infrastructure in recent years, augmented general government debt
(i.e., including contingent liabilities from estimated off-budget local government borrowing) remains
relatively low at around 60 percent of GDP and explicitly recognized general government debt at only
about 40 percent of GDP, with a highly favorable growth-interest rate differential. These buffers have
been deployed to combat outflow pressure and support growth over the past several months. But as
vulnerabilities grow, contingent liabilities expand, and the buffers erode, the window for reforms and
preventing downside risks from materializing will close.
2
3
4
5
6
7
8
2012 2015 2018 2021
GDP Growth: Illustrative Scenarios(In percent, year-on-year growth)
Sources: CEIC Data Company Ltd.; and IMF staff estimates.
Projection range
ProactiveNo-reform
Baseline
140
170
200
230
2014 2015 2016 2017 2018 2019 2020 2021
Credit Ratio: Illustrative Scenarios 1/(In percent of GDP)
Sources: CEIC Data Company Ltd.; World Economic Outlook (WEO) and IMF staff estimates.
1/ Nonfinancial private debt, calculated as total social financing stock adjusted for local
governemnt debt swap minus equity financing and LGFV borrowings.
No-reform
Proactive
Baseline
43
31
65
11 0
10
20
30
40
50
60
70
0
10
20
30
40
50
60
70
China 2015 1/ EM 25th percentile EM 75th percentile
Gross Government Debt ...Not High(In percent of GDP)
Sources: World Economic Outlook (WEO); and IMF staff estimates.
1/ Including all explicit government (central and local) liabilities and part of the contingent
liabilities that the government might be responsible for.
190
75
118
94
10
40
80
120
160
200
0
40
80
120
160
200
Reserves Still Adequate(In percent of IMF Reserve Adequacy Metric)
Sources: Assessing Reserve Adequacy; IMF Policy Papers; February 14, 2011.
2015Q4 EM Average
(ex China)
2015Q4 EM Average
(ex China)
Fixed With Capital Controls Fixed Without Capital Controls
PEOPLE’S REPBULIC OF CHINA
16 INTERNATIONAL MONETARY FUND
Authorities’ views
13. Outlook. The authorities viewed the economy as well on track to achieve the target growth
range of 6½ to 7 percent this year. They disagreed with staff’s view that policy support was adding to
vulnerabilities, emphasizing, in particular, that higher infrastructure spending in less developed parts
of the country would help boost long-term growth prospects. They also noted that policy support
had stabilized momentum and a handoff to private activity was underway with real estate and
related sectors taking the lead. In general, corporate investment remained soft, but recent
high-frequency indicators pointed to an uptick ahead. The authorities highlighted that the quality of
growth was improving, evidenced by stable employment, robust wages, rising contributions of private
consumption on the demand side and labor-intensive services on the supply side, and reductions in the
energy intensity of GDP. Over the medium term, the authorities expected growth to remain in the range
of 6‒7 percent, which, they emphasized, was sustainable considering the potential for restructuring,
upgrading, and convergence in less developed regions. They further noted that the range is consistent
with the 2020 goal of doubling the level of income per capita relative to 2010.
14. External position. The authorities observed that despite a recent recovery in exports, the trade
surplus was expected to be broadly unchanged from last year as imports were likely to firm with the
recovery in commodity prices and improvements in domestic demand over the rest of the year. The
services deficit was expected to widen on stronger tourism outflows, while the income balance was likely
to be uncertain, depending on whether lower returns on reserves could be compensated by higher
returns on outward investment and lower interest payments on external debt. . Over the medium term,
the authorities expected the current account surplus to remain at 2–3 percent of GDP, with investment
and savings staying broadly at current levels. The authorities concurred that the large net outflows in
2015 were mainly due to repayment of liabilities, and expected outflows to moderate this year since
external debt is now lower and market understanding of the more market-based and flexible exchange
rate regime had improved. They viewed the economy as well prepared to weather a Fed rate hike in the
months ahead.
15. Risks. The authorities observed that there were downside risks to the outlook, especially from a
weakening external environment. Their key concerns were depressed investment and uncertain
prospects in several emerging markets (EMs); sluggish and tentative recoveries in AEs; rising geopolitical
tensions; and an intensification of the refugee crisis in Europe. They viewed the likely fallout from the UK’s
June 23 decision to exit the EU as manageable, but nevertheless stood ready to take appropriate
measures to support aggregate demand, and ensure interbank liquidity remained adequate and market
conditions orderly. On domestic risks, the authorities agreed with staff that corporate debt had risen
excessively, but took the view that China’s large pool of domestic savings, the largely state-owned
entities involved both on borrower and creditor sides, ample banking system buffers, and ongoing
equity market development would facilitate a smooth adjustment. They concurred, however, that further
substantive progress was needed on deleveraging and capacity reduction, without which there was a
tangible risk of permanently lower medium-term growth. The authorities observed that property prices
were beginning to show signs of moderation in Tier 1 cities, while equity prices were more in line with
fundamentals after the substantial correction over the last 12 months. They recognized that there were
some financial sector risks, but that these were limited and the supervisors were responding proactively.

PEOPLE’S REPUBLIC OF CHINA
INTERNATIONAL MONETARY FUND 17
SPILLOVERS
16. China’s transition will be positive overall for the global economy, but continue to
produce large spillovers that vary by country/region.
China will continue to drive global growth
during its transition. Despite its growth
slowing, China doubled its real GDP since
2009, thus continuing to account for about a
third of global growth in 2015 (more than it
did in 2010 when China was growing in double
digits).
Sustained progress on reforms and reining-in
of vulnerabilities will reduce downside risks,
thereby boosting sentiment and lifting
investment in trading partners. The announced capacity reductions in coal and steel, if
implemented, could also have a sizable effect on global capacity (e.g., the envisaged cuts in steel
capacity over the next 3–5 years are broadly equivalent to recent annual steel output of the
world’s second-largest producer, Japan).
The counterfactual to China’s transition is not everlasting, investment/import-intensive,
double-digit growth, but much slower growth, and possibly a sharp slowdown, which would have
much more significant negative spillovers.
17. The evolution of China’s production mix is already creating opportunities for frontier
and developing economies. Staff analysis shows that China’s movement up the value chain with its
wages rising has led China to exit some lower-end, more labor-intensive sectors. This trend is creating
opportunities for frontier and developing economies, particularly in Asia (e.g., Cambodia, Lao P.D.R,
Myanmar, and Vietnam) to enter those sectors and to satisfy rising Chinese consumption demand.
18. That said, developments in China’s will continue to produce large global spillovers,
some of which will be negative for some countries/regions.
Spillovers through trade. Economies most
adversely affected by trade spillovers are
those that have been closely integrated with
China through the global value chain, such as
Korea, Malaysia, and Taiwan Province of
China, as these economies are heavily
exposed to China’s investment activity. In
contrast, New Zealand will be least negatively
affected, as its exports to China will benefit
from the increase in China’s consumption
demand. Staff analysis (April 2016 World
Economic Outlook) suggests that a 1 percentage point investment-driven drop in China’s output
-2
0
2
4
6
2000 2003 2006 2009 2012 2015
China United States
Japan Euro area
Rest of World World
Contribution to Global Growth: Still Large(In percentage points)
Sources: World Economic Outlook (WEO); and IMF staff estimates.

PEOPLE’S REPBULIC OF CHINA
18 INTERNATIONAL MONETARY FUND
growth would reduce G20 growth by ¼ percentage point.
Spillovers through commodity prices. China is a major importer across a range of commodities,
especially metals, where it accounted for about 40 percent of global demand in 2014. China’s
investment slowdown has had a significant impact on the demand for, and prices of, commodities
closely related to investment activities. Staff analysis suggests that China’s rebalancing might
account for between a fifth and a half of the declines in broad commodity price indices, with
marked difference across commodities.
Spillovers through financial markets. Financial spillovers from China have increased, in particular
since the global financial crisis, magnified by direct trade exposures. Staff analysis suggests that
purely financial contagion effects remain less significant, but the impact of shocks to economic
fundamentals, such as news about China’s growth, on equity returns in both emerging market and
advanced economies has been rising. Over the past year, for example, China has likely transmitted
more shocks to other countries than it has received (see Selected Issues).
Overall, countries most heavily exposed to China’s growth slowdown are those within the Asian
regional supply chain and heavy commodity and machinery exporters.
Authorities’ views
19. The authorities acknowledged that the needed slowdown in heavy industrial sectors in China
could have transitional negative effects on commodity prices and trading partners’ growth, but that
this adjustment, by placing China on a sustainable growth path, would benefit the global economy in
the long run. The authorities agreed that financial spillovers from China appeared to be rising, but
cautioned that establishing a causal relationship was difficult. Several other factors have contributed to
global risk-off episodes in recent years, including general weakness in EMs and uncertainty about
the direction of unconventional monetary policy stances in AEs. The authorities also observed that
negative interest rate policies in some advanced economies appeared to have hurt prospects for bank
profitability, at times adding to pressure on equity prices and fueling contagion effects in international
markets.
POLICIES TO SECURE THE TRANSITION
Preventing downside risks and ensuring the transition to more robust, sustainable medium-term growth
requires decisively implementing a proactive and comprehensive policy package. The challenge for
policymakers will be to focus less on traditional investment stimulus to support short-term growth, and
more on fostering a well-regulated, consumer-oriented private sector to generate stronger, and more
sustainable, growth in the medium term.
A. Tackling the Corporate Debt Problem
20. International experience, including China’s own in the 1990s, suggests that tackling a
systemic corporate debt problem requires a comprehensive approach. Without this, individual
initiatives, like debt-equity conversions, will likely fail. The strategy outlined below cuts across topics
PEOPLE’S REPUBLIC OF CHINA
INTERNATIONAL MONETARY FUND 19
and government agencies, affects swathes of people, firms, cities, banks, investors, and regions, and
requires politically challenging decisions. There may thus be merit in establishing a well-staffed,
high-level group with a clear mandate for policy formulation and communication. Progress should be
kick-started in the next few months with a few high-profile pilot restructurings/liquidations of weak
SOEs in more dynamic regions where it is relatively easier for displaced workers to find new
employment, building on the plans for “zombie” company exits already underway in a few provinces
(see Selected Issues). Key elements include:
21. High-level decision. Upfront and most importantly, a high-level decision is needed to
stop financing weak firms, strengthen corporate governance, mitigate social costs, and accept
the likely lower growth. This decision should be reflected in the coordinated action of all involved
public bodies, especially SOEs, local governments, and financial supervisors.
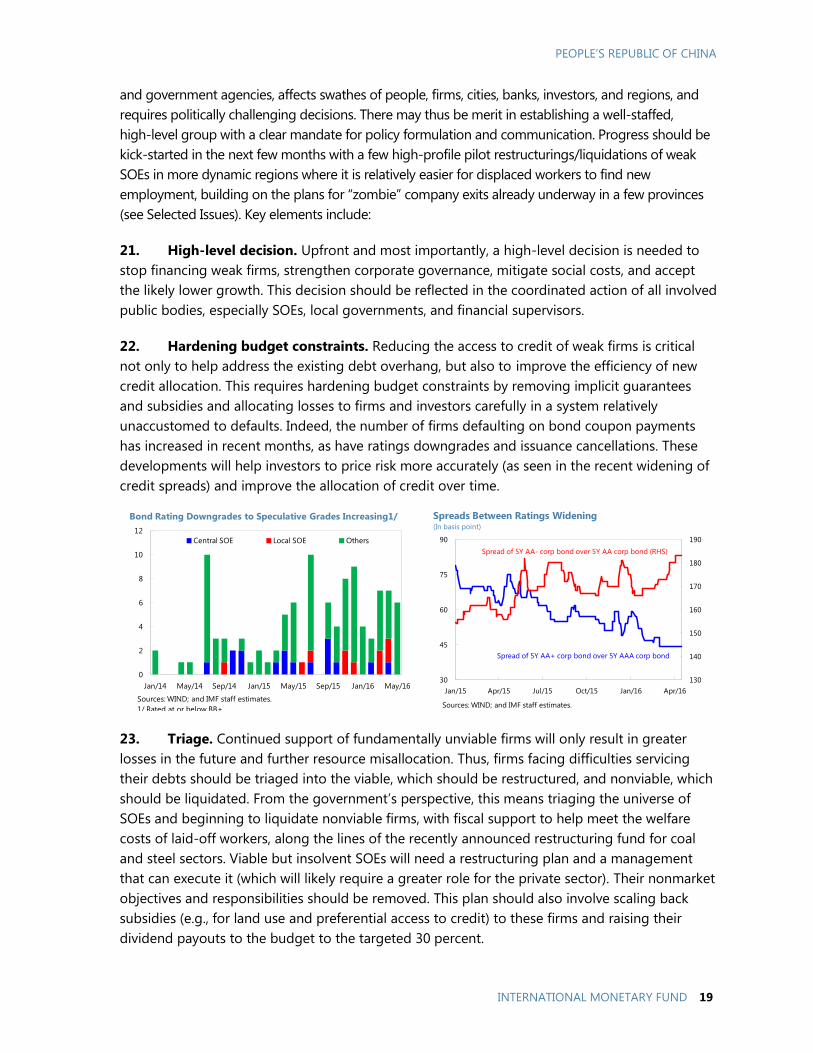
22. Hardening budget constraints. Reducing the access to credit of weak firms is critical
not only to help address the existing debt overhang, but also to improve the efficiency of new
credit allocation. This requires hardening budget constraints by removing implicit guarantees
and subsidies and allocating losses to firms and investors carefully in a system relatively
unaccustomed to defaults. Indeed, the number of firms defaulting on bond coupon payments
has increased in recent months, as have ratings downgrades and issuance cancellations. These
developments will help investors to price risk more accurately (as seen in the recent widening of
credit spreads) and improve the allocation of credit over time.
23. Triage. Continued support of fundamentally unviable firms will only result in greater
losses in the future and further resource misallocation. Thus, firms facing difficulties servicing
their debts should be triaged into the viable, which should be restructured, and nonviable, which
should be liquidated. From the government’s perspective, this means triaging the universe of
SOEs and beginning to liquidate nonviable firms, with fiscal support to help meet the welfare
costs of laid-off workers, along the lines of the recently announced restructuring fund for coal
and steel sectors. Viable but insolvent SOEs will need a restructuring plan and a management
that can execute it (which will likely require a greater role for the private sector). Their nonmarket
objectives and responsibilities should be removed. This plan should also involve scaling back
subsidies (e.g., for land use and preferential access to credit) to these firms and raising their
dividend payouts to the budget to the targeted 30 percent.
0
2
4
6
8
10
12
Jan/14 May/14 Sep/14 Jan/15 May/15 Sep/15 Jan/16 May/16
Central SOE Local SOE Others
Sources: WIND; and IMF staff estimates.
1/ Rated at or below BB+.
Bond Rating Downgrades to Speculative Grades Increasing1/
130
140
150
160
170
180
190
30
45
60
75
90
Jan/15 Apr/15 Jul/15 Oct/15 Jan/16 Apr/16
Sources: WIND; and IMF staff estimates.
Spreads Between Ratings Widening(In basis point)
Spread of 5Y AA- corp bond over 5Y AA corp bond (RHS)
Spread of 5Y AA+ corp bond over 5Y AAA corp bond
PEOPLE’S REPBULIC OF CHINA
20 INTERNATIONAL MONETARY FUND
24. Loss recognition. Regulatory and supervisory oversight should require banks proactively
to recognize and manage impaired assets. Critical policies include loan classification and
provisioning; bank capital; collateral valuation; prudential reporting; and a supervisory review
approach fostering proactive NPL resolution (restructuring, write off, or sale). Asset quality
recognition standards should be applied equally to loans and to securities whose underlying
assets embody credit or market risk, and encompass both banks and nonbank financial
institutions. Once losses are recognized, techniques such as debt-equity conversions, NPL
securitization, and sales to AMCs, can be useful to workout impaired assets, if nested in a
comprehensive strategy and with the right design.3
25. Burden sharing. Recognizing the full extent of impaired assets will likely result in
significant losses. A plan to allocate these losses, taking into account appropriate hierarchy of
claims among banks, corporates, and investors, and if necessary backstop them with government
funds, will be critical. This in turn calls for an active role for the state, which China is well placed
to undertake.
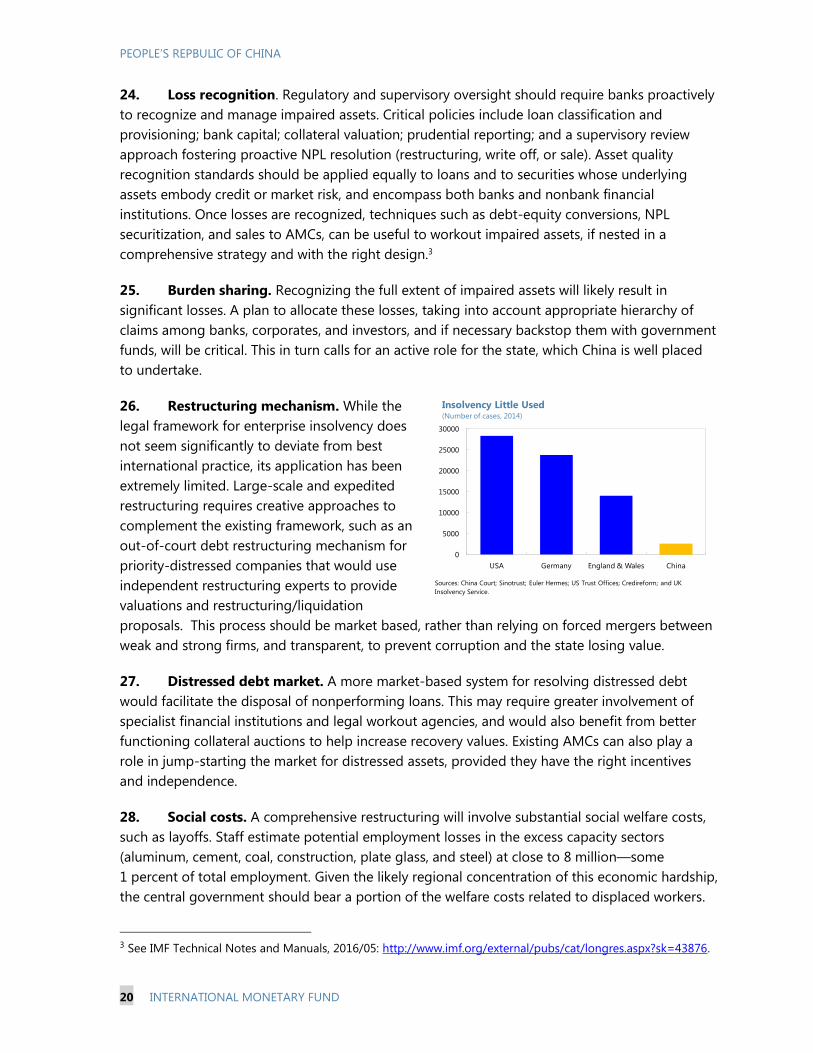
26. Restructuring mechanism. While the
legal framework for enterprise insolvency does
not seem significantly to deviate from best
international practice, its application has been
extremely limited. Large-scale and expedited
restructuring requires creative approaches to
complement the existing framework, such as an
out-of-court debt restructuring mechanism for
priority-distressed companies that would use
independent restructuring experts to provide
valuations and restructuring/liquidation
proposals. This process should be market based, rather than relying on forced mergers between
weak and strong firms, and transparent, to prevent corruption and the state losing value.
27. Distressed debt market. A more market-based system for resolving distressed debt
would facilitate the disposal of nonperforming loans. This may require greater involvement of
specialist financial institutions and legal workout agencies, and would also benefit from better
functioning collateral auctions to help increase recovery values. Existing AMCs can also play a
role in jump-starting the market for distressed assets, provided they have the right incentives
and independence.
28. Social costs. A comprehensive restructuring will involve substantial social welfare costs,
such as layoffs. Staff estimate potential employment losses in the excess capacity sectors
(aluminum, cement, coal, construction, plate glass, and steel) at close to 8 million—some
1 percent of total employment. Given the likely regional concentration of this economic hardship,
the central government should bear a portion of the welfare costs related to displaced workers.
3 See IMF Technical Notes and Manuals, 2016/05: http://www.imf.org/external/pubs/cat/longres.aspx?sk=43876.
0
5000
10000
15000
20000
25000
30000
USA Germany England & Wales China
Insolvency Little Used(Number of cases, 2014)
Sources: China Court; Sinotrust; Euler Hermes; US Trust Offices; Credireform; and UK
Insolvency Service.

PEOPLE’S REPUBLIC OF CHINA
INTERNATIONAL MONETARY FUND 21
The costs of structural unemployment and worker resettlement are best borne by targeted
assistance through earmarked funds to complement existing local social security programs, such
as with the RMB 100 billion Restructuring Fund for the coal and steel sectors.
29. Facilitating market entry. Improving resource allocation is not just about the exit of
nonviable firms, but equally the entry of dynamic private firms. Where possible, markets
should be made more contestable by lowering barriers to entry for potential competitors and
dismantling monopolies, for instance in services (especially telecommunications and healthcare)
and utilities (electricity, gas, and water). The recently announced SOE reform strategy has
underscored some of these elements—the key is to follow through with decisive
implementation (see Selected Issues).
Authorities’ views
30. The authorities emphasized that the key focus areas in the 13th Five Year Plan—drawn up
keeping in mind corporate debt-related vulnerabilities and financial stability considerations—
were supply side structural reforms, deleveraging, destocking, reducing energy intensity,
facilitating entry, and giving markets a more decisive role in resource allocation. They noted that
a list of state-owned “zombie” companies was being prepared, mostly in the coal and steel
industries, and that capacity reduction was underway in these sectors. Disbursements from the
restructuring fund to facilitate worker resettlement had begun, with close to RMB 30 billion
(a third of the total) already transferred to provinces that had provided commitments on capacity
reduction. The authorities, however, cautioned that the process would be necessarily slow due to
complicated corporate structures involving overlapping balance sheets and control of assets
among parent, subsidiary, and affiliated companies that made valuation assessments difficult.
Ultimately, they saw a need for more market involvement—rather than government directives—
in the process, with creditors discriminating more carefully among borrowers and thereby
hardening budget constraints.
31. The authorities further noted that implicit support to SOEs had been largely phased out
and they were increasingly competing on an equal footing with private firms. They also expected
the envisaged mixed ownership reforms in SOEs would instill professional management,
strengthen corporate governance, and attract private participation to improve efficiency. The
authorities also observed that entry was being facilitated with approval procedures for capital
injection in new growth areas cut by a third.
B. Accepting the Slowdown
32. Macro policies should be consistent with lowering vulnerabilities and the resulting
moderately slower near-term growth. Restructuring will likely entail slower growth in the near
term. This should be accepted in the interest of achieving higher, better-quality, and more robust
longer-term growth. Some of the negative impact on near-term growth may be offset if
sentiment were lifted by sending a strong signal of policy intent. On-budget, pro-consumption
fiscal stimulus can be used if growth threatens to fall excessively.

PEOPLE’S REPBULIC OF CHINA
22 INTERNATIONAL MONETARY FUND
33. Targets. The practice of setting annual growth targets (rather than projections) has
fostered an undesirable focus on short-term, low-quality stimulus measures. If annual targets are
to be maintained, they should be downplayed in importance compared to other indicators (such
as household income growth), set flexibly (wider ranges) and at sustainable levels—for 2017,
around 6 percent.
34. Credit growth, most importantly, needs
to fall substantially to stabilize the nonfinancial
private credit/GDP ratio. This should be done by
decisively tackling the problem at source—soft
budget constraints on SOEs and local
governments, the web of implicit and explicit
guarantees, excessive risk taking by financial
institutions and the pursuit of unsustainably-high
growth.
35. Interest rates. Staff’s monetary policy
index suggests rate cuts have gone beyond what the historical relationship with output and
inflation would imply as necessary. Short-term rates are barely positive in real terms and likely
below the longer-run neutral level. Interest rates should rise towards less accommodative levels
as inflation picks up as projected. This should be data dependent, with an earlier upward move if,
for example, inflation strengthens faster than envisaged, growth surprises on the upside, or
capital outflows intensify substantially. Stronger prudential settings—which, in the past, have
contributed to a significant slowing of credit expansion—should be the main financial policy tool
to restrain credit growth, but somewhat higher interest rates could play a complementary role,
for example, by reaching parts of the financial system that prudential measures may miss (such
as shadow banking and the corporate bond market). That said, higher rates should be used with
caution as they could intensify corporate distress and worsen credit conditions for SMEs.
36. Fiscal stance:
Monitoring the fiscal stance in China is especially
difficult. Much spending and most of the deficit
and financing occurs off budget with little
transparency, and the line between public and
private is blurred. Staff’s estimates of the
“augmented” balance and debt (i.e., including
estimated off-budget spending/financing) are
thus subject to a particularly high degree of
uncertainty, but likely reflect more accurately the
effective fiscal position than the official budget
balance and debt.
Over the medium term, the large augmented deficit should gradually decline towards around
7 percent of GDP, to slow and eventually stabilize debt. The projected increase in the
-20
-10
0
10
20
30
2003 2004 2005 2007 2008 2009 2011 2012 2013 2015
Tig
hte
r
Lo
ose
r
Monetary Policy Looser than Implied 1/
Policy stance index
Taylor-rule implied
policy index
Mar-2016
Source: IMF staff estimates.
1/ The monetary policy stance index is constructed on the basis of a short-term interest rate, reserve
requirement ratio, open market operations and credit growth. The implied policy index is estimated with
a simple Taylor rule that includes inflation and output developments.
-15
-10
-5
0
5
-15
-10
-5
0
5
2003 2004 2005 2006 2007 2008 2009 2010 2011 2012 2013 2014 2015 2016
Proj.
Sources: CEIC Data Company Ltd.; Chinese Authorities; and IMF staff estimates.
Consolidated general
government balance
Augmented
balance
Fiscal Deficit Remains Large, But More on Budget(In percent of GDP)
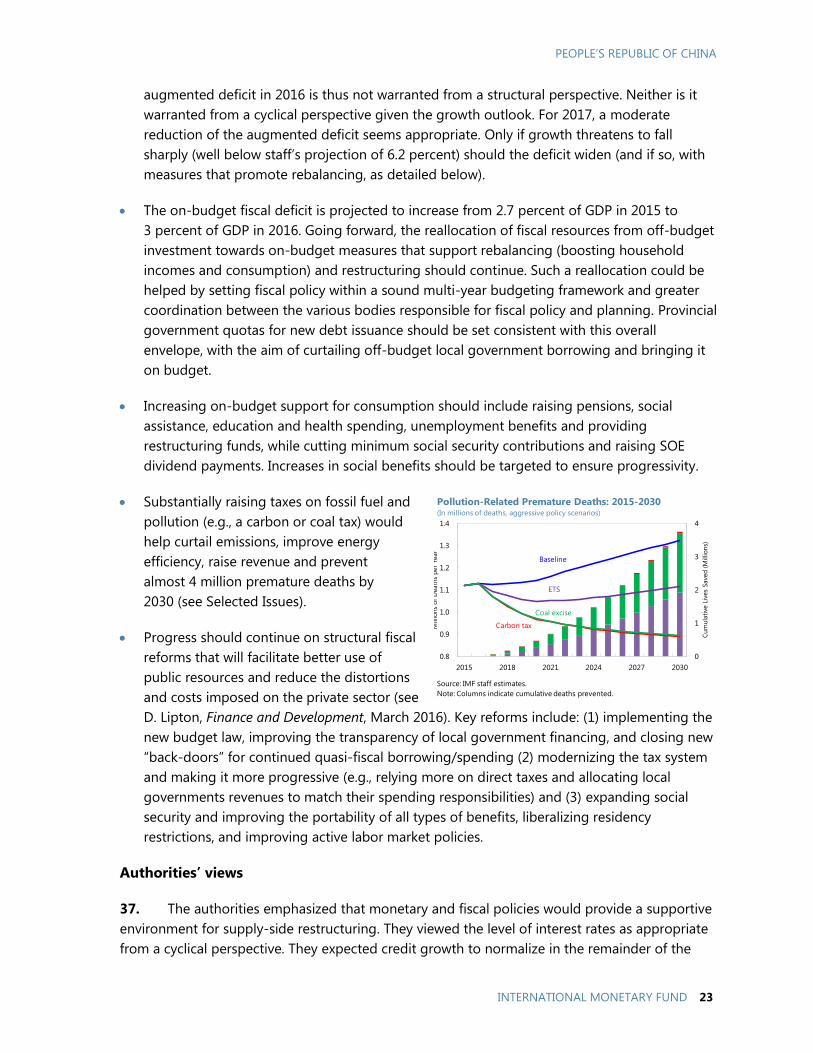
PEOPLE’S REPUBLIC OF CHINA
INTERNATIONAL MONETARY FUND 23
augmented deficit in 2016 is thus not warranted from a structural perspective. Neither is it
warranted from a cyclical perspective given the growth outlook. For 2017, a moderate
reduction of the augmented deficit seems appropriate. Only if growth threatens to fall
sharply (well below staff’s projection of 6.2 percent) should the deficit widen (and if so, with
measures that promote rebalancing, as detailed below).
The on-budget fiscal deficit is projected to increase from 2.7 percent of GDP in 2015 to
3 percent of GDP in 2016. Going forward, the reallocation of fiscal resources from off-budget
investment towards on-budget measures that support rebalancing (boosting household
incomes and consumption) and restructuring should continue. Such a reallocation could be
helped by setting fiscal policy within a sound multi-year budgeting framework and greater
coordination between the various bodies responsible for fiscal policy and planning. Provincial
government quotas for new debt issuance should be set consistent with this overall
envelope, with the aim of curtailing off-budget local government borrowing and bringing it
on budget.
Increasing on-budget support for consumption should include raising pensions, social
assistance, education and health spending, unemployment benefits and providing
restructuring funds, while cutting minimum social security contributions and raising SOE
dividend payments. Increases in social benefits should be targeted to ensure progressivity.
Substantially raising taxes on fossil fuel and
pollution (e.g., a carbon or coal tax) would
help curtail emissions, improve energy
efficiency, raise revenue and prevent
almost 4 million premature deaths by
2030 (see Selected Issues).
Progress should continue on structural fiscal
reforms that will facilitate better use of
public resources and reduce the distortions
and costs imposed on the private sector (see
D. Lipton, Finance and Development, March 2016). Key reforms include: (1) implementing the
new budget law, improving the transparency of local government financing, and closing new
“back-doors” for continued quasi-fiscal borrowing/spending (2) modernizing the tax system
and making it more progressive (e.g., relying more on direct taxes and allocating local
governments revenues to match their spending responsibilities) and (3) expanding social
security and improving the portability of all types of benefits, liberalizing residency
restrictions, and improving active labor market policies.
Authorities’ views
37. The authorities emphasized that monetary and fiscal policies would provide a supportive
environment for supply-side restructuring. They viewed the level of interest rates as appropriate
from a cyclical perspective. They expected credit growth to normalize in the remainder of the
0
1
2
3
4
0.8
0.9
1.0
1.1
1.2
1.3
1.4
2015 2018 2021 2024 2027 2030
Cu
mu
lati
ve L
ives
Saved
(M
illio
ns)
Millio
ns
of
Death
s p
er
Year
Source: IMF staff estimates.
Note: Columns indicate cumulative deaths prevented.
Baseline
ETS
Coal excise
Carbon tax
Pollution-Related Premature Deaths: 2015-2030(In millions of deaths, aggressive policy scenarios)

PEOPLE’S REPBULIC OF CHINA
24 INTERNATIONAL MONETARY FUND
year, observing that the exceptional pace of expansion in early 2016 was in part driven by the
real estate sector—which would likely moderate going forward. The authorities highlighted that
the pace of credit growth would fall over the medium term, given the emphasis on deleveraging
and structural reforms in the 13th Five Year Plan. They noted, however, that the speed of
deleveraging would need to be gradual to prevent adverse feedback loops between the financial
sector and the real economy, as seen for example in Europe after the financial crisis. The
authorities also emphasized that reducing the pace of credit growth would mean foremost
reining in credit to unviable “zombie” firms, while ensuring that dynamic firms continued to have
access to finance.
38. The authorities noted that fiscal policy would proactively take the lead in supporting
aggregate demand, with a higher on-budget deficit projected this year compared to last. They
questioned staff’s ‘augmented’ balance, arguing that the concept was no longer relevant since
local government off-budget spending had been prohibited. The authorities observed that the
implementation of the new budget law was largely on track, although some local governments
continued to guarantee borrowing by LGFVs, requiring the central government to step up its
monitoring and enforcement of the rules. They emphasized that losses on any new loans to
these entities would be shouldered by the financial institutions advancing the credit. The
authorities also highlighted that tax reforms were underway, including to the personal income
tax, environmental protection, resource and excise taxes. However, they questioned staff’s
estimate of the expected health benefits of a carbon or coal tax, arguing that causal links from
higher tax rates to lower mortality rates had not been conclusively identified.
C. Guarding Against Financial Stability Risks
39. Securing financial stability requires action on multiple fronts.
Banks
Provisioning and loan classification regulations should be examined to foster more
proactive recognition of potential loss. This could involve, for example, classifying all
loans with overdue payments beyond 90 days as nonperforming. This process could
usefully be complemented by a focused asset quality review (e.g., of a random selection
of assets or those from a particular sector).
Capital ratios should be increased. Increasing loan-loss provisions will help absorb higher
potential NPLs, but banks face a broad variety of risks, which call for a stronger layer of
equity capital. This can be achieved, for example, by imposing a high countercyclical
capital buffer and encouraging common equity issuance (helped by removing constraints
on issuing when valuations are below book).
Funding. As banks and other financial institutions have grown total assets far faster than
deposits, funding has shifted toward wholesale, short-tenor, and more volatile instruments.
Banks’ reliance on interbank funding has increased, leverage has risen in the repo bond
market, and collateral quality is deteriorating. These developments should be kept under
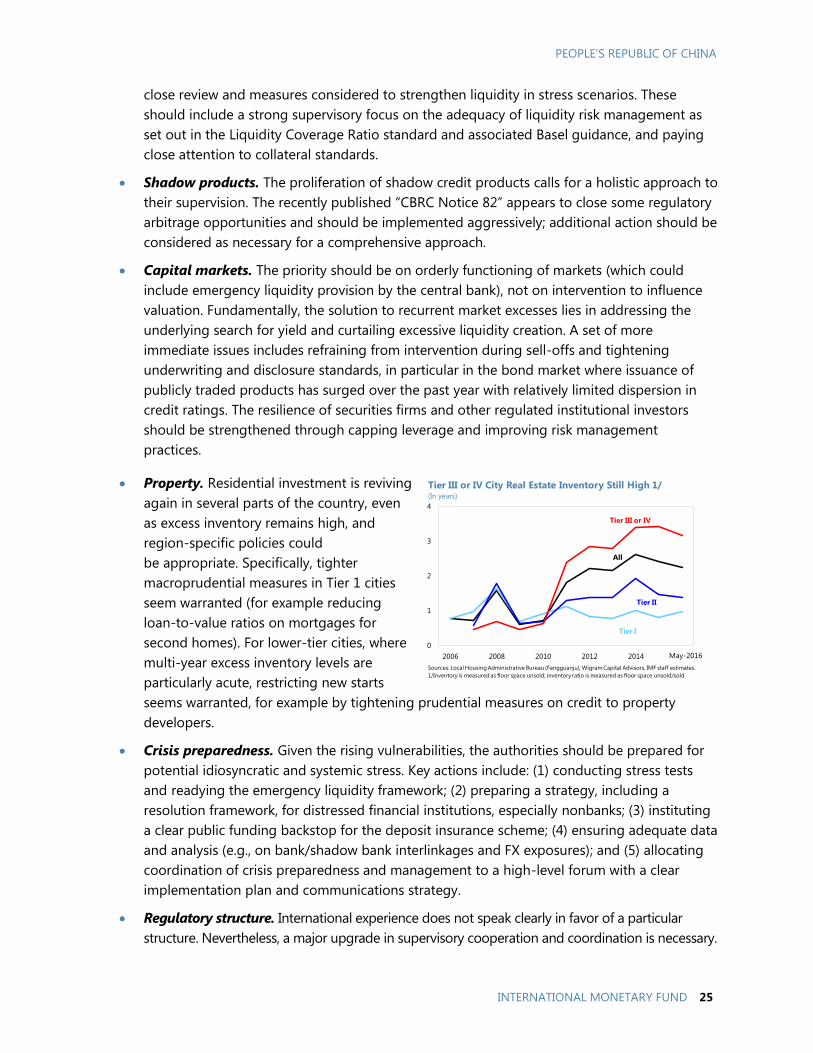
PEOPLE’S REPUBLIC OF CHINA
INTERNATIONAL MONETARY FUND 25
close review and measures considered to strengthen liquidity in stress scenarios. These
should include a strong supervisory focus on the adequacy of liquidity risk management as
set out in the Liquidity Coverage Ratio standard and associated Basel guidance, and paying
close attention to collateral standards.
Shadow products. The proliferation of shadow credit products calls for a holistic approach to
their supervision. The recently published “CBRC Notice 82” appears to close some regulatory
arbitrage opportunities and should be implemented aggressively; additional action should be
considered as necessary for a comprehensive approach.
Capital markets. The priority should be on orderly functioning of markets (which could
include emergency liquidity provision by the central bank), not on intervention to influence
valuation. Fundamentally, the solution to recurrent market excesses lies in addressing the
underlying search for yield and curtailing excessive liquidity creation. A set of more
immediate issues includes refraining from intervention during sell-offs and tightening
underwriting and disclosure standards, in particular in the bond market where issuance of
publicly traded products has surged over the past year with relatively limited dispersion in
credit ratings. The resilience of securities firms and other regulated institutional investors
should be strengthened through capping leverage and improving risk management
practices.
Property. Residential investment is reviving
again in several parts of the country, even
as excess inventory remains high, and
region-specific policies could
be appropriate. Specifically, tighter
macroprudential measures in Tier 1 cities
seem warranted (for example reducing
loan-to-value ratios on mortgages for
second homes). For lower-tier cities, where
multi-year excess inventory levels are
particularly acute, restricting new starts
seems warranted, for example by tightening prudential measures on credit to property
developers.
Crisis preparedness. Given the rising vulnerabilities, the authorities should be prepared for
potential idiosyncratic and systemic stress. Key actions include: (1) conducting stress tests
and readying the emergency liquidity framework; (2) preparing a strategy, including a
resolution framework, for distressed financial institutions, especially nonbanks; (3) instituting
a clear public funding backstop for the deposit insurance scheme; (4) ensuring adequate data
and analysis (e.g., on bank/shadow bank interlinkages and FX exposures); and (5) allocating
coordination of crisis preparedness and management to a high-level forum with a clear
implementation plan and communications strategy.
Regulatory structure. International experience does not speak clearly in favor of a particular
structure. Nevertheless, a major upgrade in supervisory cooperation and coordination is necessary.
0
1
2
3
4
2006 2008 2010 2012 2014 2016May
Tier III or IV City Real Estate Inventory Still High 1/(In years)
Sources: Local Housing Administrative Bureau (Fangguanju), Wigram Capital Advisors, IMF staff estimates.
1/Inventory is measured as floor space unsold; inventory ratio is measured as floor space unsold/sold.
All
Tier I
Tier II
Tier III or IV
May-2016

PEOPLE’S REPBULIC OF CHINA
26 INTERNATIONAL MONETARY FUND
The goals should be: (1) seamless information
sharing, coordination and communication among
agencies; (2) more proactive response to markets’
proven agility to expand into regulatory gaps and
engage in regulatory arbitrage; and (3) stronger crisis
management capabilities.
Authorities’ views
40. The banking regulator disagreed with staff’s
assessment of corporate debt-at-risk. Their own internal
exercise, taking into account the mitigating impact of
loan collateral, had produced significantly lower estimates. They noted that unlisted companies—
assumed the same as the listed universe in staff’s exercise—were healthier as a group than the listed
universe. The regulator also argued that the classification of loans as nonperforming would need to
consider other criteria besides payments overdue beyond 90 days, such as judgment about the
borrowers’ long-term viability and whether they faced cyclical or structural cash flow problems. The
regulator noted that bank exposures to nonstandard credit assets was a key concern and they had
already instructed banks to conduct stringent asset quality classification, which would require them to
set aside more reserves against these exposures than against loans. The banking regulator was also
closely monitoring the growing reliance on wholesale funding, but viewed this as a needed adaptation
in banks’ business models with the growing competition for deposits. The banking regulator argued
that bank capital ratios were sufficient and stable, and viewed dynamic provisioning (introduced in
2011) as effectively playing a similar role to a countercyclical buffer.
41. The securities regulator concurred with staff that the regulatory focus should be on ensuring
smooth functioning of capital markets. They emphasized they stood ready to provide liquidity to
distressed securities firms and would avoid indiscriminate and large purchases of securities.
Information requirements for bond issuers had been raised and onsite inspections increased.
42. The authorities questioned staff’s view on instituting a public backstop for the deposit
insurance scheme. They argued that the deposit insurance system was a market-based framework to
prevent moral hazard and should not be directly linked to public funding. The authorities further noted
that international experience and standards suggested that premium contributions—not fiscal
resources—should be the main source of financing deposit insurance. At the same time, the legal
framework does not preclude public emergency liquidity funding for the deposit insurance system,
though such public funding shall be repaid by bank premiums. More generally, the authorities agreed
that closer cross-agency coordination was needed to bolster supervision, policymaking, and crisis
preparedness. Steps were already being taken in this regard, for example through closer collaboration
on issuing new liquidity guidelines for securities firms.
D. Progressing Toward an Effectively-Floating Exchange Rate Regime
43. FX regime. China has made progress over the past year in moving toward a more
flexible, market-determined exchange rate system. The past year has also shown that the

PEOPLE’S REPUBLIC OF CHINA
INTERNATIONAL MONETARY FUND 27
transition from many years of stability/gradual appreciation is difficult and potentially bumpy,
particularly amid the challenging global and domestic context. Achieving a smooth, successful
transition will need to combine a clear overarching drive toward progressively greater market
determination and skillful, short-term management to avoid excessive volatility. In particular
Achieving an effective float within the next couple of years, ideally by 2018, remains a key
goal. A more flexible, market-determined exchange rate is needed to allow the market to
play a more decisive role in the economy, absorb shocks, and maintain an independent
monetary policy as the capital account opens.
While staff assesses the current level of the RMB as broadly in line with fundamentals, the
value of permitting market forces to help guide the exchange rate toward equilibrium levels
should be recognized. Therefore, the effective exchange rate (relative to a basket) should
over time be allowed to move in response to market conditions.
At the same time, the authorities should also ensure that such adjustment is not destabilizing
by preventing overshooting, one-way expectations, and disorderly market conditions—the
large buffer of reserves provides ample ammunition for such intervention, to be deployed,
for example, in the event of a significant shock.
A possible framework for managing this transition could be to progressively widen a
tolerance band around an equilibrium effective rate within which the spot rate could
fluctuate. The band could be widened gradually or in discrete steps; spot rate fluctuations
within the band could be smoothed by intervention; and the center of the band could be
adjusted if the equilibrium effective exchange rate is assessed to have changed (influenced
heavily by sustained market pressures in either direction).
44. A more market-based monetary framework. The move to a more flexible exchange
rate should proceed in tandem with completing the transition toward a more market-based
monetary framework. Key elements include:
Objectives. Although the PBC does not operate under an explicit inflation targeting regime,
its official mandate includes maintaining “the stability of the currency value and thereby
promote economic growth.” Formally, the PBC targets multiple objectives (inflation, balance
of payments, growth, financial stability). As an important first step, the authorities should
introduce an explicit medium-term inflation target or a range (set by the government/State
Council) together with operational (instrument) independence for the PBC.
Instrument. The PBC should declare the seven-day repo rate its new intermediate policy
target for monetary policy purposes and publish a new market rate (seven-day repo)
representative of lending conditions for Tier 1 banks. The clearer the policy framework, the
easier it will be for the market to establish a yield curve. Standing facilities should act as a
backstop with unlimited access for banks against appropriate collateral.
Operational framework. While the volatility of short-term repo rates has decreased
significantly since last summer, the PBC could further improve its operational framework to
ensure the stability of the short-term market rates. For instance, reserve averaging

PEOPLE’S REPBULIC OF CHINA
28 INTERNATIONAL MONETARY FUND
(introduced in 2015) could be expanded to a 4–5-week period to allow easier liquidity
management by banks.
Backstop. Clear standing facilities should be put in place as a backstop. The overnight
standing credit facility may function as an important backstop for the payment system. In
addition, eligibility and collateral requirements for the PBC’s liquidity facilities should be
clear.
Transparency. Most central banks have found that policy operates more efficiently and
effectively if it is clearly and simply communicated and implementation clearly supports the
stated policy. For example, domestic monetary policy would be clearer if the PBC were
explicitly to announce its monetary policy goals and use monetary policy instruments to
achieve those goals in the most transparent manner possible.
45. Capital account. Enforcement of capital controls has been tightened since last summer
and some additional measures, notably the 20 percent unremunerated reserve requirement on
FX forwards, have been introduced to stem significant depreciation pressures. Such tightening
has likely contributed to the restoration of stability in the capital account, but has come at some
cost to the efficiency of individual corporate treasury management. While new controls should
be avoided, further liberalization should be phased very cautiously. Indeed, capital account
liberalization (and financial liberalization more broadly) can only succeed if supported by a
strengthened financial system, enhanced corporate sector governance and greater exchange rate
flexibility, suggesting that much further progress on the former (capital account liberalization)
may need to await the latter (a strengthened financial system, enhanced corporate governance
and greater exchange rate flexibility). Care should also be taken to ensure that enforcement of
existing capital controls does not spillover to affect current account transactions.
Authorities’ views
46. The authorities noted that exchange market pressures had eased considerably in recent
months and the move to a more market-based exchange rate was progressing. The approach
was to continue maintaining broad stability against a currency basket while allowing market
forces a greater role in determining the level. FX intervention had decreased in recent months
and was used largely to smooth adjustments and curb overshooting. The authorities remain
committed to gradually liberalizing the capital account over the medium term. They may
complement such reforms (including the reserve requirement on FX forwards that the authorities
consider macroprudential measures) to maintain stability and minimize disruptive short-term
capital flows. The monetary framework was also being adapted to elevate the role of interest
rates as a policy lever. Daily open market operations, open bid auctions for liquidity, and 10-day
reserve averaging had contributed to increased stability and predictability in money market rates.
The PBC did not see the need to extend the period over which reserve averaging is calculated,
citing banks’ liquidity management had adapted well to the current system.

PEOPLE’S REPUBLIC OF CHINA
INTERNATIONAL MONETARY FUND 29
E. Enhancing Transparency and Communications
47. Contributing to the market turbulence in recent months is a lack of clarity about
what is happening in the economy and the authorities’ policy intentions.
Data gaps. Lack of confidence in macroeconomic data prompts many investors to suspect
the economy is much weaker than officially reported (Box 3). While progress has been made,
for example, in monetary, financial and external statistics and by disseminating data via SDDS
and CPIS, important gaps remain. Addressing these data gaps, especially in the national
accounts (e.g., providing quarterly GDP by expenditure, high-frequency indicators on services
and the “new” economy, and improving the deflation methodology), government finance
statistics (e.g., tracking off-budget spending by local governments and providing an
expenditure breakdown by economic type) and credit composition (e.g., by sector) would
enable better monitoring of macro developments, identification of key risks, and design of
the policy stance. Ensuring adequate data are available on bank/shadow bank linkages and
FX exposures is also critical for financial stability analysis. While data are broadly adequate for
surveillance, they are only barely so, and are not commensurate with China’s systemic
importance.
Communications. Clear, authoritative, and consistent communications about policy
objectives and how they are being achieved would reduce uncertainty and align
expectations. This requires developing a communication strategy integrated closely with
policy decisions; identifying key audiences (both domestic and foreign); using a range of
user-friendly communication tools and channels; and learning from international experience.
Recent efforts by key policymakers to convey their insights on the outlook and their policy
intentions are encouraging, as is the initiative to increase the frequency of press conferences
on data releases from quarterly to monthly.
Authorities’ views
48. The authorities noted that data collection and dissemination was being upgraded in
three main areas: consistency between provincial and national GDP, national balance sheet, and
natural resource balance sheet (accounting for environmental assets such as land, forests and
water). They were exploring possibilities for publishing expenditure-based quarterly GDP in real
terms and high-frequency indicators for services. From a financial regulatory perspective, the
authorities did not see any major data gaps in bank/shadow bank linkages or credit allocation by
sector. They intended to publish more detailed breakdowns of bank credit and increase the
frequency of dissemination. The authorities acknowledged the importance of communications
and pointed to recent press conferences and media interviews by key policymakers.

PEOPLE’S REPBULIC OF CHINA
30 INTERNATIONAL MONETARY FUND
Box 3. How Reliable is China’s Output Data?
There is some evidence pointing to possible overstatement of growth recently, but the overstatement is likely
moderate and the official national accounts data—while there is much room for improvement—likely
provide a broadly reliable picture.
China’s nominal GDP is probably larger than the official estimate. This could reflect flaws in measuring
service consumption, including the inability to fully capture the switch from state-owned industrial firms to
market-based (and often smaller) service firms. A study by the Rhodium Group, which duplicates the
authorities’ statistical methodology, but addresses some key weaknesses, suggests nominal GDP is
underestimated by, for example, 13–16 percent in 2008, and some other studies, while using different
approaches, show similar results.
But growth may be smoothed since the smallest and most volatile firms may not be adequately
captured in the statistical methodology. Indeed, skepticism that growth is overstated has grown recently,
arising largely from the more pronounced weakening in some hard indicators compared to official growth
data, including consumption of energy, industrial value added, and commodity imports. A few studies
indicate that growth is not overstated over a long time horizon, but that the volatility is understated.
Some further argue that the official nominal GDP data are reliable, but the weaknesses in deflators cause
real growth to be smoothed. For example, the single deflation approach, which deflates input and output
using the same deflator, tends to overstate growth when commodity prices decline sharply. But a
counterargument is that the dynamism in the service sector is robust and not well reflected in the hard
indicators mentioned above. For example, private consumption is buoyant, with retail sales growing by
around 10 percent y/y in real terms.
“Underlying” growth may be weaker than officially reported, but only somewhat.
Correlation. A sudden decline in the correlation
between overall growth data and individual
hard indicators could signal that the official data
might overstate growth. However, looking at
12-month rolling correlations for real GDP
growth versus electricity production, cement,
crude steel and freight, does not suggest a
recent significant decline (though the series are
noisy).
High frequency-based estimates. Out-of-sample
estimates of growth from high-frequency PMIs and consumption/investment indicators are about ¼‒
½ percent lower than official growth data in 2015.
These results, however, are only indicative of possible slower underlying growth. While providing
some cross checks, they are not based on comprehensive datasets and cannot substitute for national
account statistics. These approaches focus on underlying growth by analyzing variables traditionally
shaping economic fundamentals, while actual growth also includes transitory factors not captured (e.g., the
current strength of financial services).
5
7
9
11
13
2010Q1 2010Q4 2011Q3 2012Q2 2013Q1 2013Q4 2014Q3 2015Q2 2016Q1
Sources: CEIC Data Company Ltd.; and IMF staff estimtes.
GDP Growth: Official and Estimated(In perent, year-on-year growth)
Official data
Estimated by PMI
Estimated by
INV/CONS
PEOPLE’S REPUBLIC OF CHINA
INTERNATIONAL MONETARY FUND 31
STAFF APPRAISAL
49. Reform and rebalancing amid a bumpy transition. China continues its transition to a
sustainable growth path. Rebalancing has progressed on many dimensions, particularly switching
from industry to services and from investment to consumption, but less on reining in credit
growth. Reforms have advanced impressively across a wide domain, but lagged in some critical areas,
and the transition to sustainable growth is proving difficult, with sizable economic and financial
volatility. Vulnerabilities are rising on a dangerous trajectory and buffers, while still adequate, are
eroding.
50. Policy plans. Recognizing these challenges, the recently launched 13th Five Year Plan
appropriately aims to boost consumption, expand the service sector, protect the environment,
and reduce poverty. The government has put supply-side reforms at the center of its economic
policy agenda, including the restructuring of SOEs, capacity reduction in the coal and steel
sectors, and facilitating firm entry and worker resettlement to new growth areas.
51. Benign near-term outlook… Growth is expected at 6.6 percent this year, shored up by
policy stimulus, falling to 6.2 percent in 2017. This assumes robust consumption and wage
growth, and a slight pick-up in investment this year, but moderating next year. Net exports will
likely continue to drag growth in the near term as external demand remains tepid. Inflation
should gradually pick up as commodity prices recover.
52. …but increasingly uncertain medium-term prospects. More urgent action is needed
to tackle vulnerabilities and improve resource allocation. Under staff’s baseline scenario, growth
will decline below 6 percent over the medium term, the credit/GDP ratio will continue rising, and
the risks of a disruptive adjustment will increase. Under an alternative, proactive scenario with
decisive measures to tackle corporate debt and reform SOEs, near-term growth would dip below
baseline but, critically, medium-term growth prospects would improve and the nonfinancial
private credit/GDP ratio would stabilize at a significantly lower level than in the baseline.
53. Tackling the corporate debt problem. Corporate debt, though still manageable, needs
to be decisively tackled to ensure it remains so. International experience, including China’s during
the 1990s, suggests that addressing a systemic corporate debt problem requires a
comprehensive approach and decisive implementation to: harden budget constraints; triage
excessively indebted firms, restructure the viable and liquidate the nonviable; recognize and
share financial losses among firms, banks, other creditors, and, if necessary, the government;
absorb the social costs of layoffs through earmarked funds; and facilitate entry of dynamic
private firms. Progress should be kick-started by piloting a few high-profile
restructurings/liquidations of weak SOEs in the next few months.
54. Macro policies should be consistent with lowering vulnerabilities and the resulting
moderately slower, near-term growth. Most importantly, credit growth and investment need to
decline, partially offset by a further increase in on-budget measures that support rebalancing by
boosting household consumption. Pro-rebalancing measures should include raising pensions,
PEOPLE’S REPBULIC OF CHINA
32 INTERNATIONAL MONETARY FUND
social assistance, education and health spending, providing restructuring funds, and cutting
minimum social security contributions.
55. Further action is needed on multiple fronts to secure financial stability. This includes
proactive recognition of losses in banks’ loan books; strengthening capital ratios; enhancing
supervisory focus on liquidity risk management and funding stability risks; and addressing risks in
shadow products. A major upgrade in supervisory coordination and cooperation is necessary to
foster more seamless cross-agency information sharing and policy coordination, reduce the
scope for regulatory arbitrage, and enhance crisis management capabilities.
56. Steady progress toward an effectively floating exchange rate regime should
continue. Staff encourages the authorities to build on the progress made over the past year in
moving toward a more flexible, market-determined exchange rate system. Achieving an
effectively floating exchange rate regime, ideally by 2018, will need to combine a clear
overarching drive toward progressively greater market-determination and skillful short-term
management to avoid excessive volatility. The move to greater flexibility should be supported by
progress to a more market-based monetary framework. Further capital account liberalization
should be phased carefully, supported by a strengthened financial system, enhanced corporate
governance and greater exchange rate flexibility.
57. Transparency in data and communications. Greater clarity about developments in the
economy and the authorities’ policy intentions would reduce uncertainty, align expectations, and
help contain market turbulence. This requires more comprehensive and timely dissemination of
economic and financial data and a communication strategy integrated with policy decisions,
conveyed via a range of user-friendly tools.
58. It is proposed that the next Article IV consultation with China take place on the standard
12-month cycle.

PEOPLE’S REPUBLIC OF CHINA
INTERNATIONAL MONETARY FUND 33
Figure 1. Activity: Slowing Trend, Bumpy
Consumer spending has held up… …while private investment has slowed…
…despite the recent recovery in residential real estate. Trade volumes are improving, but remain subdued.
Industrial production appears to be stabilizing, although
adjustment in heavy industrial sectors continues… …where excess capacity has weighed on producer prices.
Sources: CEIC Data Company Ltd.; Haver Analytics; and IMF staff estimates.
-20
-10
0
10
20
-20
-10
0
10
20
13Q1 14Q1 15Q1 16Q1
Trade Volumes(In percent, year-on-year, quarterly average)
Exports
Imports
0
5
10
15
20
25
0
5
10
15
20
25
Jan-14 May-14 Sep-14 Jan-15 May-15 Sep-15 Jan-16 May-16
Real Retail Sales(In percent, year-on-year)
May-16
Consumer durables
Automobiles
Total
0
10
20
30
0
10
20
30
2013 2014 2015 2016
Real Fixed Asset Investment Growth 1/
(In percent, year-on-year)
May-16
1/ Deflated by FAI prices; authorities publish quarterly index and staff estimates monthly index.
Non-SOESOE
Total
-6
-4
-2
0
0
1
2
3
4
2013 2014 2015 2016
Inflation(In percent, year-on-year)
May-16
PPI (RHS)
Core CPI (excl. food
and energy)
Headline
-10
-5
0
5
10
15
20
25
2013 2014 2015 2016
Investment
Residential Housing Growth(In percent, year-on-year)
May-16
1/ NBS 70-city new constructed residential property price.
Property Price 1/
-10
-5
0
5
10
15
Jan-14 May-14 Sep-14 Jan-15 May-15 Sep-15 Jan-16 May-16
Industry Value Added
IP: crude steel 1/
Industry Value Added(In percent, year-on-year growth)
1/ No reported data for January and February 2016.

PEOPLE’S REPUBLIC OF CHINA
34 INTERNATIONAL MONETARY FUND
Figure 2. Rebalancing: Some Progress
Since 2010, private consumption has grown owing to a
rising income share and a decrease in the saving rate.
Investment has moderated along with national saving,
especially in 2015.
On the supply side, services have accounted for a rising
share of nominal GDP since 2012…
…with the tertiary sector growing faster than the
secondary in real terms over this time.
Similar patterns are visible in the labor market, where the
tertiary sector share of employment has risen rapidly…
…after three successive years in which it was the only
segment of the economy with net job creation.
Sources: CEIC Data Company Ltd.; Haver Analytics; and IMF staff estimates.
0
3
6
9
12
30
35
40
45
50
55
2006 2007 2008 2009 2010 2011 2012 2013 2014 2015
Current account (RHS)
Investment and Saving(In percent of GDP)
Sources: CEIC Data Company Ltd.; and IMF staff estimates.
National saving
Investment
35
40
45
50
55
2008 2009 2010 2011 2012 2013 2014 2015
GDP by Production(In percent of GDP)
Sources: CEIC Data Company Ltd.; and IMF staff estimates.
Secondary Industry
Tertiary Industry
0
5
10
15
20
2005 2006 2007 2008 2009 2010 2011 2012 2013 2014 2015
Real GDP Growth by Activity(In percent, Year-on-year growth)
Primary industry
Tertiary industry
Secondary industry
20
30
40
50
2005 2006 2007 2008 2009 2010 2011 2012 2013 2014 2015
Employment by Sectors(In percent of total employment)
Primary industry
Tertiary industry
Secondary industry
20
25
30
35
40
45
30
40
50
60
70
2005 2007 2009 2011 2013 2015
Note: Saving rate is defined as household saving in percent of disposable income.
Disposable income
(In percent of GDP)
Private consumption
(In percent of GDP)
Consumption growing, but slowly
Household saving
(in percent of disposable income, RHS)
Private Consumption
-8
-4
0
4
8
2005 2006 2007 2008 2009 2010 2011 2012 2013 2014 2015
Employment Growth (In percent, year-on-year growth)
Secondary industry
Tertiary Industry
Primary industry

PEOPLE’S REPUBLIC OF CHINA
INTERNATIONAL MONETARY FUND 35
Figure 3. Corporate Sector: Rising Stress
The stock of credit outstanding relative to GDP has grown by
a third over the last five years.
Leverage in private firms picked up after 2010, while SOEs
continued to operate with high leverage…
…even as profitability has deteriorated. Arrears in intercorporate payments have risen…
…contributing to an increase in the share of corporate loans
held by firms with low debt service capacity…
…with firms in construction-related and upstream sectors
accounting for large portions of the debt-at-risk.
Sources: Bloomberg; CEIC Data Company Ltd.; Haver Analytics; Standard & Poor’s Capital IQ; and IMF staff estimates.
0
50
100
150
200
250
2008 2009 2010 2011 2012 2013 2014 2015
Private sector credit (Incl. external debt and equity)
LGFV borrowing
Adjusted TSF (Incl. external debt)
Adjusted Credit(In percent of GDP)
80
100
120
140
160
180
200
2003 2004 2005 2006 2007 2008 2009 2010 2011 2012 2013 2014 2015 2016
Q1
Leverage Ratios (Average Mean)(In percent)
Sources: WIND database and IMF staff estimates.
SOEs
Private firms
0
2
4
6
8
10
2003 2005 2007 2009 2011 2013 2015
Weak and Deteriorating SOE Profitability(In percent, returns on total assets)
Industrial private enterprises
Local SOEs
Central SOEs
30
40
50
60
70
80
2009 2010 2011 2012 2013 2014 2015LTM
Payables Days(Number of days, median)
Note: Payables days = payables / annual sales x 365. The China sample contains
3139 firms (2015E). LTM = last twelve months.
China
Europe, Middle
East, and Africa
Asia, excl. China
Latin America
0
5
10
15
20
25
30
2010 2011 2012 2013 2014 2015 E
1y, ICR < 2
1y, ICR < 1.5
1y, ICR < 1
China Listed Companies' Potentially Impaired Loans 1/(In percent of debt)
1/ Estimated impaired loans on each ICR standard as a share of total loans in
the sample. The sample is from the S&P Capital IQ database.
0
20
40
60
80
100
14 percent total debt
11
18
35
35
3918
9 191 1
1/ ICR<1.
Debt-at-Risk by Sector(In percent of total debt at risk) 1/
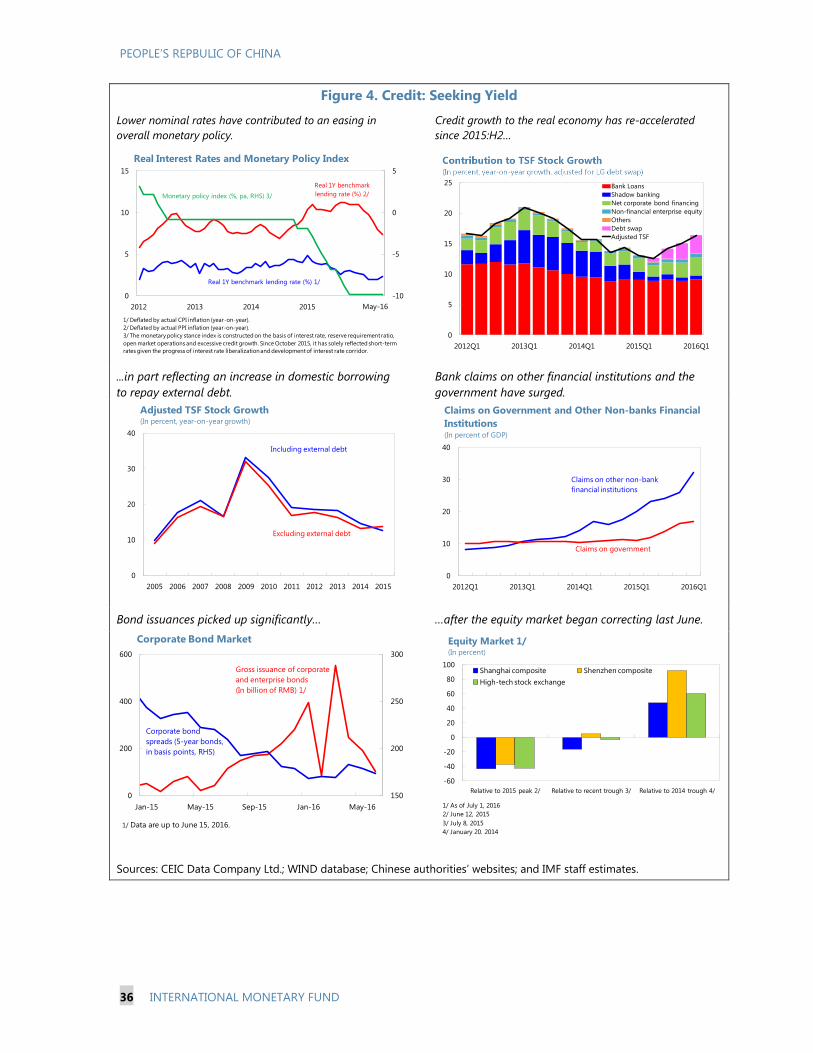
PEOPLE’S REPBULIC OF CHINA
36 INTERNATIONAL MONETARY FUND
Figure 4. Credit: Seeking Yield
Lower nominal rates have contributed to an easing in
overall monetary policy.
Credit growth to the real economy has re-accelerated
since 2015:H2…
...in part reflecting an increase in domestic borrowing
to repay external debt.
Bank claims on other financial institutions and the
government have surged.
Bond issuances picked up significantly… …after the equity market began correcting last June.
Sources: CEIC Data Company Ltd.; WIND database; Chinese authorities’ websites; and IMF staff estimates.
0
10
20
30
40
2005 2006 2007 2008 2009 2010 2011 2012 2013 2014 2015
Adjusted TSF Stock Growth(In percent, year-on-year growth)
Including external debt
Excluding external debt
0
10
20
30
40
2012Q1 2013Q1 2014Q1 2015Q1 2016Q1
Claims on Government and Other Non-banks Financial
Institutions(In percent of GDP)
Claims on other non-bank
financial institutions
Claims on government
150
200
250
300
0
200
400
600
Jan-15 May-15 Sep-15 Jan-16 May-16
Corporate bond
spreads (5-year bonds,
in basis points, RHS)
Gross issuance of corporate
and enterprise bonds
(In billion of RMB) 1/
Corporate Bond Market
1/ Data are up to June 15, 2016.
0
5
10
15
20
25
2012Q1 2013Q1 2014Q1 2015Q1 2016Q1
Bank Loans
Shadow banking
Net corporate bond financing
Non-financial enterprise equity
Others
Debt swap
Adjusted TSF
-60
-40
-20
0
20
40
60
80
100
Relative to 2015 peak 2/ Relative to recent trough 3/ Relative to 2014 trough 4/
Shanghai composite Shenzhen composite
High-tech stock exchange
1/ As of July 1, 2016
2/ June 12, 2015
3/ July 8, 2015
4/ January 20. 2014
Equity Market 1/(In percent)
-10
-5
0
5
0
5
10
15
2012 2013 2014 2015 2016May-16
1/ Deflated by actual CPI inflation (year-on-year).
2/ Deflated by actual PPI inflation (year-on-year).
3/ The monetary policy stance index is constructed on the basis of interest rate, reserve requirement ratio,
open market operations and excessive credit growth. Since October 2015, it has solely reflected short-term
rates given the progress of interest rate liberalization and development of interest rate corridor.
Real 1Y benchmark lending rate (%) 1/
Real 1Y benchmark
lending rate (%) 2/Monetary policy index (%, pa, RHS) 3/
Real Interest Rates and Monetary Policy Index
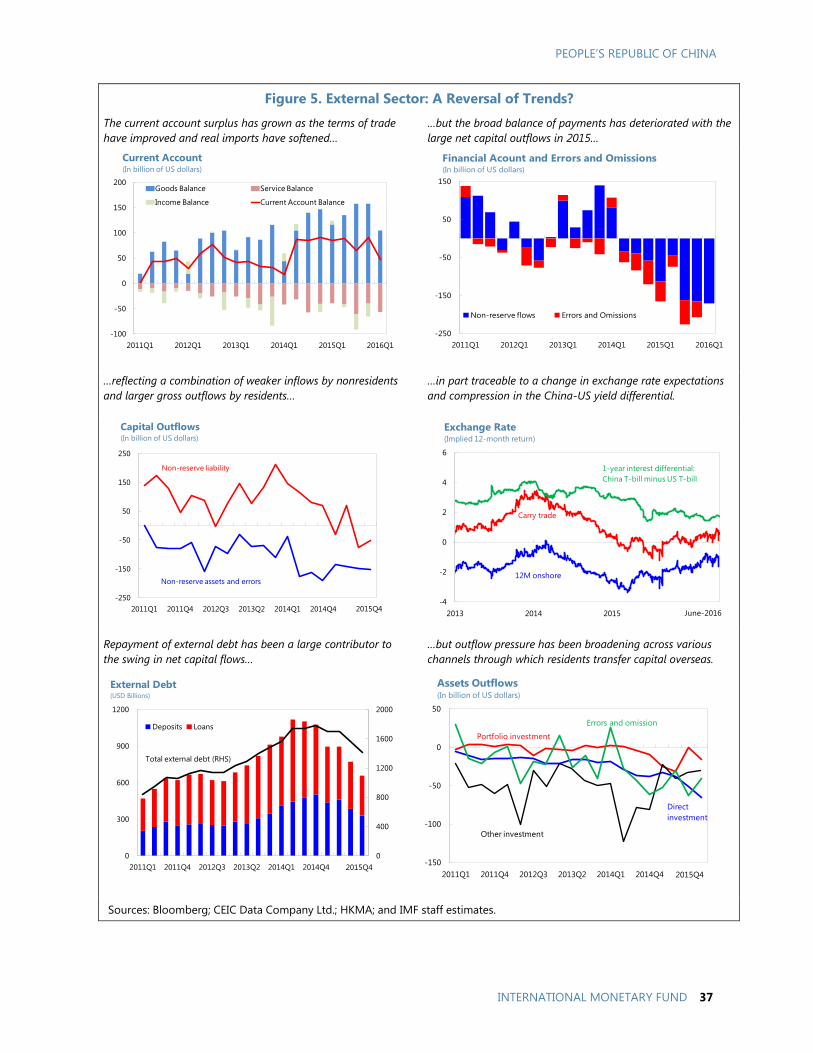
PEOPLE’S REPUBLIC OF CHINA
INTERNATIONAL MONETARY FUND 37
Figure 5. External Sector: A Reversal of Trends?
The current account surplus has grown as the terms of trade
have improved and real imports have softened…
…but the broad balance of payments has deteriorated with the
large net capital outflows in 2015…
…reflecting a combination of weaker inflows by nonresidents
and larger gross outflows by residents…
…in part traceable to a change in exchange rate expectations
and compression in the China-US yield differential.
Repayment of external debt has been a large contributor to
the swing in net capital flows…
…but outflow pressure has been broadening across various
channels through which residents transfer capital overseas.
Sources: Bloomberg; CEIC Data Company Ltd.; HKMA; and IMF staff estimates.
-250
-150
-50
50
150
250
2011Q1 2011Q4 2012Q3 2013Q2 2014Q1 2014Q4 2015Q3
Capital Outflows(In billion of US dollars)
2015Q4
Non-reserve assets and errors
Non-reserve liability
-4
-2
0
2
4
6
2013 2014 2015 2016
Exchange Rate(Implied 12-month return)
1-year interest differential:
China T-bill minus US T-bill
Carry trade
12M onshore
June-2016
0
400
800
1200
1600
2000
0
300
600
900
1200
2011Q1 2011Q4 2012Q3 2013Q2 2014Q1 2014Q4 2015Q3
Deposits Loans
External Debt (USD Billions)
Total external debt (RHS)
2015Q4-150
-100
-50
0
50
2011Q1 2011Q4 2012Q3 2013Q2 2014Q1 2014Q4 2015Q3
Assets Outflows(In billion of US dollars)
2015Q4
Portfolio investment
Other investment
Errors and omission
Direct
investment
-100
-50
0
50
100
150
200
2011Q1 2012Q1 2013Q1 2014Q1 2015Q1 2016Q1
Goods Balance Service Balance
Income Balance Current Account Balance
Current Account(In billion of US dollars)
-250
-150
-50
50
150
2011Q1 2012Q1 2013Q1 2014Q1 2015Q1 2016Q1
Non-reserve flows Errors and Omissions
Financial Acount and Errors and Omissions(In billion of US dollars)

PEOPLE’S REPBULIC OF CHINA
38 INTERNATIONAL MONETARY FUND
Figure 6. FX and Stock Markets: Pressures Easing?
Capital outflows, on the rise since 2014:Q2, accelerated in
2015:H2… …prompting large and unprecedented intervention….
…to arrest depreciation pressures prompted by the August
2015 switch in exchange rate policy…
…from a de facto tight dollar link to referencing a basket of
currencies.
The stock market correction has also weighed on sentiment. Markets continue to price in further depreciation, although
expectations have recently eased somewhat.
Sources: CEIC Data Company Ltd.; HKMA; Haver Analytics; and IMF staff estimates.
-250
-200
-150
-100
-50
0
50
100
150
2014Q1 2014Q3 2015Q1 2015Q3 2016Q1
Net Capital Flows(In billion of US dollars)
-200
-150
-100
-50
0
50
100
150
2014Q1 2014Q3 2015Q1 2015Q3 2016Q1
Loss of Reserves
China: FX Intervention(In billion of US dollars)
-3
-2
-1
0
1
Jan-14 May-14 Sep-14 Jan-15 May-15 Sep-15 Jan-16 May-16
Depreciation
RMB - USD, Monthly Average Spot Rate(In percent, month on month percent change)
6
6.2
6.4
6.6
6.880
90
100
110
Jan-14 Jun-14 Nov-14 Apr-15 Sep-15 Feb-16
RMB Exchange Rates vs. the US Dollar and CFETS Index
RMB/USD daily central parity fixing (RHS)
CFETS Index (Dec 31, 2014)
June-16
0
1000
2000
3000
4000
0
1000
2000
3000
4000
5000
6000
Jan-14 Jun-14 Nov-14 Apr-15 Sep-15 Feb-16
China Equity Market Indices
Shanghai composite
index
Shenzhen composite
index (RHS)
June-16
-6
-4
-2
0
2
Jan-15 Apr-15 Jul-15 Oct-15 Jan-16 Apr-16
RMB Implied 1-year Depreciation/Appreciation
1-year NDF
1-year onshore
Appreciation
June-16

PEOPLE’S REPUBLIC OF CHINA
INTERNATIONAL MONETARY FUND 39
Table 1. China: Selected Economic Indicators
2011 2012 2013 2014 2015 2016 2017 2018 2019 2020 2021
NATIONAL ACCOUNTS
Real GDP 9.5 7.9 7.8 7.3 6.9 6.6 6.2 6.0 6.0 5.9 5.8
Total domestic demand 10.7 7.9 8.1 7.2 7.2 7.2 6.5 6.2 6.1 6.0 5.9
Consumption 12.2 8.7 7.2 7.2 8.3 7.8 7.7 7.1 6.8 6.6 6.4
Investment 9.2 7.1 9.1 7.1 6.1 6.4 5.2 5.2 5.3 5.3 5.3
Fixed 8.8 9.0 9.3 6.8 6.8 6.6 5.3 5.3 5.4 5.4 5.4
Inventories (contribution) 0.4 -0.7 0.1 0.3 -0.2 0.0 0.0 0.0 0.0 0.0 0.0
Net exports (contribution) -0.8 0.2 -0.1 0.3 -0.1 -0.5 -0.2 -0.1 0.0 0.0 0.0
Total capital formation (percent of GDP) 48.0 47.2 47.3 46.7 45.0 43.9 43.3 42.8 42.2 41.6 41.0
Gross national saving (percent of GDP) 49.8 49.7 48.8 49.3 47.9 46.3 44.9 44.1 43.2 42.4 41.6
LABOR MARKET
Unemployment rate (annual average) 1/ … … 5.0 5.1 5.1 5.1 5.1 5.0 5.0 5.0 5.0
Wages 16.7 14.0 12.9 10.0 9.9 9.0 8.7 8.5 8.5 8.3 8.1
PRICES
Consumer prices (average) 5.4 2.6 2.6 2.0 1.4 2.1 2.3 2.4 2.6 3.0 3.0
GDP Deflator 8.1 3.2 2.4 1.2 0.4 0.7 0.9 1.4 1.6 2.0 2.1
FINANCIAL
7-day repo rate (percent) 6.4 4.6 5.4 5.1 2.5 … … … … … …
10 year government bond rate (percent) 3.4 3.6 4.6 3.7 2.9 … … … … … …
Real effective exchange rate (average) 2.8 5.6 6.3 3.1 10.1 … … … … … …
Nominal effective exchange rate (average) 0.1 5.0 5.3 3.1 9.5 … … … … … …
MACRO-FINANCIAL
Total social financing 2/ 18.1 19.1 17.5 14.3 12.4 12.7 11.9 11.4 11.0 10.3 10.1
In percent of GDP 157.9 169.0 180.0 189.5 198.4 208.3 217.4 225.1 232.0 236.9 241.6
Domestic credit to the private sector 16.2 19.8 16.6 13.5 14.7 14.7 13.4 12.1 10.9 9.9 9.7
In percent of GDP 124.8 134.3 141.9 148.2 158.3 169.2 179.0 186.5 192.1 195.5 198.7
House price 3/ 5.7 8.7 7.7 1.4 9.1 8.9 7.3 7.0 7.3 6.9 6.8
Household disposable income (percent of GDP) 58.3 59.4 60.0 60.7 62.2 63.2 63.6 63.9 64.2 64.2 64.2
Household savings (percent of disposable income) 41.0 40.8 38.5 37.9 37.4 36.9 35.8 34.7 33.7 32.7 31.7
Household debt (percent of GDP) 27.8 29.6 33.0 35.3 38.4 41.8 45.5 49.1 52.4 55.3 57.5
Non-financial corporate domestic debt (percent of GDP) 97.0 104.7 108.9 112.8 120.0 127.4 133.5 137.5 139.7 140.2 141.2
GENERAL GOVERNMENT (Percent of GDP)
Net lending/borrowing 4/ -0.1 -0.7 -0.8 -0.9 -2.7 -3.0 -3.1 -2.9 -2.9 -2.8 -2.7
Revenue 26.9 27.8 27.7 28.0 28.6 27.8 28.1 28.0 27.8 27.7 27.5
Expenditure 27.0 28.4 28.5 28.9 31.3 30.8 31.2 30.9 30.7 30.4 30.2
Debt 5/ 15.2 15.2 15.9 38.5 38.3 38.6 39.1 39.3 39.3 39.2 39.0
Structural balance -0.1 -0.5 -0.5 -0.5 -2.4 -2.9 -3.1 -2.9 -2.9 -2.8 -2.7
BALANCE OF PAYMENTS (Percent of GDP)
Current account balance 1.8 2.5 1.5 2.6 3.0 2.4 1.6 1.3 1.0 0.8 0.6
Trade balance 3.0 3.6 3.7 4.1 5.1 5.1 4.5 4.3 4.0 3.8 3.7
Services balance -0.6 -0.9 -1.3 -1.6 -1.6 -2.0 -2.3 -2.6 -2.7 -2.9 -2.9
Net international investment position 22.4 21.8 20.7 15.2 14.3 16.5 16.9 16.7 16.3 15.5 14.8
Gross official reserves (bn US$) 3,256 3,388 3,880 3,899 3,406 3,181 3,064 2,993 2,890 2,813 2,740
MEMORANDUM ITEMS
Nominal GDP (bn RMB) 6/ 48,604 54,099 59,696 64,849 69,630 74,715 80,118 86,159 92,834 100,244 108,246
Augmented debt (percent of GDP) 7/ 45.8 47.1 51.0 51.8 55.8 60.4 64.5 67.8 70.4 72.2 73.5
Augmented net lending/borrowing (percent of GDP) 7/ -6.0 -5.1 -7.6 -7.2 -7.8 -8.4 -8.2 -7.8 -7.4 -7.0 -6.6
Augmented fiscal balance (percent of GDP) 8/ -8.2 -7.8 -10.3 -9.8 -9.5 -10.1 -9.8 -9.3 -8.8 -8.4 -8.0
Sources: CEIC Data Co., Ltd.; IMF, Information Notice System; and IMF staff estimates and projections.
1/ Surveyed unemployment rate.
2/ After adjusting local government debt swap, staff estimate that TSF stood at 203 percent of GDP in 2015.
6/ Expenditure side nominal GDP.
7/ Augmented fiscal data expand the perimeter of government to include local government financing vehicles and other off-budget activity.
5/ Estimates of debt levels before 2015 include central government debt and explicit local government debt (identified by MoF and NPC in Sep 2015). The large increase in general
government debt in 2014 reflects the authorities' recognition of the off-budget local government debt borrowed previously. The estimation of debt levels after 2015 assumes zero
off-budget borrowing from 2015 to 2021.
8/ "Augmented fiscal balance" = "augmented net lending/borrowing" - "net land sales proceeds" (in percent of GDP) as we treat net land sales proceeds as financing.
Projections
(Annual percentage change, unless otherwise indicated)
4/ Adjustments are made to the authorities' fiscal budgetary balances to reflect consolidated general government balance, including government-managed funds, state-
administered SOE funds, adjustment to the stabilization fund, and social security fund.
3/ Average selling prices estimated by IMF staff based on housing price data (Commodity Building Residential Price) of 70 large and mid-sized cities published by National Bureau
of Statistics (NBS).

PEOPLE’S REPBULIC OF CHINA
40 INTERNATIONAL MONETARY FUND
Table 2. China: Balance of Payments
(In percent of GDP, unless otherwise noted)
2011 2012 2013 2014 2015 2016 2017 2018 2019 2020 2021
Current account balance 1.8 2.5 1.5 2.6 3.0 2.4 1.6 1.3 1.0 0.8 0.6
Trade balance 3.0 3.6 3.7 4.1 5.1 5.1 4.5 4.3 4.0 3.8 3.7
Exports 24.0 23.0 22.3 21.3 19.2 18.1 17.1 16.1 15.2 14.3 13.5
Imports 21.0 19.4 18.6 17.1 14.1 13.0 12.6 11.8 11.1 10.5 9.8
Services balance -0.6 -0.9 -1.3 -1.6 -1.6 -2.0 -2.3 -2.6 -2.7 -2.9 -2.9
Income balance -0.9 -0.2 -0.8 0.1 -0.4 -0.6 -0.6 -0.3 -0.2 -0.2 -0.1
Current transfers 0.3 0.0 -0.1 0.0 -0.1 -0.1 -0.1 -0.1 -0.1 -0.1 0.0
Capital and financial account balance 3.5 -0.4 3.6 -0.5 -4.3 -4.3 -2.6 -1.8 -1.7 -1.2 -1.0
Capital account 0.1 0.0 0.0 0.0 0.0 0.0 0.0 0.0 0.0 0.0 0.0
Financial account 3.5 -0.4 3.6 -0.5 -4.3 -4.4 -2.6 -1.9 -1.7 -1.3 -1.0
Net foreign direct investment 3.1 2.1 2.3 1.4 0.6 -0.4 -1.2 -1.8 -1.8 -1.5 -1.2
Portfolio investment 0.3 0.6 0.5 0.8 -0.6 -0.7 -0.1 -0.1 -0.1 -0.1 -0.1
Other investment 0.1 -3.0 0.7 -2.6 -4.3 -3.3 -1.4 0.0 0.1 0.3 0.3
Errors and omissions 1/ -0.2 -1.0 -0.7 -1.0 -1.7 0.0 0.0 0.0 0.0 0.0 0.0
Overall balance 5.2 1.1 4.5 1.1 -3.1 -2.0 -1.0 -0.5 -0.7 -0.5 -0.4
Reserve assets -5.2 -1.1 -4.5 -1.1 3.1 2.0 1.0 0.5 0.7 0.5 0.4
International investment position:
Asset 62.9 60.8 62.1 61.0 55.6 56.9 56.1 55.1 53.5 51.6 49.8
Direct investment 5.6 6.2 6.9 8.4 10.1 12.1 13.8 15.6 16.9 17.7 18.3
Secuirties investment 2.7 2.8 2.7 2.5 2.3 2.9 3.4 3.7 4.0 4.2 4.3
Other investment 11.3 12.3 12.3 13.2 12.7 13.8 14.0 13.5 13.0 12.4 11.9
Reserve assets 43.3 39.5 40.3 36.9 30.5 28.0 24.9 22.2 19.6 17.3 15.3
Liability 40.5 39.0 41.4 45.8 41.3 40.4 39.3 38.3 37.2 36.1 35.0
Direct investment 25.4 24.1 24.2 24.6 25.4 26.8 26.2 25.1 23.9 22.5 21.4
Secuirties investment 3.3 3.9 4.0 7.5 7.2 7.1 7.1 7.1 7.0 6.8 6.6
Other investment 11.8 11.0 13.2 13.6 8.6 6.6 5.9 6.1 6.4 6.7 7.0
Net international investment position 22.4 21.8 20.7 15.2 14.3 16.5 16.9 16.7 16.3 15.5 14.8
Memorandum items:
Export growth (value terms) 21.6 9.2 8.9 4.4 -4.5 -4.2 2.5 2.9 3.4 4.0 3.8
Import growth (value terms) 27.3 5.2 7.7 1.1 -12.9 -6.2 4.6 3.0 3.2 3.7 3.1
FDI (inward) 3.7 2.8 3.0 2.5 2.2 1.8 1.5 1.2 1.0 0.9 0.8
External debt (Billion of US$) 1,047.1 1,162.8 1,532.8 1,788.1 1,416.2 1,154.2 1,175.3 1,317.4 1,480.0 1,673.5 1,868.1
As a percent of GDP 13.9 13.6 15.9 16.9 12.7 10.2 9.6 9.8 10.0 10.3 10.5
Short-term external debt (Billion of US$, remaining maturity) 754.6 853.5 1,201.5 1,311.3 920.6 720.6 733.2 817.1 913.0 1,021.4 1,130.3
Gross reserves (Billion of US$) 2/ 3,255.8 3,387.9 3,880.4 3,899.3 3,406.1 3,181.4 3,063.6 2,993.4 2,889.8 2,813.1 2,739.9
As a percent of ST debt by remaining maturity 431.4 397.0 323.0 297.4 370.0 441.5 417.8 366.3 316.5 275.4 242.4
Real effective exchange rate (2010 = 100) 102.8 108.5 115.3 118.9 131.0 … … … … … …
Nominal GDP (Billion of US$) 7,522.2 8,570.3 9,635.2 10,557.6 11,181.6 11,354.8 12,279.6 13461 14777.4 16294.6 17852.9
Sources: CEIC Data Co., Ltd.; IMF, Information Notice System; and IMF staff estimates and projections.
1/ Includes counterpart transaction to valuation changes.
2/ Includes foreign currency reserves and other reserve assets such as SDRs and gold.
Projections

PEOPLE’S REPUBLIC OF CHINA
INTERNATIONAL MONETARY FUND 41
Table 3. China: External Vulnerability Indicators
2011 2012 2013 2014 2015
Monetary and financial indicators
General government debt (in percent of GDP) 1/ 15.2 15.2 15.9 38.5 38.3
Broad money (M2: annual percentage change) 17.3 14.4 13.6 11.0 13.3
Foreign currency deposits to broad money (percent) 2.0 2.6 2.4 2.9 2.9
Local currency loans to the economy (annual percentage change) 15.8 15.0 14.1 13.6 14.3
Foreign currency loans to credit to the economy (in percent) 5.0 5.3 5.1 4.7 4.0
Stock exchange index (end-of-period, December 19, 1990 = 100) 2/ 2,304 2,376 2,214 3,389 3,704.3
Stock exchange capitalization (percent of GDP) 54.2 53.5 51.6 70.3 94.8
Number of listed companies (A-share) 2,320 2,472 2,468 2,592 2,808
Balance of payments indicators
Exports (annual percentage change, U.S. dollars) 21.6 9.2 8.9 4.4 -4.5
Imports (annual percentage change, U.S. dollars) 27.3 5.2 7.7 1.1 -12.9
Current account balance (percent of GDP) 1.8 2.5 1.5 2.6 3.0
Capital and financial account balance (percent of GDP) 3.5 -0.4 3.6 -0.5 -4.3
Of which : gross foreign direct investment inflows 3.7 2.8 3.0 2.5 2.2
Reserve indicators
Gross reserves (billions of U.S. dollars) 3/ 3,256 3,388 3,880 3,899 3,406
Gross reserves to imports of goods & services (months) 28.3 22.3 24.0 22.1 18.1
Gross reserves to broad money (M2) (percent) 24.7 22.0 21.7 19.5 15.2
Gross reserves to short-term external debt by remaining maturity (percent) 431.4 397.0 323.0 297.4 370.0
External debt and balance sheet indicators
Total external debt (percent of GDP) 13.9 13.6 15.9 16.9 12.7
Total external debt (billions of U.S. dollars) 1,047.1 1,162.8 1,532.8 1,788.1 1,416.2
Short-term external debt by original maturity (billions of U.S. dollars) 754.6 853.5 1,201.5 1,311.3 920.6
Net foreign assets of banking sector (billions of U.S. dollars) 259.9 300.4 177.3 189.4 443.8
Total debt to exports of goods & services (percent) 52.1 53.5 65.1 70.8 58.3
Total debt service to exports of goods & services (percent) 25.2 25.1 28.9 51.6 38.1
Of which : Interest payments to exports of goods & services (percent) 0.3 0.2 0.2 0.2 0.2
Foreign-currency long-term sovereign bond ratings (eop)
Moody's Aa3 Aa3 Aa3 Aa3 Aa3
Standard and Poor's AA- AA- AA- AA- AA-
Memorandum items:
International investment position (billions of U.S. dollars) 1,688.4 1,866.5 1,996.0 1,776.4 1,769.5
Nominal GDP (billions of U.S. dollars) 7,522 8,570 9,635 10,558 11,182
Exports of goods & services (billions of U.S. dollars) 2,009 2,175 2,356 2,524 2,429
Real effective exchange rate (annual percentage change) 2.8 5.6 6.3 3.1 10.1
Sources: CEIC Data Co. Ltd; Bloomberg; IMF, Information Notice System; and IMF staff estimates.
2/ Shanghai Stock Exchange, A-share.
3/ Includes foreign currency reserves and other reserve assets such as SDRs and gold.
1/ Estimates of debt levels before 2015 include central government debt and explicit local government debt (identified by MoF and NPC in Sep 2015). The
large increase in general government debt in 2014 reflects the authorities' recognition of the off-budget local government debt borrowed previously. The
estimation of debt level in 2015 assumes zero off-budget borrowing during 2015.

PEOPLE’S REPBULIC OF CHINA
42 INTERNATIONAL MONETARY FUND
Table 4. China: Monetary and Credit Developments
2011 2012 2013 2014 2015
MONETARY SURVEY
Net foreign assets 11.3 2.9 8.6 2.6 -2.7 -7.7
Monetary authority (contribution) 9.1 1.9 11.7 2.4 -8.6 -10.8
Depository institutions (contribution) 2.3 1.0 -3.1 0.3 5.9 3.1
Domestic credit 17.1 17.1 15.1 16.2 23.7 25.4
Claims on government, net (contribution) 1.3 1.2 -0.2 0.6 4.0 4.3
Claims on nonfinanical sectors (contribution) 13.4 13.6 12.7 11.4 13.8 12.8
Claims on other financial sectors (contribution) 2.4 2.3 2.6 4.1 5.9 8.2
Broad money (M2) 17.3 14.4 13.6 11.0 13.3 13.4
M1 (contribution) 3.2 2.2 2.9 1.0 4.3 5.8
Quasi-money (contribution) 14.1 12.2 10.7 10.0 9.0 7.6
Reserve money 21.2 12.3 7.4 8.5 -6.0 -4.2
TOTAL SOCIAL FINANCING
TSF 1/ 18.1 19.1 17.5 14.3 12.4 13.4
Bank loans (contribution) 12.1 11.5 10.0 9.2 8.8 9.1
Shadow banking (contribution) 3.1 4.0 5.1 2.3 0.6 0.6
Net corporate bond financing (contribution) 2.1 3.0 2.0 2.2 2.4 2.9
Non-financial enterprise equity (contribution) 0.7 0.3 0.2 0.4 0.6 0.7
Others (contribution) 0.2 0.2 0.2 0.2 0.0 0.0
TSF 1/ 157.9 169.0 180.0 189.5 198.4 204.7
Bank loans 117.3 121.8 125.7 130.9 137.5 141.7
Shadow banking 23.0 26.4 31.7 33.1 31.8 32.2
Net corporate bond financing 10.7 13.8 15.6 18.0 21.0 22.5
Non-financial enterprise equity 6.0 5.8 5.6 5.9 6.5 6.8
Others 0.9 1.1 1.4 1.6 1.5 1.5
MEMORANDUM ITEMS
Nonperforming loans ratio 1.0 1.0 1.0 1.3 1.7 1.8
Provision coverage ratio 278.1 295.5 282.7 232.1 181.2 175.0
Liquidity ratio 43.2 45.8 44.0 46.4 48.0 48.1
Loan to deposit ratio 64.9 65.3 66.1 65.1 67.2 67.0
Return on assets 1.3 1.3 1.3 1.2 1.1 1.2
Return on equity 20.4 19.9 19.2 17.6 15.0 15.9
Capital adequacy ratio … … 12.2 13.2 13.5 13.4
Tier 1 capital adequacy ratio … … 10.0 10.8 11.3 11.4
Core tier 1 capital adequacy ratio … … 10.0 10.6 10.9 11.0
Sources: Haver Analytics; and IMF staff estimates.
1/ After adjusting local government debt swap, staff estimate that TSF grew by 15.9 percent (y/y) and stood at 209.3 percent of GDP as of
2016Q1.
(In percent of GDP)
(In percent)
2016Q1
(Annual percentage change)
(Annual percentage change)

PEOPLE’S REPUBLIC OF CHINA
INTERNATIONAL MONETARY FUND 43
Table 5. China: General Government Fiscal Data
In RMB billions 2011 2012 2013 2014 2015 2016 2017 2018 2019 2020 2021
Fiscal balance
Authorities' definition
(1) Revenue 1/ 10537 12020 13036 14137 16027 15892 17421 18760 20190 21808 23553
(2) Expenditure 2/ 11387 12820 14276 15497 17647 18072 19930 21363 23012 24829 26841
(3) Fiscal balance (Authorities) (1)-(2) -850 -800 -1240 -1360 -1620 -2180 -2509 -2603 -2822 -3020 -3288
In percent of GDP 3/ -1.7 -1.5 -2.1 -2.1 -2.3 -2.9 -3.1 -3.0 -3.0 -3.0 -3.0
Staff estimates
(4) Revenue 13081 15016 16538 18158 19944 20735 22514 24114 25819 27728 29778
(5) Expenditure 14234 16838 18651 20463 22995 24202 26247 27882 29740 31855 34181
(5a) Authorities definition of expenditure 11387 12820 14276 15497 17647 18072 19930 21363 23012 24829 26841
Of which: interest payment 238 264 306 359 404 589 861 1145 1391 1492 1596
(5b) (+) Social security expenses 1888 2393 2862 3367 3936 4355 4529 4710 4898 5094 5298
(5c) (+) Transfers to state-administered SOE fund 116 140 151 200 208 226 235 244 254 264 275
(5d) (+) Adjustment for local government spending 200 250 0 0 0 0 0 0 0 0 0
(5f) (+) Local government spending financed by net land sale proceeds 4/ 1105 1459 1617 1717 1175 1220 1230 1250 1269 1370 1480
(5i) (-) contribution to stabilization funds 289 25 116 82 70 70 77 85 93 102 113
(5j) (-) Other adjustment 2/ 173 200 138 237 -100 -400 -400 -400 -400 -400 -400
General government net borrowing/lending (4)-(5)+(5f) -47 -363 -497 -587 -1877 -2247 -2503 -2519 -2652 -2757 -2923
(In percent of GDP) -0.1 -0.7 -0.8 -0.9 -2.7 -3.0 -3.1 -2.9 -2.9 -2.8 -2.7
(6) Fiscal balance (staff estimate) (4)-(5) -1153 -1822 -2113 -2305 -3051 -3467 -3733 -3769 -3921 -4127 -4403
(In percent of GDP) -2.4 -3.4 -3.5 -3.6 -4.4 -4.6 -4.7 -4.4 -4.2 -4.1 -4.1
Estimates of augmented balances
(6) Overall fiscal balance -1153 -1822 -2113 -2305 -3051 -3467 -3733 -3769 -3921 -4127 -4403
(6a) (-) Estimate of additional local government infrastructure spending financed by debt 2847 2395 4061 4072 3571 4050 4100 4205 4250 4308 4208
(7) Augmented balance -3999 -4217 -6175 -6377 -6623 -7517 -7833 -7974 -8171 -8435 -8611
(In percent of GDP) -8.2 -7.8 -10.3 -9.8 -9.5 -10.1 -9.8 -9.3 -8.8 -8.4 -8.0
of which: interest payment on LGFV borrowings 758 975 1161 1423 1557 1582 1518 1457 1471 1759 2051
(5f) (+) Net land sale proceeds 4/ 1105 1459 1617 1717 1175 1220 1230 1250 1269 1370 1480
(8) Augmented net lending/borrowing 5/ -2894 -2757 -4558 -4659 -5448 -6297 -6603 -6724 -6902 -7065 -7132
(In percent of GDP) -6.0 -5.1 -7.6 -7.2 -7.8 -8.4 -8.2 -7.8 -7.4 -7.0 -6.6
General government debt
(12) Central government debt 7204 7757 8675 9566 10660 11657 13760 15879 18131 20488 22891
In percent of GDP 18.6 17.7 17.6 14.8 15.3 15.6 17.2 18.4 19.5 20.4 21.1
(13) Local government debt 6/ 13249 15894 19955 24045 28217 33447 37947 42552 47202 51910 56638
(12)+(13) Augmented debt 22273 25470 30450 33611 38877 45103 51707 58430 65332 72398 79529
In percent of GDP 45.8 47.1 51.0 51.8 55.8 60.4 64.5 67.8 70.4 72.2 73.5
General government debt (staff estimate) 7/ 16081 18405 22045 25830 29885 34738 39951 45249 50710 56314 62018
In percent of GDP 33.1 34.0 36.9 39.8 42.9 46.5 49.9 52.5 54.6 56.2 57.3
General government debt (including only explicit government debt, assume no off-budget
borrowing from 2015) 8/ 7404 8207 9475 24966 26660 28837 31340 33859 36511 39268 42191
In percent of GDP 15.2 15.2 15.9 38.5 38.3 38.6 39.1 39.3 39.3 39.2 39.0
Sources: CEIC, Data Co. Ltd.; China Ministry of Finance; NAO; and IMF staff estimates and projections.
1/ Includes central and local governments' withdrawal from budget stabilization funds.
2/ Includes adjustments for local government balance carried forward, redemption of local government bonds and government bond issued under government managed funds.
3/ GDP in this table refers to expenditure side nominal GDP.
4/ Net land sale proceeds refer to the portion used to finance current and infrastructure spending, which is estimated by subtracting the acquisition cost, compensation to farmers, and land
development from the gross land sale proceeds.
5/ The overall net lending/borrowing includes net land sale proceeds as a decrease in nonfinancial assets recorded above the line.
6/ Includes local government bonds and other market financing through the use of local government financing vehicles (LGFVs).
7/ Staff estimates are based on the explicit debt and fractions (less than 19 percent according to the NAO estimate) of the government guaranteed debt and liabilities that the government may incur.
8/ Estimates of debt levels before 2015 include central government debt and explicit local government debt (identified by MoF and NPC in Sep 2015). The large increase in general government debt in 2014 reflects the authorities'
recognition of the off-budget local government debt borrowed previously. The estimation of debt levels after 2015 assumes zero off-budget borrowing from 2015 to 2021.
Projections

PEOPLE’S REPBULIC OF CHINA
44 INTERNATIONAL MONETARY FUND
Table 6. China: Nonfinancial Sector Debt
2014 2015 2014 2015
Total 134 153 206 220
Central government 10 11 15 15
Local government
Regular financing 1 2 2 2
Former LGFV debt 1/ 14 14 22 21
Local government financing vehicles (LGFV)
Likely to be recognized
As per the 2014 audit 1 1 1 1
New borrowing in 2015 (staff estimate) 2/ 3/ 0 2 0 3
Unlikely to be recognized
As per the 2014 audit 8 8 12 11
New borrowing in 2015 (staff estimate) 2/ 3/ 0 1 0 2
Households 23 27 35 38
Corporates (excluding LGFV)
Domestic 73 84 113 120
External 4 4 6 6
Memo items:
Corporates (including LGFV) 86 100 133 144
Households 23 27 35 38
General government (MOF definition) 25 27 39 38
Nominal GDP 65 70
Sources: CEIC Data Co., Ltd.; Ministry of Finance and IMF staff estimates.
1/ LGFV debt recognized as LG debt as of 2014 (by the 2014 audit).
2/ New LGFV borrowing estimate for 2015 is based on infrastructure fixed asset investment data.
3/ Relative share of “likely to be recognized” new LGFV borrowing is based on the historical recognition ratio.
Private
Sector Debt
MOF GG
Debt
Staff GG
DebtAugmented
Debt
Adjusted
TSF
excluding
equity
financing (=
TSF - equity
financing +
LG bond
swap)
Coverage
(In RMB trillion) (In percent of GDP)

Overall Assessment A
pp
en
dix
I. Ch
ina: E
xte
rnal S
ecto
r Rep
ort
Foreign asset
and liability
position and
trajectory
Background. Gross foreign assets, at 56 percent of GDP by end-2015, are dominated by foreign reserves, while gross liabilities, at 41 percent of GDP, mainly represent FDI liabilities. Reserve assets fell to US$3.33 trillion by end-2015 and to US$3.19 by May 2016 (about 28.5 percent of 2015 GDP), from US$3.84 trillion at end-2014 (about 36.4 percent of 2014 GDP), due to net sales of reserve assets and valuation losses. Net IIP has declined from 15.2 percent of GDP in 2014 to 14.3 percent of GDP at end-2015; the ratio has been declining since the global financial crisis in light of the much-reduced current account (CA) surpluses, valuation changes, and still fast growth of GDP.
Assessment. The NIIP to GDP ratio is expected to be close to 15 percent of GDP over the medium term, consistent with the CA surplus. The NIIP is not a major source of risk at this point, given the large foreign reserves and FDI-dominated liabilities. However, there is a possibility that capital outflow pressure could persist and reserves fall further.
Overall Assessment:
The external position in 2015 was moderately stronger compared with the level consistent with medium-term fundamentals and desirable policy settings. The renminbi was broadly in line with fundamentals and desirable policies, although its assessment is subject to a high degree of uncertainty. Developments through June 2016 do not suggest a change in this assessment. The assessment of the external position reflects still-large policy gaps that affect the saving-investment imbalance, such as social spending. The uncertainties about the assessment of renminbi reflect factors outside the models such as shifts in expectations and the nature of recent capital flows.
Potential policy responses:
External imbalances have declined considerably since the global financial crisis. Achieving a lasting balance in the external position—will require continued progress in closing the remaining domestic policy gaps. Success will move the economy to a more sustainable growth path, with higher consumption and lower overall saving. This can be achieved through successful implementation of the authorities’ reform agenda as well as consistent macroeconomic policies. Priorities include improving the social safety net; increasing on-budget fiscal support; SOE reform and opening markets to more competition; creating a more market-based financial system; and achieving a flexible, market-based exchange rate with a better communication strategy. Continuing the move toward a more market-based and transparent monetary policy framework is a key element in ensuring an orderly transition to a float, which may also require use of foreign exchange reserves to some degree to smooth excessive volatility not justified by fundamentals.
Current
account
Background. The CA surplus in 2015 was 3.0 percent of GDP (3.0 percent of GDP cyclically adjusted), which was about 0.3 percent of GDP higher than 2014. The increase of the CA surplus was mainly due to weak real import growth and favorable terms of trade (the gain was about 1 percent of GDP in 2015), and occurred despite sizeable REER appreciation and a rise in outward tourism. In a longer perspective, the CA surplus has fallen substantially relative to its peak of about 10 percent of GDP in 2007, reflecting strong investment growth, REER appreciation, weakness in major advanced economies, and, more recently, a trend widening of the services deficit.
Assessment. The EBA CA regression approach estimates that the cyclically-adjusted CA is stronger (by about 2.4 percent of GDP) than consistent with medium-term fundamentals and desirable policies. While the estimated total policy gap has declined substantially, mainly driven by the change in FX intervention, fiscal policy, social spending and credit growth gaps remain. The total gap is mostly driven by the residual, reflecting factors not captured by EBA, including distortions that encourage excessive savings. There is also large uncertainty about China’s cyclical position. As a result, staff assesses the CA gap is 1-3 percent of GDP stronger than implied by fundamentals and desirable policies. 1/
Real exchange
rate
Background. In 2015, the average REER appreciated by about 10 percent relative to the 2014 average, mainly driven by the appreciation in the NEER, and reflecting the link to the US dollar. Through June 2016, again driven by the change of NEER, the REER has depreciated by 6 percent relative to its 2015 average. 2/
Assessment. The EBA REER index regression estimates China’s REER to be 3.9 percent stronger than levels warranted by fundamentals and desirable policies. This gap (as well as the minus 0.1 percent policy gap) is small relative to the statistical errors of EBA regressions, suggesting that the REER is broadly in line with fundamentals and desirable policy settings. However, this assessment is subject to large uncertainties. This is because the EBA framework, with its focus on factors underlying the savings-investment balance, does not capture other factors potentially affecting demand for a country’s assets, such as diverging market views on the outlook and shifts in portfolio allocation preferences. 3/ Overall, staff assesses the REER to be -10 to +10 percent different from the level consistent with fundamentals and desirable policies.
Capital and
financial
accounts:
flows and
policy
measures
Background. In the past year, China has liberalized its financial account further, including the granting of onshore access to official sector investors. China’s financial account has been relatively open in FDI and other investment. Nonetheless, restrictions remain, particularly with respect to portfolio flows. After a long period of net capital inflows (averaging US$80 billion per year over 2000-14), the financial account recorded a net outflow of US$673 billion in 2015. Net direct investment flows remained positive—at US$ 62 billion—but well below the 2000-14 average (US$114 billion). The large deficit in errors and omissions are included as capital outflows as they are likely to be unrecorded capital rather than current account transactions.
Assessment. Over the medium term, a well-sequenced loosening of capital controls consistent with domestic financial liberalization and exchange rate flexibility would be appropriate. The further opening of the capital account is likely to lead to sizable gross flows in both directions. The adjustment path is hard to predict, and equilibrating such balance sheet adjustments and shifts in market sentiment argues for moving to a flexible exchange rate as soon as practical, while also using foreign reserves to a limited degree in the interim to smooth excessive volatility not justified by fundamentals.
INTER
NA
TIO
NA
L MO
NETA
RY F
UN
D
45
PEO
PLE
'S R
EP
UB
LIC O
F C
HIN
A
FX
intervention
and reserves
level
Background. After a long period of reserve accumulation, FX reserves declined by US$513 billion (4.6 percent of GDP) in 2015, of which intervention accounted for about US$342 billion (3.1 percent of GDP). FX reserves further declined by US$139 billion to US$3.19 trillion (about 28.5 percent of 2015 GDP) at end-May 2016.
Assessment. Reserves stood at 118 percent of the IMF’s composite metric unadjusted for capital controls at end-2015 (down from 149 percent in 2014); relative to the metric adjusted for capital controls, reserves stood at 190 percent (down from 238 percent in 2014). Given China’s progress in capital account liberalization, the appropriate metric is shifting toward the one unadjusted for capital controls. By any metric, the current reserve level thus remains adequate, although the rapid decrease of reserves since August, if continued, could alter this assessment.
Technical Background Notes
1/ The total CA gap from EBA is 2.4 percent of GDP for 2015, smaller than the gap in 2014 (3.1 percent of GDP). The contribution of identified total policy gaps is minus 0.3 percent of GDP (versus 1.8 percent of GDP in 2014), but individual policy gaps remain in health expenditure, fiscal policy, FX intervention and capital controls. The EBA REER Index model estimates a total REER gap of 3.9 percent, with identified policy gaps of minus 0.1 percent. The EBA REER Level model estimates a total REER gap of 16.3 percent, with identified policy gaps of 2.9 percent. However, that estimate is discarded from consideration, as the model fit of the EBA Level model is very poor for China.
2/ In August 2015, the PBC required market makers to submit quotes that take account of the closing (onshore) spot rate of the previous day as well as supply and demand in the market, for determining the central parity of the +/-2 percent trading band that it announces before the market opens. Previously, market makers were supposed to quote to the PBOC exchange rates based on their sense of the market in the morning, an opaque system that allowed substantial discretion and, in practice, resulted in the central parity barely moving from day to day, even though the market rate had often closed at some distance from it the previous day.
3/ For example, changing expectations about monetary and exchange rate policy, re-evaluation of a government’s reform agenda, or a desire by residents to diversity into foreign assets can trigger large changes in capital flows and exchange rate pressures, even in the absence of significant changes in fundamentals as captured by EBA (GDP growth, employment, etc). China currently appears to have recently experienced such capital account pressures on the exchange rate that are not well explained by the EBA framework.
PEO
PLE
'S R
EP
BU
LIC O
F C
HIN
A
46
IN
TER
NA
TIO
NA
L MO
NETA
RY F
UN
D

PEOPLE’S REPUBLIC OF CHINA
INTERNATIONAL MONETARY FUND 47
Appendix II. Debt Sustainability Analysis
Because of uncertainty about the size of contingent liabilities, the debt sustainability analysis assesses
government debt under narrow and broad definitions. While government debt under the narrow definition
remains low and sustainable, “augmented” debt (broad definition) is on a slight upward trajectory in the
baseline. The risk of debt stress depends on the implementation of the new budget law, which aims to curb
off-budget spending of local governments.
China’s public debt sustainability analysis (DSA) is based on the following assumptions:
Public debt coverage. Two definitions of government debt are used. The main difference is the
coverage of local government debt.
o The narrow coverage scenario includes central government debt and “on-budget” local
government debt identified by the authorities. For 2004–13, general government debt includes
central government debt and local government bonds (issued by the central government). From
2014, general government debt includes central government debt and explicit local government
debt (which consists of local government bonds and other off-budget liabilities incurred by
end-2014). The change of definitions in 2014 is mainly a result of the change of official data
coverage.
o “Augmented” debt is used in the broad coverage scenario. It adds other types of local government
borrowing, including off-budget liabilities (explicit or contingent) borrowed by Local Government
Financing Vehicles (LGFVs) via bank loans, bonds, trust loans and other funding sources, estimated
by staff. The augmented deficit is the flow counterpart of augmented debt. Augmented fiscal data
are a complement to general government data. Since some nongovernment activity is likely
included, the augmented debt and deficit estimates should be viewed as an upper bound.
Macroeconomic assumptions:
The projection reflects a gradual slowdown of real GDP growth to a more sustainable level (about
6 percent y/y by 2021) and GDP deflator of about 2 percent. The fiscal assumptions differ in the scenarios
with general government debt or augmented debt.
o Fiscal balance in the narrow coverage scenario. Because only on-budget liabilities are included in
this scenario, the projected fiscal deficits are the same as the projected on-budget deficits. This will
only be the case if the new budget law is strictly implemented and all spending is on budget. In
particular, the fiscal deficits are assumed to decline from around 3 percent of GDP in 2016 and
2017 (reflecting the fiscal support for restructuring the overcapacity industries) to around
2¾ percent of GDP in 2021.
o Fiscal balance in the broad coverage scenario. The decline of off-budget local government
spending is assumed to be gradual (instead of being immediate, as in the narrow coverage
scenario). The augmented fiscal deficit, which includes the on-budget fiscal deficit and off-budget
spending financed by land sales revenue and debt, is projected to decline from around 10 percent
PEOPLE’S REPBULIC OF CHINA
48 INTERNATIONAL MONETARY FUND
of GDP in 2016 to around 8 percent of GDP by 2021. The local government expenditure to GDP
ratio is projected to decline owing to: (i) lower expenditure financed by net land sales; and (ii) the
authorities’ reforms to limit local government borrowing.
o Local government financing. While many local governments relied on net revenue from land sales
and LGFV borrowing to finance their investment in the past, the DSA assumes that future financing
needs will be increasingly met by bond issuance, in line with the authorities’ plan to replace all
local government debt with bonds within three years.
o Interest rates and amortization. The interest rates for central government and local government
bonds are assumed to be about 3–4 percent (in line with historical average). The interest rates of
off-budget borrowing (only in the augmented scenario) are assumed to be about 6–7 percent
(based on the yield differential between sovereign bond and LGFV bond). The amortization profile
is not central to the analysis because we assume all maturing debt will be rolled over.
In the narrow coverage scenario, general government debt is on a declining path.
General government debt under narrow coverage is broadly stable at around 39-40 percent of GDP
over the projection period. Off-budget local government spending is assumed to stop immediately
after the implementation of the new budget law in 2015. The growth-interest rate differential
contributes to the decline of debt-to-GDP ratio.
It should be noted that the general government debt-to-GDP ratios (under the narrow coverage) are
higher than that in the 2015 DSA. This is because the authorities included the off-budget local
government debt borrowed before end-2014 into the official statistics since September 2015.
But in the broad coverage scenario, debt continues to rise.
Augmented debt, however, rises to about 74 percent of GDP in 2021 from around 55 percent of GDP
in 2015. This is because the broad coverage scenario assumes that local government off-budget
spending continues after 2015 (although expected to gradually decline in the medium term). It should
be noted, however, the augmented debt measures an “upper bound” of the government liabilities,
because some of the LGFV borrowing is potentially on a commercial basis (thus should not be treated
as government liabilities).
China faces relatively low risks to debt sustainability, but is vulnerable to contingent liability shocks.
In the narrow coverage scenario, general government debt remains relatively low and on a stable path
in all standard stress tests except for the scenario with contingent liability shocks. A contingent liability
shock in 2017 will result in a sharp increase from about 40 percent of GDP in 2015 to about 64 percent
of GDP in 2018.1 While the debt level is still manageable, the authorities would potentially have to deal
1 Mechanically, the standard contingent liability shock in IMF DSA toolkit assumes that 10 percent of banking system assets
stock would turn into government liabilities. The banking system assets stock was about 210 percent of GDP in 2015. It also
assumes that the real GDP growth in 2017 and 2018 would be 2–2.5 percent lower.

PEOPLE’S REPUBLIC OF CHINA
INTERNATIONAL MONETARY FUND 49
with an increase in gross financing needs that could be sensitive to market financing conditions.
Without any extra fiscal consolidation, the debt-to-GDP ratio will stay around 66 percent of GDP over
the medium term under a contingent liability shock. In the broad coverage scenario, the augmented
debt level is also sensitive to a contingent liability shock (beyond those already captured in the
broader coverage), which would push debt to around 100 percent of GDP in 2021.
China’s debt profile will largely depend on the implementation of the new budget law.
Based on the projected debt dynamics under the narrow coverage, China’s debt profile is still
manageable, especially given most of the public debt stock is financed domestically.
However, the debt profile crucially depends on the implementation of the new budget law, as it
determines whether the debt dynamics will be closer to the narrow coverage scenario or broad
coverage scenario. If the new budget law is strictly implemented and future LGFV borrowing will be
completely on a commercial basis, the debt-to-GDP will be stable around 40 percent of GPD. However,
if local governments still incur off-budget liabilities,2 the debt profile will move closer to that in the
broad coverage scenario and the debt-to-GDP ratio will continue to rise in the medium term.
2 This can happen in many forms. For example, the National Development and Reform Commission recently launched a
special fund for financing local investment and local entities can use it to leverage more borrowing from commercial banks.
If local governments are eventually held responsible for the repayment, it could potentially be a substitute of the LGFV
borrowing observed in the past.

PEOPLE’S REPBULIC OF CHINA
50 INTERNATIONAL MONETARY FUND
China: Public Sector Debt Sustainability Analysis (General Government Debt Under Narrow Coverage)
(In percent of GDP, unless otherwise indicated)
As of June 12, 20152/
2014 2015 2016 2017 2018 2019 2020 2021 Sovereign Spreads
Nominal gross public debt 17.2 38.5 38.3 38.6 39.1 39.3 39.3 39.2 39.0 EMBIG (bp) 3/ 138
Public gross financing needs 9.5 10.6 10.2 12.9 11.2 10.9 10.2 3.8 3.7 5Y CDS (bp) 126
Real GDP growth (in percent) 10.3 7.3 6.9 6.6 6.2 6.0 6.0 5.9 5.8 Ratings Foreign Local
Inflation (GDP deflator, in percent) 4.8 1.2 0.4 0.7 0.9 1.4 1.6 2.0 2.1 Moody's Aa3 Aa3
Nominal GDP growth (in percent) 15.6 8.6 7.4 7.3 7.2 7.5 7.7 8.0 8.0 S&Ps AA- AA-
Effective interest rate (in percent) 4/ 10.6 18.8 6.8 6.0 5.3 4.7 4.3 4.2 4.2 Fitch A+ A+
2014 2015 2016 2017 2018 2019 2020 2021 Cumulative
Change in gross public sector debt -0.4 22.6 -0.2 0.3 0.5 0.2 0.0 -0.2 -0.2 0.7
Identified debt-creating flows -1.8 -0.4 -0.6 0.3 0.5 0.2 0.0 -0.2 -0.2 0.7
Primary deficit -1.0 -1.8 0.2 0.9 1.2 1.2 1.3 1.2 1.2 7.0
Primary (noninterest) revenue and grants 22.8 28.0 28.6 27.8 28.1 28.0 27.8 27.7 27.5 166.8
Primary (noninterest) expenditure 21.8 26.2 28.9 28.6 29.3 29.2 29.1 28.9 28.7 173.9
Automatic debt dynamics 5/
-0.8 1.5 0.2 -0.5 -0.7 -1.0 -1.3 -1.4 -1.4 -6.2
Interest rate/growth differential 6/
-0.8 1.5 0.2 -0.5 -0.7 -1.0 -1.3 -1.4 -1.4 -6.2
Of which: real interest rate 0.8 2.6 2.6 1.9 1.5 1.2 0.9 0.8 0.7 7.0
Of which: real GDP growth -1.6 -1.1 -2.5 -2.3 -2.2 -2.2 -2.2 -2.1 -2.1 -13.2
Exchange rate depreciation 7/
0.0 0.0 0.0 … … … … … … …
Other identified debt-creating flows 0.0 0.0 -1.1 -0.1 0.0 0.0 0.0 0.0 0.0 -0.1
Net privatization proceeds (negative) 0.0 0.0 -1.1 -0.1 0.0 0.0 0.0 0.0 0.0 -0.1
Contingent liabilities 0.0 0.0 0.0 0.0 0.0 0.0 0.0 0.0 0.0 0.0
Others 0.0 0.0 0.0 0.0 0.0 0.0 0.0 0.0 0.0 0.0
Residual, including asset changes 8/
1.4 23.0 0.4 0.0 0.0 0.0 0.0 0.0 0.0 0.0
Source: IMF staff.
1/ Public sector is defined as general government.
2/ Based on available data. The large increase in public debt in 2014 reflects the authorities' recognition of the off-budget local government debt borrowed previously.
3/ Long-term bond spread over U.S. bonds.
4/ Defined as interest payments divided by debt stock (excluding guarantees) at the end of previous year.
5/ Derived as [(r - π(1+g) - g + ae(1+r)]/(1+g+π+gπ)) times previous period debt ratio, with r = interest rate; π = growth rate of GDP deflator; g = real GDP growth rate;
a = share of foreign-currency denominated debt; and e = nominal exchange rate depreciation (measured by increase in local currency value of U.S. dollar).
6/ The real interest rate contribution is derived from the numerator in footnote 5 as r - π (1+g) and the real growth contribution as -g.
7/ The exchange rate contribution is derived from the numerator in footnote 5 as ae(1+r).
8/ Includes asset changes and interest revenues (if any). For projections, includes exchange rate changes during the projection period.
The large residual in 2014 reflects the authorities' recognition of the off-budget local government debt borrowed by end-2014.
9/ Assumes that key variables (real GDP growth, real interest rate, and other identified debt-creating flows) remain at the level of the last projection year.
-1.4
balance 9/
primary
Debt, Economic, and Market Indicators 1/
2005-2013
Actual
Projections
Contribution to Changes in Public Debt
Projections
2005-2013
Actual
Debt-stabilizing
-10
-5
0
5
10
15
20
25
30
2005 2006 2007 2008 2009 2010 2011 2012 2013 2014 2015 2016 2017 2018 2019 2020 2021
Debt-Creating Flows
Primary deficit Real GDP growth Real interest rate Exchange rate depreciation
Other debt-creating flows Residual Change in gross public sector debt
projection
(In percent of GDP)
-15
-10
-5
0
5
10
15
20
cumulative

PEOPLE’S REPUBLIC OF CHINA
INTERNATIONAL MONETARY FUND 51
China: Public DSA—Composition of General Government Debt (Narrow Coverage) and
Alternative Scenarios
Baseline scenario 2016 2017 2018 2019 2020 2021 Historical scenario 2016 2017 2018 2019 2020 2021
Real GDP growth 6.6 6.2 6.0 6.0 5.9 5.8 Real GDP growth 6.6 9.6 9.6 9.6 9.6 9.6
Inflation 0.7 0.9 1.4 1.6 2.0 2.1 Inflation 0.7 0.9 1.4 1.6 2.0 2.1
Primary balance -0.9 -1.2 -1.2 -1.3 -1.2 -1.2 Primary balance -0.9 1.1 1.1 1.1 1.1 1.1
Effective interest rate 6.0 5.3 4.7 4.3 4.2 4.2 Effective interest rate 6.0 5.3 5.7 6.2 7.0 7.2
Constant primary balance scenario Contingent liability shock 2/
Real GDP growth 6.6 6.2 6.0 6.0 5.9 5.8 Real GDP growth 6.6 3.9 3.7 6.0 5.9 5.8
Inflation 0.7 0.9 1.4 1.6 2.0 2.1 Inflation 0.7 0.3 0.8 1.6 2.0 2.1
Primary balance -0.9 -0.9 -0.9 -0.9 -0.9 -0.9 Primary balance -0.9 -22.2 -1.2 -1.3 -1.2 -1.2
Effective interest rate 6.0 5.3 4.7 4.3 4.2 4.2 Effective interest rate 6.0 6.0 7.2 6.7 6.5 6.3
2/ The contingent liability shock scenario also assumes that 10 percent of banking assets would turn into government liabilities.
1/ The large increase in public debt in 2014 reflects the authorities' recognition of the off-budget local government debt borrowed previously.
Underlying Assumptions(In percent)
Alternative Scenarios
Composition of Public Debt 1/
Contingent liability shock
Baseline Historical Constant primary balance
0
10
20
30
40
50
60
70
2014 2015 2016 2017 2018 2019 2020 2021
Gross Nominal Public Debt
(In percent of GDP)
projection
0
5
10
15
20
25
30
35
2014 2015 2016 2017 2018 2019 2020 2021
Public Gross Financing Needs
(In percent of GDP)
projection
0
5
10
15
20
25
30
35
40
45
2005 2007 2009 2011 2013 2015 2017 2019 2021
By Maturity
Medium and long-term
Short-term
projection
(In percent of GDP)
0
5
10
15
20
25
30
35
40
45
2005 2007 2009 2011 2013 2015 2017 2019 2021
By Currency
Local currency-denominated
Foreign currency-denominated
projection
(In percent of GDP)
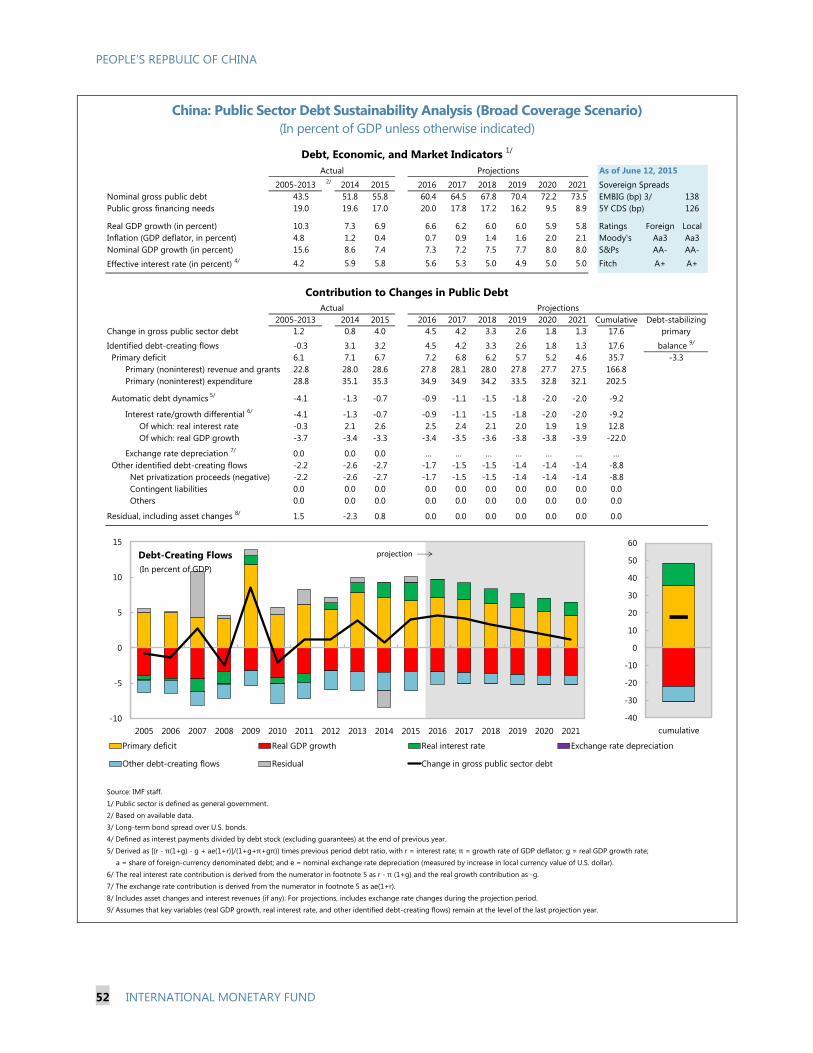
PEOPLE’S REPBULIC OF CHINA
52 INTERNATIONAL MONETARY FUND
China: Public Sector Debt Sustainability Analysis (Broad Coverage Scenario)
(In percent of GDP unless otherwise indicated)
As of June 12, 20152/
2014 2015 2016 2017 2018 2019 2020 2021 Sovereign Spreads
Nominal gross public debt 43.5 51.8 55.8 60.4 64.5 67.8 70.4 72.2 73.5 EMBIG (bp) 3/ 138
Public gross financing needs 19.0 19.6 17.0 20.0 17.8 17.2 16.2 9.5 8.9 5Y CDS (bp) 126
Real GDP growth (in percent) 10.3 7.3 6.9 6.6 6.2 6.0 6.0 5.9 5.8 Ratings Foreign Local
Inflation (GDP deflator, in percent) 4.8 1.2 0.4 0.7 0.9 1.4 1.6 2.0 2.1 Moody's Aa3 Aa3
Nominal GDP growth (in percent) 15.6 8.6 7.4 7.3 7.2 7.5 7.7 8.0 8.0 S&Ps AA- AA-
Effective interest rate (in percent) 4/ 4.2 5.9 5.8 5.6 5.3 5.0 4.9 5.0 5.0 Fitch A+ A+
2014 2015 2016 2017 2018 2019 2020 2021 Cumulative
Change in gross public sector debt 1.2 0.8 4.0 4.5 4.2 3.3 2.6 1.8 1.3 17.6
Identified debt-creating flows -0.3 3.1 3.2 4.5 4.2 3.3 2.6 1.8 1.3 17.6
Primary deficit 6.1 7.1 6.7 7.2 6.8 6.2 5.7 5.2 4.6 35.7
Primary (noninterest) revenue and grants 22.8 28.0 28.6 27.8 28.1 28.0 27.8 27.7 27.5 166.8
Primary (noninterest) expenditure 28.8 35.1 35.3 34.9 34.9 34.2 33.5 32.8 32.1 202.5
Automatic debt dynamics 5/
-4.1 -1.3 -0.7 -0.9 -1.1 -1.5 -1.8 -2.0 -2.0 -9.2
Interest rate/growth differential 6/
-4.1 -1.3 -0.7 -0.9 -1.1 -1.5 -1.8 -2.0 -2.0 -9.2
Of which: real interest rate -0.3 2.1 2.6 2.5 2.4 2.1 2.0 1.9 1.9 12.8
Of which: real GDP growth -3.7 -3.4 -3.3 -3.4 -3.5 -3.6 -3.8 -3.8 -3.9 -22.0
Exchange rate depreciation 7/
0.0 0.0 0.0 … … … … … … …
Other identified debt-creating flows -2.2 -2.6 -2.7 -1.7 -1.5 -1.5 -1.4 -1.4 -1.4 -8.8
Net privatization proceeds (negative) -2.2 -2.6 -2.7 -1.7 -1.5 -1.5 -1.4 -1.4 -1.4 -8.8
Contingent liabilities 0.0 0.0 0.0 0.0 0.0 0.0 0.0 0.0 0.0 0.0
Others 0.0 0.0 0.0 0.0 0.0 0.0 0.0 0.0 0.0 0.0
Residual, including asset changes 8/
1.5 -2.3 0.8 0.0 0.0 0.0 0.0 0.0 0.0 0.0
Source: IMF staff.
1/ Public sector is defined as general government.
2/ Based on available data.
3/ Long-term bond spread over U.S. bonds.
4/ Defined as interest payments divided by debt stock (excluding guarantees) at the end of previous year.
5/ Derived as [(r - π(1+g) - g + ae(1+r)]/(1+g+π+gπ)) times previous period debt ratio, with r = interest rate; π = growth rate of GDP deflator; g = real GDP growth rate;
a = share of foreign-currency denominated debt; and e = nominal exchange rate depreciation (measured by increase in local currency value of U.S. dollar).
6/ The real interest rate contribution is derived from the numerator in footnote 5 as r - π (1+g) and the real growth contribution as -g.
7/ The exchange rate contribution is derived from the numerator in footnote 5 as ae(1+r).
8/ Includes asset changes and interest revenues (if any). For projections, includes exchange rate changes during the projection period.
9/ Assumes that key variables (real GDP growth, real interest rate, and other identified debt-creating flows) remain at the level of the last projection year.
-3.3
balance 9/
primary
Debt, Economic, and Market Indicators 1/
2005-2013
Actual
Projections
Contribution to Changes in Public Debt
Projections
2005-2013
Actual
Debt-stabilizing
-10
-5
0
5
10
15
2005 2006 2007 2008 2009 2010 2011 2012 2013 2014 2015 2016 2017 2018 2019 2020 2021
Debt-Creating Flows
Primary deficit Real GDP growth Real interest rate Exchange rate depreciation
Other debt-creating flows Residual Change in gross public sector debt
projection
(In percent of GDP)
-40
-30
-20
-10
0
10
20
30
40
50
60
cumulative

PEOPLE’S REPUBLIC OF CHINA
INTERNATIONAL MONETARY FUND 53
China: Public DSA—Composition of Augmented Debt and Alternative Scenarios
Baseline scenario 2016 2017 2018 2019 2020 2021 Historical scenario 2016 2017 2018 2019 2020 2021
Real GDP growth 6.6 6.2 6.0 6.0 5.9 5.8 Real GDP growth 6.6 9.6 9.6 9.6 9.6 9.6
Inflation 0.7 0.9 1.4 1.6 2.0 2.1 Inflation 0.7 0.9 1.4 1.6 2.0 2.1
Primary balance -7.2 -6.8 -6.2 -5.7 -5.2 -4.6 Primary balance -7.2 -6.3 -6.3 -6.3 -6.3 -6.3
Effective interest rate 5.6 5.3 5.0 4.9 5.0 5.0 Effective interest rate 5.6 5.3 4.3 3.6 3.1 3.0
Constant primary balance scenario Contingent Liability Shock 1/
Real GDP growth 6.6 6.2 6.0 6.0 5.9 5.8 Real GDP growth 6.6 3.9 3.7 6.0 5.9 5.8
Inflation 0.7 0.9 1.4 1.6 2.0 2.1 Inflation 0.7 0.3 0.8 1.6 2.0 2.1
Primary balance -7.2 -7.2 -7.2 -7.2 -7.2 -7.2 Primary balance -7.2 -27.8 -6.2 -5.7 -5.2 -4.6
Effective interest rate 5.6 5.3 5.0 4.9 5.0 5.1 Effective interest rate 5.6 5.7 7.3 6.9 6.8 6.7
1/ The contingent liability shock scenario also assumes that 10 percent of banking assets would turn into government liabilities.
Underlying Assumptions(In percent)
Alternative Scenarios
Composition of Public Debt
Contingent liability shock
Baseline Historical Constant primary balance
0
20
40
60
80
100
120
2014 2015 2016 2017 2018 2019 2020 2021
Gross Nominal Public Debt
(In percent of GDP)
projection
0
5
10
15
20
25
30
35
40
45
2014 2015 2016 2017 2018 2019 2020 2021
Public Gross Financing Needs
(In percent of GDP)
projection
0
10
20
30
40
50
60
70
80
2005 2007 2009 2011 2013 2015 2017 2019 2021
By Maturity
Medium and long-term
Short-term
projection
(In percent of GDP)
0
10
20
30
40
50
60
70
80
2005 2007 2009 2011 2013 2015 2017 2019 2021
By Currency
Local currency-denominated
Foreign currency-denominated
projection
(In percent of GDP)

Likelihood Impact Policy Response A
pp
en
dix
III. Ch
ina: R
isk A
ssessm
en
t Matrix
1/
Upside
Low High
1. Faster-than-anticipated implementation of reforms. Faster implementation of reforms, especially on corporate debt restructuring, SOE governance and eliminating implicit guarantees, can help address vulnerabilities and rebalance the economy toward more sustainable growth.
Medium Low
2. Stronger-than-anticipated stimulus. The recent stimulus measures may either have a larger impact on the economy, for example, if real estate investment picks up significantly, or additional stimulus measures could be undertaken. Both would increase near-term growth prospects (though likely reduce medium-term growth prospects and increase vulnerabilities).
Downside Tackle the corporate debt
problem
More sustainable macro
policies (especially credit). Use
on-budget, pro-consumption
fiscal stimulus if growth
threatens to fall excessively.
Guard against financial risks,
enhance crisis preparedness.
Move, flexibly, to effectively
floating exchange rate regime,
but intervene to avoid
excessive volatility.
Improve communications.
Medium
High/ Medium
1. Structurally weak growth in key advanced and emerging economies. Weak demand and persistently low inflation from a failure to fully address crisis legacies and undertake structural reforms, leading to low medium-term growth and persistent financial imbalances in the euro area and Japan. The end of easy global financial conditions and insufficient reform progress undermine medium-term growth in emerging markets and suppress commodity prices. The weak growth in key advanced and emerging economies is likely to be a drag on China’s export growth.
2. UK / EU: in the event of significant impact on EU activity, the adverse effect on China’s exports and growth could be material.
Low Medium
High
3. Short-term risks: a loss of investor confidence, a wave of disorderly corporate defaults, a sharp fall in asset prices, and a quicker fading of the stimulus impact. These could be amplified by the financial system, with renewed capital outflows and exchange rate pressure.
High 4. Medium-term risks: slow progress on reform and continued reliance on policy stimulus and unsustainable credit growth, would add to vulnerabilities, worsen resource misallocation, and lead to permanently lower growth.
1/The Risk Assessment Matrix (RAM) shows events that could materially alter the baseline path (the scenario most likely to materialize in the view of IMF staff) . The relative likelihood is the staff’s
subjective assessment of the risks surrounding the baseline (“low” is meant to indicate a probability below 10 percent, “medium” a probability between 10 and 30 percent, and “high” a probability
between 30 and 50 percent). The RAM reflects staff views on the source of risks and overall level of concern as of the time of discussions with the authorities. Nonmutually exclusive risks may interact
and materialize jointly. “Short term” and “medium term” are meant to indicate that the risk could materialize within 1 year and 3 years, respectively.
54
IN
TER
NA
TIO
NA
L MO
NETA
RY F
UN
D
PEO
PLE
'S R
EP
BU
LIC O
F C
HIN
A

PEOPLE’S REPUBLIC OF CHINA
INTERNATIONAL MONETARY FUND 55
Appendix IV. Implementation of Main Recommendations
from the 2010–11 FSAP for China
The authorities have made steady progress since the 2015 Article IV Consultation in advancing implementation of the high priority
recommendations from the 2010–11 Financial Sector Assessment Program (FSAP). A number of market-oriented reforms have
been introduced focusing on interest rate and foreign exchange market liberalization. Interest rate reform has focused on relaxing
the constraints of interest rate ceilings. Most importantly, the ceiling of renminbi deposit interest rates has been abolished. The
efficiency of institutions and the regulatory framework has been enhanced by greater interdepartmental collaboration and a
comprehensive restructuring of the banking regulator aimed at boosting regulatory capacity. The authorities strengthened the
financial stability and liquidity framework by introducing the Macroprudential Assessment (MPA) and expanding stress test
coverage. Efforts to build a representative yield curve continued with more regular issuance of bonds across maturities.
Main FSAP
Recommendations Priority Timeframe Measures Adopted 1/
Accelerating Market-oriented Reforms
1. China should
continue to carry out
reforms on interest
and exchange rates,
while ensuring that
financial institutions
are able to provide
appropriate credit
risk management.
High MT Market-oriented Interest Rate Reform
Basic lifting of interest rate controls. On August 26, 2015, caps for
floating rate term deposits with terms of a year or more were lifted.
On October 24, 2015, ceilings for term deposits were cancelled,
indicating that interest rate controls had officially been liberalized.
Systematic acceleration of financial product innovation. In June
2015, certificates of deposit were issued for enterprises and
individuals. The range of market-oriented fixed prices for
commercial bank debt products continued to expand.
Exchange Rate Formation Mechanism Reform
On August 11, 2015, PBC completed the RMB’s central parity
exchange rate quotation mechanism. This strengthened the degree
of marketization and the benchmark for RMB’s central parity
exchange rate against the U.S. dollar.
On December 11, 2015, the China Foreign Exchange Trading Center
(CFETS) officially issued the CFETS RMB Exchange Rate Index, which
emphasizes the need to increase efforts to reference a basket of
currencies.
Since February 2016, initial steps were taken to develop the
formation mechanism for the RMB’s central parity exchange rate
against the US dollar based on “closing exchange rates + exchange
rate changes for a basket of currencies.”
Credit Risk Management
In June 2015, the China Banking Regulatory Commission (CBRC) issued
the Notice Concerning Strengthening Customer Risk Information Sharing
(CBRC No. 95 [2015]), which increased customer risk information sharing
efforts, expanded the scope of information sharing, enhanced
information applicability, and guided credit risk prevention.
In May 2016, the CBRC issued Notice Concerning Further Strengthening
the Integrity of the Banking Industry (CBRC No. 89 [2016]), which
improved public announcements for credit information, sharing, and
application. It also strengthened the integrity for the banking industry
by completing the joint work on the design of penalty for financial
dishonesty activities.
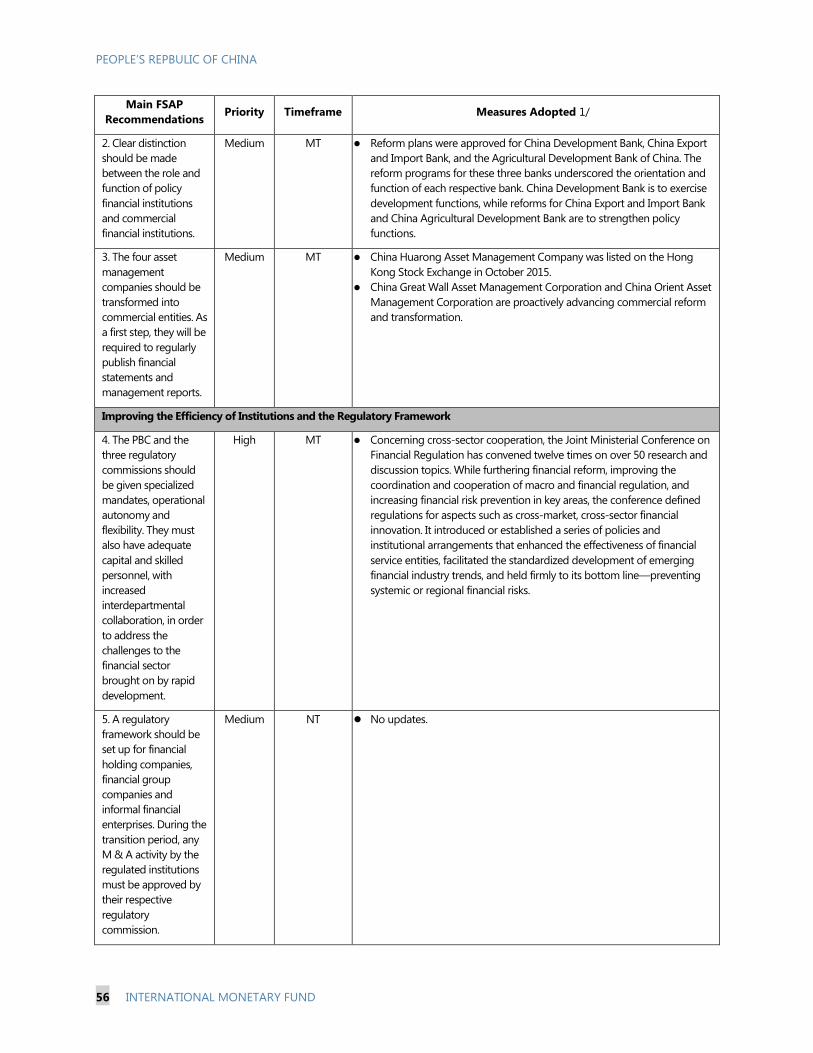
PEOPLE’S REPBULIC OF CHINA
56 INTERNATIONAL MONETARY FUND
Main FSAP
Recommendations Priority Timeframe Measures Adopted 1/
2. Clear distinction
should be made
between the role and
function of policy
financial institutions
and commercial
financial institutions.
Medium MT Reform plans were approved for China Development Bank, China Export
and Import Bank, and the Agricultural Development Bank of China. The
reform programs for these three banks underscored the orientation and
function of each respective bank. China Development Bank is to exercise
development functions, while reforms for China Export and Import Bank
and China Agricultural Development Bank are to strengthen policy
functions.
3. The four asset
management
companies should be
transformed into
commercial entities. As
a first step, they will be
required to regularly
publish financial
statements and
management reports.
Medium MT China Huarong Asset Management Company was listed on the Hong
Kong Stock Exchange in October 2015.
China Great Wall Asset Management Corporation and China Orient Asset
Management Corporation are proactively advancing commercial reform
and transformation.
Improving the Efficiency of Institutions and the Regulatory Framework
4. The PBC and the
three regulatory
commissions should
be given specialized
mandates, operational
autonomy and
flexibility. They must
also have adequate
capital and skilled
personnel, with
increased
interdepartmental
collaboration, in order
to address the
challenges to the
financial sector
brought on by rapid
development.
High MT Concerning cross-sector cooperation, the Joint Ministerial Conference on
Financial Regulation has convened twelve times on over 50 research and
discussion topics. While furthering financial reform, improving the
coordination and cooperation of macro and financial regulation, and
increasing financial risk prevention in key areas, the conference defined
regulations for aspects such as cross-market, cross-sector financial
innovation. It introduced or established a series of policies and
institutional arrangements that enhanced the effectiveness of financial
service entities, facilitated the standardized development of emerging
financial industry trends, and held firmly to its bottom line—preventing
systemic or regional financial risks.
5. A regulatory
framework should be
set up for financial
holding companies,
financial group
companies and
informal financial
enterprises. During the
transition period, any
M & A activity by the
regulated institutions
must be approved by
their respective
regulatory
commission.
Medium NT No updates.
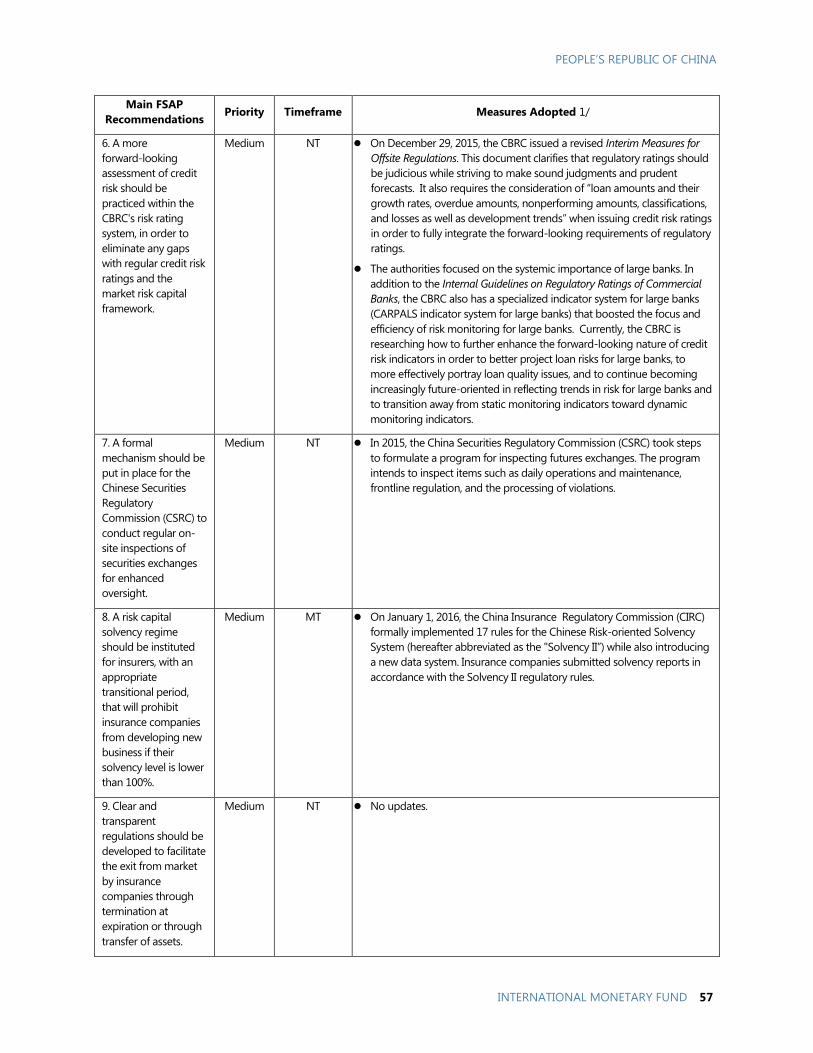
PEOPLE’S REPUBLIC OF CHINA
INTERNATIONAL MONETARY FUND 57
Main FSAP
Recommendations Priority Timeframe Measures Adopted 1/
6. A more
forward-looking
assessment of credit
risk should be
practiced within the
CBRC's risk rating
system, in order to
eliminate any gaps
with regular credit risk
ratings and the
market risk capital
framework.
Medium NT On December 29, 2015, the CBRC issued a revised Interim Measures for
Offsite Regulations. This document clarifies that regulatory ratings should
be judicious while striving to make sound judgments and prudent
forecasts. It also requires the consideration of “loan amounts and their
growth rates, overdue amounts, nonperforming amounts, classifications,
and losses as well as development trends” when issuing credit risk ratings
in order to fully integrate the forward-looking requirements of regulatory
ratings.
The authorities focused on the systemic importance of large banks. In
addition to the Internal Guidelines on Regulatory Ratings of Commercial
Banks, the CBRC also has a specialized indicator system for large banks
(CARPALS indicator system for large banks) that boosted the focus and
efficiency of risk monitoring for large banks. Currently, the CBRC is
researching how to further enhance the forward-looking nature of credit
risk indicators in order to better project loan risks for large banks, to
more effectively portray loan quality issues, and to continue becoming
increasingly future-oriented in reflecting trends in risk for large banks and
to transition away from static monitoring indicators toward dynamic
monitoring indicators.
7. A formal
mechanism should be
put in place for the
Chinese Securities
Regulatory
Commission (CSRC) to
conduct regular on-
site inspections of
securities exchanges
for enhanced
oversight.
Medium NT In 2015, the China Securities Regulatory Commission (CSRC) took steps
to formulate a program for inspecting futures exchanges. The program
intends to inspect items such as daily operations and maintenance,
frontline regulation, and the processing of violations.
8. A risk capital
solvency regime
should be instituted
for insurers, with an
appropriate
transitional period,
that will prohibit
insurance companies
from developing new
business if their
solvency level is lower
than 100%.
Medium MT On January 1, 2016, the China Insurance Regulatory Commission (CIRC)
formally implemented 17 rules for the Chinese Risk-oriented Solvency
System (hereafter abbreviated as the "Solvency II”) while also introducing
a new data system. Insurance companies submitted solvency reports in
accordance with the Solvency II regulatory rules.
9. Clear and
transparent
regulations should be
developed to facilitate
the exit from market
by insurance
companies through
termination at
expiration or through
transfer of assets.
Medium NT No updates.

PEOPLE’S REPBULIC OF CHINA
58 INTERNATIONAL MONETARY FUND
Main FSAP
Recommendations Priority Timeframe Measures Adopted 1/
10. A law governing
payment systems
should be developed
to provide
comprehensive
protection of the
finality of payments
and the settlement of
derivatives and
securities contracts.
Medium MT PBC is currently developing the Payment and Settlement Regulations.
Preliminary studies were completed, and legislative proposals from
market institutions have been collected. Payment and Settlement
Regulations are listed as a research item for the 2016 State Council
Legislative Work Plan.
Currently, revisions to Securities Law and Futures Law are underway.
These laws contain content from regulations for the settlement of
securities and derivatives pertaining to transaction finality and net
settlements. In addition, PBC continues to promote the development of
administrative regulations for financial infrastructure that also covers the
finality of settlements and other issues.
11. It is imperative
that information on
beneficial ownership
and control is
sufficient and accurate
and that such
information is
available to the
competent authorities.
High MT No updates.
12. Information
sharing and
collaborative
arrangements must be
improved between the
PBC and other
relevant agencies on
anti-money
laundering (AML) and
other regulatory
issues.
High MT China established the Ministerial Joint Conference on Anti-Money
Laundering (AML). Comprised of twenty-three ministries and
commissions, the joint conference directs all of China’s AML efforts and
develops China’s major AML objectives and policies. It formulates
national AML policy measures for international cooperation and
coordinates the commencement of AML by all twenty-three members
and commissions. On July 24, 2015, the eighth inter-ministerial meeting
was held to discuss how to improve cooperation between the joint
conference members among other issues.
Framework for Enhancing Financial Stability, Systemic Risk Monitoring, System Liquidity, and Crisis Management
13. The establishment
of the Financial
Stability Board, with
the PBC as its
secretariat.
High MT No updates.
14. Improved data
collection on financial
institutions, including
their leverage,
liabilities, off-balance
sheet positions,
unregulated products
and cross-border and
sectoral exposures.
Medium NT PBC has advanced the construction of a robust statistical infrastructure. It
further improved its macroprudential policy framework. In 2015, the PBC
altered the verification algorithm for its financial statistics monitoring and
management information system to improve system validation
mechanisms. It also increased the robustness of the system’s ability to
use CONGNOS for multidimensional analysis.
Improving related statistical systems. In order to accurately assess the
impact of financial institution off-balance sheet products on monetary
policy, the authorities provided effective tools. (1) In 2016, PBC amended
and made improvements to the off-balance sheet business statistical
system, which includes indicators for both off-balance sheet business
volume and earnings related to four types of off-balance sheet business:
secured, pledged, financial asset services, and financial derivatives.
(2) PBC developed the “bond statistical system.” This system absorbed
the accounts statistics concept of “from-whom-to-whom” that was

PEOPLE’S REPUBLIC OF CHINA
INTERNATIONAL MONETARY FUND 59
Main FSAP
Recommendations Priority Timeframe Measures Adopted 1/
developed following the financial crisis. At this concept’s core is the
performance of statistical analysis for each individual bond. The statistical
system is designed to link securities products, participants, and prices, to
create multidimensional information data sets. It uses flexible processing
and provides comprehensive, accurate, uniform, and timely statistical data.
Currently, all financial statistical data reporting services are pushing for
implementation of the bond statistical system, and preliminary steps have
been taken to integrate the system. During 2016, we will gradually develop
data submission tests and also obtain the ability to trace historical data.
3) In mid-October of 2015, CSRC developed a statistical system for market
funds and established data transfer mechanisms together with the CBRC.
This made for a more robust statistical monitoring of financing activities,
structured information management products, and other leverage ratios.
Promoting comprehensive financial sector statistical analysis. (1) The
government accomplished the initial setup of mechanisms for sharing
financial monitoring information and for comprehensive financial sector
statistical coordination. In September 2015, Inter-Ministerial Joint
Conference on Financial Supervision and Coordination convened its tenth
meeting to further clarify that PBC is responsible for the coordination of
efforts of all ministry-level organizations involved in financial monitoring by
means of information sharing to launch comprehensive financial sector
statistical analysis efforts. In March 2016, the Notice on the Pilot Program of
Comprehensive Financial Statistics under the "three boards and one
management" (meaning a shareholder meeting, a board of directors, a
board of supervision and a management team) corporate governance
structure was issued. It officially launched data collection efforts to develop
core comprehensive statistical indicators for the financial sector in Tianjin,
Guangdong, Zhejiang, and Anhui provinces. (2) Established a statistical
monitoring system for statistics concerning the scale of social financing
regulations from the national to local levels. Beginning in 2016, data was
officially released monthly on the scale of social financing level data.
(3) Completed the initial steps for developing comprehensive statistical
core indicators and a reporting system for the financial sector. The system
for financial sector core collection indicators is applied to banks, security
companies, insurance companies, that are the foundation and core of the
financial sector’s comprehensive statistics. PBC has already finished the
initial steps for constructing a set of core collection indicators through
performing complex categorization according to tool, product, and
transaction counterparties. After processing the data, the government
could obtain a series of important, comprehensive data that reflected
financial sector operations and the summary or consolidated financial
statements to fully reflect the financial operations and business situation
conditions provide reference for monetary policy and financial stability.
Strengthening the monitoring on financial institutions. (1) CBRC
increased monitoring of bank off-balance sheet and investment business
by expanding periodic monitoring of banks’ consign business, escrow
assets, and entrusted loans, while simultaneously enhancing monitoring of
the investment, business especially non-bond investment according to
asset quality and investment types. (2) In accordance with BCBS’ final Net
Stable Funding Ratio, the CBRC edited and improved relevant reports and
increased the monitoring frequency of the group’s report, increased from
six months to one quarter. (3) CSRC built new regulatory mechanisms for
the interim and post-event supervision of the securities and futures
institutions, upgrading the related systems of the regulatory agencies,

PEOPLE’S REPBULIC OF CHINA
60 INTERNATIONAL MONETARY FUND
Main FSAP
Recommendations Priority Timeframe Measures Adopted 1/
further improving the statistical data analysis, risk monitoring, and control
functions.
15. The establishment
of a macroprudential
framework to
measure and manage
systemic risk, which
should include
increased resources at
the PBC and the
regulatory agencies
and their improved
ability to monitor
financial stability and
regularly carry out
stress tests.
High NT PBC has made progress in the macroprudential policy framework.
In 2016, PBC started to use the dynamic adjustment mechanism
“upgrades” on differential reserves for the “macroprudential
assessment system” (MPA) for counter-cyclical adjustment in order
to adapt to trends in asset diversification.
PBC has constructed and improved the macroprudential policy
framework for cross-border capital flow. First, suppress market
short-term speculation by means of reserve tools and levy risk
reserve on banks’ foreign exchange loans. Second, expand the
entire aperture of cross-border financing and macroprudential
management pilots, and stabilize foreign currency external debt
deleveraging activity. Third, enforce normal deposit-reserve ratios
for overseas financial institutions with deposits in domestic financial
institutions. Establish a permanent mechanism for counter-cyclical
adjustment of cross-border RMB capital flow.
PBC continues to improve China’s medium and large bank stress
testing framework and methods. Increase standards for test
subjects to include commercial banks with at least RMB 500 billion
in assets. At the same time, dynamically adjust exposure and stress
scenarios according to the state of China’s macroeconomic
development and potential banking industry risks.
CBRC is actively constructing a banking monitoring system that
combines micro- and macroprudential approaches.
Develop a more robust early warning system for risk.
Utilize stress tests to evaluate banking system risks. CBRC issued the
Guidelines on Stress Testing China’s Banking Industry, which provides
guidance for commercial banks to carry out stress testing according
to the actual circumstances and risk factors of the respective bank.
These guidelines are especially for carrying out corresponding stress
tests to overheated industries like real estate and high-risk sectors.
Target the characteristic cyclical changes of the real estate industry.
CBRC dynamically adjusts the down payment of personal real estate
loans (loan-to-value) and other credit policies with PBC to effectively
control real estate loan risks.
CSRC conducts research on how to improve the overall framework for
industry risk stress tests with the intention of conducting comprehensive,
normalized stress tests on operators in the securities and futures sectors,
on securities and futures market infrastructure, and on all key financial
products.
In 2015, CIRC issued the Interim Guidelines on Domestic Systemically
Important Insurance Companies for public consultation. This is expected
to be implemented in 2016. In early 2016, CIRC developed an insurance
sector stress test based on “C-ROSS.” CIRC recently completed the data
collection work.
16. Enhanced hedging
of structural liquidity
through market-
based tools and
managing spillovers
from systemic liquidity
High NT No updates.

PEOPLE’S REPUBLIC OF CHINA
INTERNATIONAL MONETARY FUND 61
Main FSAP
Recommendations Priority Timeframe Measures Adopted 1/
through indirect
monetary policy tools.
17. The
implementation of an
average reserve
system to facilitate
liquidity management
and to improve
stability and efficiency.
High NT In September 2015, PBC reserve appraisal system underwent reform and
implemented the average reserve system method for reserve appraisal.
During the maintenance period, the value of the average daily arithmetic
mean of the financial institution’s deposit reserve must meet statutory
requirements. After the maintenance period, the financial institution
deposit reserve will not be required to meet statutory requirements on a
daily basis.
18. Launching a trial
run of the targeted
short-term repo rate,
as an experiment of
indirect liquidity
management, and
starting daily open
market operations.
High NT Since mid-2015, PBC continued to carry out open-market reverse
repurchase transactions for a 7-day period that effectively regulated
banking system liquidity, strengthened the guidance and regulation of
short-term money market interest rates, and assessed the effectiveness
and fairness of using the 7-day repurchase rate as the central bank policy
rate.
On February 18, 2016, the PBC adopted the open market operations at a
daily frequency.
19. Ensuring the
deposit and lending
operations at the PBC
is on a real time and
automatic basis, with
uniform collateral
requirements for all
domestically
registered entities.
Medium NT No updates.
20. The
implementation of a
deposit insurance
system to provide
support for the
orderly shutdown of
financial institutions;
and assistance for
sorting out contingent
liabilities.
Medium NT No updates.
Developing Securities Markets by Channeling Deposits to Contract and Pooling Types of Investment Institutions
21. Ensuring
consistency of
regulatory rules and
assigning regulatory
responsibilities in
support of developing
the fixed-income
market.
Medium MT In order to improve the efficiency of bond issuance and to strengthen the dissemination of bond information disclosure, the National Development
Reform Commission issued Opinions on Simplifying the Approval and
Reporting Procedures for Corporate Bonds to Strengthen Risk Prevention
and Reform the Regulation Mode.
The third meeting for the Joint Ministerial Conference on Credit Debt
Market was convened on December 29, 2015. The meeting held
discussions on risks facing the bond market, the regulation coordination
and uniformity for corporate credit bond issuance, market infrastructure
and administration, uniformity of bond market law enforcement, and
other issues. A consensus was reached for several issues.
22. Continued
improvement of bond
High MT The authorities publicly announced key terms and the short end of the
Treasury yield curve. On this basis, the authorities further improved the
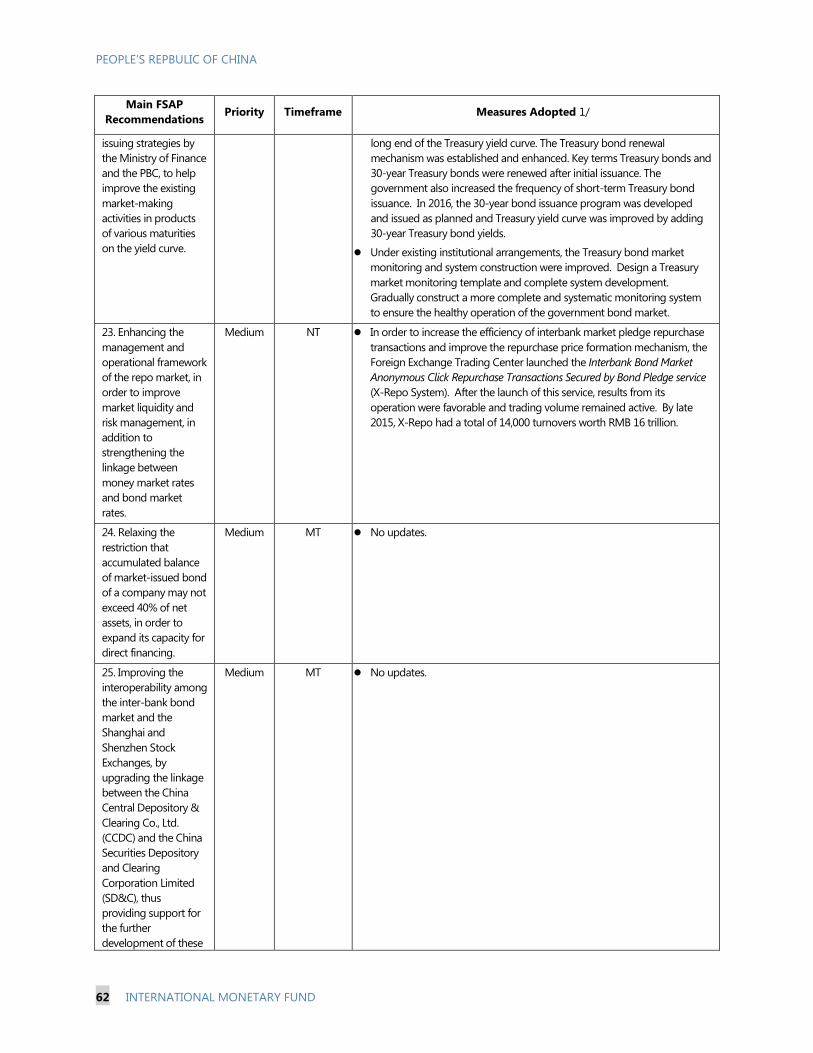
PEOPLE’S REPBULIC OF CHINA
62 INTERNATIONAL MONETARY FUND
Main FSAP
Recommendations Priority Timeframe Measures Adopted 1/
issuing strategies by
the Ministry of Finance
and the PBC, to help
improve the existing
market-making
activities in products
of various maturities
on the yield curve.
long end of the Treasury yield curve. The Treasury bond renewal
mechanism was established and enhanced. Key terms Treasury bonds and
30-year Treasury bonds were renewed after initial issuance. The
government also increased the frequency of short-term Treasury bond
issuance. In 2016, the 30-year bond issuance program was developed
and issued as planned and Treasury yield curve was improved by adding
30-year Treasury bond yields.
Under existing institutional arrangements, the Treasury bond market
monitoring and system construction were improved. Design a Treasury
market monitoring template and complete system development.
Gradually construct a more complete and systematic monitoring system
to ensure the healthy operation of the government bond market.
23. Enhancing the
management and
operational framework
of the repo market, in
order to improve
market liquidity and
risk management, in
addition to
strengthening the
linkage between
money market rates
and bond market
rates.
Medium NT In order to increase the efficiency of interbank market pledge repurchase
transactions and improve the repurchase price formation mechanism, the
Foreign Exchange Trading Center launched the Interbank Bond Market
Anonymous Click Repurchase Transactions Secured by Bond Pledge service
(X-Repo System). After the launch of this service, results from its
operation were favorable and trading volume remained active. By late
2015, X-Repo had a total of 14,000 turnovers worth RMB 16 trillion.
24. Relaxing the
restriction that
accumulated balance
of market-issued bond
of a company may not
exceed 40% of net
assets, in order to
expand its capacity for
direct financing.
Medium MT No updates.
25. Improving the
interoperability among
the inter-bank bond
market and the
Shanghai and
Shenzhen Stock
Exchanges, by
upgrading the linkage
between the China
Central Depository &
Clearing Co., Ltd.
(CCDC) and the China
Securities Depository
and Clearing
Corporation Limited
(SD&C), thus
providing support for
the further
development of these
Medium MT No updates.

PEOPLE’S REPUBLIC OF CHINA
INTERNATIONAL MONETARY FUND 63
Main FSAP
Recommendations Priority Timeframe Measures Adopted 1/
three markets, and
help improve their
efficiency.
26. Building a multi-
pillared pension
system, focusing on a
basic pension system
that is fully funded.
Medium MT On August 17, 2015, the State Council issued Measures for the
Administration of Investment in Basic Pension Insurance Funds (State
Council 2015 No. 48) which explains that basic pension insurance funds
for enterprise and government personnel and both urban and rural
residents can be delegated to State Council-authorized institutions for
investment. Investment must adhere to market-oriented, diversified, and
professional principles to ensure the security of the funds and to increase
their value.
Improving Alternative Financing Channels and Accessibility
27. Reviewing existing
governmental
programs to
determine their
effectiveness in terms
of promoting
financing for rural,
small, and
microenterprises, and
developing a
comprehensive and
coherent strategy on
such financing.
High MT Rural Financial Services
The authorities optimized the combination of monetary, credit, and other
policy tools.
Different reserve policies were used as incentives. The authorities
reduced deposit reserve ratios for financial institutions by
2.5 percentage points, targeted reduction of reserve ratios was
implemented five times in 2015. The additional cumulative
reductions of reserve ratio reached 0.5 to 1 percentage point with
banks that satisfied prudential management requirements as well as
those of the “Three Rurals,” or small and micro-enterprise loans
reaching certain requirements. There was an additional cumulative
reduction of the deposit reserve ratio for rural financial institutions
(rural cooperative banks, rural credit cooperatives and village banks)
of 2 to 2.5 percentage points. As of late April 2016, the required
deposit reserve ratio for county firms, rural cooperative banks, rural
credit cooperatives, and rural banks is lower than state-owned
commercial banks by 5, 8, 8, and 8 percentage points, respectively.
Guidance on credit policy was strengthened to encourage financial
institutions to improve and perfect financing support for areas such
as new types of agricultural business entities, agricultural
infrastructure, and the modern seed industry. The authorities
increased investment in agriculture-related credit, implemented
agricultural credit policy impact assessments, and bolstered
assessments and evaluations of credit investment in
agriculture-related financial institutions. As of late April 2016, the
comprehensive balance of agricultural loans is RMB 26.9 trillion, an
increase of 8.8 percent over the previous year. The proportion of
these loans accounted for 27.1 percent of all loan types.
The authorities improved the rural financial system and actively fostered
the development of new rural banks and other financial institutions. By the
end of March 2016, a total number of new rural financial institutions to
open nationwide was 1,395, which includes 1,333 rural banks, 14 loan
businesses, and 48 rural mutual cooperatives. Rural bank loans amounted
to RMB 617.1 billion, which included rural households and small and
microenterprise loans that amounted to RMB 278 billion and
RMB 294.5 billion, respectively. Together, they accounted for 93 percent
of rural loans and a total of 72.2 percent of private capital holdings.
Rural financial reform and innovation were accelerated. The authorities
also further developed mortgage pilots for improving the right to operate

PEOPLE’S REPBULIC OF CHINA
64 INTERNATIONAL MONETARY FUND
Main FSAP
Recommendations Priority Timeframe Measures Adopted 1/
contracted land and the right of rural residents to housing assets, thereby
providing the “two rights” of mortgage financing.
Rural basic financial services were promoted. Since 2009, a total of
1,532 rural institutional gaps were resolved and 708 rural service gaps in
basic financial services were covered.
Financial Services for Small and Micro-Enterprises
Improving the effectiveness of implementation. As of the end of April
2016, small and microenterprise loan amounts totaled RMB 18.7 trillion for
an increase of 14 percent over the previous year.
Strengthening credit policy guidance and encouraging financial
institutions to increase lending to small and micro-enterprises. The
authorities actively improved small and micro-enterprise credit policy
impact assessments and guided and supervised financial institutions to
optimize business processes and innovative financial products.
Consistent monitoring the policy implementation. Financial support
was promoted for small and micro enterprises in conjunction with the
relevant ministry-level institutions.
Developing innovative financial products and services.
1. Gradually broadened intellectual property, equity, forest rights, for
banking institutions of intellectual property, ownership, forest property
rights, right to future earnings, and other pledged loan business types;
actively developed supply chain financing and strive to resolve SME
financing issues.
2. Emphasized the important role of entrepreneurial secured loan. We
provided credit support to labor-intensive small enterprises to assist
them in complying with requirements. CIRC and other departments
jointly issued guidance on credit guarantee insurance to support small
and micro-enterprise development. Fully utilized insurance to increase
faith in financing. As of the end of March 2016, nationwide banking
institutions issued entrepreneurial secured loans totaling
RMB 75.3 billion.
3. Actively developed small financial institutions and increased small and
microenterprise supplies. Banks were required to prioritize
management of unreasonable or high fees. The authorities reduced
effectively the cost of financing for SMEs. By the end of 2015, the
number of small and micro-enterprise loans was 13.226 million. The
ratio of successful loan applications to total application was
92.8 percent. In more than half of the provinces (autonomous regions
and municipalities), the coverage of small and microenterprise loans
surpassed 20 percent.
Strengthening SME credit system. The government continuously
improved SME credit information collection, evaluation, and application
mechanisms and persisted in promoting the construction of a
foundational financial credit information database to provide optimal
credit information services. As of the end of March 2016, the authorities
made improvements in national accumulation and supplementing of
information for SMEs that did not have a credit relationship with any bank,
which numbered 2.595 million. There are nearly 454,000 SMEs that have
received bank loans for a balance of RMB 10.3 trillion.
Deepening capital market services. CSRC issued Several Opinions on
Further Promoting the Development of the National Small and Medium
Enterprise Share Transfer System (CSRC Public Notice [2015] No. 26). Its

PEOPLE’S REPUBLIC OF CHINA
INTERNATIONAL MONETARY FUND 65
Main FSAP
Recommendations Priority Timeframe Measures Adopted 1/
content covers multiple areas such as financing, transactions, market
stratification, and management of sponsored securities brokers. As of
May 6, 2016, nationwide share transfer systems listed 7,056 companies.
Total share capital amounted to 411.7 billion shares with a total market
value of RMB 2.98 trillion. About 2,800 listed companies carried out direct
issuance of shares 4,113 times. The total issuance of shares amounted to
35.48 billion shares with a total financing amount of RMB 185.8 billion.
28. Further reforms of
rural credit
cooperatives, to
enhance their
efficiency and
sustainability as
commercial providers
of financial products
and services.
Medium MT Actively and prudently promoted the restructuring of rural credit
cooperatives and establish rural commercial banks. By the end of March
2016, there was a total combined number of 1052 rural commercial banks
and rural cooperative banks. Assets, liabilities, and owners’ equity
accounted for 66.0 percent, 65.5 percent, and 72.7 percent of rural
cooperative financial institutions, respectively. By April 2016, Beijing,
Tianjin, Shanghai, Chongqing, Jiangsu, Anhui, and Hubei had completed
the task of establishing rural commercial banks.
The asset quality of rural credit cooperatives improved significantly, and
agriculture-related financial service functions were considerably upgraded.
According to the statistical methods and scope of the five-category loan
classification system, the percentage of nonperforming loans for all of
China’s rural credit cooperatives was 4.3 percent and capital adequacy was
at 11.1 percent as of late March 2016.
29. Completing the
reform of the Postal
Savings Bank by
optimization of the
ownership structure,
marketization and the
establishment of
effective corporate
governance.
Medium MT Postal Savings Bank established the "three boards and one
management" corporate governance structure and introduced ten
domestic and foreign strategic investors in December 2015 to achieve
equity diversification.
1/ Information as reported by the authorities, with IMF staff providing translation and minor edits.

PEOPLE'S REPUBLIC OF CHINA STAFF REPORT FOR THE 2016 ARTICLE IV CONSULTATION—INFORMATIONAL ANNEX
Prepared By
Asia and Pacific Department (In consultation with other departments)
FUND RELATIONS _________________________________________________________________________ 2
WORLD BANK-IMF COLLABORATION ____________________________________________________ 6
RELATIONS WITH THE ASIAN DEVELOPMENT BANK _________________________________ 10
STATISTICAL ISSUES _____________________________________________________________________ 12
TECHNICAL ASSISTANCE ________________________________________________________________ 15
CONTENTS
July 7, 2016

PEOPLE’S REPUBLIC OF CHINA
2 INTERNATIONAL MONETARY FUND
FUND RELATIONS (As of May 31, 2016)
Membership Status: Joined 12/27/45; Article VIII (December 1, 1996)
General Resources Account:
SDR Million % Quota
Quota 30, 482.90 100.00
Fund holdings of currency 25,416.74 83.38
Reserve position in Fund 5,066.21 16.62
Lending to the Fund
New Arrangements to Borrow 2,362.66
SDR Department:
SDR Million % Allocation
Net cumulative allocation 6,989.67 100.00
Holdings 7,442.78 106.48
Outstanding Purchases and Loans: None
Financial Arrangements:
Type Approval Date Expiration
Date
Amount Approved
(SDR million)
Amount Drawn (SDR
million) Stand-by Stand-by
11/12/86 03/02/81
11/11/87 12/31/81
597.73 450.00
597.73 450.00
Projected Payments to Fund (SDR million; based on existing use of resources and present holdings of SDRs):
Forthcoming
2016 2017 2018 2019 2020 Principal 0.00 0.00 0.00 0.00 Charges/interest 0.24 0.24 0.24 0.24 Total 0.24 0.24 0.24 0.24
Exchange Arrangements: China’s exchange rate regime has been classified as a crawl-like arrangement since June 21, 2010. De jure classification of the exchange rate is managed floating. On July 21, 2005, the People’s Bank of China (PBC) announced that the exchange rate of the renminbi against the U.S. dollar would be revalued upward by about 2.1 percent (from RMB 8.28/US$ to RMB 8.11/US$) and the exchange rate regime would move to a managed float in which renminbi’s value is set with reference to a

PEOPLE’S REPUBLIC OF CHINA
INTERNATIONAL MONETARY FUND 3
basket of currencies. The stated intention of the Chinese authorities was to increase the flexibility of the renminbi’s exchange rate. The authorities indicated that they will not publish the currencies in the reference basket and their relative weight. The PBC indicated that it would adjust the exchange rate trading band as necessary to reflect market developments and financial and economic conditions. Under the new regime, the band around the daily trading price of the U.S. dollar against the renminbi was kept at ± 0.3 percent around the central parity published by the PBC while the trade prices of the non-U.S. dollar currencies against the renminbi were allowed to move within a certain band announced by PBC, which was initially set at ±1.5 percent and increased to ±3 percent in September 2005. In August 2005, the governor of PBC revealed that U.S. dollar, euro, Japanese yen, and Korean won were the main currencies included in the basket; and U.K. pound, the Thai baht, and the Russian ruble were among other currencies included in the basket. In May 2007, the band around the daily trading price of the U.S. dollar against the renminbi was widened to ± 0.5 percent. After maintaining the renminbi closely linked to the U.S. dollar between July 2008 and June 2010, the PBC announced on June 19, 2010 a return to the managed floating exchange rate regime prevailing prior the global financial crisis with the exchange rate allowed to move up to 0.5 percent from a central parity rate to enhance the effectiveness of monetary policy. As of today, the band has been widened to 2 percent, allowing daily fluctuations relative to the central parity rate. The trading prices for the RMB against the euro, Japanese yen, pound sterling, Australian dollar, Canadian dollar, and New Zealand dollar float within a 3 percent range of the current day’s middle exchange rates for the RMB against these currencies. The trading prices against the Malaysian ringgit and the Russian ruble float within a 5 percent range of the current day’s middle exchange rates of the RMB against these currencies. The trading price of the RMB against the Thai baht in regional interbank markets floats within a 10% range of the reference price.
On January 4, 2006, over-the-counter (OTC) trading of spot foreign exchange was introduced with 15 banks initially designated as market makers. The number of market makers has since risen to 31 with all the banks approved as spot market makers, and 27 approved as forward and swap trading market makers by the end of 2014. The centralized spot foreign exchange trading system (CFETS) remains operative, but its central parity rate (renminbi against the U.S. dollar) is now based on a weighted average of CFETS and OTC transactions. Under the new system, CFETS first inquires prices from all market makers before the opening of the market on each business day, exclude the highest and lowest offers, and then calculates the weighted average of the remaining prices in the sample as the central parity for the renminbi against the U.S. dollar for the day. The weights for the market makers, which remain undisclosed, are determined by the CFETS using various factors, including the transaction volumes of the respective market makers in the market. The CFETS determines the middle rate for the renminbi against ringgit, yen, Hong Kong dollar, pound sterling, and ruble similarly. China accepted the obligations of Article VIII, Sections 2, 3, and 4 of the Fund’s Articles of Agreement on December 1, 1996. There are repatriation requirements on proceeds from exports and from invisible transactions and current transfers. Starting on August 13, 2007, all enterprises (domestic institutions) having foreign exchange revenue from current operations may keep foreign exchange receipts according to their operational needs in their current foreign exchange accounts.

PEOPLE’S REPUBLIC OF CHINA
4 INTERNATIONAL MONETARY FUND
With SAFE approval or registration, domestic institutions may open foreign exchange capital accounts and retain foreign exchange revenues from capital transactions. Domestic institutions that had no current foreign exchange revenue may purchase foreign exchange for imports in advance based on documentary proof of the payment and deposit the funds into their foreign exchange accounts. Individuals may, also open foreign exchange savings accounts and deposit foreign exchange purchased in accordance with the relevant regulations. China maintains an exchange system free of restrictions on payments and transfers for current international transactions. However, China has notified measures to the Fund, pursuant to procedures under the Executive Board Decision 144-(52/51), which apply to measures imposed solely for national or international security reasons. Exchange controls continue to apply to most capital transactions. Effective on July 1, 2006, quotas on foreign exchange purchases for foreign direct investment (FDI) were abolished, and domestic investors were allowed to purchase foreign exchange to finance pre-FDI activities. Since December 1, 2002, qualified foreign institutional investors (QFIIs) have been allowed to invest domestically in A shares, subject to certain restrictions, and all nonresidents have been allowed to purchase B shares, which are denominated in U.S. dollars or Hong Kong dollars. The overall investment limit for QFIIs was US$150 billion in 2016. As of the end of May 2016, a cumulative total of 273 QFIIs had been approved, with a total investment limit of US$81.098 billion. The Qualified Domestic Institutional Investor (QDII) scheme was introduced in 2004, and measures have since been taken to promote its development. Since May 1, 2006, residents can freely purchase up to US$20,000 foreign exchange and this limit was raised to US$50,000 in September 2006. Above this amount, purchases require relevant documents. In May 2007, the QDII scheme was expanded to allow qualified banks to invest retail funds in foreign equities. Effective July 5, 2007 the China Securities and Regulatory Commission extended QDII to securities and fund-management companies. The firms have to meet certain capital and other requirements. From April 2006, qualified insurance companies were also allowed to invest their own foreign exchange externally under the QDII scheme up to 15 percent of their total assets. QDIIs may also invest in foreign derivative instruments. The use of renminbi in international transactions has been expanded. In 2010, international financial institutions were approved to raise funds domestically in renminbi for use offshore. Since August 2011, trade transactions between all provinces and cities in the Mainland with other countries may be settled in renminbi. Since August 17, 2010, eligible foreign institutions may invest in the interbank bond market in renminbi (CIBM). The eligible institutions include foreign banks engaged in cross-border trade settlements in renminbi, the Hong Kong SAR and Macao SAR region renminbi clearing banks, and foreign central banks and monetary authorities. These investments are subject to limits, but there is no minimum holding period. Starting from January 6, 2011, resident enterprises in 20 provinces and cities in the Mainland may use renminbi for outward FDI in those countries which accept such settlement. In December 2011, a new pilot scheme was announced to allow up to RMB20 billion in portfolio flows into the securities markets (through a renminbi Qualified Foreign Institutional Investor scheme), and in October, rules were published to allow overseas firms to invest renminbi raised offshore in the Mainland as foreign direct investment. Since
PEOPLE’S REPUBLIC OF CHINA
INTERNATIONAL MONETARY FUND 5
2012 all residents and nonresidents can use RMB for FDI. RMB qualified foreign institutional investors (RQFIIs) may invest in domestic securities markets. Under the expanded RMB qualified foreign institutional investors (RQFII) scheme, Hong Kong subsidiaries of Chinese financial institutions, as well as financial institutions registered and operated in Hong Kong SAR, may invest in domestic securities markets using RMB proceeds raised overseas. RMB clearing banks were or will be established in these countries/regions. As of 2016, resident-associated companies of multinational corporations may directly lend to overseas-associated enterprises within a certain limit; they may also provide loans to overseas-associated enterprises through domestic banks. Foreign loans to domestic institutions, with a maturity of more than one year, are subject to NDRC approval. Short-term external borrowings are subject to the limits of SAFE approval. Article IV Consultation: China is on the standard 12-month consultation cycle. The 2015 Article IV mission was concluded on May 27, 2015 and the staff report was published on August 14, 2015. Technical Assistance: Technical assistance provided from 2001 through September 2016 is summarized in Annex V. Resident Representative: The resident representative office in Beijing was opened in October 1991. Mr. Alfred Schipke is the Senior Resident Representative and Mr. Waikei Raphael Lam is the Deputy Resident Representative,

PEOPLE’S REPUBLIC OF CHINA
6 INTERNATIONAL MONETARY FUND
WORLD BANK-IMF COLLABORATION (As of June 22, 2016)
1. The IMF China Resident Representatives held discussions with the World Bank team in June 2016 to exchange views on key areas of reform to ensure sustainable medium-term growth in China, minimize risks, and improve the inclusiveness of growth. The teams discussed their agendas for 2016-2017. The last such meeting was held during January 2016 in Beijing.
2. The teams agreed the focus of reform in China should be on shifting growth to a more balanced and sustainable path, along the line of the Third Plenum reform blueprint. Reforms should aim at preventing further buildup of risks stemming from rapid credit growth and quasi-fiscal spending, and move the economy to a more inclusive, environment-friendly, and sustainable growth path. Giving the market a more decisive role, eliminating distortions, and strengthening institutions will result in a more efficient use of resources, faster productivity growth, and rising living standards across the income spectrum.
3. Based on this assessment, teams identified the following reform areas as macrocritical:
Financial sector reforms. Further progress in financial sector reform is central to containing risks and boosting growth by facilitating better allocation of resources. Widespread implicit guarantees—of savers, intermediaries, and borrowers distort the pricing of risk and borrowing costs, resulting in misallocation of credit and inefficient investment. Key measures in this area include hardening budget constraint, enhanced debt restructuring mechanism to facility NPL resolution, as well as stepped-up supervision and regulation of the financial system. In particular, stronger measures to monitor and regulate the large shadow banking sector should be taken and regulatory arbitrage opportunities should be closed. Given the rising vulnerabilities, more effective mechanisms are needed to ensure a functional policy coordination framework is in place. There is also a need to upgrade the regulatory structure to ensure adequate supervisory cooperation and coordination.
Fiscal reforms. Off-budget spending, in infrastructure but also in other areas, undertaken by local government-owned entities have led to a significant buildup of debt. The new budget law aims to bring these projects on-budget and strengthen control over public financial management, but implementation would be key. Improving the fiscal framework is a priority for the medium term, including strengthening budget processes, data transparency, local government finances, and medium-term budget planning. Tax reforms should continue to modernize the current tax system and make it more progressive (e.g., relying more on direct taxes and allocating local governments revenues to match their spending responsibilities.
Reform of the social security system. Further strengthening the pension and health insurance systems—including by improving adequacy and expanding coverage—would have macro-benefits such as reducing precautionary household savings, but would need to be done with a careful eye to fiscal sustainability. It is crucial to improve benefit portability within and across provinces and

PEOPLE’S REPUBLIC OF CHINA
INTERNATIONAL MONETARY FUND 7
economic sectors. Reforms should be done in a way that ensures the sustainability of the social security system, including through parametric changes (such as increasing retirement age, indexation, and so on) and structural reforms to the pension system (such as introducing the NDC approach, deepening the alignment of civil service and PSU pension schemes with the urban worker scheme, upgrading the pooling level, developing the medium and long term financing strategy, including for financing legacy costs outside the pension system), and strengthening the budget processes and administration for social security funds. .
SOE reform. Reforms include opening up to full and fair competition activities currently reserved to SOEs, properly pricing finance and other factor inputs, requiring adequate dividend payments to the budget, and imposing hard budget constraints. Opening up the service sector to more competition will also be critical for generating the productivity gains necessary to fuel growth and for boosting household income, as services tend to be more labor intensive than industry.
Green growth. Air pollution, water quality and supply, soil contamination, and issues such as desertification, and degradation of grasslands, and dependence on coal and energy intensive economic options have social, health, and economic effects. Underpricing of energy and inadequate consequences for pollution has worsened these effects while contributing to China’s dependence on industry. Raising these factor costs to capture the cost of externalities, such as introducing a carbon tax and investing in green development including in renewable energy will make growth more sustainable and inclusive. This will also require mobilization of private capital and utilize the capital markets to support green investments.
Infrastructure. Investment in infrastructure has been a key driver of the Chinese economy, particularly during the slowdown around the Global Financial Crisis. However, the rapid pace of investment has in some cases left communities behind, and in other cases has led to excessive investment in projects with relatively low social or financial returns. Filling in the gaps of investment in social projects will make growth more inclusive while improving the overall social and financial efficiency of infrastructure investment. Measures to improve the process of approving new infrastructure projects will ensure that investments are focused in areas of the highest social return.
4. The teams agreed to the following division of labor.
Financial sector reforms. The Bank and the Fund will jointly conduct the 2017 FSAP; assess financial sector risks and needed reforms. The Fund will also continue to provide technical assistance to the Chinese authorities as needed.
Fiscal reforms. The Bank will continue to work with the Ministry of Finance (MOF) to help in implementing key reforms in public finance in the context of an ongoing fiscal technical assistance investment project. The Fund will continue its technical cooperation on the fiscal framework and budgetary preparation, including strengthening the medium-term macro and fiscal framework, enhancing local government borrowing monitoring, and modernizing accounting and treasury management. The Fund will also continue to discuss the near- and medium-term implications of
PEOPLE’S REPUBLIC OF CHINA
8 INTERNATIONAL MONETARY FUND
China’s fiscal stance and policy choices on the broader economy as well as implications for global spillovers.
Social Security System. The Bank will continue to work with the Chinese authorities on reforms to improve the equity, sustainability, and portability of the social security system. This includes helping provincial governments in developing more integrated social security information systems. The Bank will also work with MOF to provide technical support on the overall reform and the pooling and financing strategies, and optimize fiscal risk management associated with social security liabilities through policy dialogue and engagement. The Fund will look at issues related to the how different social insurance schemes (including pensions and health care) fit into the medium-term fiscal and macroeconomic policy framework. The Fund will also review the balance between benefits and financing from different revenue sources, including social contributions and other revenue. Both the Bank and the Fund will continue to encourage the authorities to undertake regular and robust actuarial modeling of social insurance liabilities.
Green growth. The Bank’s focus on climate change and renewable energy as well as pollution reduction and prevention in China will continue to emphasize cutting-edge green technologies, scale-up of energy conservation and investments in energy efficiency, green transport and green building policies (for heat and energy efficiency). Engagements with a climate change focus will extend to expansion of distribution of electricity from natural gas generation, analysis of carbon capture and storage potential, and development of green finance, including carbon markets. The Fund will continue to discuss options to capture the cost of externalities through the use of fiscal policy such as better calibration of excise and introducing a carbon tax. It is ready to provide assistance on shifting the pricing and taxation of energy, and discussing the growth and fiscal implications of such a shift.
5. Teams have the following requests for information from their counterparts:
The Fund team requests to be kept informed of progress in the above macroeconomic structural reform areas, as milestones are reached and at least on a semiannual basis.
The Bank team requests to be kept informed of the Fund’s assessments of macroeconomic policies and prospects in the context of the Article IV consultation and staff visits, and at least semiannually.
The following table lists the teams’ separate and joint work programs for June 2016 to June 2017.

PEOPLE’S REPUBLIC OF CHINA
INTERNATIONAL MONETARY FUND 9
China: Bank and Fund Planned Activities in Macrocritical Structural Reform Areas
Products Expected Delivery Date
Bank Work Program
Building a Modern Fiscal System Technical Assistance Project to support implementation of central government’s public finance reforms.
China Economic Reform Implementation Project (umbrella TA project, including various subprojects with MOF, PBC, and provincial finance bureaus).
Ongoing
Ongoing
China Economic Update “Just-in-time” Policy Notes for MOF TA on Mid-term Macrofiscal Framework
Ongoing Delivered on demand Ongoing
Subnational Intergovernmental Fiscal Relationship Municipal Financing and Local Debt Management Inclusive Finance Academy Financial Consumer Protection and Consumer
Literacy Financial Reform Strategy Capital Market Development
Ongoing
Ongoing Ongoing
Ongoing Ongoing
Deepening health reform in China-building high quality and value-based service delivery
Strengthening China’s social protection and labor systems
Ongoing Ongoing
Fund Work Program
December Staff Visit 2017 Article IV Consultation Cooperation Program for Fiscal Reforms (FAD)
Dec 2016 May/June 2017 Ongoing
Joint Work Program
Financial Sector Assessment Program 2017
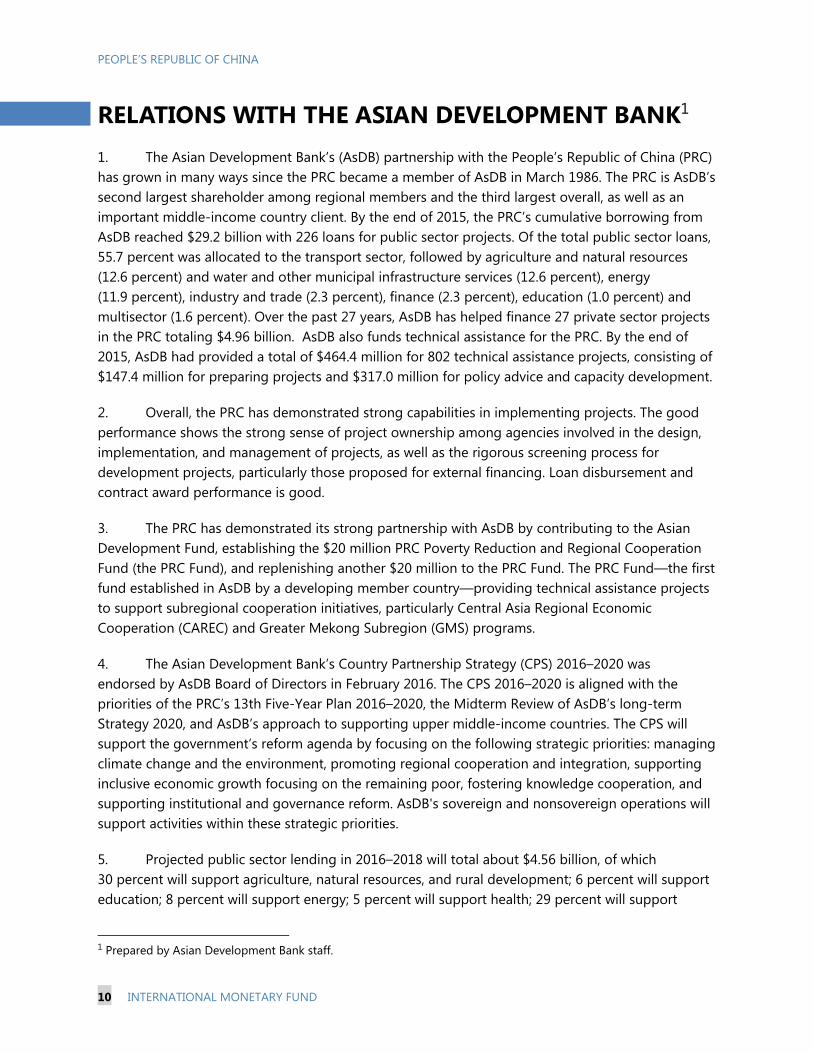
PEOPLE’S REPUBLIC OF CHINA
10 INTERNATIONAL MONETARY FUND
RELATIONS WITH THE ASIAN DEVELOPMENT BANK1 1. The Asian Development Bank’s (AsDB) partnership with the People’s Republic of China (PRC) has grown in many ways since the PRC became a member of AsDB in March 1986. The PRC is AsDB’s second largest shareholder among regional members and the third largest overall, as well as an important middle-income country client. By the end of 2015, the PRC’s cumulative borrowing from AsDB reached $29.2 billion with 226 loans for public sector projects. Of the total public sector loans, 55.7 percent was allocated to the transport sector, followed by agriculture and natural resources (12.6 percent) and water and other municipal infrastructure services (12.6 percent), energy (11.9 percent), industry and trade (2.3 percent), finance (2.3 percent), education (1.0 percent) and multisector (1.6 percent). Over the past 27 years, AsDB has helped finance 27 private sector projects in the PRC totaling $4.96 billion. AsDB also funds technical assistance for the PRC. By the end of 2015, AsDB had provided a total of $464.4 million for 802 technical assistance projects, consisting of $147.4 million for preparing projects and $317.0 million for policy advice and capacity development.
2. Overall, the PRC has demonstrated strong capabilities in implementing projects. The good performance shows the strong sense of project ownership among agencies involved in the design, implementation, and management of projects, as well as the rigorous screening process for development projects, particularly those proposed for external financing. Loan disbursement and contract award performance is good.
3. The PRC has demonstrated its strong partnership with AsDB by contributing to the Asian Development Fund, establishing the $20 million PRC Poverty Reduction and Regional Cooperation Fund (the PRC Fund), and replenishing another $20 million to the PRC Fund. The PRC Fund—the first fund established in AsDB by a developing member country—providing technical assistance projects to support subregional cooperation initiatives, particularly Central Asia Regional Economic Cooperation (CAREC) and Greater Mekong Subregion (GMS) programs.
4. The Asian Development Bank’s Country Partnership Strategy (CPS) 2016–2020 was endorsed by AsDB Board of Directors in February 2016. The CPS 2016–2020 is aligned with the priorities of the PRC’s 13th Five-Year Plan 2016–2020, the Midterm Review of AsDB’s long-term Strategy 2020, and AsDB’s approach to supporting upper middle-income countries. The CPS will support the government’s reform agenda by focusing on the following strategic priorities: managing climate change and the environment, promoting regional cooperation and integration, supporting inclusive economic growth focusing on the remaining poor, fostering knowledge cooperation, and supporting institutional and governance reform. AsDB's sovereign and nonsovereign operations will support activities within these strategic priorities.
5. Projected public sector lending in 2016–2018 will total about $4.56 billion, of which 30 percent will support agriculture, natural resources, and rural development; 6 percent will support education; 8 percent will support energy; 5 percent will support health; 29 percent will support
1 Prepared by Asian Development Bank staff.

PEOPLE’S REPUBLIC OF CHINA
INTERNATIONAL MONETARY FUND 11
transport and 22 percent will support water and other urban infrastructure and services sectors. Over 90 percent of the projects are located in the western, central and north-eastern regions in line with the CPS’s priorities of promoting inclusive growth and environmentally sustainable growth.
6. AsDB’s technical assistance will complement the lending program to improve the sector policy environment, support governance and capacity development, and strengthen the knowledge base and innovative features of lending operations.
China: AsDB’s Commitments and Disbursements (Public Sector Loans), 1993–2015
(In millions of U.S. dollars)
Year Commitments 1/ Disbursements 2/
1993 1,031 371
1994 1,618 492
1995 2,304 558
1996 3,282 707
1997 4,033 715
1998 4,518 818
1999 5,337 792
2000 6,159 832
2001 6,748 1,313
2002 7,563 782
2003 8,075 705
2004 8,733 636
2005 11,060 892
2006 11,794 988
2007 13,214 1,190
2008 14,519 1,234
2009 15,623 1,342
2010 16,964 1,342
2011 18,244 1,580 2012 19,476 1,343
2013 20,416 1,063
2014 21,748 1,303
2015 23,096 1,152
1/ Refers to cumulative contract awards. 2/ Refers to disbursements for the year.

PEOPLE’S REPUBLIC OF CHINA
12 INTERNATIONAL MONETARY FUND
STATISTICAL ISSUES (As of June 16, 2016)
I. Assessment of Data Adequacy for Surveillance
General: While data are broadly adequate for surveillance, they are only barely so. Efforts at strengthening the statistical system and enhancing data transparency led to China’s subscription to the SDDS in October 2015. Nevertheless, China’s statistics continue to have gaps that hamper surveillance. The areas of concern relate mainly to national accounts data and government finance statistics.
National Accounts: The National Bureau of Statistics (NBS) compiles and disseminates annual GDP by activity in current and constant prices (2010) and quarterly estimates of GDP. The NBS is in a transition period from 1993 SNA to 2008 SNA. The 2008 SNA is applied for some industries, such as for the calculation of financial intermediation services indirectly measured (FISIM). Since 2015, quarterly national accounts are compiled on a discrete basis –that is, January to March, April to June, July to September, and October to December, which is in line with international standards. The techniques for deriving volume measures of GDP are not sound and need to be improved. GDP by expenditure is compiled at current and constant prices, but the constant price estimates are not published. Data on the expenditure components of GDP are not available on a quarterly basis. Nevertheless, the NBS has made a number of improvements to the range and quality of national accounts data, the most important being improving the exhaustiveness of the GDP estimates by activity. Further improvements are intended for both the annual and quarterly accounts; however, no target dates have been set. As in other countries, rapid economic change, including the expansion of the private sector, presents new problems for data collection and compilation. The ability to change the data collection systems is restricted by the decentralized nature of the statistical system.
Monthly industrial production, retail sales, and fixed investment indices are compiled with the corresponding month of the previous year as a base period, but no chain-linked indices are produced. Data revisions tend to be made without publishing the entire revised series.
Price Statistics: The CPI covers approximately 500 areas throughout the country, including around 200 counties and around 300 cities. The current CPI is a chained Laspeyres price index, which is compiled and disseminated since 2001. Weights are derived from urban and rural households’ surveys every five years. Current weights are for 2008-2010. The weights from the base period are price-updated every month. PPI survey covers 40 percent of the total industry turnover including 60,000 enterprises in 31 provinces and over 430 cities. Prices cover 1702 product groups (basic sub-categories). The current base year is 2010. The PPI definitions are consistent with international standards defined in the PPI manual (2010). The PPI is not seasonally adjusted.
Government Finance Statistics: Serious data shortcomings continue to hamper fiscal analysis. Data on the social security and extra budgetary funds are only provided annually and with a long lag. Expenditure classification remains in need of improvement, mainly because data by economic type are not published. The authorities have indicated an intention to begin collecting these data and to develop accrual based measures of fiscal performance over the medium term while also strengthening the compilation of cash based GFS.
Monetary and Financial Statistics:
In recent years, improvements have been made in monetary and financial statistics. However, the monetary and banking surveys lack sufficient detail with regard to bank claims on the government, hampering the estimation of the fiscal deficit from the financing side. The reported net foreign assets position of PBC does not include exchange rate valuation effects and interest earnings on foreign reserves. The PBC has also ceased to report separate data on central government deposits in its balance sheet since April 2005 because the MOF no longer distinguishes between central and other government deposit accounts. This change has led to breaks in data series of monetary base and monetary aggregates.
The monetary and financial statistics missions in March 2015 made several recommendations for improvements in monetary data compilation with a view to accelerating PBC’s implementation of the standardized report forms (SRFs). The authorities plan to finalize the SRF data for depository corporations by the end of 2015 and begin regular reporting of SRF data after PBC’s review and approval process of these data is complete.
Financial sector surveillance: China reports financial soundness indicators (FSIs) to the Fund for dissemination on the IMF’s website. The authorities expanded the data scope in early 2015 by including two encouraged FSIs for deposit takers in their regular reporting to the Fund. The periodicity of data was also improved in May 2015 from annual to semi-annual frequency.

PEOPLE’S REPUBLIC OF CHINA
INTERNATIONAL MONETARY FUND 13
External sector statistics: The historic data series are compiled (in U.S. dollars) largely in accordance with the fifth edition of the Balance of Payments Manual (BPM5), however STA has converted BOP and IIP series into the sixth edition of the Balance of Payments and International Investment Position Manual (BPM6) for dissemination in the IFS. From 2015, the data are compiled and disseminated largely in accordance with BPM6. The authorities continue their efforts to improve the coverage of direct investment transactions in the balance of payments (BOP) and IIP statistics, and progress is being made in developing these statistics. Since the International Transactions Reporting System is the major data source for balance of payments (BOP) statistics, in order to ensure its smooth operation, regular training programs for staff in the provincial offices of SAFE have been recommended. In 2011, China commenced participation in the Coordinated Direct Investment Survey (CDIS), although only inward direct investment positions are currently recorded. At the end of 2015, China initiated reporting data for the Coordinated Portfolio Investment Survey (CPIS).
Despite an ostensibly modest level of external vulnerability, there remains a need to strengthen external debt monitoring and compilation. In 2010, China started submitting total and public external debt data for the Quarterly External Debt Statistics (QEDS) database, a notable step forward.
II. Data Standards and Quality
China began subscription to the Special Data Dissemination Standard in October 2015.
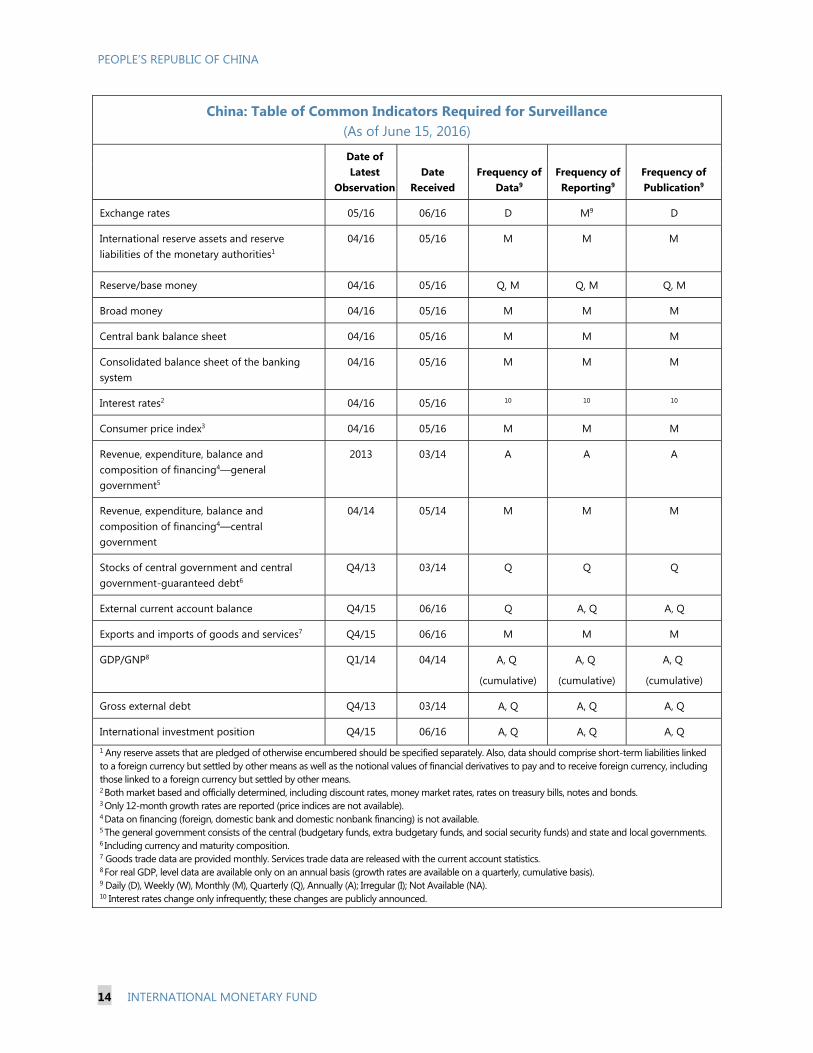
PEOPLE’S REPUBLIC OF CHINA
14 INTERNATIONAL MONETARY FUND
China: Table of Common Indicators Required for Surveillance (As of June 15, 2016)
Date of Latest
ObservationDate
Received Frequency of
Data9
Frequency of Reporting9
Frequency of Publication9
Exchange rates 05/16 06/16 D M9 D
International reserve assets and reserve liabilities of the monetary authorities1
04/16 05/16 M M M
Reserve/base money 04/16 05/16 Q, M Q, M Q, M
Broad money 04/16 05/16 M M M
Central bank balance sheet 04/16 05/16 M M M
Consolidated balance sheet of the banking system
04/16 05/16 M M M
Interest rates2 04/16 05/16 10 10 10
Consumer price index3 04/16 05/16 M M M
Revenue, expenditure, balance and composition of financing4—general government5
2013 03/14 A A A
Revenue, expenditure, balance and composition of financing4—central government
04/14 05/14 M M M
Stocks of central government and central
government-guaranteed debt6
Q4/13 03/14 Q Q Q
External current account balance Q4/15 06/16 Q A, Q A, Q
Exports and imports of goods and services7 Q4/15 06/16 M M M
GDP/GNP8 Q1/14 04/14 A, Q
(cumulative)
A, Q
(cumulative)
A, Q
(cumulative)
Gross external debt Q4/13 03/14 A, Q A, Q A, Q
International investment position Q4/15 06/16 A, Q A, Q A, Q
1 Any reserve assets that are pledged of otherwise encumbered should be specified separately. Also, data should comprise short-term liabilities linked to a foreign currency but settled by other means as well as the notional values of financial derivatives to pay and to receive foreign currency, including those linked to a foreign currency but settled by other means. 2 Both market based and officially determined, including discount rates, money market rates, rates on treasury bills, notes and bonds. 3 Only 12-month growth rates are reported (price indices are not available). 4 Data on financing (foreign, domestic bank and domestic nonbank financing) is not available. 5 The general government consists of the central (budgetary funds, extra budgetary funds, and social security funds) and state and local governments. 6 Including currency and maturity composition. 7 Goods trade data are provided monthly. Services trade data are released with the current account statistics. 8 For real GDP, level data are available only on an annual basis (growth rates are available on a quarterly, cumulative basis). 9 Daily (D), Weekly (W), Monthly (M), Quarterly (Q), Annually (A); Irregular (I); Not Available (NA). 10 Interest rates change only infrequently; these changes are publicly announced.

PEOPLE’S REPUBLIC OF CHINA
INTERNATIONAL MONETARY FUND 15
TECHNICAL ASSISTANCE China: Summary of Technical Assistance, 2001–16 1/
Department Purpose Date
Tax System Reform FAD Mission on VAT And Inheritance Tax April 2001 FAD Mission on Tax Preference September 2001 FAD Mission on Financial Sector Taxation Aug/Sep 2002 FAD Mission on Personal Income Tax Reform November 2003 LEG Seminar on Basic Tax Law December 2005 FAD Mission on VAT Treatment Of Financial Services April 2006 FAD Mission on Estimation Of VAT Gap And Capacity June 2009 FAD Mission on VAT Treatment Of Financial Services June 2010 FAD Mission on Tax Gap Analysis September 2011 FAD Micro-Simulation Models December 2013FAD Analysis of the Macroeconomic Impact of Tax Policy March 2015 FAD Reforming the Personal Income Tax October 2015 Tax Administration Reform FAD Five Missions on Computerizations June 2000–Oct. 2002 FAD Two Missions on Strategic Planning Nov 2001–Aug 2002 FAD Seminar on Strategic Planning In Washington October 2002 FAD Mission on Revenue Administration November 2003 FAD Review on Computerization Project September 2004 FAD Mission on Business Process Reengineering Pilot November 2005 FAD Mission on IT Modernization June 2006 FAD Mission on Strategic Planning, Risk Management, And Taxpayer Services September 2006 FAD Mission on VAT Invoice Cross-Checking And Other Administration Issues March 2007 FAD Mission on Business Process Re-Engineering And Golden Tax Project 3 August 2007 FAD Seminar on Strategic Planning And Management January 2008 FAD Mission on VAT on Services, Resource Tax Policy October 2009 FAD Mission on Project Management Golden Tax Project 3 June 2010 FAD Expert Visit on Strategic Planning October 2010 FAD Mission on Tax Administration: Large Taxpayers October 2010 FAD Peripatetic Expert Visit On Tax Administration October 2010 FAD Tax Policy And Administration September 2011 FAD Tax Administration (Peripatetic Expert Visit 4 Of 5) October 2011 FAD Tax Administration (Peripatetic Expert Visit 5 Of 5) October 2011 FAD Large Taxpayer Compliance October 2011 FAD Workshop on Practical Tax Analysis For Tax Officials December 2012 FAD Large Taxpayer Administration January 2013 FAD Tax Administration Follow-Up April 2014 FAD Tax Collection Law Revision May 2014FAD Tax Collection Law Revision July 2015 LEG Mission on Reforming Tax Collection Law July 2015 FAD Reforming the Personal Income Tax October 2015 Public Financial Management FAD Workshop on Government Fiscal Management Information System February 2001 FAD Mission on Treasury/Accounting Reform; Macro-Fiscal Coordination November 2001 FAD Mission on Budget Preparation, Classification, And Treasury Reform June 2002

PEOPLE’S REPUBLIC OF CHINA
16 INTERNATIONAL MONETARY FUND
Public Financial Management FAD Mission On Budget Classification March 2003 FAD Workshop On Budget And Treasury Modernization In Washington October 2003 FAD Mission On Treasury And Accounting Reforms November 2003 FAD Mission On Budget Law I March 2004 FAD Mission On Treasury Single Account and Cash Management Reform April 2006 FAD Mission On Budget Law II September 2007 FAD Discuss FAD’s PFM Program With Authorities September 2007 FAD/STA Mission On Accrual Accounting September 2007 FAD Seminar On Local Government Cash Management December 2009 FAD Presentation of The Budget Institutions Paper May 2010 FAD High-level Dialogue on PFM Institutions June 2011 FAD Medium-Term Expenditure Framework Seminar November 2011 FAD Medium-Term Revenue Administration Program And Policies Discussion June 2012 FAD High-Level Dialogue on PFM Institutions November 2012 FAD Mission on Introducing Advanced Treasury Reforms February 2013 FAD High-level Seminar on Fiscal Reforms January 2014 FAD Mission on Modernization Of Government Accounting April 2014 FAD Mission on Medium Term Expenditure Frameworks July 2014 FAD Expert visit on Treasury management (accounting) September 2014 FAD Expert visit on Chart of Accounts Improvements March 2015 FAD Expert visit on Treasury Management (cash management) March 2015 FAD Mission on Strengthening Local Government Borrowing Reform April 2015 FAD Mission on Accounting Modernization November 2015 FAD Workshop on Medium-Term Expenditure Frameworks April 2016 FAD Seminar and Case Study on Local Government Borrowing and Bond
Market Development April 2016
FAD Local government Borrowing Framework April 2015 FAD Accounting and Financial Reporting Reforms November 2015 FAD/MCM Regulatory Framework of Local Government Finance April 2016 FAD Medium-Term Expenditure Framework Workshop April 2016 FAD Expert visit on Treasury – Central Bank Coordination June 2016
Intergovernmental Fiscal Relations
FAD Mission Intergovernmental Relations November 2002 FAD Mission On Subnational Fiscal Risks November 2003 FAD Conference On Reforming Assignments And Next Steps In Intergovernmental
Reforms November 2007
Statistics
STA Seminar On General Data Dissemination System April 2001 STA Missions On Trade Price Statistics Jun. 2001–Jan. 2002STA Mission On GDDS Feb./Mar. 2002 STA Seminar On GDDS/SDDS In Washington September 2002 STA GDDS Review December 2003 STA Mission On Government Financial Statistics January 2005 STA Mission On Monetary And Financial Statistic Feb./Mar. 2005STA Seminar On International Investment Position April 2005 STA Seminar On IIP Statistics April 2005 STA Seminar On External Debt Statistics August 2005 STA Macroeconomic Statistics May 2006

PEOPLE’S REPUBLIC OF CHINA
INTERNATIONAL MONETARY FUND 17
Statistics STA Balance Of Payments And IIP Course June 2007 STA Mission On Monetary And Financial Statistics August 2007STA Seminar On Balance Of Payments And International Investment Position
Manual, Sixth Edition (BPM6) April 2008
STA BPM6 Course June2009 STA Seminar On Services Statistics November 2009 STA Seminar On Financial Derivates, Direct Investment And External Debt September 2010STA Balance Of Payments And IIP Course June 2011 STA Government Finance Statistics September 2008 STA Financial Soundness Indicators June 2009 STA Monetary And Financial Statistics October 2010STA Workshop On Special Data Dissemination Standard April 2011 STA Government Finance Statistics May 2011 STA Data Work: SRFS Data Development for OFCs/ FSI Data Reporting April 2012 STA Quarterly National Accounts November 2013 STA Total Social Financing(TSF) Indicators/Monetary and Financial Statistics March 2014 STA SDDS Assessment August 2014 STA Data Work: Monetary Data Reported in SRF September 2014STA SDDS Assessment December 2014 STA STA STA
TSF/Monetary Data Reported in SRFs Multi-sector Mission: SDDS Metadata Development and Topical TA Real Sector Statistics (scheduled)
March 2015 June 2015
August 2016 Monetary Policy, Bank Supervision, and AML/CFT MFD Missions On Banking Supervision October 2003 MFD AML/CFT Issues September 2003 MFD AML/CFT Supervision March 2004 MFD Bank Restructuring April 2004 MFD/LEG AML/CFT Advisory Mission January 2005 MFD/LEG AML/CFT Issues April 2005 FAD Visit To Review UNDP/IMF/China Fiscal Reform TA Program February 2001 FAD/TAS Two Missions For Tripartite Review Of The UNDP/IMF/China Fiscal Reform TA
Program Jan. 2002/Feb. 2003
MFD Mission On TA Needs In Banking Sector Reform July 2002 MFD Mission On TA Needs In Financial Sector October 2003 FAD Participation In UNDP/DFID Fiscal Reform Workshop February 2004 FAD Visit To Discuss TA Needs Under UNDP/DFID Fiscal Reform Project December 2004 LEG/MFD AML/CFT Issues April 2006 LEG AML/CFT Mission To Discuss TA To The Monetary Authority Of Macao SAR July 2006 LEG AML/CFT Legislative Drafting July 2006 LEG AML/CFT Legislative Drafting August 2006 LEG AML/CFT Legislative Drafting September 2006 LEG AML/CFT Legislative Drafting TA To The Monetary Authority Of Macao SAR September 2006 LEG AML/CFT Financial Institutions Inspection STX Advice Mission, Macao SAR December 2008 LEG AML/CFT Financial Intelligence Unit Procedural Improvements, Macao SAR March 2010LEG AML/CFT Legislative Drafting July 2010 LEG AML/CFT Legislative Drafting March 2011 LEG Bank Resolution May 2012 LEG AML/CFT Mission To Discuss Future Cooperation And TA November 2009

PEOPLE’S REPUBLIC OF CHINA
18 INTERNATIONAL MONETARY FUND
Monetary Policy, Bank Supervision, and AML/CFT INS Courses On Financial Programming And Policies (3) Jul. 2000–Jun. 2002 INS Course On Banking Supervision June 2001 INS High-Level Seminar On Banking Reform March 2001 STA Seminar On Money And Banking Statistics April 2001 MFD Course On Banking Supervision (On-Site And Off-Site) July 2001 MFD Banking Risk Management July 2001 INS Course On Financial Programming And Policies August 2001MFD Seminar On Capital Account Convertibility October 2001 FAD Course On Public Sector Expenditure Management June/July 2002 STA Seminar On Balance Of Payments And IIP Statistics August 2002 STA Course On Government Financial Statistics September 2002 INS Course On Banking Supervision September 2002 MFD Central Bank Accounting November 2002 STA Course On Government Financial Statistics September 2003 INS Course On Financial Programming And Policies October 2003 MFD Course On Assessing Financial Systems November 2003 INS Course On Advanced Financial Programming (Washington) November 2003 STA Course On Monetary And Financial Statistics Nov./Dec. 2003
Training
STA Money and Banking Statistics: Training Course December 2003
STA Money and Banking Statistics: Meeting and Lecturing December 2003
FAD International Experience with Budget Law and Budget Law Reform March 2004 INS High-Level seminar on Monetary Policy Transmission April 2004 LEG/MFD AML/CFT Workshop April 2004 INS High-Level seminar on China’s Foreign Exchange System May 2004 STA Seminar on Coordinated Portfolio Investment Survey April 2004 INS Course on Financial Market Analysis June 2004 MFD Workshop on Ex and Balance of Payments Issues June 2004 INS Course on Macroeconomic Management and Financial Sector Issues July 2004 STA Seminar on Quarterly National Accounts September 2004 INS Course on Financial Programming and Policies October 2004 STA High Level Seminar on Macroeconomic Statistics January 2005 MFD AML/CFT Training for PBC Officials February 2005 LEG AML/CFT Symposium May 2005 MFD Workshop on Monetary Strategy and Operation May 2005 INS Course on Financial Programming and Policies June 2005 INS Course on Macroeconomic Management and Fiscal Issues June 2005 LEG National IT Symposium July 2005 LEG AML/CFT Workshop July 2005 INS Course on Macroeconomic Management and Financial Sector Issues July 2005 STA Course on External Debt Statistics August 2005 STA Course on Monetary and Financial Statistics September 2005 MFD AML/CFT Symposium September 2005MFD AML/CFT and Internal Control Workshop November 2005 LEG/MFD Advanced Training on ML and TF Typologies and STRs December 2005 LEG AML/CFT Workshop January 2006 MFD Course on Foreign Exchange Operations March 2006 INS Course on Macroeconomic Management and Financial Sector Issues May 2006
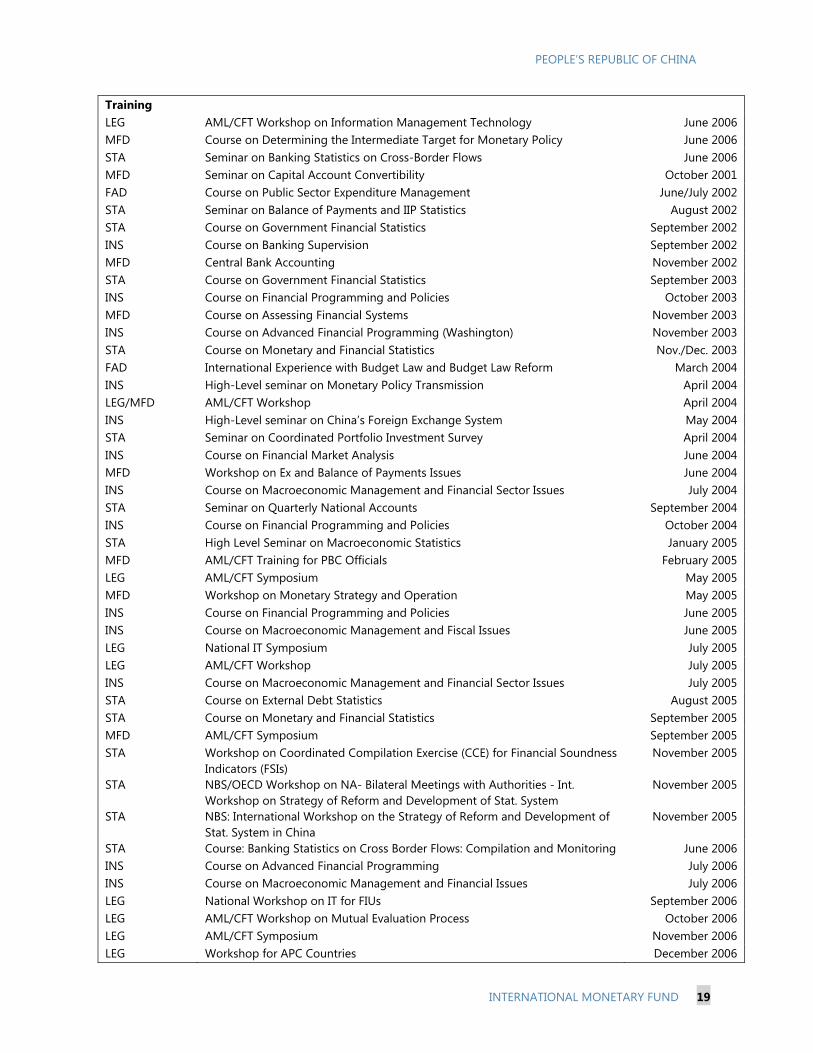
PEOPLE’S REPUBLIC OF CHINA
INTERNATIONAL MONETARY FUND 19
Training LEG AML/CFT Workshop on Information Management Technology June 2006 MFD Course on Determining the Intermediate Target for Monetary Policy June 2006 STA Seminar on Banking Statistics on Cross-Border Flows June 2006MFD Seminar on Capital Account Convertibility October 2001 FAD Course on Public Sector Expenditure Management June/July 2002 STA Seminar on Balance of Payments and IIP Statistics August 2002 STA Course on Government Financial Statistics September 2002 INS Course on Banking Supervision September 2002 MFD Central Bank Accounting November 2002 STA Course on Government Financial Statistics September 2003 INS Course on Financial Programming and Policies October 2003 MFD Course on Assessing Financial Systems November 2003 INS Course on Advanced Financial Programming (Washington) November 2003 STA Course on Monetary and Financial Statistics Nov./Dec. 2003 FAD International Experience with Budget Law and Budget Law Reform March 2004 INS High-Level seminar on Monetary Policy Transmission April 2004 LEG/MFD AML/CFT Workshop April 2004 INS High-Level seminar on China’s Foreign Exchange System May 2004 STA Seminar on Coordinated Portfolio Investment Survey April 2004 INS Course on Financial Market Analysis June 2004 MFD Workshop on Ex and Balance of Payments Issues June 2004 INS Course on Macroeconomic Management and Financial Sector Issues July 2004 STA Seminar on Quarterly National Accounts September 2004 INS Course on Financial Programming and Policies October 2004 STA High Level Seminar on Macroeconomic Statistics January 2005 MFD AML/CFT Training for PBC Officials February 2005 LEG AML/CFT Symposium May 2005 MFD Workshop on Monetary Strategy and Operation May 2005 INS Course on Financial Programming and Policies June 2005 INS Course on Macroeconomic Management and Fiscal Issues June 2005 LEG National IT Symposium July 2005 LEG AML/CFT Workshop July 2005 INS Course on Macroeconomic Management and Financial Sector Issues July 2005 STA Course on External Debt Statistics August 2005 STA Course on Monetary and Financial Statistics September 2005 MFD AML/CFT Symposium September 2005STA Workshop on Coordinated Compilation Exercise (CCE) for Financial Soundness
Indicators (FSIs) November 2005
STA NBS/OECD Workshop on NA- Bilateral Meetings with Authorities - Int. Workshop on Strategy of Reform and Development of Stat. System
November 2005
STA NBS: International Workshop on the Strategy of Reform and Development of Stat. System in China
November 2005
STA Course: Banking Statistics on Cross Border Flows: Compilation and Monitoring June 2006 INS Course on Advanced Financial Programming July 2006 INS Course on Macroeconomic Management and Financial Issues July 2006 LEG National Workshop on IT for FIUs September 2006 LEG AML/CFT Workshop on Mutual Evaluation Process October 2006 LEG AML/CFT Symposium November 2006LEG Workshop for APC Countries December 2006

PEOPLE’S REPUBLIC OF CHINA
20 INTERNATIONAL MONETARY FUND
Training LEG AML/CFT Workshop May 2007 LEG AML/CFT Training for Supervisors May 2007 LEG AML/CFT Training for Macao SAR Supervisors May 2007 INS Course on Financial Programming and Policies May 2007 STA Course on Balance of Payments Statistics June/July 2007 INS Course on Macroeconomic Management and Financial Sector Issues July 2007 LEG AML/CFT Training for Insurance and Securities Sectors Supervisors October 2007 STA Course on Monetary and Financial Statistics October 2007 STA Course at the CTP on Money and Banking Statistics October 2007 MCM Workshop on FSAP and Financial Stability December 2007 MCM Workshop on Stress Testing December 2007 LEG AML/CFT Risks in the Casino Sector December 2007 STA Training: CCE/FSIs Seminar to Visiting Chinese Delegation December 2007 FAD Seminar on Revenue Forecasting March 2008 LEG AML/CFT Legislative Drafting Workshop January 2008 FAD Seminar on Revenue Forecasting March 2008 INS Course on Financial Programming and Policies April 2008 STA Seminar: BPM6 Training with BOP Compilers from Head Office and Local Offices April 2008 LEG AML/CFT Supervision Workshop May 2008 INS Course on External Vulnerabilities June 2008 STA Course on Government Finance Statistics September 2008 STA Seminar on Financial Soundness Indicators and Money and Banking Statistics September 2008 INS Course on Macroeconomic Management and Financial Sector Issues October 2008 LEG AML/CFT Risk-Based Supervision Workshop November 2008 INS Course on External Vulnerabilities Analysis February 2009 INS Course on Financial Programming and Policies May 2009 STA Course on Balance of Payments and International Position Statistics June 2009 STA Coordinated Direct Investment Survey/ External Debt INS Course on Macroeconomic Management and Financial Sector Issues November 2009 LEG AML/CFT Risk-Based Supervision Workshop November 2009 STA National Accounts Statistics November 2009 STA Seminar: Services Statistics November 2009
INS Course on Financial Programming and Policies January 2010 MCM FSAP Workshop January 2010 STA Course on Monetary and Financial Statistics March 2010 LEG AML/CFT Risk-Based Supervision Workshop April 2010 INS Course on Macroeconomic Management and Financial Sector Issues May 2010 LEG AML/CFT Legislative Drafting Mission July 2010 LEG AML/CFT Risk-based Supervision Workshop September 2010 STA Seminar on Financial Soundness Indicators Reporting and Disseminating September 2010 STA Seminar on Balance of Payments Statistics: FDI/EXD/CPIS September 2010STA Workshop on Statistics on Derivative Transactions September 2010 MCM Financial Regulation Workshop October 2010 LEG AML/CFT Legislative Drafting Mission March 2011 INS Course on Macroeconomic Management and Financial Sector Issues March 2011 INS Course on Macroeconomic Forecasting April 2011 INS Government Finance Statistics Course at CTP May 2011 STA Course on Government Finance Statistics May 2011

PEOPLE’S REPUBLIC OF CHINA
INTERNATIONAL MONETARY FUND 21
Training STA Course on Government Finance Statistics June 2011 INS BOP and IIP Course at CTP June 2011 STA Course on Balance of Payments Statistics October 2011 INS Monetary and Financial Statistics Course at CTP November 2011
STA Participate in OECD-NBS Workshop on National Accounts March 2012 INS FSI Course at CTP September 2012 MCM Medium Term Debt Management Workshop November 2012 INS BOP/IIP Course at CTP April 2013 MCM Workshop on Capital Account Convertibility and Exchange Rate Policy June 2013 STA SDDS Seminar July 2013 INS Introductory Course on Monetary and Financial Statistics in CTP September 2013 STA Quarterly National Accounts Seminar organized by NBS November 2013 ICD Macroeconomic Management & Financial Sector Issues January 2014 MCM Financial Statistics March 2014 MCM Workshop on Financial Regulation and Supervision March 2014 ICD Macroeconomic Management & Financial Sector Issues March 2014 ICD Macroeconomic Diagnostics September 2014 INS Financial Soundness Indications in CTP September 2014 STA Seminar at Fund HQ for SAFE Officials on Experiences and Challenges in the
Implementation of BPM6 September 2014
ICD STA
Macroeconomic Forecasting OECD/NBS Workshop on Sectoral Accounts (with STA participation)
October 2014 December 2014
ICD Macroeconomic Management and Financial Sector Issues March 2015 MCM/STA Total Social Financing Indicator March 2015 STA Meeting: ECB Meeting with Delegation from China on Debt Securities & Data
Issues April 2015 STA Meeting: BIS Meeting with Delegation from China on Debt Securities & Data
Issues April 2015 MCM SDR Review/Operational Issues June 2015
ICD Macroeconomic Forecasting June/July 2015 INS Advanced Course on Monetary and Financial Statistics in CTP August 2015 STA SAFE-Course on Compilation of Balance of Payments Statistics September 2015 ICD Macroeconomic Diagnostics (scheduled) September 2015 STA Balance of Payments Statistics September 2015 STA STA
Debt Securities Statistics OECD/NBS China Workshop on National Accounts (with STA participation)
March 2016 March 2016
ICD/FAD Fiscal Analysis and Forecasting November 2015 FAD/ICD Course on Fiscal Analysis and Forecasting December 2015 MCM Sub-national Debt Market Development April 2016
MCM Workshop on Securities Supervision April 2016
ICD Macroeconomic Forecasting (Scheduled) June/July 2016 ICD Macroeconomic Forecasting – Advanced (Scheduled) July 2016 ICD Financial Sector Surveillance (Scheduled) June/July 2016 ICD Dynamic Stochastic General Equilibrium Modeling (Scheduled) November 2016 1/ The new Institute for Capacity Development (ICD) was formed from the merger of the former IMF Institute (INS) and Office of Technical Assistance Management (OTM) on May 1, 2012.
Statement by the IMF Staff Representative on the People’s Republic of China Executive Board Meeting
July 27, 2016
1. This statement contains information that has become available since the staff report was circulated. This information does not alter the thrust of the staff appraisal.
2. Recent data releases are in line with staff projections:
Q2 GDP growth was 6.7 percent (y/y), driven by continued strong consumption growth (contributing two-thirds of GDP growth), while overall investment growth stabilized (contributing one-third of GDP growth).
High-frequency indicators for June point to continued robust momentum. Retail sales continued to grow strongly at 10.6 percent (y/y) and industrial production edged up to 6.2 percent (y/y), while fixed asset investment moderated to 9.0 percent (y/y). The profits of industrial enterprises rose by 6.4 percent (y/y) in the first five months of this year.
The trade surplus narrowed marginally in June, with export growth (in USD terms) slowing modestly (-4.8 percent, y/y) and import growth falling (-8.4 percent, y/y). FX reserves increased by US$14 billion, to US$3,205 billion. However, the central bank’s FX purchase position fell by the equivalent of US$15 billion.
Credit growth moderated somewhat, with total social financing growth of 12.3 percent (y/y) in June. Adjusting for the local government bond swap, total social financing moderated to 16.3 percent (y/y) in June.
Headline CPI inflation eased slightly to 1.9 percent (y/y) in June while PPI inflation picked up to -2.6 percent (y/y).
3. Financial markets remain stable after UK voters’ June 23 decision to exit the European Union.
After a small loss (1.3 percent) on the first trading day after the decision (June 24), the Shanghai composite index rose by 6.5 percent as of July 21.
As of 21 July, the onshore exchange rate against the USD had weakened by 1.5 percent since June 23, while the CFETS basket RMB index remained relatively stable, depreciating 0.2 percent. The spread between the RMB/USD exchange rates in Mainland China (CNY) and Hong Kong SAR (CNH) markets remained below 0.7 percent during this period.

Statement by Mr. Zhongxia Jin, Executive Director for the People’s Republic of China; Mr. Ping Sun, Alternate Executive Director; and Mr. Jing Chen, Senior Advisor
July 27, 2016
China is undertaking a determined transition to a more balanced and sustainable growth trajectory. Its economic growth, albeit moderated from its peak to 6.7 percent in the first half of 2016, is still among the strongest worldwide. CPI growth is well anchored at around 2 percent. The labor market remains robust with 13 million new urban jobs being added in 2015. Seven million more were created during the first half of 2016. These latest developments indicate the strong fundamentals of the real economy. High frequency indicators also saw new signs of revival during the first half of the year. PPI strengthened month-on-month; industrial inventory declined for the first time since 2010; the growth of industrial value-added picked up month-on-month; and sales of housing and automobiles increased markedly. The rebalancing continued to see concrete progress, with the consumption’s contribution to GDP growth reaching 73 percent, up by 13 percentage points over the last year. The current account surplus stayed below 3 percent of GDP, while capital account outflows moderated, resulting in a slight increase of foreign reserves in June. It is particularly noteworthy that overcapacity has started to phase out in the coal and steel sectors. The service industry contributed 54 percent of GDP in the first half, up by 2 percentage points over the last year. The manufacturing sector is moving up the value chain, as the growth of the high-tech sector outpaced the industrial average by 70 percent. E-commerce has kept growing at double digits, taking up an increasing market share. Return to growth potential China has committed to structural changes aimed at long-term potential rather than short-term growth numbers. It has been widely accepted that the slowdown is a needed transition to the new sustainable growth path. China would not rely on excessive stimulus to pursue unrealistic targets at the cost of the long-term outlook, while appropriate macroeconomic policy response is necessary to ensure a smooth transition. In fact, the credit boom earlier this year has already waned; growth of credit and M2 has been smoothed and moderated, and housing price hikes in Tier 1 cities were largely reined in. Long-term goals of transition and reform have been reassured in the 13th five-year plan. Looking ahead, China has the potential to sustain growth within a desired range of around 6 to7 percent, sometimes slightly higher than the staff’s baseline assessment. Specifically, the potential for growth is huge on the demand side:

2
The capital/labor ratio, urbanization ratio, and infrastructure (especially in per capita terms) are still far below the AEs’ level, implying large gaps to close, and great potential for catching up; hence, there is lasting demand for investment.
Continued migration of the rural population to the urban areas, moving from agricultural
sector to more productive sectors, will support robust employment shifting and income convergence with advanced economies.
Such demands would also be supported by strong fundamentals on the supply side:
National savings—even though moderating—would remain high by global standards to fuel
the lasting investment demand. The manufacturing sector in China—featuring the world’s largest capacity and a complete
supply chain—would be able to support the rising demand. The labor force, albeit with less new flows, will generate more human capital, with an
increasing share of educated graduates and skilled workers. Both private and public sectors in China are heavily investing in new technologies and “new
economies,” reflected by China’s top ranking in new patent applications and registrations and its moving up along the world’s export value chain. Hence, productivity would be boosted.
In view of such strong potential for growth, existing policy space could be tapped to avoid a “hard landing,” thus achieving the potential output. Decisive structural reforms on the supply side would further unlock the potential, notably SOE reforms, streamlining administrative approvals, and enhancing the role of market forces based on broad entry, smooth exit, proper pricing, and effective oversight. Tackling the high leverage Based on BIS data (Table 1 below), the overall leverage in China is high but is not particularly outstanding compared to peers. Leverage in China, unlike most AEs, is prominent in the corporate sector, reflecting the dominant banking sector and underdeveloped capital market; but leverage is rather low in the government and in households. Unlike most EMs, 97 percent of leverage in China is financed by domestic savings, with much smaller exposure to currency mismatch, and is, therefore, more of a combined issue of maturity mismatch and soft budget constraint in some SOEs. In addition, debt-to-GDP ratios are not to be compared across countries, because of their high savings rate differential. Debt in stock should be measured against assets in stock rather than against GDP—which is a flow—to reflect more precisely the actual solvency. In fact, the debt-to-asset ratio of China’s industrial corporate sector averaged at 56 percent in June, indicating the higher debt coverage by assets than by GDP.
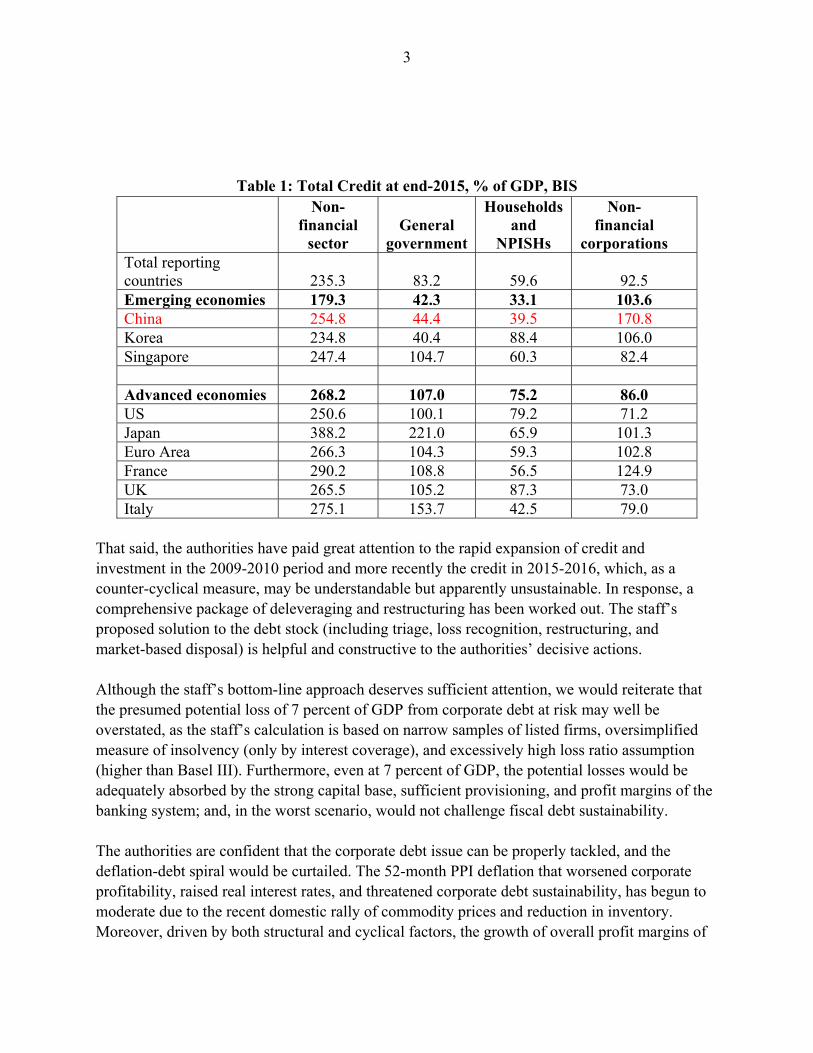
3
Table 1: Total Credit at end-2015, % of GDP, BIS
Non-financial
sectorGeneral
government
Households and
NPISHs
Non-financial
corporations Total reporting countries 235.3 83.2 59.6 92.5 Emerging economies 179.3 42.3 33.1 103.6 China 254.8 44.4 39.5 170.8 Korea 234.8 40.4 88.4 106.0 Singapore 247.4 104.7 60.3 82.4 Advanced economies 268.2 107.0 75.2 86.0 US 250.6 100.1 79.2 71.2 Japan 388.2 221.0 65.9 101.3 Euro Area 266.3 104.3 59.3 102.8 France 290.2 108.8 56.5 124.9 UK 265.5 105.2 87.3 73.0 Italy 275.1 153.7 42.5 79.0
That said, the authorities have paid great attention to the rapid expansion of credit and investment in the 2009-2010 period and more recently the credit in 2015-2016, which, as a counter-cyclical measure, may be understandable but apparently unsustainable. In response, a comprehensive package of deleveraging and restructuring has been worked out. The staff’s proposed solution to the debt stock (including triage, loss recognition, restructuring, and market-based disposal) is helpful and constructive to the authorities’ decisive actions. Although the staff’s bottom-line approach deserves sufficient attention, we would reiterate that the presumed potential loss of 7 percent of GDP from corporate debt at risk may well be overstated, as the staff’s calculation is based on narrow samples of listed firms, oversimplified measure of insolvency (only by interest coverage), and excessively high loss ratio assumption (higher than Basel III). Furthermore, even at 7 percent of GDP, the potential losses would be adequately absorbed by the strong capital base, sufficient provisioning, and profit margins of the banking system; and, in the worst scenario, would not challenge fiscal debt sustainability. The authorities are confident that the corporate debt issue can be properly tackled, and the deflation-debt spiral would be curtailed. The 52-month PPI deflation that worsened corporate profitability, raised real interest rates, and threatened corporate debt sustainability, has begun to moderate due to the recent domestic rally of commodity prices and reduction in inventory. Moreover, driven by both structural and cyclical factors, the growth of overall profit margins of
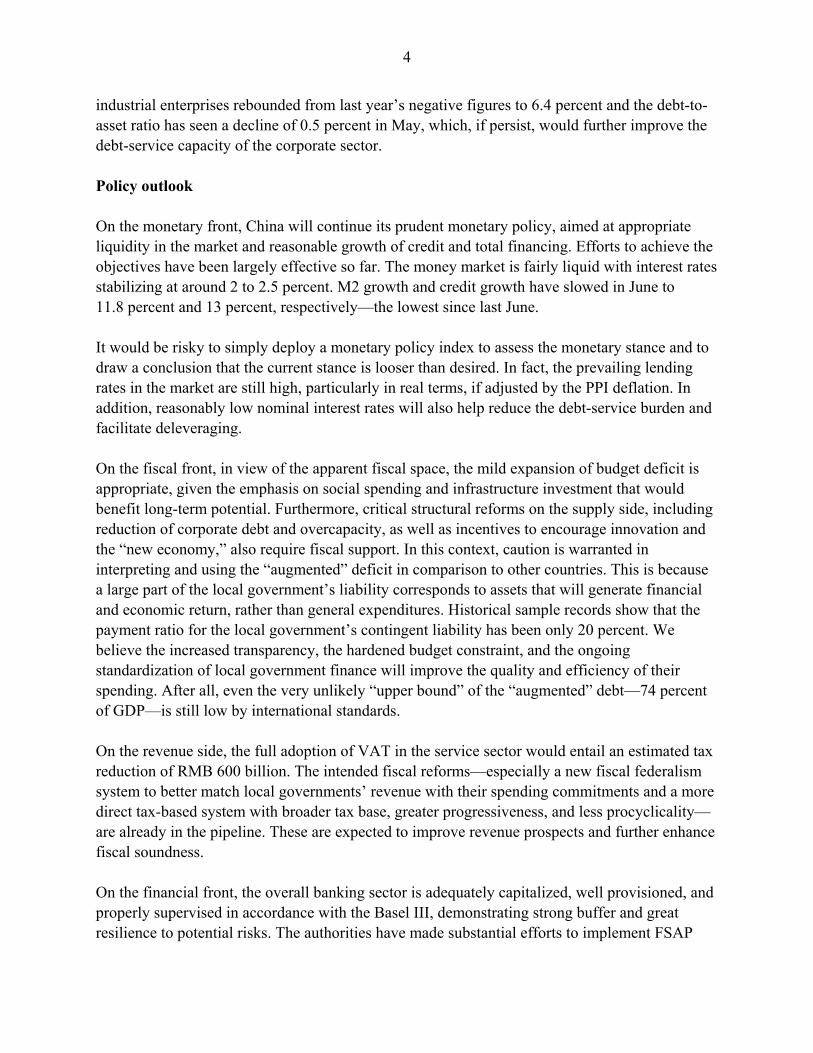
4
industrial enterprises rebounded from last year’s negative figures to 6.4 percent and the debt-to-asset ratio has seen a decline of 0.5 percent in May, which, if persist, would further improve the debt-service capacity of the corporate sector. Policy outlook On the monetary front, China will continue its prudent monetary policy, aimed at appropriate liquidity in the market and reasonable growth of credit and total financing. Efforts to achieve the objectives have been largely effective so far. The money market is fairly liquid with interest rates stabilizing at around 2 to 2.5 percent. M2 growth and credit growth have slowed in June to 11.8 percent and 13 percent, respectively—the lowest since last June. It would be risky to simply deploy a monetary policy index to assess the monetary stance and to draw a conclusion that the current stance is looser than desired. In fact, the prevailing lending rates in the market are still high, particularly in real terms, if adjusted by the PPI deflation. In addition, reasonably low nominal interest rates will also help reduce the debt-service burden and facilitate deleveraging. On the fiscal front, in view of the apparent fiscal space, the mild expansion of budget deficit is appropriate, given the emphasis on social spending and infrastructure investment that would benefit long-term potential. Furthermore, critical structural reforms on the supply side, including reduction of corporate debt and overcapacity, as well as incentives to encourage innovation and the “new economy,” also require fiscal support. In this context, caution is warranted in interpreting and using the “augmented” deficit in comparison to other countries. This is because a large part of the local government’s liability corresponds to assets that will generate financial and economic return, rather than general expenditures. Historical sample records show that the payment ratio for the local government’s contingent liability has been only 20 percent. We believe the increased transparency, the hardened budget constraint, and the ongoing standardization of local government finance will improve the quality and efficiency of their spending. After all, even the very unlikely “upper bound” of the “augmented” debt—74 percent of GDP—is still low by international standards. On the revenue side, the full adoption of VAT in the service sector would entail an estimated tax reduction of RMB 600 billion. The intended fiscal reforms—especially a new fiscal federalism system to better match local governments’ revenue with their spending commitments and a more direct tax-based system with broader tax base, greater progressiveness, and less procyclicality—are already in the pipeline. These are expected to improve revenue prospects and further enhance fiscal soundness. On the financial front, the overall banking sector is adequately capitalized, well provisioned, and properly supervised in accordance with the Basel III, demonstrating strong buffer and great resilience to potential risks. The authorities have made substantial efforts to implement FSAP
5
recommendations, especially those of high priorities. In view of concerns on the rising NPLs and booming nonbank financing, the authorities have kept close watch of the evolving risks and the interlinkages across the entire financial system, with committed efforts in the early warning of potential risks, the mitigation of emerging risks, and a thorough stocktaking of the actual risk profile of financial institutions. Toward this end, the authorities have been cooperating with the Fund and the Bank on undertaking a full scope update of FSAP. A macroprudential framework has been put in place and coordination among regulatory authorities, as well as communications, have been enhanced so as to guard against systemic risks and better guide public expectations.