Embed Size (px)
Citation preview

THE PENSION SCHEME IN VIETNAM:
Current Status and Challenges in an Aging Society
GIANG THANH LONG*
April 2004
Vietnam Development Forum * Giang Thanh Long is a lecturer at the National Economics University in Hanoi, Vietnam, and a researcher at the Vietnam Development Forum. The author may be contacted at [email protected].

Abstract
The publicly-managed Pay-As-You-Go (PAYG) defined-benefit pension scheme in Vietnam is described, with an analysis of its financial sustainability in the context of an aging society in a dynamically efficient economy. By using actuarial models developed by the International Labor Organization (ILO), the paper finds that the implicit pension debt (IPD) of the scheme is high in comparison with GDP of the year 2000, which is the base year for projections. Regarding the social aspect, a high IPD implies that the burden of maintaining this scheme is borne by the current and future participants. For this reason, the pension scheme in Vietnam will cause not only financial instability but also inter-generational inequity. In order to avoid this situation, the current scheme needs to be reformed. In particular, Vietnam should move to a partially-funded defined-contribution scheme with careful considerations of social and economic impacts so as to avoid both financial instability and inter-generational inequity.

Glossary Compliance rate. The ratio of the number of people on whose behalf contributions are actually paid to
the scheme to the number of people who are legally covered by the scheme. Contribution rate. A determined percentage of the covered insurable earnings that is to be collected for
the financing of the scheme. Defined benefit scheme. A scheme which defines the standards of the benefits to be provided by means
of a formula and determines the financial system accordingly. This formula, which determines pensions or lump-sum payments, is tied to years worked, earnings and social criteria. Some entity (the state, employer, insurance company) bears the financial risk of the promise or entitlement embedded in the formula.
Defined contribution scheme. A scheme which defines its benefits in terms of the contributions to be paid into individual accounts, together with shares of investment income, from which the benefit will be paid when qualifying conditions are satisfied. The workers bear financial risk.
Implicit pension debt (net). The value of outstanding pension claims on the public sector minus accumulated pension reserves.
Notional defined-contribution (NDC) scheme. This is a scheme where a worker’s account is set up as a bookkeeping device, to keep track of contributions plus imputed interest at a rate determined by the government, but funds are never accumulated in these accounts. Instead, money is used to pay current benefits and the accounts are notional or empty. When the worker reaches retirement age, the notional accumulation in his/her account is converted into annuity (its size depends on the expected duration of retirement and the interest rate) and paid to the retirement out of contributions that younger workers are making at that time, as they build up their own accounts.
Old-age dependency ratio. Residents above 60 years of age divided by the residents between 15 and 60 years of age.
Pay-as-you-go (PAYG). A social security financial system under which current revenues (mostly from contributions such as payroll taxes) are used to cover current benefits (e.g. mandatory old age pensions) year by year.
Pay-as-you-go (PAYG) cost rate. This is the result from dividing the total expenditure by the total contributory earnings and indicates the contribution rate needed to balance income with expenditure.
Replacement ratio. Proportion of pre-retirement income available as an annuity during retirement. Total fertility rate. The number of children who would be born to a woman if she were to live to the
end of her childbearing years and bear children in accordance with current age-specific fertility rates.
Youth dependency ratio. The ratio of the population younger than age 15 to the population aged 15 to 60.

I. INTRODUCTION
Demographic changes have significant impacts on the social and economic performances of countries, regions and the whole world. Recently, the most observable demographic change is the phenomenon of rapidly aging population. The proportion of the elderly in the total population is sharply increasing due to declining fertility rates and increasing life expectancy. Population aging requires huge public expenditures for the aged on pensions, health and medical care, and influences government budgets, pension funds, and eventually long-term fiscal sustainability. The problem of an aging population becomes more serious if it is associated with the pay-as-you-go (PAYG) defined-benefit pension scheme. Recent empirical analyses indicate that these two issues are potential threats to the financial stability of the pension fund in particular, and the government budget in general in almost all economies in the world*.
In addition to the problem of financial instability arising from an aging society, PAYG defined-benefit pension schemes also cause inter-generational inequity. Along with the aging population, this issue is becoming more severe because young and future workers have to pay greater contributions to cover expenditures for the current pensioners. Hence, the pension scheme will, sooner or later, collapse because of contribution evasion, generous benefits, and huge implicit pension debt. These related aspects of the issue are described by Gokhale (1996), Feldstein (1998), Kotlikoff and Leibfritz (1998), Takayama et al. (1998), and Kunieda (2001).
Even though Vietnam is still a young economy with about 7 percent of its total population aged 60 and over, it will also face the same problems of aging as other countries in the next fifty years. Thanks to the recent impressive economic growth and social progress, higher living standards of Vietnamese people have led to increasing life expectancy at birth from 40.2 years in 1950 to 64.8 and 69.2 in 1990 and 2001, respectively; and declining fertility rates from 6 children per woman in 1960 to 3.4 and 2.33 in 1990 and 2001, respectively (GSO, 2002). According to the population projections of the United Nations (2002) for Vietnam in 2050, the number of persons aged 60 and over will account for around 24 percent of the total population; and the elderly and demographic dependency ratios will be 42 and 77 percent, respectively. Further, the current publicly-managed PAYG defined-benefit pension scheme in Vietnam is inherently fragile in financial stability due to limited coverage, low contributions along with a relatively high replacement rate. The combination of these factors will result in an obvious consequence: deterioration of the scheme with an increasing financial instability. The most recent actuarial valuation on the social security system of Vietnam finds that the social fund will be depleted in 2030 if no policy measures are taken (ILO, 1998). This is an imminent pitfall of the pension scheme in the near future, and policy options sustaining the pension scheme need to be urgently explored.
This paper aims to analyze the financial sustainability of the pension scheme in Vietnam up to the year 2050. It discusses the issues of financial viability and stability, and inter-generational inequity of * See, for example, Hagemann and Nicoletti (1989), Auerbach et al. (1989), Holzmann (1997, 1998), and
Holzmann et al. (2001).
1

the scheme. It then suggests policy reforms in order to stabilize the scheme and ensure inter-generational equity. II. PENSION SCHEME IN VIETNAM: CURRENT STATUS AND CHALLENGES
The pension scheme in Vietnam is a component of the social insurance system, which has been in operation since 1962. Before 1995, the pension scheme was defined-benefit, which covered only the employees of the state sector, and it was managed by different agencies under the supervision of the government. In that scheme, the benefit levels for retirement were defined by the number of working years and base earnings (normally, the wage at the time of retirement). The benefits were paid by the social insurance fund, which was created to receive contributions from employers through the payroll, and subsidies from the government budget. The fund was managed and guaranteed by the government, and was a component of the government budget. In almost thirty years, especially during the rigorous war, the scheme significantly contributed to the income and living stabilization of the insured people.
The complications and difficulties arising from administrative and financial managements of the scheme associated with the growing private sector, however, forced the government to reform the scheme, and led to the establishment of a publicly-managed PAYG defined-benefit scheme in 1995, where the Vietnam Social Insurance (VSI) is responsible for management under the guarantees of the government. 1. Key Features and Shortcomings of the Scheme Coverage Rate and Benefits
The current pension scheme is mandatory for (i) employees of the state sector, i.e. officials of the government, party organizations, and the armed forces; (ii) employees of the state-owned enterprises (SOEs); and (iii) private enterprises with ten employees or more, including foreign-affiliated enterprises, foreign agencies, enterprises in industrial parks and export-processing zones, and international organizations. Further, Vietnamese people who are working abroad, and foreigners who are working in Vietnam can also participate in the scheme via voluntary insurance.
In practice, however, the coverage rate of the scheme is very low because it is inherently limited to the state sector, in particular SOEs, and there are few participants in the voluntary scheme. According to VSI (2001), the current pension scheme coverage was almost universal for the public sector with 95 percent of civil servants, and 93 percent of the employees in SOEs. The state sector employees made up 86 percent of the active contributors, while the remaining 14 percent was for participants from the private sector (Figure 1). This situation can also be seen in Table 1.
The benefits provided are mainly long-term, including pensions for retirement, survivors, employment injury, and disability. In addition, there are lump-sum benefits for related beneficiaries of the above long-term benefits, such as grant for funeral, lump-sum payments for early retirements, and low-level injured and disabled people.
2

Figure 1. Number of Active Contributors by Economic Sectors, 2000 (Thousand of people)
1,9731,854
649
0
500
1,000
1,500
2,000
2,500
Thou
sand
Government officials Employees in SOEs Employees in private sector
(14%)
(41%) (45%)
Source: VSI (2001)
Table 1. Participation to the Scheme by Economic Sectors, 2000 Public Sector Private Sector % Labor Force 10 90 % Active Contributors 86 14 Compliance Rate (%) 95 27
Source: GSO (2001), VSI (2001)
The retirement pension is normally paid to men and women at the age of 60 and 55, respectively,
with at least 20 years of contributions according to the specific formulas. For instance, the benefit formula is calibrated by multiplying the base earning by a service factor, in which base earning is measured by the average monthly salary during a certain period of time, e.g. the last 5 years’ average monthly salary for state sector employees. The service factor is measured with 3 percent for the first fifteen years, and 2 percent thereafter, or minus 1 percent for each year of early retirement. The total benefit, however, would not exceed 75 percent of the base earning.
The other pensioners, i.e. the survivors, the injured, and the disabled are paid with strictly qualified conditions. All kinds of pensions are adjusted to the statutory wage (or minimum wage), and the minimum pension is equivalent to the minimum wage.
In the current pension scheme, there are two kinds of beneficiaries, i.e. pre-1995 and post-1995 pensioners. The former are paid directly by the government budget, while the latter is entitled and paid by the VSI. In fact, VSI is responsible for the payments of both pensioners, and it will receive repayments from the government through the Ministry of Finance (MoF).
In the new scheme, the average monthly pension was about 475,000 VND, with a replacement rate of about 56 percent, which was relatively higher than that of other countries. Additionally, the dependency ratio of the scheme (or scheme demographic ratio) in 2000 at only 5.4 percent indicated that the number of pensioners was about 5.4 percent of the number of contributors, and also implied the scheme’s youth. Hence, the PAYG cost rate of the scheme, which is measured by multiplying the
3

Table 2. Active Contributors and Pensioners, 2000
Category Number of persons (thousand)
Average monthly salary/benefits
(thousand VND) ACTIVE CONTRIBUTORS
Government officials (including armed-forces’) 1,973 775 Employees in SOEs 1,854 775 Employees in private sector 649 1,220
Total 4,476 840 PENSIONERS
1. Pre-1995 pensioners, of which 2,168 539 Retirement 1589 625 Disability 427 356 Employment injury 8 273 Survivors’ 144 125
2. Post-1995 pensioners, of which 243 475 Retirement 141 691 Employment injury 19 339 Survivors’ 83 138
Total 2,411 532 Source: VSI (2001)
replacement rate by the scheme demographic ratio, was approximately 3 percent, implying that the total incurred expenditure was about 3 percent of the total insurable earnings from all the participants of the scheme. This is also called sustainable contribution rate, meaning the rate to balance revenue and expenditure of the scheme.
The total insurable earnings of the scheme were about 10 percent of nominal GDP in 2000 due to the low level of taxable wages in the public sector, low coverage rate, and individual income tax evasion, especially from the private sector. Financing and Financial Status
The financing of the scheme consists of contributions, subsidies from the government, investment income, and other sources (Article 149, amended Labor Code (2002): p.82).
Contributions to the social insurance scheme comprise 5 percent of monthly salary from employees for retirement, survivors’ benefits, grants for funeral expenses; and 15 percent of employer’s total wages paid to the employees who are covered by the social insurance, which 10 percent is for long-term benefits, i.e. retirement, employment injury, disability, and survivors; and remaining 5 percent is for short-term benefits, i.e. sickness and maternity.
The subsidies from the government are composed of payments for the pre-1995 pensioners, and other expenses, such as training, material base construction and delivery fees of payments.
The reserve after balancing the fund is invested to earn interest. In practice, given the shortage of the financial instruments and assets in the financial sector, the investments of the social security fund have concentrated on safe sources with very low rates of return. These are predominantly in the public sector: 52 percent deposited in public banks, 36 percent for lending the Government’s national projects,
4

and the remaining 12 percent in treasury bills and other investments (VSI, 2001). The estimated average nominal rate of return on the investments of the scheme’s reserves was 4.85 percent annually (Figure 2).
Figure 2. Investment Structure of Social Fund, 2000
VBARD10%
VICB8%
Development Assistance
Fund40%
Long-term State Bonds
4%
State Budget13%
Vietcombank1%
State Treasury Bonds
6%
VBID18%
Source: VSI (2001)
In order to finance the operation, the VSI retains about 6 percent of total contributions for
admin
benefits of the current scheme, as is the nature of a PAYG defined-benefit pensio
anagement and Regulatory Framework
istrative costs. The actual administrative costs of the scheme on average, however, were about 4.17 percent of the total contributions in the period 1996-2000 (Anh, 2001) so that the remnant at 2 percent of the total contributions would be a potential source of mismanagement, such as corruption, fraud, or extravagance.
Contributions andn scheme, are irrelevant as its the financial viability may be exhausted in the future. The problem
of financial instability of the pension scheme in Vietnam is more obvious in the conditions of loose early retirement provisions (which were considered as a solution to reduce surplus labor in SOEs) and a foreseen aging population. According to MOLISA (2001), the actual average retirement age was about 5 years lower than the legal age; 60 percent of the current retirees were early retired, and 12 percent were retired at age of 45 and below (Figure 3). This situation indicates that the retirement period of retirees will extend along with higher life expectancy, and the pension burden of these beneficiaries will abruptly increase when benefits are indexed to an increasing minimum wage. M
e for both short-term and long-term functions, which previo
Since 1995 VSI has been responsiblusly belonged to the Vietnam General Confederation of Labor (VGCL), and the Ministry of
Labor, Invalids, and Social Affairs (MOLISA), respectively. VSI now has a hierarchical structure that expands to the lowest district levels, and the local agents of VSI are responsible for both collections and disbursements. This vertical management of the scheme effectuates an increasing number of participants by updating information on employed labor from local levels. However, it also gives rise to increasing administrative costs, which may create risks of corruption and fraud, as mentioned above.
5
Moreover, administrative co-operation between VSI and other ministries, in particular the Ministry of Planning and Investment (MPI) which is responsible for managing all kinds of enterprises throughout the country, are not effective so that social security contribution evasion is frequently observed, especially in the private sector.
Along with managerial problems, the regulatory framework concerning tax treatment between the social
Figure 3. Number and Age Structure of the Current Retirees, 2000
Source: MOLISA (2002)
security system and other instruments of contractual savings is also exacerbating the issue of evasion. For instance, contributions from employers and employees, and the accruals from life insurance and pension funds are deductible for the purposes of corporate or individual income tax, while the contributions to the pension annuity plans are not deductible for any purpose; hence it creates motivation for enterprises to evade contributions by reducing the registered number of employees, signing short-term labor contracts with long-term employees, and so on.
Post-1995 Retirees
0
5,000
10,000
15,000
20,000
25,000
30,000
35,000
<40 40-44 45-49 50-54 55-59 60+
Age
Peop
le
Male Female
Pre-1995 Retirees
0
50,000
100,000
150,000
200,000
250,000
<45 45-49 50-54 55-59 60-64 65-69 70-74 75-79 80+
Age
Peop
le
Male Female
6

2. Challenges of the scheme
From the social and economic standpoints, the pension scheme in Vietnam faces two challenges. The first is the short-term challenges concerning the low participation rate of the private sector, and inefficient management of the scheme. The second is the long-term problems, which result from the short-term problems combined with a rapidly aging population, in which the dependency ratio of the scheme will be swiftly increased. Short-term Challenges
As mentioned above, in the year 2000, the number of contributors from the private sector was only 14 percent of the scheme’s total number of active contributors, and the compliance rate to the scheme was only about 27 percent. One of the most important causes of this situation is that the legal coverage of the scheme is too narrow for the private sector. Additionally, due to the economic restructuring with labor retrenchment, the number of employees in the public sector, especially in SOEs, is being redu rs move to the private sector without any re-registration for social
sequently the participation rates of the scheme are reduced. Furthermore, pre-1995 retirees receiving benefits from the government budget account for 66
perce
ced. These laid-off workesecurity responsibility, and con
nt and 92 percent of the total number of pensioners and retirees, respectively, and almost of them are much younger than the legal retirement age. Therefore, the pension burdens of these retirees, namely implicit pension debt (IPD), will increase when they have higher life expectancy and pension wages. Long-term Challenges
These short-term problems associated with an aging population will create long-term problems in ding its financial sustainability.
the pension scheme regar
Figure 4. Dependency Ratios in Vietnam, 2000-2050
Source: The UN population prospects (2002)
0102030
2000 2005 2010 2015 2020 2025 2030 2035 2040 2045 2050
Year
Dep
ende
0
10,000
20,000
30,000
Pop.
405060708090
ncy
ratio
(%)
40,000
50,000
60,000
70,000
80,000
(100
0 pp
)
Pop dependency ratio Elderly dependency ratio15-59 60+
Left-scale
Right-scale
Left-scale
Right-scale
7

The strict family easing life expectancy thanks to improved living standards have made Vietnam’s population age rapidly. According to the population prospects of the United Nations for Vietnam, the elderly (age 60 and older) in 2025 and 2050 will make up around 13 percent and 24 percent of the total population, respectively, double and triple of that in the year 2000. Furthermore, the average life expectancy of the Vietnamese population is also estimated to increase from 69.2 years in 2000 to 74.1 years and 78.2 years in 2025 and 2050, respectively. Consequently, the elderly and demographic dependency ratios will sharply increase, putting pressure on the working-age population. For instance, the elderly and demographic dependency ratios will increase from 13 and 69 percent in 2000 to 42 and 77 percent in 2050, respectively, while the total working-age population will decrease sharply after reaching its assumed peak in 2030.
The long-term sustainability of the pension scheme is threatened by several factors. Firstly, the scheme has approached a relatively high level of maturation with a high dependency ratio. Secondly, the contribution rate will be far below the sustainable level, which is measured by the PAYG cost rate of the scheme, and the social insurance fund will be depleted. Thirdly, there is a decreasing compliance rate becau
III. M
There are three projection models, i.e. general population, macro
planning policy during the period 1970-1990 and incr
se of (i) the contraction of the public sector, in particular SOEs; (ii) the movement from the public sector to the private sector of laid-off workers without re-registrations in the social security system; and (iii) the low participation rate of the private sector itself. Fourthly, the statutory wage-indexed benefits are too generous, and the retirement period is longer due to early retirement and higher life expectancy.
In addition, these long-term problems become more serious if they are considered from the aspect of fairness among generations. As indicated in numerous previous studies, PAYG defined-benefit pension scheme in the context of aging population means that the young and future generations have to bear heavier burden to cover the expenditure of the pensioners. The heavier burden is expressed by a continuous increase in the contribution rate, creating motivation for the active participants to evade their contributions and to have earlier retirements.
All of these factors will generate considerable problems for the pension scheme, and they may lead to a pension crisis in the future, characterized by financial instability and inter-generational inequity. Sustaining the scheme financially and maintaining the equity among generations are difficult policy questions for any PAYG defined-benefit scheme in the context of aging society. Hence, finding policies that are appropriately adapted to specific social and economic situations to remedy these problems and stabilize the scheme is imperative.
ETHODOLOGIES FOR FINANCIAL PROJECTION OF PENSION SCHEMES
This section makes use of the methodologies for social security pensions developed by the International Labor Organization (ILO) to assess the long-term financial status of a pension scheme. These methodologies are then modified to fit the socio-economic situation of Vietnam in general, and the pension scheme of Vietnam in particular.
economy, and financial measures of the pension scheme.
8

There are three steps in assessing the actuarially financial status of the pension scheme, i.e. status-quo projections, sensitivity tests, and policy proposals for reform. The first projects by assuming that the management and regulatory framework are not changed, even in the changing contexts of population growth and socio-economy. The second examines the previous projections with different assumptions f scheme indicators, e.g. compliance rates, contribution and benefit rates, to see how the results are ifferent from the status-quo projections. The third proposes some policy reforms to make the scheme
1. Ge
ut is still over 2.1 children per woman, which
total employment as a percentage of the itial working-age population, along with its evolution of participation rates can help project future
projected working-age population. The projected unemployed opulation is therefore calculated as a residual of the projected working-age population and projected
total e
Source: ILO (1998)
odfinancially stable, and to achieve inter-generational equality.
neral Population Projections
The projections of general population for Vietnam are taken from the United Nations Population Prospects (2002) with medium-fertility assumptions. These assumptions are employed because the average total fertility rate in Vietnam currently is decreasing, b
is a balanced level of population reproduction.
2. Labor Market Projections
From the initial general population, and the demographic indicators, e.g. fertility, mortality, and migration rates, the future general population is projected, including the projected working-age population, e.g. 15 to 59 year-olds. Furthermore, the initialintotal employment according to thep
mployment (Figure 5).
Figure 5: Method of Labor Market Projections
Initial general population
Projected general population
Initial working age population
Total employment as a percentage of working-age population
Evolution of participation
rates
Projected total unemployment
Projected total employment
Projected working age population
Rates of fertility, mortality, migration
9
Normally, total employment also includes people who are at lower or higher age than legal working age, but their participation is usually negligible or inaccurately informed so that projections for these groups may be omitted. Moreover, total employment can also be projected by dividing real GDP by labor productivity. The data on the labor productivity, however, are usually not available or inaccurate, so that it is also infeasible to employ this method.
. Macroeconomic Projections
conomic Growth and Interest Rates
3 E
In the short-term, the annual GDP growth rate may be based on the estimates of the short-term conomic projections in the national economic strategy. For the long-term, the GDP growth rate is
d as an exogenous variable. The short-term and long-term assumptions on GDP growt
es, and it is usually indicated by annual verage Consumer Price Index (CPI). Assumptions about future inflation rates are essential for the
f the pensions are periodically adjusted to reflect price increases in the conomy, i.e. inflation indexation. Inflation projections may be based on the estimates of the national
rial assessment, the inflation rate is also an exogenous input in the ec
egenerally establishe
h are linked with each other by the interpolation technique. Nominal GDP is calculated by multiplying real GDP by the GDP deflator in each year. The GDP deflator in the past is measured by dividing nominal GDP by real GDP. The future evolution of the GDP deflator is usually based on the assumptions of the future GDP inflation rates.
Inflation represents the general rate of increase in pricaactuarial projections of pensions ieeconomic strategy. Note that, in an actua
onomic model. Wages and Interest Rates
In status-quo projections, wage projections are based on the government policy, i.e. statutory wage indexation. Therefore, wage will be projected by using the historical adjustments of statutory wage. In the short-term, it may be adjusted by the most recent developments in wage levels. In the medium and long-term, however, due to the nature of actuarial method, the real wage growth rate is usuall
y following the adjustments of insurable earnings. The level of interest rate can be projected by using the historical rate in the reports of the central
nomy is dynamically efficient, meaning that rate of return on capital is higher
y assumed to merge with the rate of growth in labor productivity, which is measured by subtracting the growth rate of total employment from the real GDP growth rate.
The total remuneration for employees is calculated by multiplying the average wage by the number of employees. Regarding the pension scheme, the total insurable earnings are measured by multiplying the average insurable earnings by the number of active contributors. The average wage for pensions can be obtained b
bank. In addition, if the eco than growth rate of population plus per capita growth rate in steady state, the interest rate is
projected, in average, higher than the economic growth rate. Regarding the reserves of the pension scheme, average rate of returns depends on past investments, and also the development of interest rates in the financial market.
10

4. Financial Projections of the Pension Scheme
The financial projections of the pension scheme depend mainly on the number of people who will pay into the scheme (or the number of active contributors), and the average earnings of these contributors. Also importantly are the number of people who will receive benefits (or the number of pensioners), and the amount of benefits that will be paid, related to past earnings and possibly indexed. Finally, investment returns on reserves, and other incomes and expenses are also factored.
Number of Active Contributors
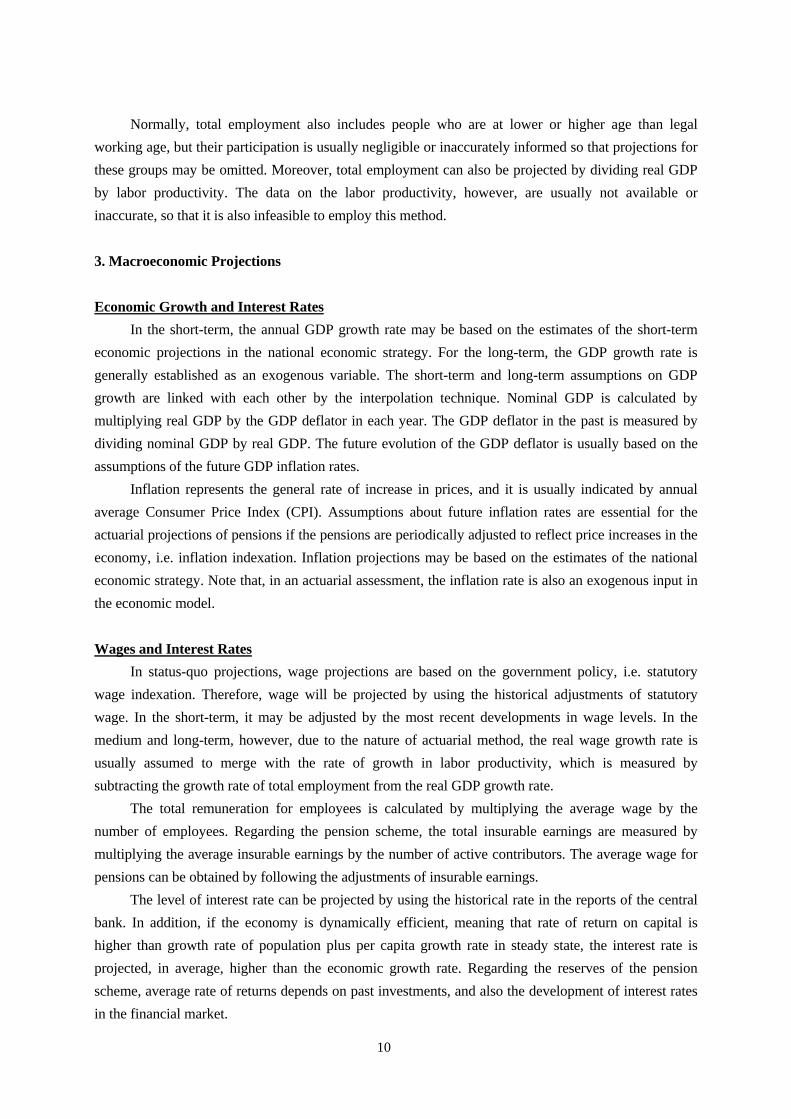
The projected number of insurable people who must register for social security as stipulated in the government regulations on coverage may be calculated as a proportion of projected total employment. Regarding the pension scheme in Vietnam, there are three kinds of potential beneficiaries who belong to
including armed forces, (ii) employees in SOEs, and ii) employees in the private sector who are mandated by the regulations of the social security system.
This
However, in practice, the data on these changes are usually insufficient so that a simplified method is employed to
f new entrants. The difference between the number of insurable popul
the insurable population: (i) government officials, (i
figure may be projected by using their respective proportions of the total employment of the economy.
The number of active contributors is then measured by using the respective assumed compliance rate of each section of the insurable population. In principle, this number must be projected by adding up new entrants, and subtracting the dead and discontinued beneficiaries of the scheme.
obtain relatively stable inflows oation and the number of active contributors is the number of inactive contributors (Figure 6).
Number of Pensioners
In general, for the projections of the number of pensioners for retirement, survivors, employment injury, and disability, a life table of general population will be employed. This expresses the probability of death of the population by different age groups and sex (see Appendix).
In Vietnam, there are two types of pensioners, i.e. pre-1995 and post-1995. The former is paid direct
re-1995 Pensioners oners due to retirement, employment injury, and disability are projected
umber of discontinued
ly by the government budget, and the number of beneficiaries decreases over time due to death, discontinuation, and no new entrants. Conversely, the latter is paid by the VSI under the PAYG defined-benefit scheme, and the number of beneficiaries may increase because of new entrants. Hence, projections of the number of pensioners in the pension scheme in Vietnam must be separated according to these two types of pensioners. P
• The numbers of pensiby using the life tables of the general population.
• The number of survivors can also be measured by using the life tables of the general population. However, the projected numbers also depend on the n
11
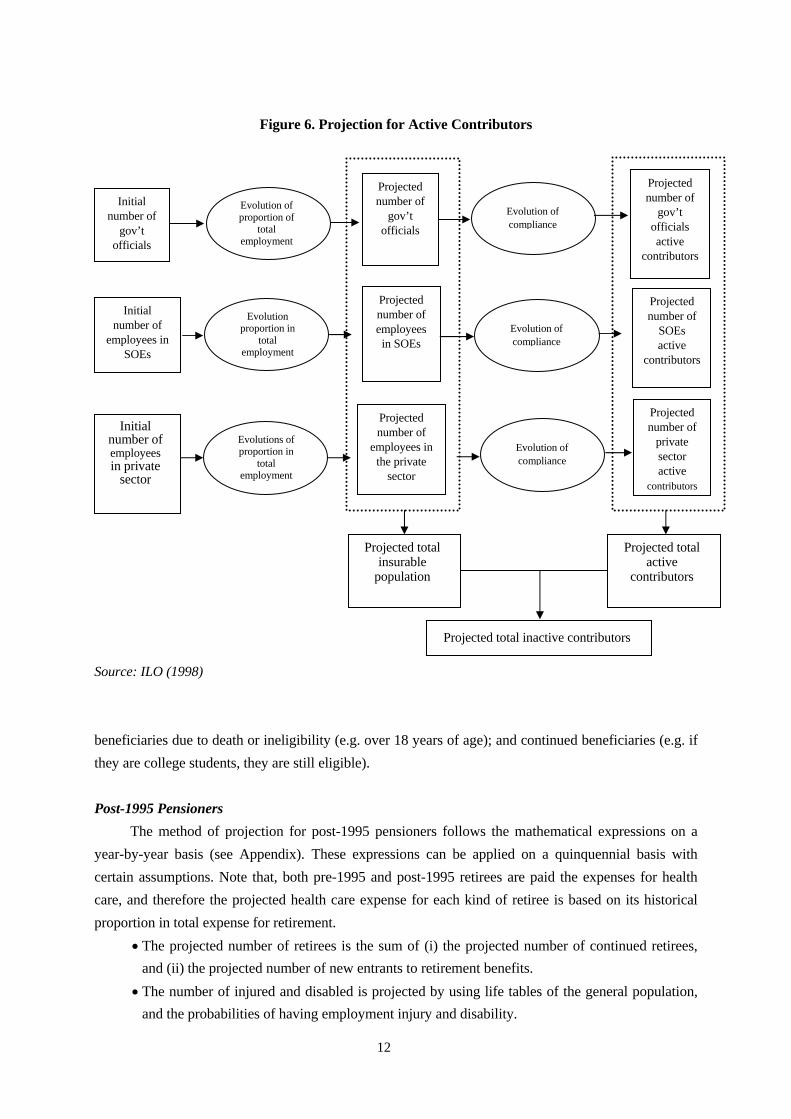
Figure 6. Projection for Active Contributors
ource: ILO (1998)
e due to deat bility (e.g. o of age); and beneficiaries (e.g. if the ege students, t till eligible).
ost-1995 Pensioners The method of projection for post-1995 pensioners follows the mathematical expressions on a
ear-by-year basis (see Appendix). These ex be applied on a quinquennial ertain assumptions. Note that, both pre-1995 and post-1995 retirees are paid the expenses for health are, and therefore the projected health care expense for each kind of retiree is based on its historical roportion in total expense for retirement.
• The projected number of retirees is the sum of (i) the projected projected number of new entrants to retirement benefits.
• The number of injured and disabled is projected by using life tables of the general population, and the probabilities of having employment injury and disability.
Initial
number of gov’t
officials
Projected number of
gov’t
S
b neficiaries
y a e collh or ineligi
hey are sver 18 years continued
r P
y pressions can basis with ccp
number of continued retirees, and (ii) the
officials
Innumb
employS
itial er of ees in
OEs
Projected number of employees in SOEs
Evolution proportion in
total employment
Initial number of employees in private
sector
Evolutions of proportion in
total employment
Projected number of
empl ees in the private
oy
Evolution of proportion of
total employment
Projected number of
gov’t officials active
contributors
Evolution of compliance
Evolution of
Projected number of
SOEs compliance active
contributors
Projected number of
private sector active
contributorssector
Evolution of compliance
Projected total insurable
population
Pro
contributors
jected total active
Projected tot contributors al inactive
12

Average Insurable Earnings or Wages, and Average Pensions
Projections of average earnings of the contributors, and average pensions for pensioners are elopment of wage levels. In the status-quo projection, average earnings and
pensiosubject to the past dev
ns are adjusted to the statutory minimum wage. They will be, however, adjusted to the projected inflation rates in the sensitivity tests.
Investment of the Reserves
The reserves of the scheme will be invested in different financial institutions. The most important factormacroec as been heavily regulated and mthe gov turns.
affecting investments is the interest rate. Interest rates can be adopted from the projections of onomic factors. In Vietnam, however, investment of the reserves h
anaged by the government, so that the expected rate of return may be based on the regulations of ernment concerning investments of the scheme, and past rates of re
Other Expenses and Incomes Other expenses, such as administrative expenses, delivery fees, and other incomes defined as
subsidies from the government for training, construction, etc. are measured as a certain proportion of the total expenditure or income. Financial Indicators of the Scheme
ial indicators of the pension scheme that should be considered following the pr
o components, i.e. the e dependency ratio, which indicates the total number of pensioners as a percentage of the
tributors, and replacement ratio, which implies the average pension as a
mium (GAP): this indicator implies a contribution rate that balances the scheme financially in a certain period of time, say 10 years. This indicator is useful in
tions of the scheme. However, GAP requires a very stable
. Sensitivity Tests
becaumode
There are several financojections because they measure the financial status of the scheme during the projection period.
PAYG Cost Rate: the PAYG cost rate is the sustainable contribution rate, and is calculated by dividing total expenditure by total insurable earnings. This yields the contribution rate needed to meet the cost of benefits in the corresponding year. It is separated into twschemtotal number of active conpercentage of average insurable earnings.
General Average Pre
comparing different modificaand prospective financial market, which in turn requires a long-term healthy economy.
5
The actuarial valuation of the pension scheme cannot project the future with perfect accuracy se the projections may be based on imperfect models and assumptions, and the variables in the ls may react to unpredictable factors. There are many possible causes leading to distorted results,
13

such that m . The sensitivity tests of an actuarial model for pension scheme are usually re-calibration of key variables, e.g. economic growth, employment level, price and real w
tests rate o
V. ACTUARIAL PROJECTION RESULTS
,300 thousand people in 2050.
percent in 2025, and to 45 percent in 2050. urthermore, the replacement rate will also increase from 56.5 percent in 2000 to 57.7 percent and 59.3 ercent in 2025 and 2050, respectively.
rent scenarios of the economy, i.e. favorable and nfavorable economic conditions. The following are results of these scenarios regarding the financial
status
us “Ponzi game”
as lack of or low credibility of data. Therefore, sensitivity tests can inform us of the eventual gaps ay occur between projections and reality
age growth, rate of return on investments, and disability incidence rates. Regarding the financial status of the pension scheme in Vietnam, this paper performs sensitivity
on labor force participation rates, pension scheme compliance rates, wage indexation, and nominal f returns on investment of the scheme’s reserves.
I
The model predicts the following results. First, the number of pre-1995 pensioners will decrease from 2,200 thousand in 2000 to 713,000 in
2025 and to 32,000 in 2050. Accordingly, the total expenditure will be 13,980 billion VND in 2000, 15,272 billion VND in 2025, and then will drastically decrease to 1,906 billion VND in 2050.
Second, for the post-1995 scheme, the number of active contributors will increase from approximately 4,500 thousand in 2000 to 7,600 thousand in 2025 and to 10
Similarly, the number of pensioners will increase from 243 thousand in 2000 to 1,700 thousand in 2025, and to 4,100 thousand people in 2050; and therefore the demographic ratio of the scheme will increase rapidly from only 5.4 percent in 2000 to 23Fp
Third, sensitivity tests are conducted with diffeu
of the scheme. Table 3 shows that the implicit pension debts (IPD) of both schemes, when compared with GDP
2000, are generally high even at various assumed discount rates. These IPDs imply that if Vietnam continues its PAYG defined-benefit pension scheme, it is playing an expensive and dangero
, especially from the financial viewpoint. On social aspects, these IPDs must be borne by the current and future working population so that inter-generational inequity is unavoidable.
Table 3. Implicit Pension Debt (IPD) of the Pension Scheme, 2000-2050 IPD, compared with GDP 2000 Discount Rate
Pre-1995 Scheme Post-1995 Scheme 3% 87 108 5% 66 63 6% 59 50
Source: Author’s calculation
14
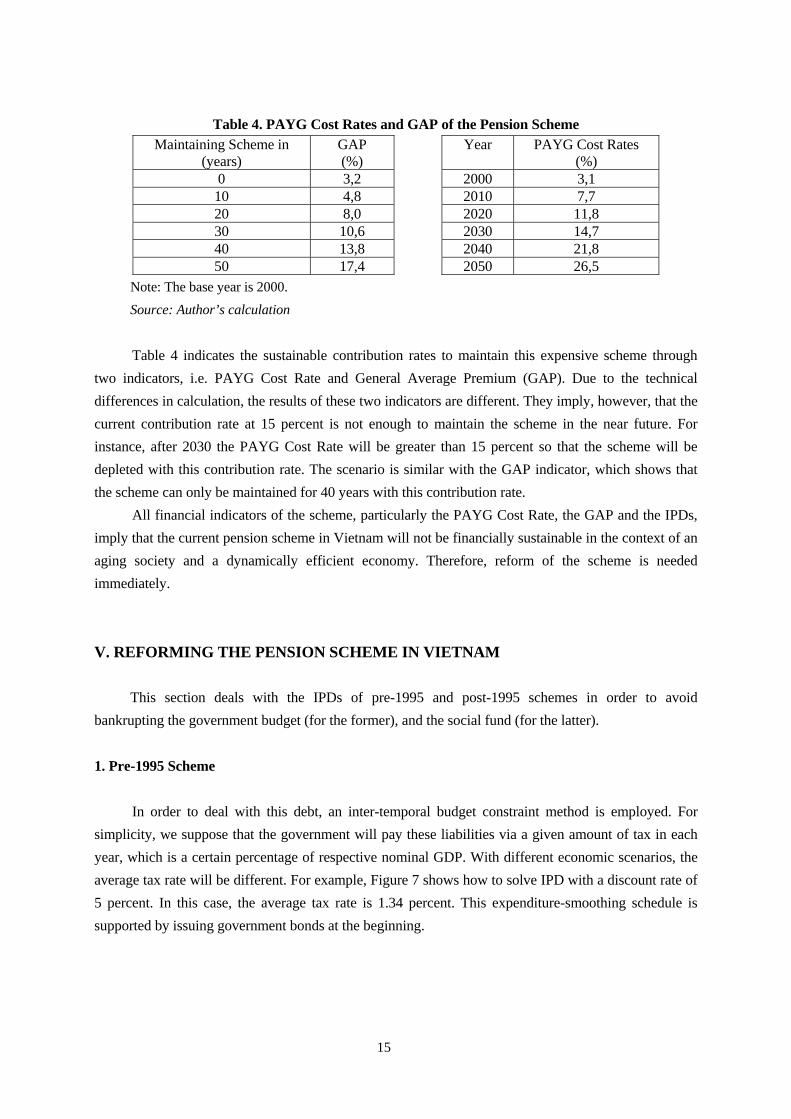
Table 4. PAYG Cost Rates and GAP of the Pension Scheme Maintaining Scheme in
(years) GAP (%)
Year PAYG Cost Rates (%)
0 3,2 2000 3,1 10 4,8 2010 7,7 20 8,0 2020 11,8 30 10,6 14,7 2030 40 13,8 2040 21,8 50 17, 2050 26,5 4
Note: The b ar is 2000. Source: Aut calculation
able 4 indicates the sustainable contribution rates to maintain this expensive scheme through
two in icators, i.e. PAYG Cost Rate and General Average Premium (GAP). Due to the technical differences in calculation, the results of these two indicators are different. They imply, however, that the current contribution e near future. For instance, after 2030 the PAYG Cost Ra er than 15 percent so that the scheme will be depleted with this contribution rate. The scenario is similar with the GAP indicator, which shows that the scheme can only aintained for 40 with thi contri rate.
All financial indicators of the schem rticularly the PAYG Cost Rate, the GAP and the IPDs, imply that the curren nsion scheme in Vietnam will not be fi lly sustainab e context of an aging society and namically efficient economy. There eform of th eme is needed imme V. RE
te will be different. For example, Figure 7 shows how to solve IPD with a discount rate of percent. In this case, the average tax rate is 1.34 percent. This expenditure-smoothing schedule is upported by issuing government bonds at the beginning.
ase yehor’s
Td
rate at 15 percent is not enough to maintain the scheme in thte will be great
be m years s bution e, pa
t pe nancia le in tha dy fore, r e sch
diately.
FORMING THE PENSION SCHEME IN VIETNAM This section deals with the IPDs of pre-1995 and post-1995 schemes in order to avoid
bankrupting the government budget (for the former), and the social fund (for the latter). 1. Pre-1995 Scheme
In order to deal with this debt, an inter-temporal budget constraint method is employed. For simplicity, we suppose that the government will pay these liabilities via a given amount of tax in each year, which is a certain percentage of respective nominal GDP. With different economic scenarios, the average tax ra5s
15

Figure 7. Pre-1995 Scheme: Solving IPD with Discount Rate of 5 Percent
2. Post-199 Designing a
Source: Author’s calculation
5 Scheme
New Pension Scheme There are various types of pension schemes suitable for reform. However, the only
future financial difficulties is to shift from the current PAYG scheme to a funded scheme. Partinds on the specific status of the pension scheme and socio-economic ability of th
scheme is preferred for the following crucial reasons. First, a funded scheme will raise the economic benefits for the participants because the
working life, and then finance themselves when they are retired. During the timlation, saving can be invested in financial markets to earn interest, which is much hi
plicit rate of return generated by a PAYG scheme (Feldstein, 1998).
-60,000
-40,000
60,000
Year
-20,000
0
20,000
40,000
2000
2003
2006
2009
2012
2015
2018
2021
2024
2027
2030
2033
2036
2039
2042
2045
2048
Bill
ion
VN
D
Expenditure Bond issued/paid General taxation
way to avoid al or full
shift depe e country. A funded
y can save during their e of accumu gher than the im This result is apparent because there real rate of return in a PAYG scheme, in which contributions f the current contributors are immediately paid for the current pensioners. This process in a PAYG
er-generational inequity because the current pensioners may gain higher benefits an the contributions they paid during their working life due to changed economic conditions, e.g.
efits, in turn, are paid by current contributions of the participants. This i
nded scheme is associated with increases in pri
is no real investment and nooscheme also creates intthhigher average real wage. These ben
s a vicious cycle of inter-generational inequity in a PAYG pension scheme. Second, and more importantly, shifting to a funded scheme will avoid unaffordable benefit
promises, and thus avoid abrupt increases in the contribution rates as the population ages. This result is already pointed out in the projections. Further, shifting to a fu
vate savings in the long-term, thus building long-term national saving, and eventually economic growth. However, financing methods for shifting should be thoroughly discussed because it will be
16

meaningless if it crowds out other forms of private saving, or leads to greater public deficits (Estelle James, 1998).
Another issue is the desirability to move from a defined-benefit to a defined-contribution scheme for many reasons. The main rationale is that the participants’ benefits are closely linked with their contributions in the defined-contribution scheme, and this prevents them from evading contributions. Under a defined-contribution scheme, evasion of contributions means that participants reduce their own pensions; while evasion of contributions in a defined-benefit scheme helps participants to earn benefits by “e
fits will be automatically adjusted by an actuarially fair annuity, so that neither aging nor early
n scheme needs to be carried out so
the current beneficiaries. Therefore, notional defined-contribution, although ostensibly define
ortantly, the notional interest rate during contributions and conversion rate o
xploiting” others, particularly current and future participants. In the case of Vietnam, evasion is a significant problem in the current scheme with very low participation rates and compliance rates within the private sector. Moving to a defined-contribution scheme along with an expansion of coverage, therefore, ensures appropriate rights of participants, and reduces evasion.
In addition, as shown in various investigations, a defined-contribution scheme discourages early retirement and makes financial viability less sensitive to early retirement decisions. In this scenario, the retirement bene
retirement affect the financial viability of the pension scheme. Moreover, a defined-contribution scheme also prevents fraudulent disability claims whereby beneficiaries enjoy benefits at the expense of the others.
Conversely, in a defined-benefit scheme, early retirement and disability entitlement are frequently observed because the early retirees and the disabled can collect greater benefits than they wait until retirement. Moreover, with aging population, the government will be confronted with the difficult task of raising the retirement age continually to keep up with longevity (Estelle James, 1998). Regarding this issue, in Vietnam there is a large proportion of pensioners who are retired or disabled in the most productive age group of aged 35 to 44, and thereby a defined-contributio
as to avoid this situation. Recently, the notional defined-contribution scheme has emerged as, to some extent, a successful
solution for pension reform in some countries, such as Sweden (Disney, 1998), and Italy (Franco, 2001). In this scheme, participants have their own accounts, which record accumulations and interest earned from these accumulations; but these accounts are notional because contributions are actually used to pay directly for
d-contribution, is still a PAYG. In comparison with a PAYG defined-benefit scheme, a notional defined-contribution may be more favored because contributions and benefits have a closer link, and the transition costs can be avoided by keeping both contributions and benefits in the same PAYG scheme.
With regard to inter-generational equity, however, a notional defined-contribution scheme cannot completely solve the problem. Firstly, as with the nature of a PAYG scheme, a notional defined-contribution does not avoid increased contribution rates in the future, and therefore creates inter-generational inequity. More imp
f annuity for retirement are subject to political manipulation (Estelle James 1996, 1998, Kotlikoff, 2000) because it is easy for government to change benefit formula. Secondly, as indicated in Kunieda (2001), a notional defined-contribution may reduce inter-generational inequity only when it is used for reducing the current benefits received by pensioners, and reforming the pension scheme to a notional
17

defined-contribution becomes meaningless if the benefit level of the current pensioners is kept the same, or if the notional return rate is higher than population growth plus per capita income growth in a dynamically efficient economy.
Reforming the Pension Scheme
In designing a pension scheme, it helps to study general scenarios with specific characteristics that can maintain the financial viability of the scheme and ensure inter-generational equity of the participants. From these scenarios, the following reforms can be implemented.
Firstly, we consider reducing the benefits of the current pensioners to maintain inter-generational equality, as well as intra-generational equality.
In fact, by using the last five years’ average wage as the base wage for the retirement benefit of the public sector, the pension scheme is paying for numerous rich retirees who do not pay any tax for their high pension income. This policy means that we do not need to cut benefits of all current pensioners, but need to cut benefits of the rich pensioners, and maintain benefits of others who have sufficient pension income. An important lesson learned from Kunieda (2001) is that not only can we reduce benefits, but also tax the pension income of the rich pensioners more heavily in order to achieve
from PAYG to a funded schem
is movement makes the implicit pension debt of PAYG schem
on the success of curtailing growth in the debt of SOEs (IMF, 2002). Therefore, we should move
burde
eme. There are some policies to help spread and absorb this burden. For example, Friedman et al.
ts to notional defined-contribution pension, which must provide only the re
equality. Furthermore, we also can adjust benefits by changing the indexation method, i.e. from statutory
wage to price indexation. This helps reflect the true cost of living of the pensioners. Secondly, we consider solving the implicit pension debt when moving e. This is a very significant issue because the explicit. If the pension scheme moves fully to a funded scheme, it creates a new explicit
national debt, which is equal to the present value of net implicit pension debt, and therefore threatens the government’s fiscal viability.
In the year 2001, government debt accounted for 30 percent of GDP; of which domestic debt was about 3 percent, and the remaining 27 percent was external debt. However, the level of public debt (excluding bank debt and including enterprise debt of SOEs) was 63 percent of GDP, and depended critically
to a partially funded scheme in order to avoid swiftly increasing government debt. Additionally, during the transition, the current contributors must bear the so-called “doublen”, meaning that they have to pay for themselves and for the current pensioners who belong to the
PAYG sch(1996), Estelle James (1998) suggest the model used by Latin American countries and some other
transitional economies. They used revenue or assets from the privatization process of state enterprises to co-finance fiscal requirements for existing pensioners. Kunieda (2001) recommends allocating some part of individual pension accoun
turn rate that equals the economic growth rate; and because this rate is lower than the other capital return rates in a dynamically efficient economy, each generation will bear some of the double burden.
18

For Vietnam, at this moment, application of the latter seems feasible because privatization itself is facing financial difficulties, and other government revenues are also extremely limited.
Thirdly, we consider the timing of the reform. As indicated in previous studies, such as Feldstein (1998), the timing of reform depends on the
popularity of the PAYG pension scheme in the country because it has close links with the amount of net implicit pension debt. In the case of Vietnam, the pension scheme covers 12 percent of total employment, or only 6 percent of the total population, and the first cohort of the post-1995 scheme will start receiving benefits in 2015 (their first contributions were in 1995, and they are only fully entitled after at least 20 years of contributions). Therefore, Vietnam should start reforming as soon as possible; otherwise, the transition will inevitably be more painful.
Lastly, we consider the management and regulatory framework of the pension scheme. Many investigations on the management of pension schemes favor privately-managed rather than
publicly managed schemes, mainly because of political reasons. Examples are given in Oliveira (1997), Felds less, with the current development level of the Vietn
ent of the pension scheme is the shortage of inform fraudulent mana
investments of the pension fund across various instruments in the financ
tein (1998), and Estelle James (1998). Nevertheamese economy, especially the financial market, the private management of pension schemes is
not really feasible at this moment. In my opinion, the government can manage the pension fund with investment-based policies to maintain and develop it. The government should not use the fund to cover expenditure or budget deficits. In the medium- to long-term, however, the government should gradually privatize the pension fund in order to urge more savings in a funded, defined-contribution pension scheme as a channel for investment.
Further, one of the weakest points in the managemation. Insufficient or closed information on operations has generated problems, such as
gement. The lack of information also has caused difficulty for policy-makers in finding appropriate policy alternatives to manage the scheme. Hence, information dissemination, or disclosure, is one of the prerequisites for reform.
In addition to management, a sound regulatory framework is also needed. The government should carry out policies that encourage the participation of the private sector, and promote the voluntary scheme. Further, during the transition stage, the government should strictly regulate on retirement and disability by setting up the minimum retirement age, and create more accurate definitions of disability levels. Specifically, in the financial framework, the government has to offer a fair tax treatment among all insurance businesses, and diversify
ial market.
VI. CONCLUSIONS AND RECOMMENDATIONS
The conclusions of the paper are: (i) the current pension scheme in Vietnam is not financially sustainable in the context of an aging population, i.e. it is financially unstable, and involves a vicious cycle of inter-generational inequality; and (ii) there is an immediate need to reform the current PAYG
19

defined-benefit scheme for a partially-funded defined-contribution scheme which has appropriate policies and management within a sound regulatory framework.
The paper makes use of actuarial models, which are based on the available and assumed projections on population, economy, and the pension scheme. The projections have some limitations. Most of the limitations are derived from the simplified assumptions in the models, which are due to
s of the paper that need to be addressed. irst, projections of macroeconomic indicators, labor market, and the pension scheme are mostly based
on int
h generation should be calibrated so as to dev
insufficient or unavailable data. There are two main limitationF
erpolation techniques with available data with a possibility of over- or under-estimation. In addition, the paper also ignored the impacts of the pension scheme on saving, investment, and economic growth in the future. Second, although inter-generational inequity is discussed in this paper, it was not analyzed quantitatively by generation, and the financial burden of each age cohort of the current and future generations was not measured. The financial burden of eac
ise more appropriate policy options. These limitations suggest that additional studies are needed, using more comprehensive models that thoroughly take into account various aspects of population, economy, and pension scheme reforms.
20

Bibliography In English Anh, V. (2002). “Pension Reform in Vietnam” in “Pension Reforms in Asian Countries”, Proceedings
of the International Symposium, Hitotsubashi University, Japan. pp.263-284. Auerbach, A., Kotlikoff, L., Hagemann, R., and Nicoletti, G. (1989). “The Economic Dynamics of
Ageing Population: the Case of Four OECD Countries”. Department of Economics and Statistics, the OECD, Paris.
Beekman, J.A. (1985). “Actuarial Assumptions and Models for Social Security Projections” in “Actuarial Mathematics”, Vol. 35, Proceedings of Symposia in Applied Mathematics. American Mathematical Society, U.S.A, pp.85-112.
Blanchard, O.J., Weil, P. (2002). “Dynamically Efficiency, the Riskless Rate and Debt Ponzi Games under Uncertainty”. NBER Working Paper No. 3992.
Bui, C., Truong, A., Goodkin, D., Knodel, J., and Friedman, J. (1999). “Vietnam Elderly Admist Transformations of Social Welfare Policy”. Population Study Center, Research Reports No.99-436, University of Michigan.
Drouin, A., Pierre P., Gylles B., Michael C., Warren R. McGillivray, Michel B., and Hernando P. M. (2002). “Actuarial Practice in Social Security”. International Labor Organization (ILO), and International Social Security Association (ISSA).
Estelle, James. (1998). “Social Security Reform-Lessons from Other Nations”. Heritage Foundation. Faruquee, H., Muhleisen, M. (2001). “Population Aging in Japan: Demographic Shock and Fiscal
Sustainability”. Research and Asia and Pacific Departments, Working Paper WP/01/40, IMF. Feldstein, M. (1998). “A New Era of Social Security” in “The Public Interest No. 130”, Winter 1998:
“Financing Our Old Age”. Friedman, B., Estelle James, Kane, C., and Queisser, M. (1996). “How Can China Provide Income
Security for Its Rapidly Aging Population?”. Policy Research Working Paper 1674, Policy Research Department, Poverty and Human Resources Division, the World Bank.
Gokhale, J. (1996). “Demographic Change, Generational Accounts, and National Saving in the United States”. Federal Reserve Bank of Cleveland, Working Paper No. 9603, the U.S.
________. (1998). “Generational Equity and Sustainability in U.S Fiscal Policy”. Federal Reserve Bank of Cleveland, the U.S.
Hagemann, R., and Nicolleti, G. (1989). “Ageing Populations: Economic Effects and Implications for Public Finance”. Department of Economics and Statistics, the OECD.
Holzmann, R. (1997, 1998). “Financing the Transition to Multi-pillar”. Department of Education and Social Policy, the World Bank.
Holzmann, R; Palacios, R., and Zvinienne, A. (2001). “Implicit Pension Debt: Issues, Measurement, and Scope in International Perspective”. Social Protection, Human Development Department, the World Bank.
21

Holzmann, R., Stiglitz, J.E (Eds). (2001). “New Ideas about Old Age Security: Toward Sustainable Pension Systems in the 21st Century”. The International Bank for Reconstruction and Development (IBRD), the World Bank.
International Labor Organization. (1997). “ILO Social Budgeting Model (ILO-SOCBUD): A Technical Guide”, Geneva.
________. (1997, 2002). “ILO Population Projection Model (ILO-POP): A Technical Guide”, Geneva. ________. (1998). “Vietnam: Report to the Government on Social Protection Development and
Training-Actuarial Valuation of the Vietnam Social Security Scheme”, VIE24V3.598, Geneva. ________. (1998). “Internal Guidelines for Actuarial Analysis of a National Social Security Pension
Scheme”. International Financial and Actuarial Service ILO FACTS, Social Security Department, Geneva.
International Monetary Fund (IMF). (Various years). “Vietnam: Selected Issues, IMF Country Report”. The IMF.
Iyer, S. (1999). “Actuarial Mathematics of Social Security Pensions”. International Labor Organization (ILO), and International Social Security Association (ISSA).
Kotlikoff, L, J., and Leibfritz, W. (1998). “An International Comparison of Generational Accounts”. NBER Working Paper Series No. 6447.
Kunieda, S., (2002). “Japanese Pension Reform: Can We Get Out of Inter-generational Exploitation?” in “Pension Reforms in Asian Countries”, proceedings of the International Symposium, Hitotsubashi University, Japan. p.23-63.
Noord, P., and Herd, R. (1993). “Pension Liabilities in Seven Major Economies”. Economics Department Working Paper No. 142, the OECD. Paris.
Oshio, T. (2002). “Net Pension Liabilities, Inter-generational Equity, and Pension Reforms”. Tokyo Gakugei University, 2002.
Socialist Republic of Vietnam. (2002). “Labor Code: Amended and Supplemented in 2002”, Labor and Social Affairs Publishing House, Hanoi, Vietnam.
Takayama, N., Kitamura, Y., and Yoshida, H. (1998). “Generational Accounting in Japan”. Institute for Monetary and Economic Studies (IMES) Discussion Paper Series No. 98-E-1, Bank of Japan.
World Bank. (1994). “Averting the Old-Age Crisis: Policies to Protect the Old and Promote Growth”, the World Bank, Washington, D.C.
In Vietnamese General Statistical Office (GSO). (Various years). “Nien giam thong ke” (Statistical Yearbook), GSO,
Vietnam. Ministry of Labor, Invalids, and Social Affairs (MOLISA). (1993). “Mot so van de ve chinh sach bao
dam xa hoi o nuoc ta hien nay” (The Current Situations of Social Protection in Our country). National Project KX.04.05, Institute of Labor Sciences and Social Affairs, MOLISA, Hanoi, Vietnam.
________. (1993-2000). “Nien giam thong ke lao dong, thuong binh va xa hoi” (Statistical Yearbook on Labor, Invalids, and Social Affairs), Hanoi, Vietnam.
22

________. (1997). “Co so ly luan va thuc tien de hoan thien che do, chinh sach doi voi nguoi ve huu” (Theoretical Background and Empirical Evidence to Complete Regulations on Retirement), Institute of Labor Sciences and Social Affairs, Hanoi, Vietnam.
________. (1999). “Bao cao danh gia thuc trang bao hiem xa hoi o Vietnam” (Evaluation Report on the Current Status of Social Insurance in Vietnam), Social Insurance Department, MOLISA, Vietnam.
________. (2001). “Cai cach bao hiem xa hoi o Vietnam: tham luan ve su giam sat va quan ly” (Reforming Social Insurance in Vietnam: Discussion on Supervision and Management). ILO Hanoi, Vietnam.
National Assembly Office. (2003). “Nghi dinh 218-CP ngay 27/12/1961 ve ban hanh Dieu le tam thoi ve cac che do bao hiem xa hoi doi voi cong nhan, vien chuc Nha nuoc” (Decree 218-CP dated December 27th, 1961 on the Issuance of Temporary Regulations of Social Insurance Schemes for Public Sector Employees”.
________. (2003). “Nghi dinh cua Hoi dong Chinh phu so 39-CP ngay 22/3/1962 ve noi dung thu, chi Quy bao hiem xa hoi cua Nha nuoc” (Government Committee Decree 39-CP dated March 22nd, 1962 on Revenue, Expenditure of Social Insurance Fund of the Government).
________. (2003). “Nghi quyet cua Tong Cong doan so 6-NQ-TCD ngay 21/2/1981 ve Dieu le quan ly Quy bao hiem xa hoi” (Resolution of the General Union N0 6-NQ-TCD dated February 21st, 1981 on Regulations on the Management of Social Insurance Fund).
________. (2003). “Nghi dinh so 43-CP cua Chinh phu ve Quy dinh tam thoi ve cac che do bao hiem xa hoi” (The Government Decree 43-CP dated June 22nd, 1993 on Temporary Regulations of Social Insurance Schemes).
________. (2003). “Nghi dinh 12/CP cua Chinh phu ngay 26/1/1995 ve che do bao hiem xa hoi moi” (The Government Decree N012/CP dated January 26th, 1995 on Regulations of New Social Insurance Scheme).
________. (2003). ”Nghi dinh cua chinh phu so 93/1998/ND-CP ve sua doi va bo sung cac dieu khoan trong Quy dinh ve bao hiem xa hoi ban hanh trong Nghi dinh 12/CP ngay 26/1/1995” (The Government Decree Number 93/1998/ND-CP on Amending and Supplementing Provisions of Social Insurance Regulations, Issued in Attachment to the Government Decree No. 121/CP dated 26/1/1995).
Vietnam Social Insurance (VSI). (2000). “So lieu thong ke ve tinh hinh thuc hien bao hiem xa hoi giai doan 1995-1999” (Statistical Data on the Social Insurance Implementation in the period 1995-1999), Hanoi, Vietnam.
23

Appendix 1
Vietnamese Life Table by Age Group and Sex, 1999
Male Female
Age 5mx 5qx lx e0x 5mx 5qx lx e0
x
0 0.0290 0.0283 100,000 64.65 0.0218 0.0214 100,000 68.64 1 0.0029 0.0115 97,174 65.52 0.0026 0.0103 97,862 69.13 5 0.0010 0.0052 96,052 62.27 0.0006 0.0032 96,856 65.84
10 0.0008 0.0041 95,555 57.58 0.0005 0.0026 96,550 61.04 15 0.0014 0.0068 95,159 52.81 0.0010 0.0048 96,298 56.19 20 0.0018 0.0089 94,515 48.15 0.0013 0.0066 95,839 51.54 25 0.0017 0.0087 93,679 43.56 0.0012 0.0062 95,209 46.77 30 0.0024 0.0120 92,863 38.92 0.0015 0.0077 94,617 42.05 35 0.0030 0.0149 91,749 34.36 0.0018 0.0090 93,892 37.35 40 0.0042 0.0210 90,384 29.84 0.0027 0.0133 93,046 32.67 45 0.0068 0.0333 88,487 25.43 0.0043 0.0215 91,807 28.08 50 0.0112 0.0546 85,539 21.22 0.0073 0.0357 89,836 23.64 55 0.0185 0.0884 80,871 17.30 0.0120 0.0581 86,626 19.42 60 0.0316 0.1464 73,724 13.74 0.0215 0.1020 81,591 15.47 65 0.0511 0.2265 62,928 10.66 0.0372 0.1700 73,265 11.94 70 0.0827 0.3426 48,676 8.05 0.0671 0.2873 60,811 8.87 75 0.1322 0.4968 32,000 5.95 0.1138 0.4429 43,338 6.44 80 0.2039 0.6754 16,101 4.35 0.1881 0.6398 24,145 4.57
85+ 0.3119 1 5,227 3.21 0.0370 1 8,698 3.26 Note: 5mx is the central death rate for the age interval (x, x+5);
5qx is the probability of an individual at age x dying before the end of the age interval (x, x+5). lx is the number of survivors at age x in a life table with starting population of 100,000; and e0
x is life expectancy at age x. Source: World Health Organization (2000)
24

Appendix 2
Projections of Post-1995 Scheme
The following expressions for the age- and sex-specific one-year transition probabilities are based on the rules of addition and multiplication of probabilities.
Each iteration is assumed to operate immediately after the retirements (occurring at the end of each year of age) have taken place. Under the assumption of uniform distribution of decrements over each year of age, the decrements affecting active persons, retirees and existing disability [in (3), (4), (6) and (8)] are assumed to occur, on average, at the end of six months.
(1) Active to active: )1)(1( 1**)(
+−−−= xxax
aax riqp
(2) Active to retiree: 1**)( )1( +−−= xx
ax
arx riqp
(3) Active to disability: )5.01(*)( ixx
aix qip −=
(4) Active to widow/widower: )](5.01[ **5.0
*)1(xx y
wyx
ax
awx hqwqq +−= +
(5) Retiree to retiree: px
rrx qp −=1)(
(6) Retiree to widow/widower: )](5.01[ **5.0
)(xx y
wyx
px
rwx hqwqq +−= +
(7) Disability to disability: ix
iix qp −= 1)(
(8) Disability to widow/widower: )](5.01[ **5.0
)(xx y
wyx
ix
iwx hqwqq +−= +
(9) Widow/widower to widow/widower: xwx
wwx hqp **)( 1 −−=
where:
• The active service table , where b is the youngest entry age, and r is the
highest retirement age. This is a double decrement table allowing for the decrements of
death and disability only. The associated dependent rates of decrement are denoted by
(mortality) and (disability). Rx denoting the proportion retiring at age x.
rxbl ax ≤≤},{
* axq xi
*
25

• The life table for disability and the associated independent mortality rate
.
wxbl ix ≤≤},{
ixq
• The life table for retired persons, (where r* is the lowest retirement age),
and the associated independent rate of mortality .
wxrl px ≤≤*},{
pxq
• The double decrement table for widow/widower, (y* is the lowest age of
a widow, widower), and the associated dependent rates of decrements, (mortality), and
(remarried).
wyyl wx ≤≤*},{
wyq*
yh*
• The single decrement table for orphans, , where z* is the age limit for
orphans’ pensions, and the associated independent rate of decrement .
*0},{ zzl oz ≤≤
0zq
• wx is the proportion of married persons among those dying at age x.
• yx is the average age of the spouse of the person dying at age x.
• nx is the average number of orphans of a person dying at age x.
• zx is the average age of the above orphans.
Source: Iyer (1999)
26