Embed Size (px)
Citation preview

The Peculiar Politics of No Child Left Behind
Tom Loveless Brown Center on Education Policy
The Brookings Institution August 2006
The author thanks Katharyn Field-Mateer for research assistance.
The Peculiar Politics of No Child Left Behind Tom Loveless
Brookings Institution
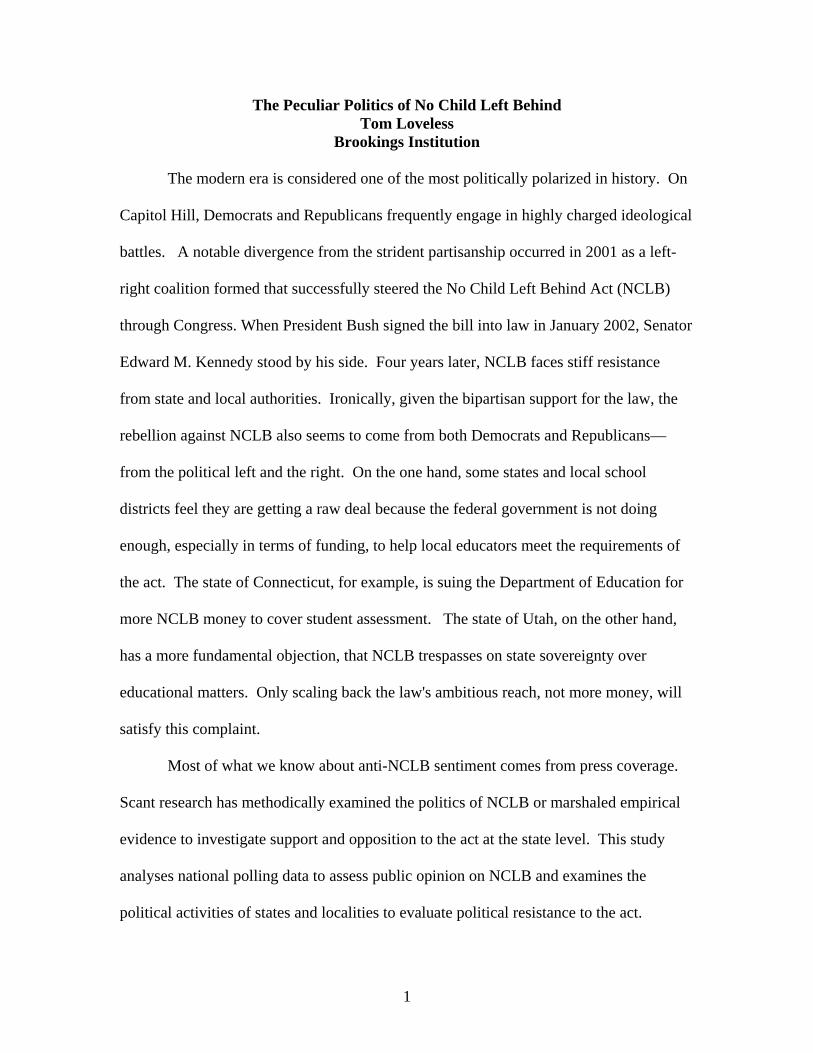
The modern era is considered one of the most politically polarized in history. On
Capitol Hill, Democrats and Republicans frequently engage in highly charged ideological
battles. A notable divergence from the strident partisanship occurred in 2001 as a left-
right coalition formed that successfully steered the No Child Left Behind Act (NCLB)
through Congress. When President Bush signed the bill into law in January 2002, Senator
Edward M. Kennedy stood by his side. Four years later, NCLB faces stiff resistance
from state and local authorities. Ironically, given the bipartisan support for the law, the
rebellion against NCLB also seems to come from both Democrats and Republicans—
from the political left and the right. On the one hand, some states and local school
districts feel they are getting a raw deal because the federal government is not doing
enough, especially in terms of funding, to help local educators meet the requirements of
the act. The state of Connecticut, for example, is suing the Department of Education for
more NCLB money to cover student assessment. The state of Utah, on the other hand,
has a more fundamental objection, that NCLB trespasses on state sovereignty over
educational matters. Only scaling back the law's ambitious reach, not more money, will
satisfy this complaint.
Most of what we know about anti-NCLB sentiment comes from press coverage.
Scant research has methodically examined the politics of NCLB or marshaled empirical
evidence to investigate support and opposition to the act at the state level. This study
analyses national polling data to assess public opinion on NCLB and examines the
political activities of states and localities to evaluate political resistance to the act.
1

The political opposition strikes at the heart of NCLB. The goal of making schools
more equitable, in particular, of improving the education of children from poor families,
brought together the bipartisan coalition supporting NCLB. Prior to NCLB, the
Elementary and Secondary Education Act (ESEA) operated as a typical federal program
pursuing redistributive objectives; it allocated additional resources to low income schools
to purchase supplies, personnel, curricula, and other educational materials that schools in
impoverished communities could not otherwise afford. Educators used these additional
resources to improve the education of poor children. Reauthorizations of ESEA through
1994 left this arrangement intact. The theory was simple: more money produces better
education, and high poverty schools need more money.
The theory of NCLB is different. Resources are viewed as incentives. In
exchange for federal monies, local educators agree to produce certain outcomes. If they
do not produce the promised outcomes, federal funding is cut off. With the exception of
the teacher quality portions of NCLB, the law takes an agnostic position on how
educators should convert resources into student achievement. The sanctions of NCLB—
parental choice, supplemental services, reconstitution of schools—are components of the
new incentive structure and do not produce new revenue streams. Schools that do not
make adequate yearly progress with black, Hispanic, or poor children face the threat of
these sanctions. Putting a new incentive structure into place creates winners and losers,
and we can expect those interests to play out in the politics surrounding NCLB's
implementation.
2

After this introduction, the paper is organized by five sections. The first section
reviews national polling data on NCLB. Opponents to NCLB have argued that the more
people know about the law, the more likely they are to oppose it. Is this true? More
generally, as the accountability provisions of NCLB are now being enforced, is public
support for the law waning? The second section turns to state politics. What does the
research literature say about how have states responded to NCLB?
The third section explains empirical methods employed to analyze state reactions.
I devised a scale to reflect the magnitude of state rebellion against the act. On one end of
the scale are states that have taken legislative or legal action against NCLB. On the other
end of the scale are states that have either taken no action against the act or have defeated
legislative efforts to circumvent NCLB. Using this scale, I test several factors that may
influence a state's response to NCLB, among them, political culture, student achievement,
demographic characteristics, and resource constraints. The fourth section describes the
findings of the analysis.
The fifth section of the paper concludes by assessing whether state and local
opposition to the implementation of NCLB has weakened the foundation of NCLB's
political support. What obstacles must NCLB overcome to survive? The left-right
coalition that originally supported No Child Let Behind rallied around the belief that
NCLB would help children in poverty. Has that changed? Has opposition to NCLB
undermined the view that the law represents a legitimate means of improving the
education of poor and minority students?
3

National Polls on NCLB
Two national polls on NCLB, one conducted by Phi Delta Kappan/Gallup and the
other by the Educational Testing Service (Peter Hart and associates), provide data
spanning the years since the law's inception.1 They also include questions that assess
how well informed respondents are about NCLB. In 2003, the authors of the Kappan poll
concluded that the more people know about NCLB, the less likely they are to support the
act, a point that was reiterated in the release of 2005 Kappan Poll results. 2 How strong is
the evidence supporting this conclusion?
The argument is based on two simultaneous trends. The first is that the public is
becoming more familiar with NCLB. As shown in Table 1, the ETS/Hart Poll shows that
the percentage of respondents who have heard a great deal or fair amount about NCLB
grew from 31% in 2001 to 61% in 2005.3 The second trend is that, although more people
consistently favor NCLB than oppose it, the gap between support and opposition is
narrowing. In the ETS/Hart poll, the lead of supporters over opponents shrank from 12%
in 2001 to 4% in 2005. The Phi Delta Kappan poll reports a similar trend (see Table 2).
In 2003, 69% confessed that they did not know enough about NCLB to express an
opinion, a figure which declined to 45% in 2005. At the same time, the margin of
support for NCLB narrowed. In 2003, 18% of respondents expressed positive sentiments
and 13% expressed negative sentiments. In 2005, respondents with a favorable view had
increased 10 percentage points to 28%, and negative sentiment had increased by 14
percentage points to 27%, leaving favorable and unfavorable opinions in a statistical dead
heat.
4

Of course, arguing that these simultaneous trends are related is speculative. It
could be, as the Kappan pollsters assume, that after people learn more about NCLB, they
do not like what they learn. But the causal relationship could operate in the opposite
direction. People may form a negative opinion first—perhaps from something they have
read or from personal experience with NCLB's sanctions—and then seek more
information. At the same time that public awareness of NCLB was growing, the law's
penalties for low performing schools began to be applied. Implementation of the law's
consequences, rather than more knowledge, may be fueling the opposition to NCLB. In
some communities, after local schools are singled out for needing improvement or
teachers complain to parents about the testing requirements of NCLB, sympathetic
citizens may then seek to get to the bottom of NCLB's punitive provisions.
The 2005 ETS Hart poll tested the "more knowledge, more opposition" theory.
Respondents were divided into two groups. The first group was simply asked its opinion
of NCLB. The second group was provided some basic information about the law and
then asked its opinion. This aided group was told that the federal government provides
funding to local school districts and that NCLB requires states to set educational
standards and to test students annually to see if standards are being met. Did having this
information affect the aided group's opinions?
Table 3 displays the data. The aided group did indeed express a slightly less
positive view of NCLB than the unaided group. But that is not the headline result of this
little experiment. The intriguing outcome is that the aided group appears less sure of its
opinion than the group without any information. The number of people in the aided
group saying they did not have enough information to form an opinion (19%) was
5
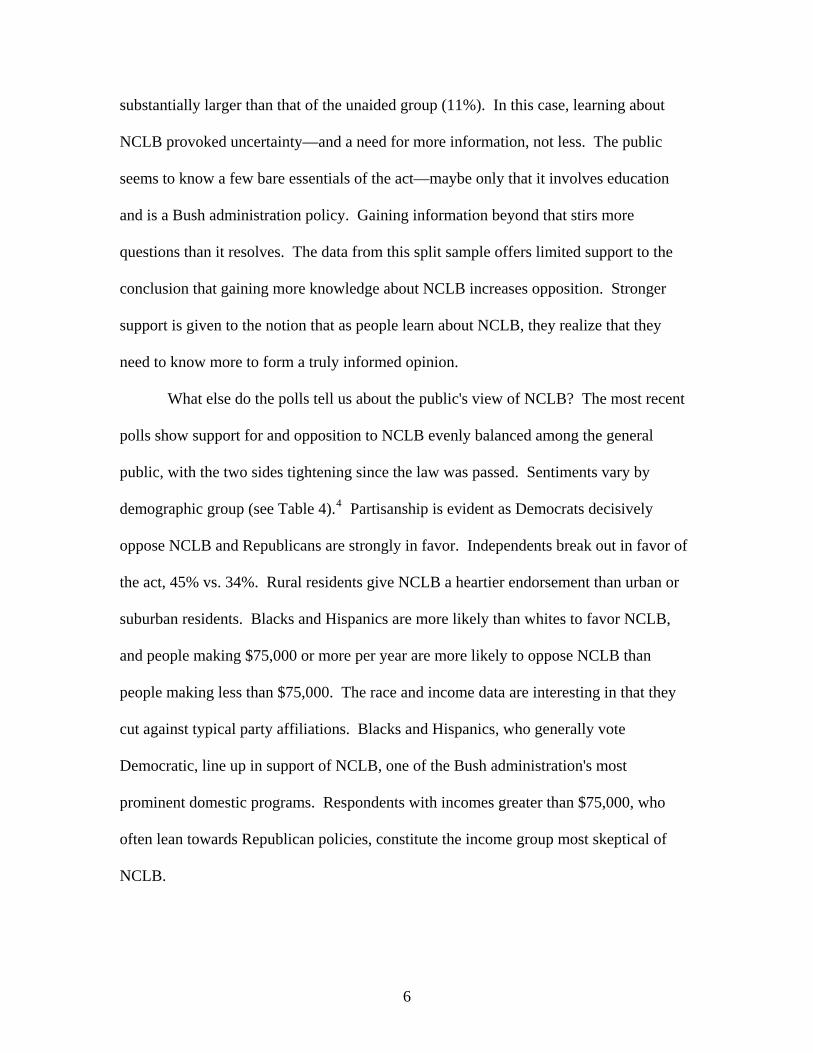
substantially larger than that of the unaided group (11%). In this case, learning about
NCLB provoked uncertainty—and a need for more information, not less. The public
seems to know a few bare essentials of the act—maybe only that it involves education
and is a Bush administration policy. Gaining information beyond that stirs more
questions than it resolves. The data from this split sample offers limited support to the
conclusion that gaining more knowledge about NCLB increases opposition. Stronger
support is given to the notion that as people learn about NCLB, they realize that they
need to know more to form a truly informed opinion.
What else do the polls tell us about the public's view of NCLB? The most recent
polls show support for and opposition to NCLB evenly balanced among the general
public, with the two sides tightening since the law was passed. Sentiments vary by
demographic group (see Table 4).4 Partisanship is evident as Democrats decisively
oppose NCLB and Republicans are strongly in favor. Independents break out in favor of
the act, 45% vs. 34%. Rural residents give NCLB a heartier endorsement than urban or
suburban residents. Blacks and Hispanics are more likely than whites to favor NCLB,
and people making $75,000 or more per year are more likely to oppose NCLB than
people making less than $75,000. The race and income data are interesting in that they
cut against typical party affiliations. Blacks and Hispanics, who generally vote
Democratic, line up in support of NCLB, one of the Bush administration's most
prominent domestic programs. Respondents with incomes greater than $75,000, who
often lean towards Republican policies, constitute the income group most skeptical of
NCLB.
6

The partisan split on NCLB is surprising for two reasons. First, the bipartisanship
of elites who pushed the law through Congress is not mirrored in mass public opinion.
Second, as just noted, key constituents of the Democratic and Republican parties diverge
from their parties' position on the law.
Are there parts of the law that the public supports and other parts that it opposes?
Indeed there are, and that allows opponents and supporters of NCLB to single out
different pieces of polling data to claim that their respective arguments enjoy popular
support. Backing for NCLB appears strongest when general views on accountability are
solicited, but opposition grows as specific details of the law are provided. For example,
strong support exists for regularly testing students and holding students and educators
accountable for results, the bedrock principles of NCLB. When a 2004 poll by
Americans for Better Education asked if the federal government should be able to hold
states and local schools accountable "to make sure student performance is improving,"
71% said that it should, 25% said it should not. 5 But support for the idea begins to wane
when the question is worded differently, especially if the meaning of accountability is
fleshed out. In the 2005 Kappan Poll, for example, 68% say a single test cannot provide
a fair picture of student achievement. Fully 80% want subjects other than reading and
math to be assessed. And support for standards-based assessment declines when tests are
described as "high stakes." A 2004 Results for America poll found 68% support for
NCLB and 22% opposed, but when prompted about the "high stakes testing" of NCLB,
51% supported this part of the act and 45% opposed it.6
This observation, that Americans believe in test-based accountability and yet are
leery of "high stakes" testing, is important to note. Most people embrace accountability,
7

but only an accountability devoid of unpleasant consequences. Actions that sound
punitive or unfair are frowned upon. Should federal funds be withheld from schools
classified as "failing"? Nearly three-quarters of Americans say no. What about shutting
down failing schools? Only 31% support such a move. By a margin of 68% to 28%,
respondents do not believe that special education students should be held to the same
standards as other students. And 62% (vs. 34%) think that the test scores of special
education students should not be a factor in deciding if a school "is in need of
improvement." The public believes that counting special education scores in
accountability systems is unfair to both schools and to the students themselves.7
Before moving on to state politics, allow me to summarize the major findings of
national polls on NCLB. The American public initially favored NCLB by a comfortable
margin, but polls from 2001 to 2005 show opponents steadily gaining on the law's
supporters. In 2005, sentiments were evenly divided. The argument that opposition has
grown because people have become more informed about NCLB is only weakly
supported by evidence. Support for NCLB differs among several groups. Republicans
favor NCLB more than Democrats, rural residents more than urban or suburban dwellers,
African-Americans and Hispanics more than whites, and middle and low income workers
more than those making more than $75,000 per year. The public favors the core idea of
NCLB—testing students and holding schools accountable for student learning—but does
not want accountability to include negative consequences.
Those are the public opinions that frame the national politics of NCLB. The
paper now examines the politics of NCLB at the state level.
8

Influences on the Politics of NCLB at the State Level
What factors might shape how a state responds to NCLB? Political cultures are
prominent in producing variation in state approaches to public policy.8 Patterns of
governance are anchored in regional histories, and they persist. Several Northeastern
states were pioneers in creating common schools in the 19th century while many Southern
states lagged behind and did not offer publicly financed common schools until
Reconstruction. Patterns were established that make education politics look out of step
with how contemporary regional politics are usually characterized. When Horace Mann
was appointed the first secretary to the Massachusetts state board of education in 1837,
schools in the state already had been operating for nearly 200 years. Today, education
governance in the Northeast is noted for a deeply ingrained belief in local control,
reflecting the bottom-up origins of the school system and contradicting an otherwise
liberal bent toward an activist state government. In the South, on the other hand, a
generally conservative political culture restrains the power of state government—except
in education. Southern states continue to direct most educational matters from the
statehouse, a reminder that the region's school systems have their origins in the
Reconstruction period.
Federalism traditionally refers to how power is shared between the states and
Washington, DC. Under NCLB, the federal government establishes an overall policy
framework—goals and general procedures—but states are allowed latitude in
implementation, an arrangement Cibulka (1996) calls "regulatory federalism."9 As noted
above, Utah considers NCLB intrusive for dictating policy on what traditionally has been
exclusively state terrain. Tensions develop in the sharing of power by the federal and
9

state governments, of course, but similar tensions arise also within states. The major
responsibilities that have been reserved for state education officials under NCLB--
creating and administering tests, determining levels of student proficiency, defining
highly qualified teachers—impinge on local prerogatives. Indeed, Fusarelli (2005)
observes that NCLB reinforces a trend towards gubernatorial control of school reform. It
not only takes the questions of whether and how schools should be held accountable out
of the hands of local school districts but also out of the hands of state legislatures.10 In
short, NCLB concentrates power in the executive branch of state government; it grants
state education officials the authority to force reluctant local districts to test students and
to hold schools accountable, and it does so without the approval of state legislatures.
As noted above, empirical research on the states' reactions to NCLB is sparse,
reflecting the brief period of time since the law was enacted. Resource constraints played
a role in the first few years of implementation, especially in light of tight state budgets in
the 2001-2004 period.11 A 2003 ranking by the Education Commission of the States
(ECS) found only 10 states "on track" to meet the highly qualified teacher requirements
of NCLB. Analyzing the ECS rankings, Dotterweich and McNeal (2004) found that
states with greater minority diversity were more likely to have implemented NCLB's
teacher quality provisions.12 Paul Manna (2004) discovered a weak effect of a state's
percentage of disadvantaged students increasing the likelihood of implementing NCLB's
accountability provisions.13
Overall, most analysts have been impressed with NCLB's implementation,
especially compared to NCLB's predecessor, the Improving America's Schools Act of
1994 (IASA). Wanker and Christie (2005) observe that only 17 states fully complied
10

with the IASA.14 The procedures that states must follow under NCLB are more specific
and the Department of Education has enforced the act more diligently than IASA was
enforced.15 Solid progress has been made in adopting standards and in implementing
assessment and accountability systems.16
Despite the success, press accounts of state resistance to NCLB are numerous.17
Mathis, Fleming, and Lecker (2005) employed multivariate models to analyze state
resistance to NCLB.18 Testing several variables, they found no relationship between a
state's level of "objection to the 'federal imposition'" of NCLB and the following: NAEP
scores, percentage of schools not making Adequate Yearly Progress (AYP), indicators of
economic disadvantage, percentage of rural students, or political partisanship. Also,
states that had ordered evaluations of the fiscal impact of NCLB on state resources--and
had calculated an onerous financial burden--were not found to be unduly rebellious.
Instead, the researchers concluded that the rebellion against NCLB was driven largely by
individual state political environments.
The literature identifies several phenomena that should be scrutinized to analyze
the politics of NCLB, including political cultures, resources, student achievement, and
demographic profiles of the fifty states. Although the Mathis et al. study found that most
of these constructs bear no relationship to the rebellion against NCLB, perhaps an
examination of contemporary data with a different analytical approach will arrive at a
different conclusion.
How the Analysis of State Politics was Conducted
11

This portion of the study investigates what is driving political opposition to
NCLB in the states. I created a six level scale to reflect the states' reactions to NCLB.
On one end of the scale (rated as 6's) are Connecticut, which filed suit against the federal
government over funding the expanded student assessment required by the act, and Utah,
which passed a law prohibiting local districts from implementing portions of NCLB that
are "unfunded" or in conflict with state law (see Appendix A for the states' rankings,
Appendix C for a list of NCLB activities by state, and Appendix D for a list of sources).
Slightly less resistant, level 5's, are nine states that allow local opt- outs in law or prohibit
spending state money on implementing NCLB—or in which local districts sued or took
other legal action on NCLB. The level 5 states are Colorado, Illinois, Louisiana, Maine,
Michigan, New Jersey, Pennsylvania, Texas, and Vermont. The remaining categories
include states in which legislation allowing districts to opt out of NCLB may have passed
one legislative house but was not passed into law (level 4's), states in which resolutions
critical of NCLB are pending, have been introduced, or in some cases passed (level 3's),
states in which anti-NCLB legislation was defeated (level 2's), and states in which no
measurable action was taken against NCLB (level 1's). This six level scale of political
resistance to NCLB serves as the dependent variable in the analyses below.
The scale differs from the Mathis et al study in how level 2 states are coded. In
Mathis et al, , states that considered but did not pass anti-NCLB legislation were coded as
somewhat opposed to the law. Enough opposition was present in these states to spawn a
legislative proposal. In the current study, these same states were treated as somewhat
supportive of NCLB, the reasoning being that by voting down an anti-NCLB resolution,
legislators expressed support for the act.
12

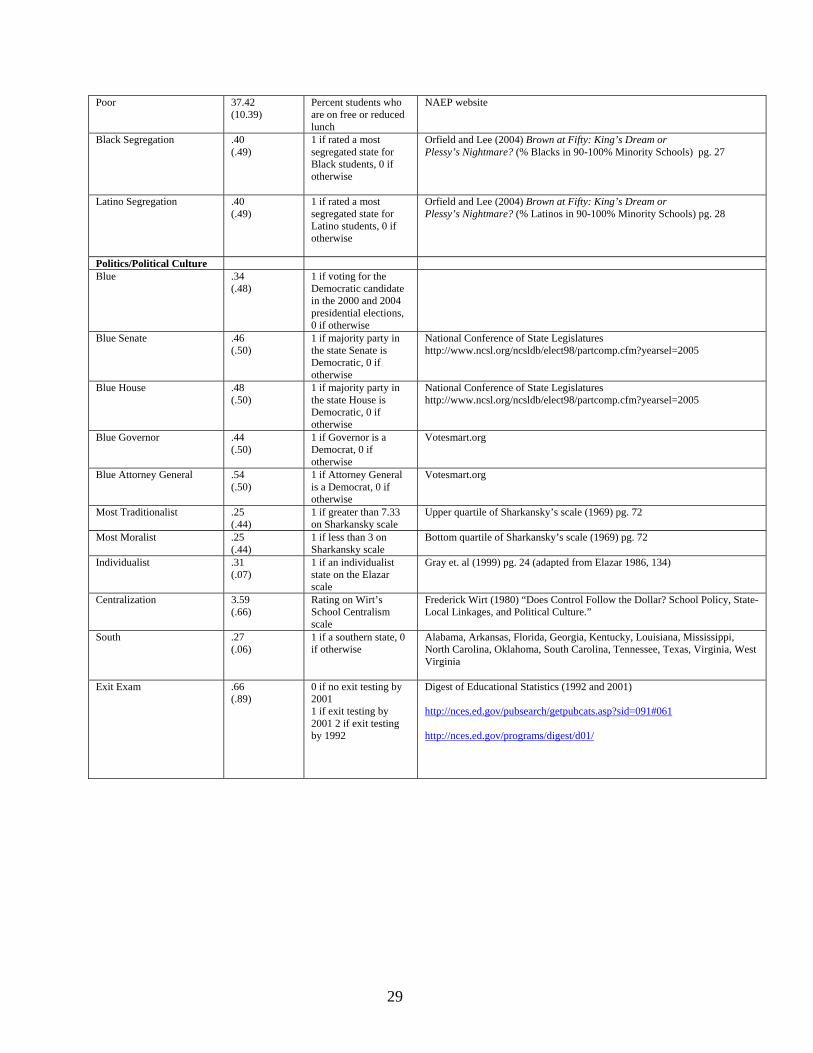
Explanatory variables measure four clusters of influence on states' reactions to
NCLB: political culture, student achievement, demographic characteristics, and
resources. Appendix B describes all of the variables, provides summary statistics, and
lists data sources. Briefly, the explanatory variables are:
Political Culture: Party of governor, state legislature, and attorney general,
presidential vote in 2000 and 2004, and region (if Southern state). Despite the initial
non-partisan Congressional support for NCLB, polls show a partisan split on NCLB
among the electorate. State politicians are expected to follow the preferences of local
voters rather than politicians in Washington, DC. Democratic states are expected to
oppose NCLB, the chief domestic accomplishment of a Republican president and
congress. Southern states, having implemented testing and accountability systems prior
to NCLB, are expected to appear sympathetic to the law.
Demographic: Race and ethnicity, students in poverty, and measures of black and
Latino segregation. Critics of NCLB have charged that the law will unfairly penalize
schools serving students in poverty and minority students because of the demographic
profiles of many low performing schools.
Student Achievement: 2005 NAEP scores for 8th grade math, NAEP scores for
racial and ethnic groups and for students in poverty, score gaps on NAEP between
demographic groups, and percentage of schools making adequate yearly progress (AYP).
States with better achievement profiles (higher NAEP scores and more schools making
AYP) are expected to be more compliant in responding to NCLB than states with lower
achievement. States with larger achievement gaps between majority and minority
students-and between poor and non-poor students—are expected to resist NCLB. They
13

have the most to lose by changing ESEA from an entitlement program, in which they can
argue for more resources to tackle achievement gaps, to an incentive-based program, in
which states are penalized if they do not close such gaps.
Resources: Funding, including the percentage of K-12 spending from the federal
government, and measures of teacher quality, including the percentage of highly qualified
teachers in high poverty schools. Greater compliance is expected from states that are
more dependent on federal funding and greater resistance from states that face tougher
hurdles in staffing schools with highly qualified teachers.
The study is limited, as are all studies that attempt to statistically model state
behavior, by a dependent variable with only fifty observations. This is especially
problematic with multivariate logistic regressions that produce numerous empty cells or
cells with reduced counts. Therefore, in interpreting the data, I rely on evaluating
bivariate relationships instead of interpreting parameter estimates from multivariate
models. Although the relationships uncovered are merely correlational, I speculate as to
some of the causal mechanisms that may connect political influences with states'
behaviors.
Means and standard errors of resistance to NCLB are reported for high and low
levels of the explanatory variables (i.e., dummies were created). For non-dichotomous
variables, cut points defining high and low levels were determined by examining quartile
means to see where threshold effects occurred. Then one-way ANOVAs were run,
producing F statistics that were tested for significance. For example, the mean resistance
levels for each quartile of the black-white NAEP gaps were: (Q1) 2.7, (Q2) 3.0, (Q3) 2.6,
and (Q4) 3.9. Resistance in quartile 4 clearly stands out, which encompasses states with
14

gaps greater than 36.5 points. Quartile 4 states were coded as the high level of this
variable (dummy of 1), the other quartiles as the low level (dummy of 0), and then
resistance levels were analyzed with a one-way ANOVA.
The paper now turns to an analysis of what is driving political opposition to
NCLB in the states.
Analysis of Resistance from the States
State and local objections to NCLB have been widely covered by the press. Table
5 presents data on state resistance to NCLB and four clusters of state-level variables:
political culture, student achievement, demographic characteristics, and resources.
Political culture
As revealed in Table 5, geography matters in how states respond to NCLB.
Southern states are the most compliant towards NCLB, and states outside the South offer
the most resistance. This is consistent with the historical tendency of Southern states to
centralize education policy at the state level and for states in the Northeast to devolve
powers of governance to local school districts. Under NCLB, state officials gain the
authority to sanction educators based on students' test scores, power that in many states
was held exclusively, if at all, by local schools and school districts. Southern states are
comfortable with NCLB's allocation of authority, having implemented state testing
programs and accountability systems long before NCLB. States in which local control of
educational governance is strongest, in contrast, have reacted the most negatively towards
NCLB.
15
Also note that blue states, those that voted Democratic in both the 2000 and 2004
presidential elections, are more resistant to NCLB. Red states are more supportive. The
pattern revealed here is consistent with red states' tendency towards less tax effort, fewer
state government expenditures, and less reliance on a professional bureaucracy to
implement policies. This politically conservative philosophy mirrors the theory
underlying NCLB and amplifies how much NCLB is a break from the past. And it is
even true for Southern states, despite state centralization in education. States located
outside the South, and, in particular, states that voted Democratic in the past two
elections, are more hostile towards NCLB's underlying theory.
Achievement
Some findings on the relationship of student achievement and states' resistance to
NCLB are counterintuitive. For example, states that are most at risk of experiencing
NCLB sanctions are not complaining. The vast majority of NCLB's sanctions target
schools failing to make Adequate Yearly Progress (AYP). States with more than 77.5%
of their schools making AYP in 2004 are more likely to oppose NCLB than states with
lower rates of success. The same pattern holds true for 2005 although the effect is
evident for states with more than 59.5% of schools making AYP. States that have a
significant number of low performing schools—as defined by AYP formulas—are more
supportive of NCLB than those with fewer low performing schools.
A similar puzzling finding arises from examining state NAEP scores. It is not the
low achieving states on NAEP that oppose NCLB. On the NAEP 8th grade mathematics
test given in 2005, states that score at both ends of the continuum—either in the top or
16

bottom dozen states on the test—are complacent towards NCLB. Resistant states show
up in the middle of the distribution, with scale scores between 274 and 284 (the mean of
state NAEP scores is 279 with an SD of 7). So the highest scoring states, which might
spurn federal reform efforts as unnecessary, and the lowest scoring states, which might
have the most to lose from any federal regulation based on student achievement, do not
exhibit resistance to NCLB.
The complacency of high achieving states towards NCLB can be plausibly
explained by the fact that they have little to lose from sanctions based on test scores. But
why do low achieving states—and those with large numbers of schools failing to make
AYP--hold a sanguine view of NCLB? Lessons learned from the politics of other
education policies may be helpful in proposing reasonable but nonetheless speculative
answers to that question. Very often, public opinion polls taken in communities with low
student achievement report broad support for strong reforms—and the opposite occurs in
areas with high performing schools. Vouchers, for example, receive their greatest
support in urban areas and least support in suburbs.19 As noted above, NCLB offers state
officials powerful interventions to use with persistently failing schools. These
interventions were not available under most state laws prior to NCLB and, due to the
nature of state politics, were impossible to get through most state legislatures. The
federal law provides political cover to education officials in states in which NCLB-like
accountability is politically untenable—first, by forcing reluctant states to create
accountability systems, and second, by requiring that states sanction low achieving
schools. State officials who impose unpleasant and unpopular consequences on low
performing schools can say, "Sorry, the feds made us do it."
17

Demographic Characteristics
States with larger African-American populations (more than 21.1% of students)
are more supportive of NCLB. The ESEA's legacy as a federal instrument for
educational equity may be in evidence here, as well as African-Americans more fervent
support for NCLB than whites. Blacks want schools fixed—now—and they embrace
policy interventions that reflect such urgency. In addition, states with large black-white
test score gaps are more likely to oppose NCLB. States with black-white gaps of at least
37 points on the 2005 NAEP (again, 8th grade math, mean of 32.5, SD of 7) are more
resistant towards NCLB than states with narrower gaps.
A negative reaction based on achievement gaps is a rational response to the
accountability provisions of NCLB. States with large achievement gaps, even liberal
states outside the South, have the most to lose under NCLB's regime of incentives that
target equity. By requiring the disaggregation of test score data, NCLB forced many state
to recognize the severity of achievement deficits for poor and minority students. In an
interview on Jim Lehrer's News Hour, Secretary of Education Margaret Spellings
suggested that Connecticut should be working to reduce achievement gaps rather than
suing the federal government:
In Connecticut, my understanding… is that they want to measure every other year and not provide annual assessment as is required in the statute… I think it’s regrettable, frankly, when the achievement gap between African-American and Anglo kids in Connecticut is quite large. And I think it’s unfortunate for those families and those students that they are trying to find a loophole to get out of the law as opposed to attending to the needs of those kids. 20
18

The recent action of the NAACP, joining the Bush administration in defending NCLB
against the lawsuit by the state of Connecticut, underscores the sympathy many African-
American leaders feel towards NCLB.21
Interestingly, the effect runs in the opposite direction for Hispanics. States with a
larger percentage of Hispanic students (more than 13.6%) are more likely to oppose
NCLB than states with smaller Hispanic populations. The finding for Hispanics also runs
contrary to national polling data. Recall that for Hispanics, the advantage of favorable
over unfavorable opinions on NCLB (14 points, see Table 4) exceeds that of whites (6
points) and blacks (10 points).
Like the effect of larger black-white test score gaps, a larger Hispanic population
within a state may be influencing the attitudes of political elites towards NCLB. The
issue of testing, and in what language tests are to be administered, has raised the concern
of activist groups. The National Association for Bilingual Education (NABE) joined a
group of 65 organizations that signed an October 2004 letter opposing NCLB. The 2005
annual conference of NABE included several speakers who were critical of the act and
urged bilingual educators to oppose it.22 That said, the Hispanic community is split on
the issue. La Raza is part of The Achievement Alliance, a group supportive of NCLB
that also includes the Education Trust, the Business Roundtable, the Citizen's
Commission on Civil Rights, and the National Center for Educational Accountability.23
A large Hispanic student population may give education officials pause in regard
to test scores under NCLB. Despite ambitious literacy programs nationwide, reading
scores on NAEP have been flat for the past decade. Due to large numbers of Hispanic
students who are English language learners, Hispanic reading scores are low. And the
19

proportion of Hispanic students is growing steadily. Writing in Education Week,
Marshall S. Smith, U.S. Deputy Secretary of Education in the Clinton administration,
notes that "had the proportion of all groups remained constant over the decade, the
average national gain would have been greater than 10 points" in eighth grade reading.24
Resources
States for which federal funds make up less than 8.3% of K-12 revenue are more
likely to object to NCLB than states with a greater reliance on federal funding. Greater
dependency on federal revenue may inhibit states from publicly challenging NCLB, a
case of states not wanting to bite the hand that feeds them. Conversely, states that are
more reliant on local revenues to shoulder the burden of financing K-12 education may
feel that the federal government should not tell them how to run their schools. Bear in
mind, however, that because the federal Title I program targets high poverty schools,
states receiving more federal money also tend to have more students in poverty, along
with other characteristics that the current study has discovered are correlated with support
for NCLB, including lower NAEP scores, fewer schools making AYP, and being located
in the South. Out of the top twenty recipients most dependent on federal funding in 2002
(states ranked by share of K-12 revenue from federal sources), eleven are Southern
states.25
There is another reason to doubt that federal revenue is as influential as suggested
here. In 2002, state governments provided 49.2% of K-12 revenue, and local
governments, 40.5%. The federal share was only 7.9%. Historically, the federal share
20

has never exceeded 10%, peaking at 9.8% in 1980, President Carter's last year in office
and the first year of the U.S. Department of Education.
Summary and Conclusion
I conclude by tying together the two analytical sections of the paper—the
examination of national polling data and state resistance to NCLB—and discussing
implications for the future of NCLB and efforts to improve educational quality for poor
and minority children.
The two analyses paint a clear picture of who tends to support and to oppose
NCLB, whether the supporters and opponents are individuals or entire states. Individual
supporters tend to be Republican, residents of rural areas, African-American or Hispanic,
and middle and low income workers. Opponents are more likely to be Democratic,
residents of suburban or urban areas, white, and upper income professionals. States that
tend to support NCLB are red states in presidential elections, score in the very bottom or
top quartiles of NAEP, serve student populations that are more than 21.1% African-
American or less than 13.6% Hispanic, exhibit narrower than average black-white test
score gaps, receive more than 8.3% of K-12 revenue from the federal government, and
are located in the South. States that are opposed tend to be blue states in presidential
elections, fall in the middle quartiles of NAEP scores, have relatively small African-
American or relatively large Hispanic populations, exhibit larger than average black-
white test score gaps, receive less than 8.3% of K-12 revenue from federal sources, and
are located in the East, Midwest, or Western regions of the country.
21

Many of these characteristics overlap, of course. The characteristics that are
seemingly contradictory call for closer scrutiny, primarily because in them may be found
clues to the fate of NCLB. The left-right coalition that formed to pass NCLB was itself a
political contradiction. The future of NCLB, and its re-authorization in 2007, hinges on
holding that coalition together. The cross-cutting political influences unearthed in the
foregoing analysis expose fault lines that opponents could exploit to seriously weaken
NCLB--or on which supporters could focus their energies to shore up and boost support.
Consider equity. From the beginning, the authors of NCLB framed the legislation
as a civil rights issue. Support from groups such as the Education Trust and politicians
such as Congressman George Miller and Senator Edward M. Kennedy reinforced that
theme. Blacks, Hispanics, and blue collar workers continue to support NCLB, but states
with large Hispanic populations tend to be critical of the law. By hammering away at
NCLB's goal of raising the achievement of poor and minority youngsters, supporters of
NCLB may force politicians in several states to reconcile their opposition to NCLB with
the favorable opinions of minority constituents. Opponents of NCLB, on the other hand,
can make hay out of the fact that schools receiving sanctions under NCLB serve
predominantly poor and minority populations. Sanctioning schools--the hard edge of
accountability--is not popular with the public. Emphasizing who receives NCLB's
penalties may dampen enthusiasm for the idea that NCLB promotes equity. True, the
claim "the more people hear about NCLB, the more they oppose it" is an exaggeration,
but people who hear about school sanctions emphatically dislike them.
How AYP is calculated will surely enter the debate. The U.S. Department of
Education recently announced a pilot program that will allow ten states to experiment
22

with growth models, which calculate AYP on the basis of students' year to year progress
instead of the percentage of students meeting proficiency targets. Shifting to a growth
model makes it easier for schools in the bottom of the achievement distribution to meet
AYP. Some schools are currently boosting test scores but not raising enough students to
proficiency to satisfy AYP requirements. These schools tend to serve large poor and
minority populations. Shifting to growth models will remove them from lists of schools
"in need of improvement."
Politically, installing growth models in NCLB would blunt the argument that
schools with poor, minority populations disproportionately experience sanctions.
Supporters can highlight numerous high poverty schools that are making significant
academic progress under the law. But adopting growth models is not without risks.
Commenting on the pilot program, the Citizens Commission on Civil Rights issued a
statement that said, "We fear that too many school board members and educators will
view the growth-model approach as an invitation to water down expectations for student
achievement in order to reduce the numbers of schools identified for improvement."26
The fear is that low scoring students may make significant growth but still leave school
without the skills necessary to succeed as an adult. This concern must be addressed, but
when NCLB comes up for authorization, look for modification of AYP requirements to
emerge as a potential area of compromise in the arguments over equity.
Funding will also receive attention during reauthorization. In 2001, the ink was
barely dry on NCLB when several Democrats who had supported the legislation in
Congress, including Senator Kennedy, accused the Bush administration of reneging on a
deal to fully fund the act. The Bush administration may be open to significantly
23

increasing NCLB funding. Sweetening the pot never hurts in cooling opposition in
Congress. Additional funding would also receive applause from liberal voters. And the
conservative base of support that NCLB enjoys might view additional funding favorably
if it were tied to incentives for pursuing the law's objectives. However, if NCLB's
supporters stray too far from the core belief that properly crafted incentives, not more
dollars, offer the best chance of improving schools, they risk alienating NCLB's political
base.
Southern states are NCLB's strongest supporters. In one of the interesting twists
of education politics, they also favor centralized governance of education. Big
government, in this case, does not mean expensive government. Southern states feature
constrained budgets, somewhat regressive tax structures, and an aversion to publicly
financed social programs. States in the Northeast, on the other hand, typically lean
towards a liberal politics but place educational governance in the hands of local school
districts. NCLB enhances the power of state governments to change schools.
Northeastern states may temper their opposition to NCLB if they are able to use this new
authority to advance values and interests "of the commonwealth."
The peculiar politics of NCLB first surfaced when the law passed Congress in
2001. NCLB consists of conservative ideas—testing, accountability, and incentives--
wrapped in liberal clothing--a big federal program that seeks, as its primary objective, the
equalization not only of educational opportunity, but also of educational outcomes. A
left-right coalition successfully guided NCLB through Congress. Now, NCLB faces both
conservative and liberal opponents. The politics of NCLB, with reauthorization on the
horizon, highlights both the law's greatest promise and its greatest perils.
24

Table 1: ETS/Hart Polls on No Child Left Behind 2001 2002 2003 2004 2005 Heard great deal/ fair amount
31 39 -- 54 61
Positive 30 -- 36 39 41 Negative 18 -- 28 38 37 Source: ETS/Hart Poll 2001-2005 Table 2: Phi Delta Kappan/Gallup Polls on No Child Left Behind 2003 2004 2005 Don’t know enough to say
69 55 45
Positive 18 24 28 Negative 13 20 27 Source: Phi Delta Kappan/Gallup Poll 2003-2005 Table 3: Public Opinion of No Child Left Behind: Unaided Versus Aided Group Unaided Group Aided Group Positive 45 41 Negative 38 37 Don’t know enough 11 19 Source: ETS/Hart Poll 2005
Table 4: Demographic Breakdown of Public Opinion on No Child Left Behind Favorable Unfavorable Difference Democrat 34 52 -18 Independent 45 34 +11 Republican 57 27 +30 Urban 44 40 +4 Suburban 44 39 +5 Rural 48 34 +14 White 46 40 +6 Black 44 34 +10 Hispanic 46 32 +14 Less than 25K 43 32 +11 25K-50K 51 34 +17 50K-75K 47 36 +11 Greater than 75K 42 49 -7 Source: ETS Hart Poll 2005. Data provided by Peter D. Hart Research Associates, Inc. on behalf of ETS.
25
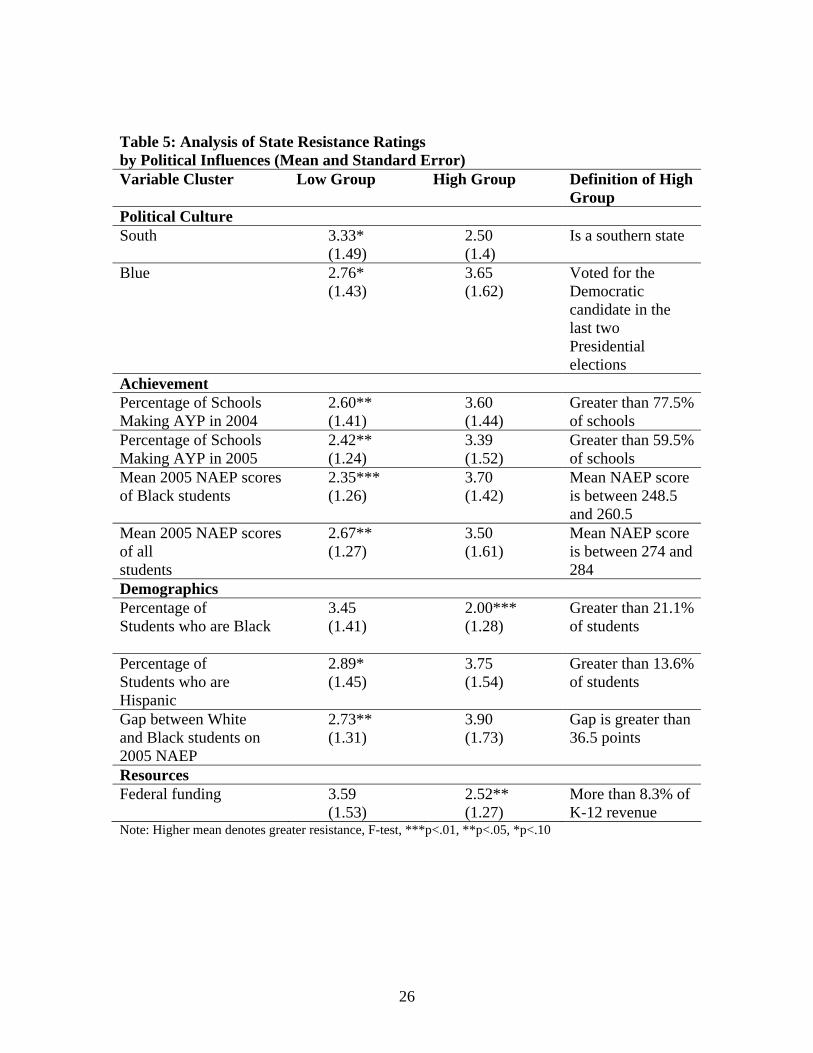
Table 5: Analysis of State Resistance Ratings by Political Influences (Mean and Standard Error) Variable Cluster Low Group High Group Definition of High
Group Political Culture South 3.33*
(1.49) 2.50 (1.4)
Is a southern state
Blue 2.76* (1.43)
3.65 (1.62)
Voted for the Democratic candidate in the last two Presidential elections
Achievement Percentage of Schools Making AYP in 2004
2.60** (1.41)
3.60 (1.44)
Greater than 77.5% of schools
Percentage of Schools Making AYP in 2005
2.42** (1.24)
3.39 (1.52)
Greater than 59.5% of schools
Mean 2005 NAEP scores of Black students
2.35*** (1.26)
3.70 (1.42)
Mean NAEP score is between 248.5 and 260.5
Mean 2005 NAEP scores of all students
2.67** (1.27)
3.50 (1.61)
Mean NAEP score is between 274 and 284
Demographics Percentage of Students who are Black
3.45 (1.41)
2.00*** (1.28)
Greater than 21.1% of students
Percentage of Students who are Hispanic
2.89* (1.45)
3.75 (1.54)
Greater than 13.6% of students
Gap between White and Black students on 2005 NAEP
2.73** (1.31)
3.90 (1.73)
Gap is greater than 36.5 points
Resources Federal funding 3.59
(1.53) 2.52** (1.27)
More than 8.3% of K-12 revenue
Note: Higher mean denotes greater resistance, F-test, ***p<.01, **p<.05, *p<.10
26

Appendix A: Scale of Resistance to NCLB Level 6: Filed suit as a state or established statewide circumvention of NCLB’s power Utah Connecticut Level 5: Allow local opt-outs in law, prohibits spending state money on implementing NCLB, local districts sued or took other legal action, name/petition protesting Colorado Illinois Louisiana Maine Michigan New Jersey Pennsylvania Texas Vermont Level 4: Opt-out legislation is pending, legislation was considered and passed in one house but has not been passed into law Hawaii Indiana Minnesota Nevada New Mexico Ohio Oregon Wisconsin
Level 3: Legislation introduced, Legislation passed but no opt-out California Idaho Iowa Kansas Kentucky Nebraska Oklahoma Rhode Island South Carolina South Dakota Tennessee Virginia Washington West Virginia Wyoming Level 2: Legislation defeated Arizona Florida Maryland New Hampshire North Dakota Level 1: Neutral or supportive Alabama Alaska Arkansas Georgia Massachusetts Mississippi Missouri Montana North Carolina New York Delaware
27

Appendix B: Variables Measuring Political Influences Variable Mean/
Standard Deviation
Description Source
Resource Constraints Highly Qualified Teachers 87.08
(13.48) Percent of classes taught by highly qualified teachers
Education Week, Room to Maneuver (2005) http://ewdev.edweek.org/media/nclb_1214qualified.pdf
Highly Qualified Teachers in High Poverty Schools
84.0 (15.20)
Percent of classes in high poverty schools taught by highly qualified teachers
Education Week, Room to Maneuver (2005) http://ewdev.edweek.org/media/nclb_1214qualified.pdf
% Federal 8.66 (2.90)
Percent of state K-12 spending coming from federal govt.
Digest of Educational Statistics (2004) http://nces.ed.gov/programs/digest/d04/tables/dt04_154.asp
% State 51.0 (11.35)
Percent of state K-12 spending coming from state govt.
Digest of Educational Statistics (2004)
% Local 37.63 (11.99)
Percent of state K-12 spending coming from local govt.
Digest of Educational Statistics (2004)
Per Pupil Expenditures 7980.82 (233.34)
Average annual state expenditure per pupil
http://www.schoolmatters.com/
Achievement 2005 NAEP state score
278.56 (7.18)
Mean score on NAEP 8th grade math
NAEP Data Explorer http://nces.ed.gov/nationsreportcard/nde/
2005 White 286.28 (5.99)
Mean NAEP score for White students
NAEP Data Explorer
2005 Black 25425 (7.25)
Mean NAEP score for Black students
NAEP Data Explorer
2005 Hispanic 261.89 (5.67)
Mean NAEP score for Hispanic students
NAEP Data Explorer
2005 Non-poor 287.4 (5.63)
Mean NAEP score for Non-poor students
NAEP Data Explorer
2005 Poor 263.38 (6.83)
Mean NAEP score for Poor students
NAEP Data Explorer
Black/White Gap 32.5 (7.07)
Gap between Black and White students on 2005 NAEP
NAEP Data Explorer
Hispanic/White Gap 25.9 (5.3)
Gap between Hispanic and White students on 2005 NAEP
NAEP Data Explorer
Poor/Non-poor Gap 23.82 (4.73)
Gap between Poor and Non-poor students on 2005 NAEP
NAEP Data Explorer
NAEP/State Test Gap 24.54 (19.22)
Gap between percent students proficient on NAEP and State tests in 2003 (8th grade math)
U.S. Department of Education, Title I Mathematics Committee
AYP2005 73.15 (16.74)
Percent schools making AYP in 2005
Education Week, Room to Maneuver (2005) http://ewdev.edweek.org/media/ayp_1214.pdf
AYP2004 76.06 (14.02)
Percent schools making AYP in 2004
Education Week, Room to Maneuver (2005) http://ewdev.edweek.org/media/ayp_1214.pdf
Demographic White 67.83
(17.83)
Percent students who are White
NAEP website http://nces.ed.gov/nationsreportcard/states/
Black 14.51 (13.35)
Percent students who are Black
NAEP website
Hispanic 10.91 (12.28)
Percent students who are Hispanic
NAEP website
28
Poor 37.42 (10.39)
Percent students who are on free or reduced lunch
NAEP website
Black Segregation .40 (.49)
1 if rated a most segregated state for Black students, 0 if otherwise
Orfield and Lee (2004) Brown at Fifty: King’s Dream or Plessy’s Nightmare? (% Blacks in 90-100% Minority Schools) pg. 27
Latino Segregation .40 (.49)
1 if rated a most segregated state for Latino students, 0 if otherwise
Orfield and Lee (2004) Brown at Fifty: King’s Dream or Plessy’s Nightmare? (% Latinos in 90-100% Minority Schools) pg. 28
Politics/Political Culture Blue .34
(.48) 1 if voting for the Democratic candidate in the 2000 and 2004 presidential elections, 0 if otherwise
Blue Senate .46 (.50)
1 if majority party in the state Senate is Democratic, 0 if otherwise
National Conference of State Legislatures http://www.ncsl.org/ncsldb/elect98/partcomp.cfm?yearsel=2005
Blue House .48 (.50)
1 if majority party in the state House is Democratic, 0 if otherwise
National Conference of State Legislatures http://www.ncsl.org/ncsldb/elect98/partcomp.cfm?yearsel=2005
Blue Governor .44 (.50)
1 if Governor is a Democrat, 0 if otherwise
Votesmart.org
Blue Attorney General .54 (.50)
1 if Attorney General is a Democrat, 0 if otherwise
Votesmart.org
Most Traditionalist .25 (.44)
1 if greater than 7.33 on Sharkansky scale
Upper quartile of Sharkansky’s scale (1969) pg. 72
Most Moralist .25 (.44)
1 if less than 3 on Sharkansky scale
Bottom quartile of Sharkansky’s scale (1969) pg. 72
Individualist .31 (.07)
1 if an individualist state on the Elazar scale
Gray et. al (1999) pg. 24 (adapted from Elazar 1986, 134)
Centralization 3.59 (.66)
Rating on Wirt’s School Centralism scale
Frederick Wirt (1980) “Does Control Follow the Dollar? School Policy, State-Local Linkages, and Political Culture.”
South .27 (.06)
1 if a southern state, 0 if otherwise
Alabama, Arkansas, Florida, Georgia, Kentucky, Louisiana, Mississippi, North Carolina, Oklahoma, South Carolina, Tennessee, Texas, Virginia, West Virginia
Exit Exam .66 (.89)
0 if no exit testing by 2001 1 if exit testing by 2001 2 if exit testing by 1992
Digest of Educational Statistics (1992 and 2001) http://nces.ed.gov/pubsearch/getpubcats.asp?sid=091#061 http://nces.ed.gov/programs/digest/d01/
29

Appendix C: NCLB Activities in the States Alabama
• No action Alaska
• SJR30 introduced to receive waiver if academic achievement increases (5/11/04). Arizona
• House introduced proposals HB2696, HB2594 to opt out of NCLB. • Senate introduces two resolutions, SB1304 and SCM1006 that permit opting out, changes and waivers. • Both resolutions were defeated.
Arkansas
• House introduced HB 2903 to implement “HQ” rating provision of NCLB. California
• SJR27 introduced 11/04 to request full funding for NCLB . • AJR88 passed House on 6/21/04, passed Senate on 8/19/04: requested full funding and changes to
accountability model and determination of HQ credential for teachers. Colorado
• 5/7/05 Governor Owens allowed SB50 to become law. It permits school districts to opt out of the NCLB and federal funding. Districts still must keep track of test scores so that the state as a whole is eligible for federal funding.
• HJR05-1056, which calls upon the US Congress to provide full funding, passed the House and is currently in the Senate.
Connecticut
• State filed lawsuit against federal government claiming that state and local money cannot be used towards meeting federal testing goals. West Hartford school board voted without dissent to support the lawsuit. The Region board, in a 6-4 vote, also supports the suit.
• Chelshire, Marlborough and Somers districts rejected Title 1 funding to avoid compliance with NCLB. • The Senate passed SJR40 which asked the federal government for several amendments to NCLB.
House introduced HJR30 that requests waivers for high-performing schools. SJR4 (2004) requested waivers for states such as Conn. with overall high academic performance.
Delaware
• No action Florida
• In HM877 (2005) the House urged Congress to re-evaluate requirements of NCLB and funding levels. HM877 was defeated in committee.
• HR1967 (2004), an earlier version of HM877, died in committee. Georgia
• Since being fined in 2003, Georgia requested and received permission to increase minimum number of children in subgroups before school is held accountable for those subgroups.
30

Hawaii • HCR245 passed in House and Senate and was transmitted to the public as of 5/6/05. It asks Congress
to amend NCLB per the National Conference of State Legislature’s task force’s recommendations. HR178, SR124 had formerly made a similar request.
• HR179, SR122 asked for general amendments and adjustments in NCLB. State representatives and senators (in 2004 and 2003) introduced 5 more similar proposals to amend NCLB.
• HR118 was adopted in 2003 and transmitted to the public. It suggested revaluating Hawaii’s participation in NCLB.
Idaho
• State Senate passed SJM106 that expresses changes Idaho would like to see happen to NCLB (referred to House 3/4/05).
• SJM101 introduced in the Senate asks that cities of 1 million or less be exempt from NCLB (referred to Education Council).
• Passed in the House and Senate (as of 3/04), SJM108 suggests that changes be made to AYP provisions.
Illinois
• Governor Rod Blagojevich has signed HB3678 which changes testing provisions for special-education students.
• Princeton and Ottowa school districts filed suit against the federal government on the grounds that NCLB conflicts with IDEA.
• Illinois State Board of Education announced several changes to NCLB: definition of failing and subgroups.
• State Senate introduced SJR47 (5/04) which asks the Illinois delegation to review and change NCLB (passed Senate, arrived in House).
• In August 2004 two districts turned down Title 1 funding to avoid requirements of NCLB. Indiana
• State Board of Education voted to add its name to a letter protesting NCLB (3/04). • State Senate introduced and passed SB258 (1/04) that authorizes state officials to seek waivers from
NCLB if the act conflicts with Indiana’s accountability standards. • State NEA chapter filed suit against the government.
Iowa • HR11 requested the Congressional delegation to secure funding mandates for NCLB (filed 2/10/05). • SCR105 sought waivers if programs increased student achievement (4/04).
Kansas
• Chairman Steve Abrams wants the State Board of Education to consider opting out of NCLB (10/12/05).
• State Senate introduced SR1834 which urges Congress to re-evaluate NCLB and provide full funding. • State Senate introduced SCR1621 and State House introduced HR6028; both asked for a waiver
considering the overall quality of Kansas schools. Kentucky
• Two resolutions (SR172, HR 174—passed House) asking for full funding and more flexibility (3/04). Louisiana
• HCR88 redefines “highly qualified teacher” (5/04). • HCR20 asks for fully funded mandate (passed onto Congress, 4/04).
31

• HCR13, 12 express the right of Louisiana not to comply with NCLB unless it is fully funded (sent to Congress, 4/04).
Maine
• LD 676 passed 5/05 in the House and Senate. It directs the Attorney General to sue the federal government if funding is insufficient to implement NCLB.
• LD 1716 (signed by the Governor 4/04) says that the state department may not use any state money to implement NCLB.
Maryland
• Senate introduced a bill that identifies a conflict between NCLB and IDEA, resolves that the act must be fully funded or that the legislature must seek a waiver (5/05). It was defeated in committee.
Massachusetts
• No action
Michigan • State Board of Education voted to seek changes which would make it easier for the state to comply
with NCLB. • The Pontiac School district is a lead plaintiff in a case against the federal government on the grounds
NCLB is an unfunded mandate. NEA groups and school districts in Texas and Vermont have signed on.
Minnesota
• SF 1244 places conditions under which the state may continue implementing NCLB (referred to finance, 5/05).
• SF1245 amends NCLB per a task force’s recommendations (passed Senate, House version 1490 still in committee, 3/05).
• SF1092 asks Congress not to extend NCLB to high schools (passed Senate, now referred to Ed. Reform committee in House 3/05).
• HF 23 directs commissioner to seek waivers for ineffective aspects of NCLB (referred to Ed. Reform 1/05). *Senate version passed already
Mississippi
• HB 150 “School Testing Right to Know Act” to furnish the public and policymakers with accurate information with which to make decisions about the future of Mississippi’s education.
Missouri
• Asked for and received waiver on 04-05 AYP goals. Montana
• Superintendent McCulloch requested waivers due to the difficulty of implementing NCLB in rural areas (5/05).
Nebraska
• LR 23 introduced to Senate, asks Congress to fully fund NCLB or modify the act to meet budget constraints (1/05).
Nevada
• AB 562 gives state accountability system priority over NCLB where they conflict (passed House, currently in Senate).
• 2/05 State minority leader Reid called for Nevada to pull out of NCLB.
32

New Hampshire • Introduced HB786 (last action 1/04); prohibited using states funds to comply with NCLB—died in
committee.
New Jersey
• 6/05 State assembly voted to place NJ education goals ahead of NCLB (bill requires school officials give NJ goals precedence over federal mandates).
• 5/05 ACR236 endorses National Conference of States’ Legislatures recommendations for altering NCLB—encourages Congress to do the same.
• A267 (5/05) urged the Governor to follow Connecticut in filing a law suit against the federal government.
• S2528, A3993 direct local officials on implementing NCLB. • ACR142 (2/04) calls upon Congress to give more time to meet the highly qualified teacher standard. • Legislature has directed Attorney General to file suit if NCLB is deemed an unfunded mandate.
New Mexico
• HM 02 resolves that Congress should fully fund the mandate (passed 2/05). • SJM55 calls for a study of unfunded mandates (2/04). • HJM09 notes that additional costs to implement NCLB far outweigh additional federal funds (2/04). • SB513 (2/04) would have NM opt out of compliance with NCLB.
New York
• No action North Carolina
• No action North Dakota
• HB 1038 (would have established a state NCLB advisory committee), HB 1365 (allowing school districts to opt out of NCLB), HCR 3012 (redefined highly qualified teacher) failed to pass.
Ohio
• Senator Mark Dann introduced a resolution to follow Connecticut In suing the federal government (SCR 20, referred to Committee on Education, 9/05).
• SCR25 called for full funding and waivers from NCLB (3/04) – never left committee. Oklahoma
• HR1037 (3/04) passed to Congress asks for a waiver for high-achieving states. • HCR1052 (3/04) stalled in the Senate- calls upon Congressional delegation to alter NCLB.
Oregon • HB 2900 prohibits participation in NCLB if federal funds are not received (referred to Ways and
Means committee, 3/05). • HJM 27 urges Congress to provide full funding and requests waivers (Education committee, 3/05).
Pennsylvania
• Introduced 6/04 HR794 asks that Congress restore funding cuts. • Reading school district sued Pennsylvania’s department of Education on the grounds the district had
not been given enough resources to meet AYP goals. Rhode Island
• S3129 asked Congress to fully fund NCLB (passed in the Senate 5/04).
33

South Carolina • HCR4891 (HCR4889, SCR1031 are companion legislation) calls for amendments to NCLB, (last
action 3/04). South Dakota
• HCR1018 calls for full funding (2/04). Tennessee
• SJR694 (3/04) notes the state is burdened by funding NCLB. Texas
• As of 8/05 a second Texas school district is joining districts in Michigan and Vermont in filing suit against the federal government to relieve schools for paying for NCLB.
• State commissioner allowed state testing rule to take precedence over the requirements of NCLB. Utah
• HB 135 and HB 1001 allow state laws to trump provisions of NCLB on the grounds that the act violates section 9527 which prohibits state spending on federal mandates.
Vermont
• HB 59, SB 38 (introduced 1/05) orders state to withdraw participation in NCLB. • Leicester, Neshobe, Otter Valley, Rutland Northeast Supervisory Union, Pittsford Town, Sudbury
Town, and Whiting Town districts joined with the NEA and districts in Texas and Michigan. • HJR37 (in committee as of 4/05) would support the plaintiffs in a lawsuit related to funding for the No
Child Left Behind Act of 2001. • Orleans southwest, Southwest Vermont, and Windham Northeast are reallocating Title 1 funds so
certain schools are not subject to AYP provisions. Virginia
• HB 1592, HB2602, HB2685, HJR 561, HJR 576, HJR 708, SB 948, SB1136, SJR 437: direct Board of Education to seek waivers from NCLB or urge Congress and the administration to grant waivers to states that maintain high academic standards.
Washington • SJM 8001 requests full funding for NCLB (in the Rules Committee 4/05). *House’s corollary legislation
is HJM4010 West Virginia • SCR32 passed Senate 2/04. It outlines the difficulties of implementing NCLB. • HR6 asks Congress to pass waivers for states like West Virginia that show academic improvement.
Wisconsin
• 5/04 Attorney General Peggy Lautenschlager released an opinion letter on the constitutionality and appropriateness of the mandates and funding levels inherit in NCLB.
• State Senate introduced SR33 which urges the state not to appropriate state funds for implementing NCLB (last action 3/04).
• SR19 asks for full funding (last action 3/04). • SR32 asks for delegation to procure more money to implement NCLB (was adopted in the Senate).
Wyoming
• HJR06 notes the impact of NCLB on the state of Wyoming (last action 3/04). • HB127 would have prohibited state participation in NCLB (Died without being heard).
34
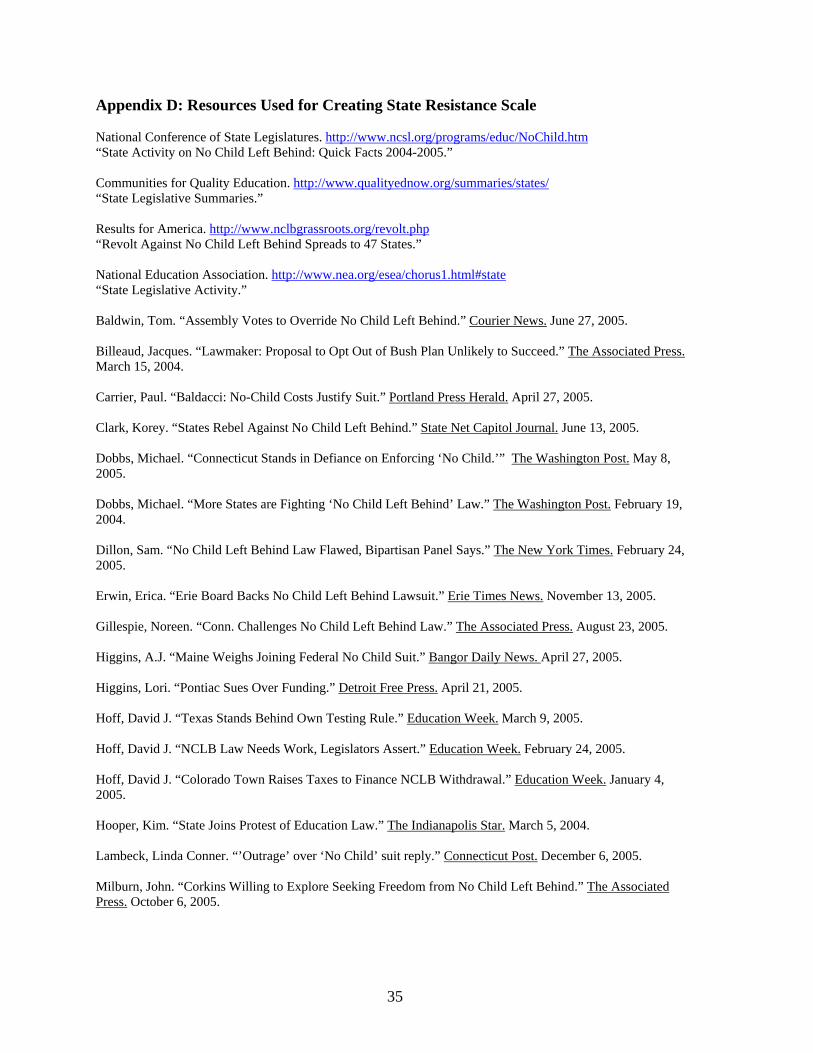
Appendix D: Resources Used for Creating State Resistance Scale National Conference of State Legislatures. http://www.ncsl.org/programs/educ/NoChild.htm“State Activity on No Child Left Behind: Quick Facts 2004-2005.” Communities for Quality Education. http://www.qualityednow.org/summaries/states/“State Legislative Summaries.” Results for America. http://www.nclbgrassroots.org/revolt.php“Revolt Against No Child Left Behind Spreads to 47 States.” National Education Association. http://www.nea.org/esea/chorus1.html#state“State Legislative Activity.” Baldwin, Tom. “Assembly Votes to Override No Child Left Behind.” Courier News. June 27, 2005. Billeaud, Jacques. “Lawmaker: Proposal to Opt Out of Bush Plan Unlikely to Succeed.” The Associated Press. March 15, 2004. Carrier, Paul. “Baldacci: No-Child Costs Justify Suit.” Portland Press Herald. April 27, 2005. Clark, Korey. “States Rebel Against No Child Left Behind.” State Net Capitol Journal. June 13, 2005. Dobbs, Michael. “Connecticut Stands in Defiance on Enforcing ‘No Child.’” The Washington Post. May 8, 2005. Dobbs, Michael. “More States are Fighting ‘No Child Left Behind’ Law.” The Washington Post. February 19, 2004. Dillon, Sam. “No Child Left Behind Law Flawed, Bipartisan Panel Says.” The New York Times. February 24, 2005. Erwin, Erica. “Erie Board Backs No Child Left Behind Lawsuit.” Erie Times News. November 13, 2005. Gillespie, Noreen. “Conn. Challenges No Child Left Behind Law.” The Associated Press. August 23, 2005. Higgins, A.J. “Maine Weighs Joining Federal No Child Suit.” Bangor Daily News. April 27, 2005. Higgins, Lori. “Pontiac Sues Over Funding.” Detroit Free Press. April 21, 2005. Hoff, David J. “Texas Stands Behind Own Testing Rule.” Education Week. March 9, 2005. Hoff, David J. “NCLB Law Needs Work, Legislators Assert.” Education Week. February 24, 2005. Hoff, David J. “Colorado Town Raises Taxes to Finance NCLB Withdrawal.” Education Week. January 4, 2005. Hooper, Kim. “State Joins Protest of Education Law.” The Indianapolis Star. March 5, 2004. Lambeck, Linda Conner. “’Outrage’ over ‘No Child’ suit reply.” Connecticut Post. December 6, 2005. Milburn, John. “Corkins Willing to Explore Seeking Freedom from No Child Left Behind.” The Associated Press. October 6, 2005.
35

Okoben, Janet. “Lawmaker Introduces Resolution to Sue Over No Child Left Behind.” Cleveland Plain Dealer. September 13, 2005. Olson, Lynn. “Requests Win More Leeway Under NCLB.” Education Week. July 13, 2005. Olson, Lynn. “Virginia Gets First-Ever Waiver to Reverse Order of NCLB Sanctions.” Education Week. PR Newswire. “State Education Officials Tell National Leaders—‘States Need Full Funding For Special Education and More Flexibility in No Child Behind Reforms.’” March 18, 2004. Ravitz, Jessica. “Utahns Cheer as Guv Signs NCLB Protest.” Salt Lake Tribune. May 11, 2005. Ripley, Amanda and Sonja Steptoe. “Inside the Revolt Over Bush’s School Rules.” Time Magazine. May 9, 2005. Sykes, Shinika. “Utah Called Education ‘Whipping Boy.’” Salt Lake Tribune. September 30, 2005. Toomer-Cook, Jennifer. “Utahns Give NCLB the Cold Shoulder.” Deseret Morning News. April 20, 2005. Welsh, John. “Senate Panel Snubs ‘No Child Left Behind' Bill Exempts State from the Rules of Federal Act.” Saint Paul Pioneer Press. February 18, 2004. Weyer, Jake. “Entenza Calls for End to Federal ‘No Child’ Act.” Duluth News Tribune. September 7, 2005.
36

1 ETS, Ready for the Real World? Americans Speak on Highschool Reform. (June 2005). Available online at: http://www.ets.org/Media/Education_Topics/pdf/2005highschoolreform.pdf 2 Phi Delta Kappan, The 37th Annual Phi Delta Kappa/Gallup Poll Of the Public's Attitudes Toward the Public Schools, (September 2005). Available online at: http://www.pdkintl.org/kappan/kpollpdf.htm3 The question in 2001 asked about "the President's plan." 4 Data provided by Peter Hart Associates on behalf of ETS. 5 Americans for Better Education, Americans for Better Education Survey on No Child Left Behind (January 2004). Available online at: http://www.bettered.org/1081/ 6 Results for America. Poll of Parents on “No Child Left Behind” Summary of Survey Findings. (Prepared by Opinion Research Corporation) 2004. Available online at: http://www.resultsforamerica.org/education/ 7 2005 Kappan Poll. 8 Daniel Elazar. American Federalism: A View From the States. (New York: Thomas Crowell Company, 1966). 9 Cibulka, 1996. Also see Sunderman, 2003. Implementing a Major Education Reform, No Child Left Behind and Federal-State Relations, First Impressions (working draft). Prepared for the Annual Meeting of the American Education Research Association. 10 Fusarelli observes, "Though legitimate, many of the objections and political posturing about states' rights and unfunded federal mandates appear to be little more than negotiating tactics to force compromise on NCLB." Page 131. 11 Gail Sunderman and James Kim. “The Expansion of Federal Power and the Politics of Implementing the No Child Left Behind Act.” The Teacher’s College Record. November 3, 2005. http://www.tcrecord.org ID Number: 12227. 12 Lisa Dotterweich and Ramona McNeal. “State Compliance and the No Child Left Behind Act.” Prepared for delivery at the 2004 Annual Meeting of the Midwest Political Science Association. 2004 13 Paul Manna. “Management, Control, and the Challenge of Leaving No Child Behind.” Presented at the 2004 Annual Meeting of the Midwest Political Science Association, 2004. 14 William Wanker and Kathy Christie. “State Implementation of the No Child Left Behind Act.” The Peabody Journal of Education, vol. 80, no. 2. pp.57-72. 15 Kathryn McDermott and Laura Jensen, 2005. “Dubious Sovereignty: Federal Conditions of Aid and the No Child Left Behind Act. The Peabody Journal of Education, vol. 80, no. 2, pp. 39-56. 16 Quality Counts at 10: A Decade of Standards-Based Education, Vol 25, Issue 27. 17 A list of state resistance can be found in Appendix C and sources of information in Appendix D. 18 William Mathis, Kevin Fleming, and Wendy Lecker. “The NCLB Rebellion: Money, Politics, and Student Learning.” Presented at the American Education Finance Association’s Annual Meeting, 2005. 19 Terry M. Moe, Schools, Vouchers, and the American Public, Washington DC: Brookings Press, 2001. 20 The Jim Lehrer Newshour, April 7, 2005. In an editorial for the Washington Post, Spellings wrote, "Annual assessments are nonnegotiable, because what gets measured gets done. This is at the heart of accountability. The data must also be reported by student group—African Americas, Hispanics, those with special needs, etc. – so that those who need the most help aren’t hidden behind state or district-wide averages. Some states have asked for waivers from the law. Some have sought to exempt whole grades or student groups from annual assessments. Others have sought to keep some students’ test scores under wraps. That is simply unacceptable. It undermines the very purpose of the law. Perhaps not coincidentally, some of these same states have the largest achievement gaps in the nation, with minority students lagging dozens of points—whole years really—behind their white peers.” The Washington Post, April 2, 2005. 21 Avi Salzman. “NAACP is Bush Ally in School Suit Versus State.” The New York Times. Feburary 1, 2006. 22 Mary Ann Zehr. “Bilingual Educators Ratchet Up Criticism of No Child Left Behind.” Education Week, February 2, 2005. 23 Karla Reid Scooner. “Civil Rights Groups Split Over NCLB.” Education Week, August 31, 2005. 24 Quality Counts 2006, p. 10. 25 Digest of Educational Statistics, 2004, Table 154. 26 "U.S. to Pilot New Gauge of 'Growth,'" Lynn Olsen and David J. Hoff, Education Week, November 30, 2005.
37