Embed Size (px)
Citation preview

WPGA Conference 2017
The Pecan Industry in Chihuahua, Mexico: Challenges and Successes
Dr. Julio López-DíazUniversidad Autónoma de Chihuahua
Dr. Esteban Herrera NMSU Professor Emeritus

Acknowledgements
• M.S. Víctor Esparza
NMSU alumnus & President of the Mexican Pecan System-
Product Committee (COMENUEZ)
2

Today’s Talk• PecanIndustry´s Overview:
o National andChihuahuaState Levels
• Topics:o Productiono Internationaltradeo AcreageoMarket andmarketingo Tendencieso Challenges andSuccesses
3
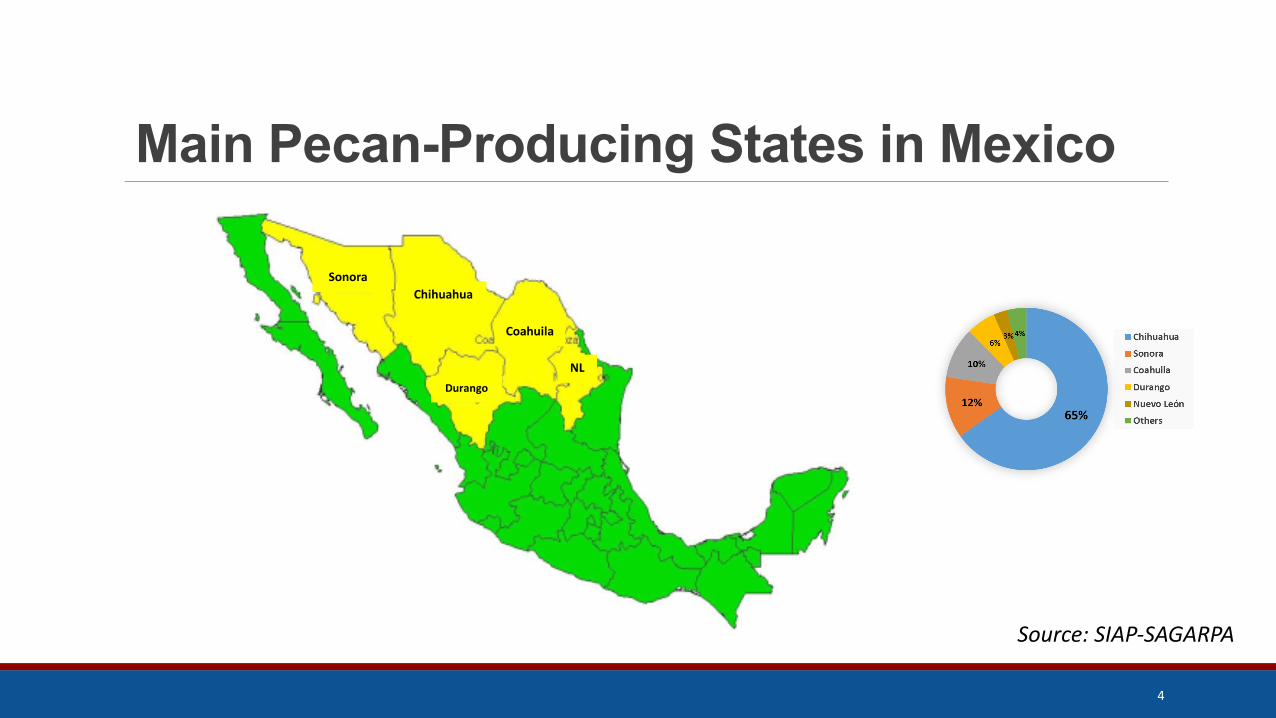
Main Pecan-Producing States in Mexico
SonoraChihuahua
Durango
Coahuila
NL
Source:SIAP-SAGARPA
4

Mexican Pecan Growers: How are they organized?
National Level
State Level
LocalLevelRegionalAssociations
5

Mexico’s Pecan Production (MT)
0
20,000
40,000
60,000
80,000
100,000
120,000
140,000
2000 2001 2002 2003 2004 2005 2006 2007 2008 2009 2010 2011 2012 2013 2014 2015
125,758 122,714
1,000 lbs
2014– 277,246
2015 – 270,535
Source:SIAP-SAGARPA
MT
6

Production by State
State Production 2015 (MT)
Chihuahua 79,934Sonora 15,028Coahuila 12,509Durango 7,143Nuevo León 3,354Others 4,746
122,714
65%12%
10%
6%3%4% Chihuahua
Sonora
Coahuila
Durango
NuevoLeón
Others
Source:SIAP-SAGARPA
7

Pecan Hectares in Mexico
0
20,000
40,000
60,000
80,000
100,000
120,000
2000 2001 2002 2003 2004 2005 2006 2007 2008 2009 2010 2011 2012 2013 2014 2015
50,47851,82351,622
63,69665,68568,383
74,21277,58280,048
84,50988,055
92,21898,071
104,371108,012
112,622
2000- 2015
Year 2015112,622Has
Source:SIAP-SAGARPASup.Sembrada(Has)
8

MX´s Production and Hectares
0
20,000
40,000
60,000
80,000
100,000
120,000
140,000
2000 2001 2002 2003 2004 2005 2006 2007 2008 2009 2010 2011 2012 2013 2014 2015
2000- 2015
Year 2015
122,714 MT
112,622Has
Source:SIAP-SAGARPASup.Sembrada(Has) Producción(Ton)
9

New Plantings in Mexico
Avg. Increase per Year4,267 Has
Estimated tobe5,000– 7,000Has
2,698
5,829
3,370
2,466
4,461
3,546
4,163
5,8536,300
3,641
4,611
0
1,000
2,000
3,000
4,000
5,000
6,000
7,000He
ctares
Source:SIAP-SAGARPA2005 2006 2007 2008 2009 2010 2011 2012 2013 2014 2015
10

International Trade Mexico-USA
-
20,000
40,000
60,000
80,000
100,000
120,000
21,69622,04520,87024,50623,98326,187 29,087
87,66291,231
67,45670,474
79,750
102,118
95,384Metric
Tons
IMPORTACIONES
EXPORTACIONES
Source:SIAVI
ImportsExports
=78%ofTotalProductionMT
MT
2009 2010 2011 2012 2013 2014 2015
11

Exports from Mexico to USA
-
20,000
40,000
60,000
80,000
100,000
120,000
2009 2010 2011 2012 2013 2014 2015SINCASCARA 46,646 71,777 42,868 45,147 56,213 69,567 60,480CONCASCARA 41,016 19,454 24,587 25,327 23,537 32,551 34,904
MetricTons
Total 201595, 384 MT
78% of Mexico’sProduction
Source:SIAVIandCOMENUEZ
In-Shell
Shelled
12

Mexican Exports to China
0
1,000
2,000
3,000
4,000
5,000
6,000
7,000
2007 2008 2009 2010 2011 2012 2013 2014 2015
326620
6,932
1,391
3,316 3,141 3,337
4,092
5,579
Metric
Tons
MT=4.54%ofTotalProduction
13

Mexico and China► Sonora State: currently the biggest
exporter to China (in-shell nuts).
► Smaller trade operations fromother Mexican states. Chihuahuacould be in the future a majorplayer in exporting to China. 2016
China in Mexico:• 28 Buyers representing 14 Companies• Import Tax lowered: 25 to 10%
http://www.sagarpa.gob.mx/Delegaciones/distritofederal/boletines/Paginas/JAC0236-29.aspx
14

0
10,000
20,000
30,000
40,000
50,000
60,000
70,000
2011 2012 2013 2014 2015
45,773
64,637
49,775 49,48056,417
Tons
Source:SIAVI
Apparent ConsumptionProduction
plus Importsminus Exports
Avg.Apparent Consumption53,216MT
2007 2008 2009 2010
Pecan Apparent Consumption in Mexico
15

Per Capita Consumption in Mexico(2014)
Source:COMENUEZ
gr
Pecan Almonds Macadamia Pine nut Pistachio Hazelnuts Chestnuts
Year 2014
26,132 MT
16

Pecan Industry in Chihuahua
17

Pecan Production in Chihuahua
-
10,000
20,000
30,000
40,000
50,000
60,000
70,000
80,000
2000 2001 2002 2003 2004 2005 2006 2007 2008 2009 2010 2011 2012 2013 2014 2015
66,302
79,934
Metric
Tons
CHIHUAHUA
COAHUILA
SONORA
Source:SIAP-SAGARPA
MT
18

Pecan-producing RegionsYear 2014
-
2,000
4,000
6,000
8,000
10,000
12,000
14,000
16,000
18,00016,025
10,453
4,6034,3384,1883,8983,7183,3413,1172,8282,8652,3972,189
MetricTons
Source:COMENUEZ
19

Pecan Production Forecasting
Source:COMENUEZ
Met
ricTo
ns
§ Chihuahua could reach aproduction as high as150,000 MT by 2025.
20

Chih’s Pecan Hectares
38,44540,590
42,68544,656
47,10348,53551,38953,029
55,119
60,25064,049 66,302
16,242
11,586
-
10,000
20,000
30,000
40,000
50,000
60,000
70,000
2000 2001 2002 2003 2004 2005 2006 2007 2008 2009 2010 2011 2012 2013 2014
CHIHUAHUA
COAHUILA
SONORA
For 2016estimated
70% production30% development
Source:SIAP-SAGARPA
AVG. Increase per Year2,532 Hasestimated
3,000 – 5,000 Has
Yr 201568, 823 Has
21

Price-per-Point in Chihuahua(2001 – 2016)
1.43
2.05 2.20
3.803.38
3.15 3.102.75 2.84
4.955.19
3.043.35
3.594.08
5.03
0.00
1.00
2.00
3.00
4.00
5.00
6.00
2001 2002 2003 2004 2005 2006 2007 2008 2009 2010 2011 2012 2013 2014 2015 2016
Dollars
Year
Price-per-Point• Source: COMENUEZ and Pecan Growers
• Estimated Average Price
• Price Fluctuation 2016 - 2017:4.20 – 5.65 USD
• Feb 17th‘s Price : $ 4.20, Pecans 54% Meat
22

Price per Kg in Chihuahua(2001 – 2016)
17.1525.30
30.01
54.92
44.0438.9140.00
48.4744.45
70.20
84.82
46.1550.36
60.59
82.00
123.14
0.00
20.00
40.00
60.00
80.00
100.00
120.00
140.00
2001 2002 2003 2004 2005 2006 2007 2008 2009 2010 2011 2012 2013 2014 2015 2016
Price(Pesos/Kg)
23
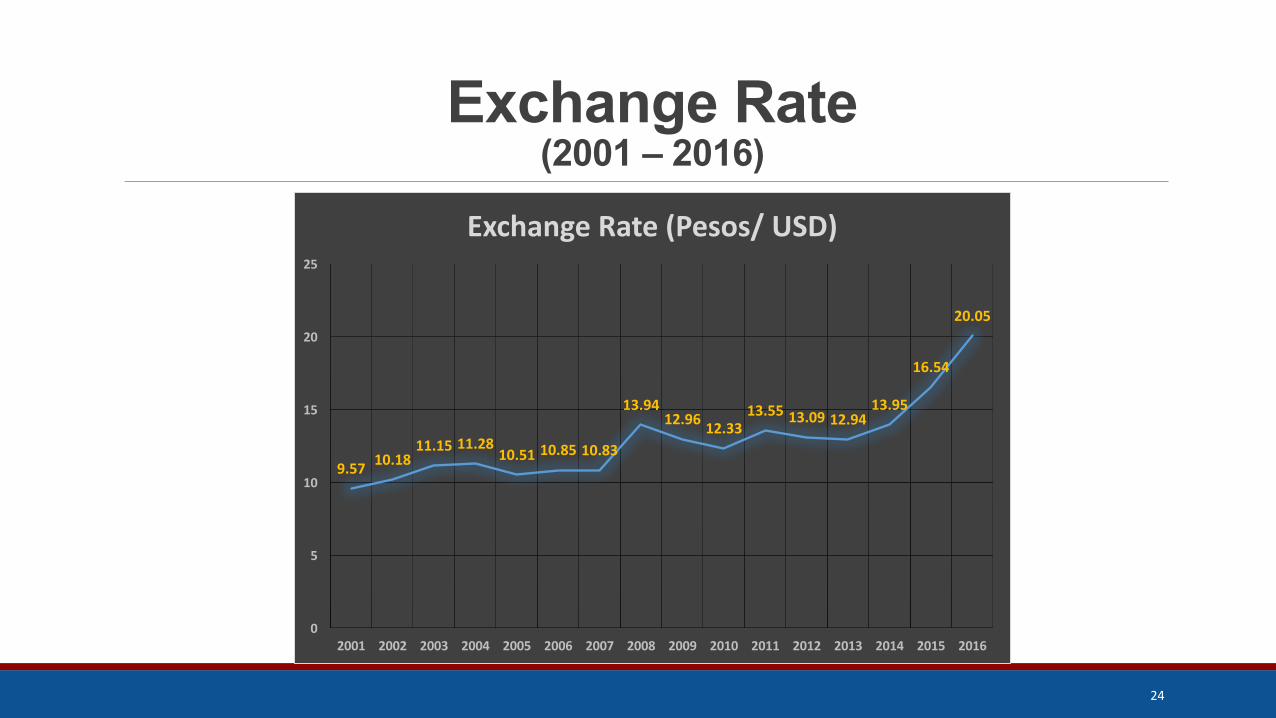
Exchange Rate(2001 – 2016)
9.57 10.1811.15 11.28
10.51 10.85 10.83
13.9412.96 12.33
13.55 13.09 12.9413.95
16.54
20.05
0
5
10
15
20
25
2001 2002 2003 2004 2005 2006 2007 2008 2009 2010 2011 2012 2013 2014 2015 2016
ExchangeRate (Pesos/USD)
24

Challenges and Successes
25
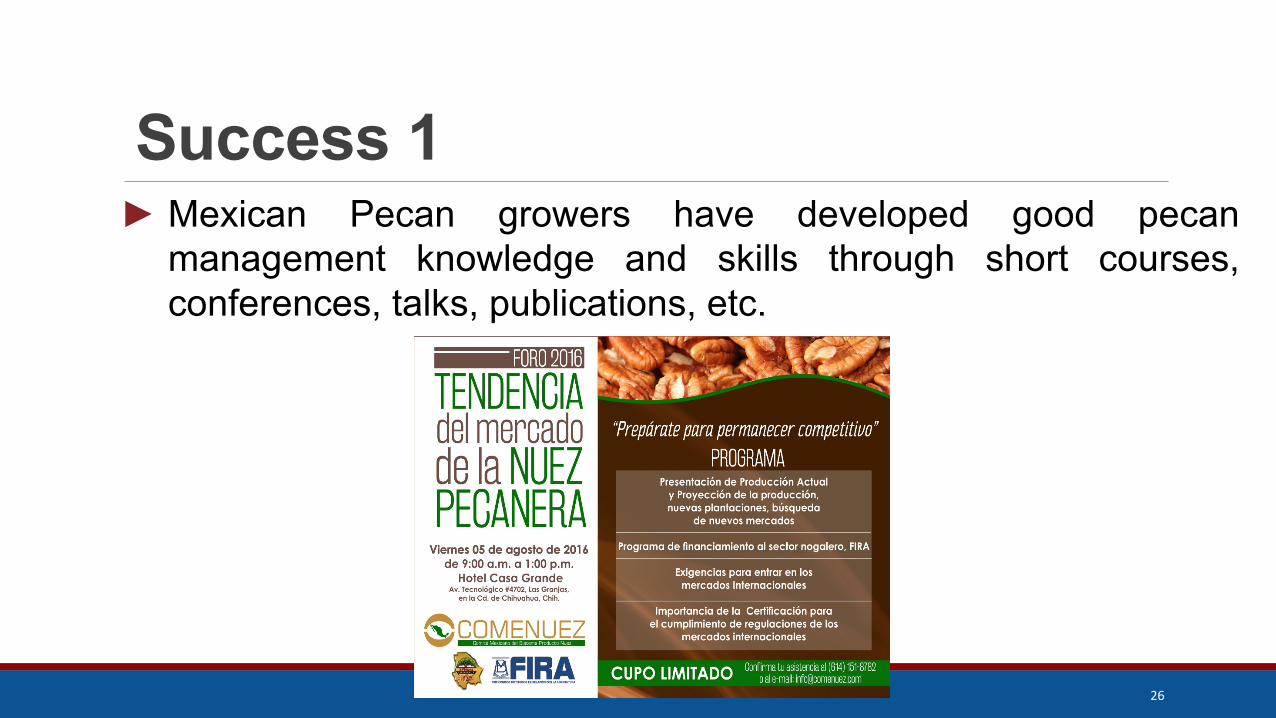
Success 1► Mexican Pecan growers have developed good pecan
management knowledge and skills through short courses,conferences, talks, publications, etc.
26

Success 2► Good growers’ organizations.
27

Success 3► Plenty of orchard management information available:
magazines, Facebook, webpages, etc.
28
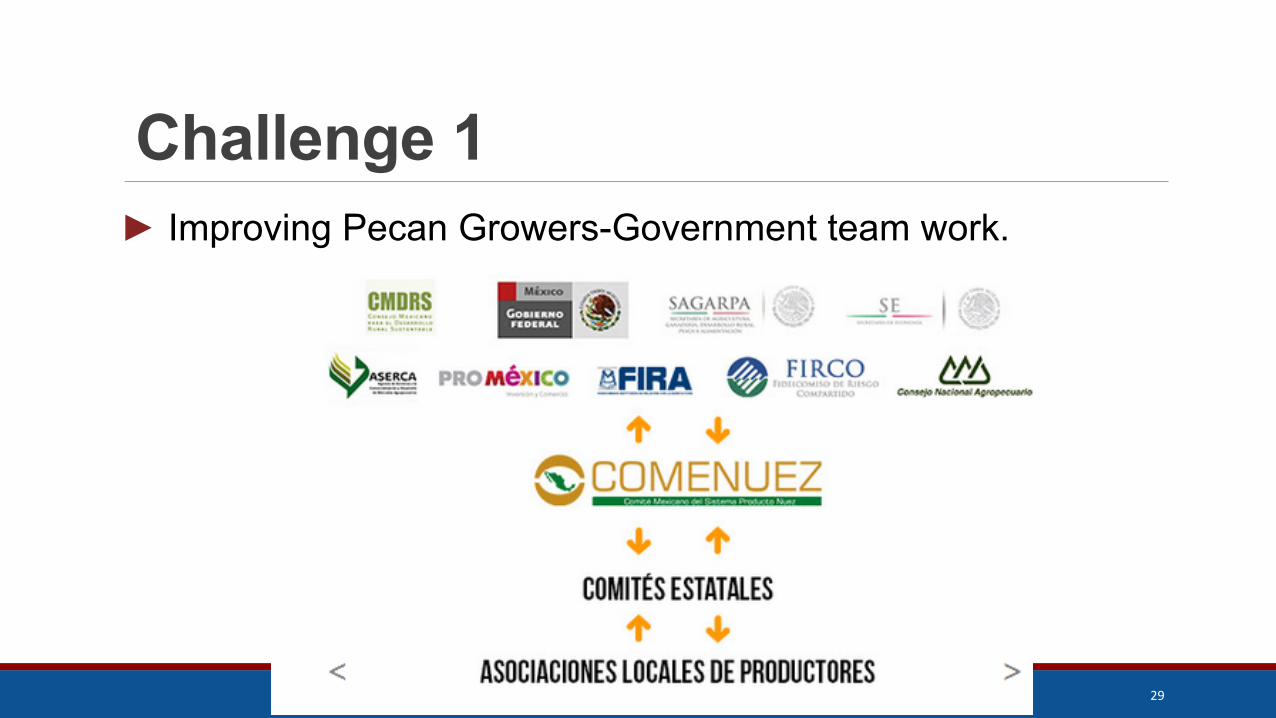
Challenge 1► Improving Pecan Growers-Government team work.
29

Challenge 2►Need of accurate, reliable data of pecan industry.
30

Challenge 3►New Markets: Asia and Europe.
31

Challenge 3►Participating in Food & Trade Fairs.
32

Challenge 4►Consolidation of domestic market.
Current pecan pricesrepresent the mainfactor to increasingconsumption.
33

U.S. International Trade in goods and services
MEXICO“In 2015, U.S. exports of goods and services to Mexico were $267.3 billion, down 1.4%from 2014, and imports from Mexico were $325.3 billion, up 0.7% from 2014. As a result,the trade deficit with Mexico increased to $57.9 billion.”
“In 2015, exports to Mexico accounted for 11.8% of total U.S. exports, and imports fromMexico accounted for 11.8% of total U.S. imports. Exports were led by capital goods(excluding automotive), which accounted for 31.2% of U.S. exports to Mexico, andimports were led by automotive vehicles, parts, and engines, which accounted for 32.7%of U.S. imports from Mexico.”
“Who owns the automotive companies?”34

U.S. International Trade in goods and services
“Consumer Products and Autos Drive the U.S. Trade Deficit”
MEXICO
35https://www.bea.gov/international/factsheet/factsheet.cfm?Area=213

U.S. International Trade in goods and servicesDirect Investment of Multinational Enterprises in Mexico
36https://www.bea.gov/international/factsheet/factsheet.cfm?Area=213
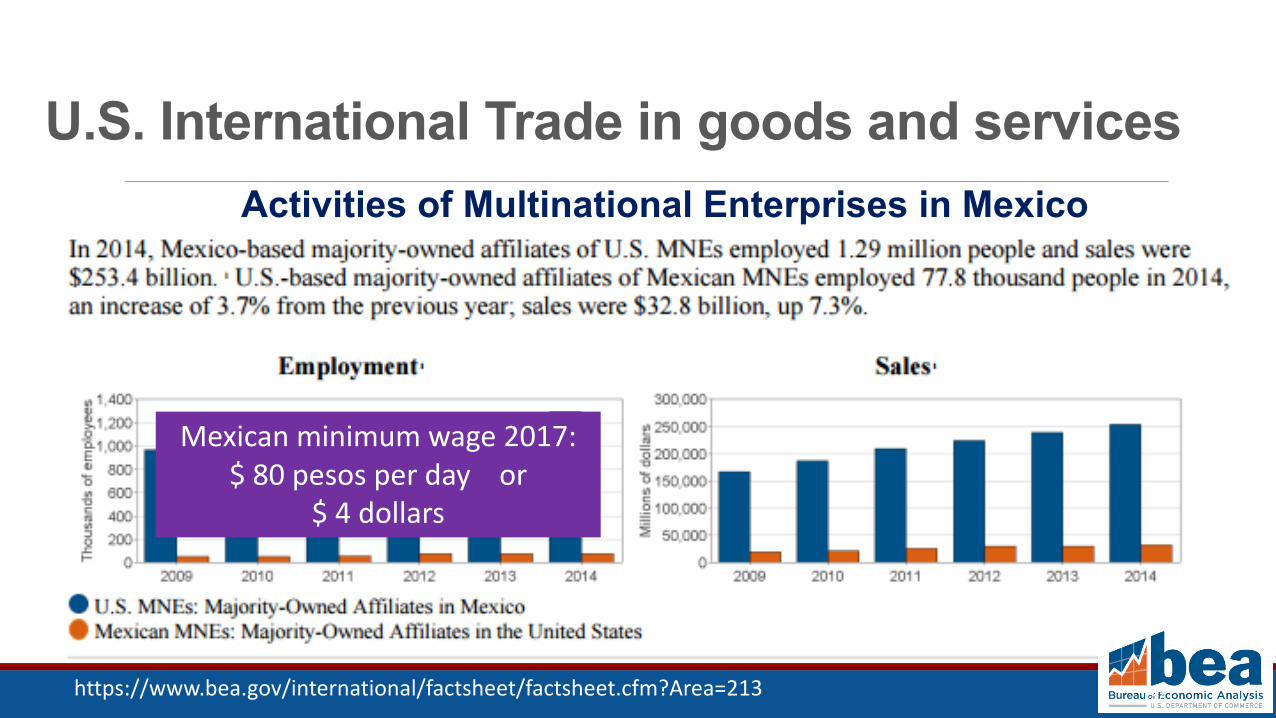
U.S. International Trade in goods and servicesActivities of Multinational Enterprises in Mexico
Mexican minimum wage 2017:$80pesosperday or
$4dollars
37https://www.bea.gov/international/factsheet/factsheet.cfm?Area=213

U.S. Trade in goods with…(Millions of U.S. dollars)
ChinaDeficit:5.49moretimesthanMexico
Exports Imports Balance
Year2016
China 115,775.1 462,813.0 - 347,037.9Japan 63,264.3 132,201.8 - 68,937.6Mexico 230,959.1 294,151.0 - 63,191.9
https://www.census.gov/foreign-trade/balance/index.html Source:
38

Challenge 5►USA New Administration Policies: NAFTA?
39

Challenge 5►USA New Administration Policies: NAFTA?
40

Challenge 5►USA New Administration Policies: NAFTA?
41

WPGA Conference2017
The Pecan Industry in Chihuahua, Mexico: Challenges and Successes…And maybe fears?
Thank you!Dr. Julio López-Díaz
Universidad Autónoma de [email protected]
Dr. Esteban Herrera NMSU Professor Emeritus