Embed Size (px)
Citation preview

Covid-19 Analysis Series
No.020 March 2021
The pandemic and the housing market: a British story
Paul Cheshire Christian HilberOlivier Schöni

Centre for Economic Performance London School of Economics and Political Science
Houghton Street, London WC2A 2AE, UK Tel: +44 (0)20 7955 7673
Email: [email protected] Web: http://cep.lse.ac.uk
The pandemic and the housing market: a British story
CEP COVID-19 ANALYSIS
Paul Cheshire, Christian Hilber and Olivier Schöni
March 2021 Summary
• House prices fell sharply after the onset of COVID-19 but quickly recovered, reaching a new recordpeak by November 2020. These increases were probably mainly driven by the policies introducedearly on to support businesses, household incomes and the housing market. These boosts to demandinteracted with the decades-long under supply of housing – exacerbated by even worse than usualconstruction levels in Q2 2020.
• Focusing on the wider London region, house prices increased for detached, semi-detached andterraced houses but fell for flats and maisonettes, reflecting increased demand for living and work-from-home space.
• Counter to conventional wisdom, house price increases for detached and semi-detached houses weremuch stronger close to the centre of London. This might be driven by a post-pandemic stretching ofthe income distribution, giving even more market power to the richest to buy larger houses in centralLondon. But the number of these houses transacted was small.
• House prices also increased significantly for detached and semi-detached houses some 20 to 40kmsfrom the centre of London.
• The effects of COVID-19 on the rental market were different. Renters living in central areas of citieswere hardest hit by the pandemic, so rents fell most strongly there but in the outer areas they grewsubstantially.
• Increasing demand for detached houses with more garden space is a long term trend, significantly pre-dating the onset of COVID-19. Because housing and land is so expensive close to the centre, detachedhouses with larger gardens are being built further and further out, increasingly beyond the greenbelt.
• Policies such as the Stamp Duty holiday or the mortgage guarantee scheme may stimulate the housingmarket during the pandemic, propping up house prices, especially in Greater London and the SouthEast, where housing supply is so severely constrained. But ending such temporary measures carriesthe risk of reinforcing the downturn that we think must follow at some point. Such measures are pro-cyclical rather than stabilising.
• History and urban economics tell us that the long-term outlook for cities is good. There will eventuallybe an urban revival: London recovered from the far worse plague pandemic of 1665. Urban form willlikely evolve, stimulated by COVID-19 induced innovations. However, in the long-run, unless theBritish planning system becomes less restrictive, housing will remain unaffordable and increasinglyso.

1
1. Introduction
The British care very much about what happens in housing markets. Older house owners care because so much of their personal assets are tied up in housing: the young care because they feel left behind and are increasingly desperate to be able to afford decent homes. We have explored the reasons for this and its effects in numerous blogs (Cheshire, 2013; Hilber and Schöni, 2016; Hilber, 2016a and b; Cheshire et al., 2018; Cheshire, 2019; Cheshire, 2020) and research papers (Cheshire, 2009; Hilber and Vermeulen, 2016; Cheshire and Hilber, 2019; Hilber and Mense, 2021).
Back in April 2020 two of us wrote a blog anticipating the impact of the COVID-19 pandemic on the British housing market. Nearly a year has passed and the COVID-19 pandemic is still with us. Some of the points we made there have turned out to be pretty accurate – for example the extent, duration and periodic nature of the pandemic together with likely mortality. In the economic sphere our anticipation of a very serious impact on government debt and output proved accurate. Some predictions were less accurate, especially a sharp, short term fall in house prices, caused by a sharp fall in incomes and rise in unemployment. Here we did not take into account the, as then unannounced, government actions not just to prop up incomes – most obviously through the Furlough scheme (still with us and just extended until end of September 2021) – but also specific actions directed to propping up the housing market: a Stamp Duty Land Tax (SDLT) holiday to boost transactions (just extended till end of June 2021), a mortgage payment holiday for the worst affected and, for the rental sector, a stay on evictions.
There are two other judgements we would stick to. The first is the need to analyse the pandemic’s impacts over different time horizons: 1) the short term - over the next 6 to 9 months; 2) the medium term – up to about 2025; and 3) the long term – over the next ten-plus years.
As we emphasised before, so now: the further ahead one looks the more uncertainty attaches to any predictions. As with previous pandemics, such as the Spanish Flu which started in early 1918, there have been periods of remission and false dawns, now third waves. A key difference between the Spanish Flu and the COVID-19 pandemic is, that unlike the 1920s, in the 2020s there is hope triggered by a vaccine. A problem here is the possibly greater ability of the COVID-19 virus to mutate and become less susceptible to the currently available vaccines. Another key difference is the lower willingness of society now, compared to a hundred years ago, to tolerate risks. Independently of differences in the lethality of the COVID-19 virus compared to the Spanish Flu, the result is that deaths have been far lower than with the Spanish Flu but economic disruption far greater as societies have gone into periods of confinement and whole swathes of economic activity have been closed.1
The second point we made, is as relevant now as a year ago: not to be misled by the immediate and medium term effects of the pandemic. The short run is likely to be very different to the
1 The Spanish flu is estimated to have infected 500 million people worldwide. Estimates of the number of deaths range from 17.4 to 100 million, with the consensus estimate being around 50 million (Terry 2020). COVID-19 is estimated to have killed 2.5 million people to date, with the total number of confirmed cases being around 116 million (BBC News, 5 March 2021).

2
long run. Although echoes of the pandemic may continue to influence housing markets for years to come, the advantages of cities are not going to evaporate. Those advantages – both for production and for welfare depend on scale, density and proximity generating agglomeration economies. Cities have demonstrated their advantages over 12,000 or more years. Short term search for distancing and space during the pandemic will not continue unaltered. People fled London during the plague of 1665: they came back.
One of the things we anticipated in April 2020 – before most other commentators – was the reaction to office closures and fear of packed commuting. Our expectation was that this would lead to an increase in the demand for home working with the implications that has for space inside the home. Like most, we thought in the short, even medium term, this would lead to a degree of movement out of packed cities – perhaps with an increase in demand for very small living spaces in central cities to support 2 or 3 days a week in the office. This implied long distance moves, jumping the Green Belt and longer, less frequent, commutes. It also implied a fall in demand for (so price of) centrally located, smaller houses compared to larger houses in the outer suburbs or ex-urbs. It equally suggested a sharp fall in the use of public transport and surplus office space in city centres.
Although this has become a kind of conventional wisdom, with headlines such as The Race for Space and a hyping up of the demand for large country houses in the Cotswolds (Guardian, Dec, 2020) further reflection, and now evidence of what has actually happened in the housing market over the past year, has led to significant changes to our judgements. Partly these changes have been driven by government actions to prop up the housing market, delaying the downward correction in prices, personal incomes and the economy. This change in emphasis, however is also partly because as we, of all people, should know, in Britain one can never underestimate the impact of planning policies on house prices. We explore this below and look at some of the preliminary evidence.
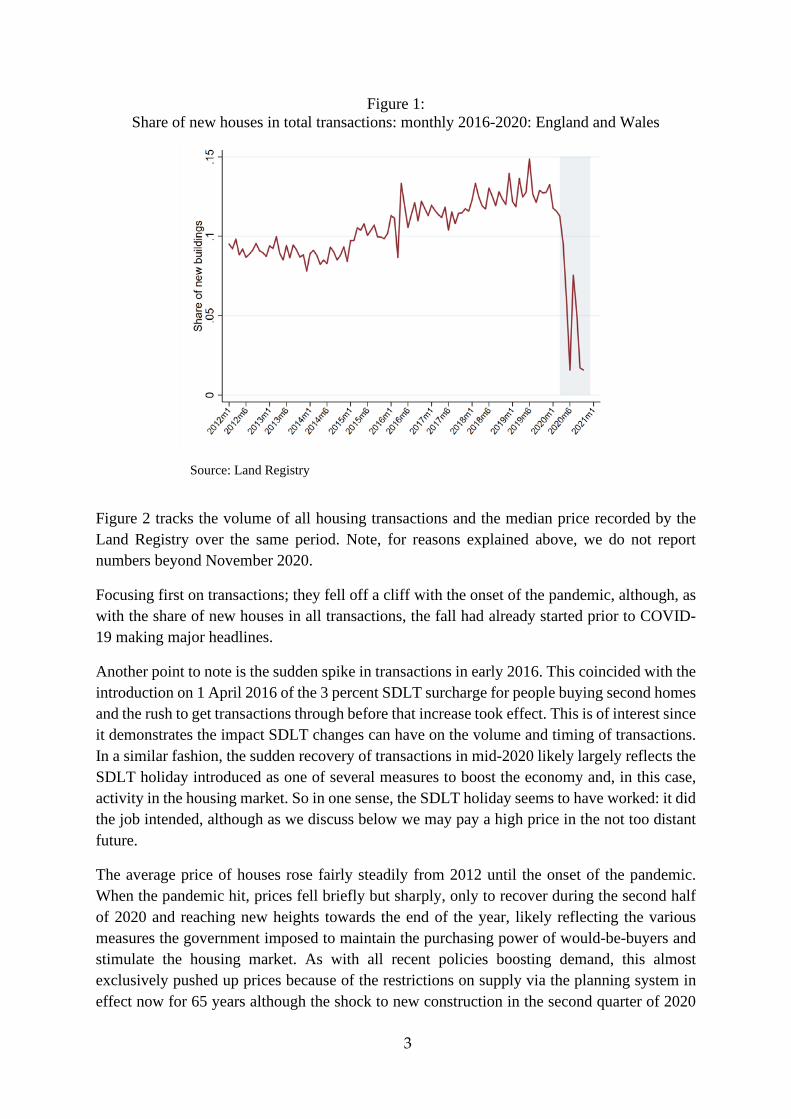
2. So what’s happened so far with transactions, prices and rents? 2.1. The owner-occupied market Housing transactions and prices The most striking result of the onset of the pandemic was an almost total halt to activity in newly constructed houses: housing completions fell from 46,000 in the second quarter of 2019 to 16,000 in the corresponding quarter of 2020. Figure 1 shows the share of newly constructed houses in all transactions recorded by the Land Registry from 2012 until late 2020. It does not include numbers for November and December 2020 because even at the end of February 2021 records were still very incomplete for those months.
The share of newly built houses in total transactions slowly grew from 2016 as construction nudged upwards from its low after the financial crisis until it reached a peak of some 15 percent of all transactions in mid- 2019. The share of newly built houses was already falling as we entered 2020 but when the COVID-19 pandemic struck, it fell off a cliff.
3
Figure 1: Share of new houses in total transactions: monthly 2016-2020: England and Wales
Source: Land Registry
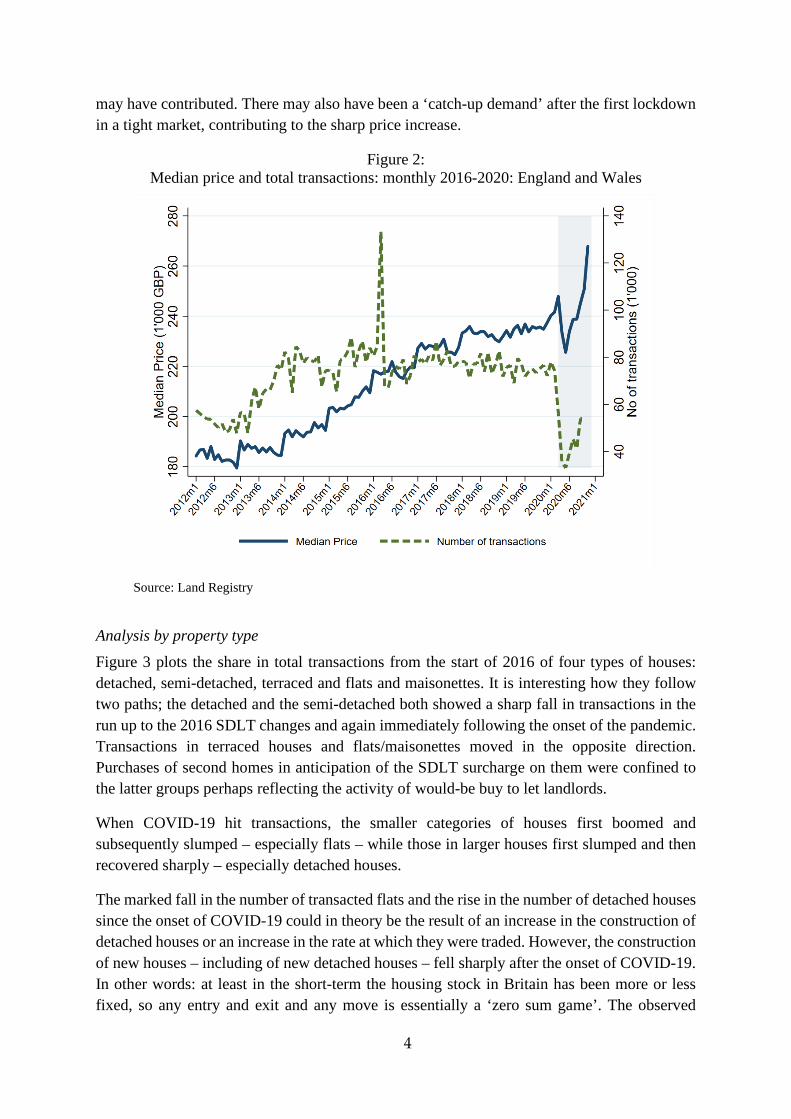
Figure 2 tracks the volume of all housing transactions and the median price recorded by the Land Registry over the same period. Note, for reasons explained above, we do not report numbers beyond November 2020.
Focusing first on transactions; they fell off a cliff with the onset of the pandemic, although, as with the share of new houses in all transactions, the fall had already started prior to COVID-19 making major headlines.
Another point to note is the sudden spike in transactions in early 2016. This coincided with the introduction on 1 April 2016 of the 3 percent SDLT surcharge for people buying second homes and the rush to get transactions through before that increase took effect. This is of interest since it demonstrates the impact SDLT changes can have on the volume and timing of transactions. In a similar fashion, the sudden recovery of transactions in mid-2020 likely largely reflects the SDLT holiday introduced as one of several measures to boost the economy and, in this case, activity in the housing market. So in one sense, the SDLT holiday seems to have worked: it did the job intended, although as we discuss below we may pay a high price in the not too distant future.
The average price of houses rose fairly steadily from 2012 until the onset of the pandemic. When the pandemic hit, prices fell briefly but sharply, only to recover during the second half of 2020 and reaching new heights towards the end of the year, likely reflecting the various measures the government imposed to maintain the purchasing power of would-be-buyers and stimulate the housing market. As with all recent policies boosting demand, this almost exclusively pushed up prices because of the restrictions on supply via the planning system in effect now for 65 years although the shock to new construction in the second quarter of 2020
4
may have contributed. There may also have been a ‘catch-up demand’ after the first lockdown in a tight market, contributing to the sharp price increase.
Figure 2: Median price and total transactions: monthly 2016-2020: England and Wales
Source: Land Registry
Analysis by property type Figure 3 plots the share in total transactions from the start of 2016 of four types of houses: detached, semi-detached, terraced and flats and maisonettes. It is interesting how they follow two paths; the detached and the semi-detached both showed a sharp fall in transactions in the run up to the 2016 SDLT changes and again immediately following the onset of the pandemic. Transactions in terraced houses and flats/maisonettes moved in the opposite direction. Purchases of second homes in anticipation of the SDLT surcharge on them were confined to the latter groups perhaps reflecting the activity of would-be buy to let landlords.
When COVID-19 hit transactions, the smaller categories of houses first boomed and subsequently slumped – especially flats – while those in larger houses first slumped and then recovered sharply – especially detached houses.
The marked fall in the number of transacted flats and the rise in the number of detached houses since the onset of COVID-19 could in theory be the result of an increase in the construction of detached houses or an increase in the rate at which they were traded. However, the construction of new houses – including of new detached houses – fell sharply after the onset of COVID-19. In other words: at least in the short-term the housing stock in Britain has been more or less fixed, so any entry and exit and any move is essentially a ‘zero sum game’. The observed

5
changes in Figure 3 during 2020 could just be the outcome of greater activity in transactions between owners of detached houses and lower activity in transactions between owners of flats. However, it is not so clear what factors would cause such changes in activity within property type. The Stamp Duty holiday can be expected to increase mobility (Best and Kleven, 2018) – especially housing related and short-distance mobility (Hilber and Lyytikäinen, 2017) – and as the holiday benefits buyers and sellers of larger and more expensive houses (up to £500k) more, it may have favoured trading these types of houses outside London. It is also possible that the financial position of owners of larger houses improved relative to those of smaller ones. COVID-19 seems to have relatively favoured those who are older and in more secure employment – groups likely concentrated in more expensive and detached or semi-detached houses. That could have increased the propensity to move of owners of such houses.
A related and perhaps more influential additional explanation is that the demand for more living space, and thus detached houses, increased after the onset of COVID-19. But how could this lead to a fall in the transaction of flats and an increase in the transaction of detached houses, in a setting where the housing stock was more or less fixed? Better-off owners of flats in more central locations likely desired more space after the onset of COVID-19. Young, less well-off entrants into the housing market are likely to rent. And the excess death rate induced by COVID-19 disproportionally affected the elderly, who more often than not own houses rather than flats. If the better-off flat owners in the centre decide to rent out their flats to new entrants (or keep them vacant) rather than selling them (so there is no housing transaction recorded) and if they then bought detached houses that came on the market due to COVID-19 related death (so involving a housing transaction), this could explain the compositional change in the transactions of detached houses vs. flats.
Figure 3: Share of different types of houses in total transactions: monthly 2016-2020:
England and Wales
Source: Land Registry
6
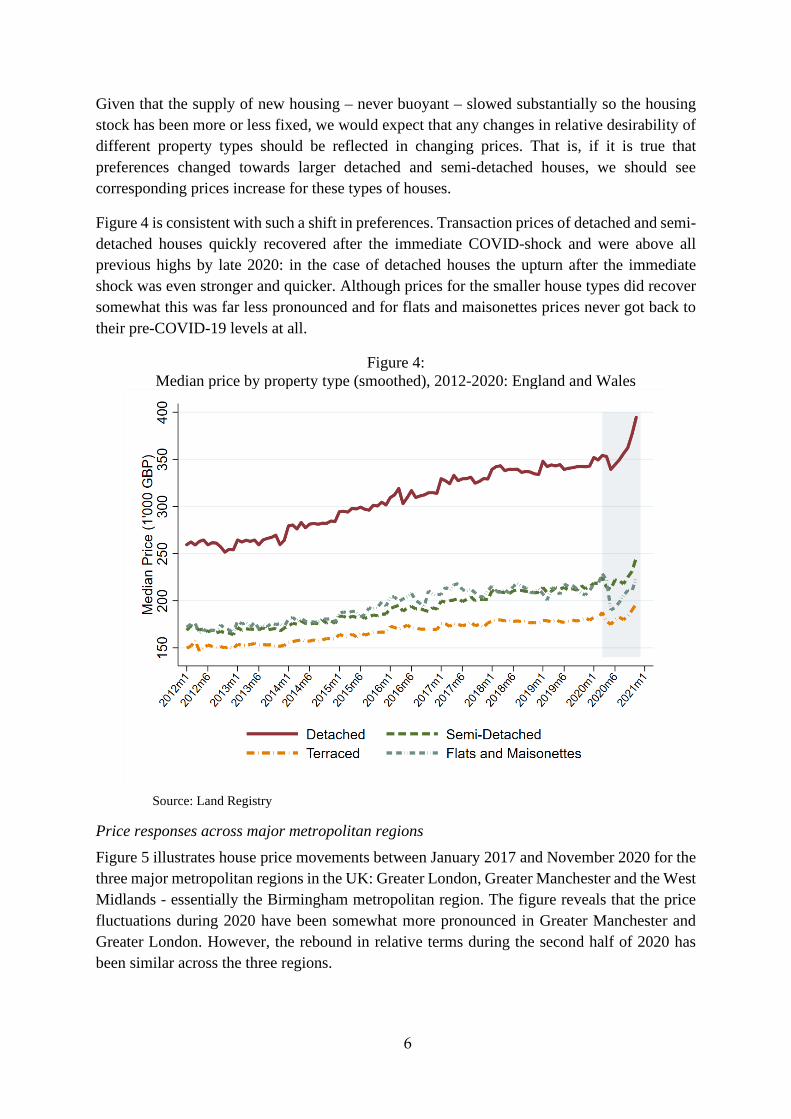
Given that the supply of new housing – never buoyant – slowed substantially so the housing stock has been more or less fixed, we would expect that any changes in relative desirability of different property types should be reflected in changing prices. That is, if it is true that preferences changed towards larger detached and semi-detached houses, we should see corresponding prices increase for these types of houses.
Figure 4 is consistent with such a shift in preferences. Transaction prices of detached and semi-detached houses quickly recovered after the immediate COVID-shock and were above all previous highs by late 2020: in the case of detached houses the upturn after the immediate shock was even stronger and quicker. Although prices for the smaller house types did recover somewhat this was far less pronounced and for flats and maisonettes prices never got back to their pre-COVID-19 levels at all.
Figure 4: Median price by property type (smoothed), 2012-2020: England and Wales
Source: Land Registry
Price responses across major metropolitan regions Figure 5 illustrates house price movements between January 2017 and November 2020 for the three major metropolitan regions in the UK: Greater London, Greater Manchester and the West Midlands - essentially the Birmingham metropolitan region. The figure reveals that the price fluctuations during 2020 have been somewhat more pronounced in Greater Manchester and Greater London. However, the rebound in relative terms during the second half of 2020 has been similar across the three regions.

7
Figure 5: Price changes in major metropolitan regions: monthly 2017m1 to 2020m11
Source: Land Registry. Note: Price changes based on median prices.
Within region analysis In Figures 6a and 6b we zoom into one region; London – defined as a large functional urban region or labour market area – to explore within region adjustments, both across space and property type.
Since prices near the centre of London are so high – up to £5.5m for a median detached house – we show this relationship both for the whole area out to 50kms (Figure 6a) and then from 15 to 50kms (Figure 6b) in order to be able to see more detail in the outer areas2.
It may be the case that as reported Guardian (2020) the price of a few large country houses increased, however, Figure 6a shows the really large price increases in 2020 compared to 2019 were for detached houses as close as possible to the centre of London: so not remote locations. That the increase was confined to detached houses is of course no surprise, however, that the price increases in the later part of 2020 were so large in both absolute and relative terms in central areas is wholly against conventional wisdom (including what we had said in our April blog).
2 The area is divided into annular rings each 3kms wide with the median price for each house type shown in
order to minimise the effect of outliers. Thus results are not driven by say the sale of 5 houses costing £25m.

8
Figure 6a: Prices by house type and distance from central London
(June-November 2019 vs. June-November 2020): Wider London Region
Source: Land Registry
For detached houses there is an almost imperceptible hump in 2020 compared to 2019 prices about 30 kms out, although the standout 2020 price action is concentrated to locations within 10km of the centre. Semi-detached houses also showed a smaller increase close to the centre in 2020 but prices for smaller houses fell in more central locations in 2020 compared to 2019.
Since house price increases between June and November 2020 were, in absolute terms, much stronger in London than elsewhere in England and anyway more houses were sold in the London region than elsewhere, the widely reported ‘exceptional house price increase’ in England appears to have been at least partially accounted for by a large increase in the price of the limited number of detached houses in central London.
Because central London prices are so high, it is difficult to see price changes between 2019 and 2020 in the suburbs and ex-urbs.
In Figure 6b we therefore drop the central area, so now the range of prices is from about £200,000 to £800,000. It is now possible to see that there were some significant movements, in relative terms, in the outer London region as well.

9
Figure 6b: Prices by house type and distance from central London 15-50 kilometres
(June-Nov 2019 vs. June-Nov 2020)
Source: Land Registry
The prices of detached houses generally increased relative to those of other house types at all locations – not just in the centre - although the increases were far smaller. However, there was some visible increase at a range of 25 to 40 kms. Geographically, price changes of semi-detached houses tracked those of detached ones but with smaller increases in 2020. Prices of flats and maisonettes decreased in 2020 relative to 2019 in all locations with those of terraced houses showing very small increases in central areas and around 30kms out and little change elsewhere.
There is a logic to this pattern of increases in the prices of larger houses; detached and semi-detached. This obviously rests on the increase in the demand for living (and work-from-home) space, including garden space, the pandemic generated. The ability to translate an increase in preferences into purchases is of course constrained by incomes. London has an exceptionally unequal income distribution and the evidence is (Blundell et al. 2020) that the pandemic has made the rich (and old) even richer relative to the rest of society. Moreover, the ability to buy the most sought after housing is controlled by people’s incomes relative to those of others competing in the market: not by their absolute incomes (Cheshire and Sheppard, 2004). So a post-pandemic stretching of the income distribution gave even more market power to the richest households in London. They seem to have concentrated that power on escaping the effects of the worst impacts of the lockdown and the pandemic and the increasing demand for home working most saliently by buying larger, more central houses.

10
A larger house in a central location not only allows more space to work at home but makes it easier to avoid the tube or buses, to walk or cycle about the city and to the office when that is necessary. It might also reflect a bet on the longer term bounce back of cities in general and London in particular. But it is important to note that relative to the total market, the number of detached houses transacted in central markets is small, and they are likely bought by the seriously rich.
2.2. The rental market We should not expect the effects of COVID-19 to be the same in the rental market as in the owner-occupied sector. This is for two main reasons. First, following the logic of Blundell et al. (2020), households renting in Britain tend to be lower income, younger and working in sectors – such as retail, hospitality or the arts – that are disproportionally adversely affected by the pandemic. They are also more likely to be self-employed, so get comparably less personal income support (see Blundell et al. 2021). Hence, we would expect a more immediate adverse effect on rents in the affected areas. Consistent with this are reports of strongly falling rents in city centres and particularly in Greater London, where rents fell during 2020 by 8.3% according to Zoopla (Financial Times 2021).
Second, for longer-distance movers, renting is to some extent a temporary substitute for owner-occupation (see e.g. Ha et al. 2021). One possible reason why we haven’t seen house prices soaring – in relative terms – in suburban and rural areas during 2020 could be because households responded to the pandemic with temporary rather than more permanent adjustments. This would be expected to affect the rental sector more strongly than the owner-occupied one. Unfortunately, we do not have access to raw data on individual rents, thus we have to rely on reports from data providers. A recent report by Zoopla (2021) (one of the main providers in the UK of rental data), consistent with our theoretical conjectures, suggests that houses during 2020 have been let 30% quicker than previously and rental growth outperformed in the outer areas of cities compared to more central locations.
For example, in central Birmingham rents have been falling by 3.4% year-on-year, whereas in the surrounding boroughs of Bromsgrove, Sandwell and Wolverhampton rents have actually risen by an average of 5% according to Zoopla. More generally, well-connected (outer) towns have observed strong rental growth, with increases, year-on-year in for, for example, Rochdale of 8.2% or Hastings of 8% and declines in rents in cities like Edinburgh (-1.8%) or Greater Manchester (-0.9%).
3. Did demand for garden space increase after the onset of COVID? One often repeated claim is that the pandemic brought about a surge in the demand for garden space. To explore this, we have merged housing transaction data from the Land Registry with Ordnance Survey data, which provides detailed outlines for each housing unit in Great Britain, including its floor plan and garden surface area. Because of the size of the data sets involved we have done this only for houses within the Greater London Authority (GLA) area.

11
Figure 7 illustrates that the trend towards detached houses with more garden space actually pre-dates the onset of COVID-19 by many years. The figure shows that the trend towards purchases of detached houses with larger gardens has been going on since at least 2012 (the start of our analysis). Between 2012 and 2016, the average garden size of detached houses transacted within the GLA area3 increased by around 5%. This increase, as Figure 7 documents, coincides with an increase in the share of newly built detached houses relative to all traded detached houses in the region.
Figure 7: Average garden surface areas of transacted detached houses & share of new detached houses
relative to all transacted detached houses in the GLA area (2012m6-2020m10)
Source: Land Registry and Ordnance Survey
Figure 8 explores the spatial distribution of transactions of newly built detached houses in the wider London region between 2012 and 2016, the period during which the average garden surface area of traded houses and the share of new detached houses amongst all traded detached houses rose (see Figure 7). Figure 8 reveals that, if one looks beyond the boundaries of the GLA, the increase in the average garden size during the time period is driven by the fact that, over time, detached houses were built further and further away from the centre: up to distances
33 The GLA area covers 159,600 hectares of which 22.1 percent is Green Belt: that is, London’s
514,000 hectares Green Belt includes 35,250 hectares within the GLA boundaries (Cheshire and Carozzi, 2019).

12
of around 30km away from the centre of London, more detached houses were built in 2012. However, from 30km outwards (with the odd exception of the ring 45-47.5k) – beyond the outer boundary of London’s Green Belt – more detached houses were built in 2016.
Figure 8: Spatial distribution of transactions of new detached houses
in the wider London Region (out to 50kms)
Source: Land Registry
Figure 7 shows that the trend towards the construction of more single detached houses and larger garden areas came to an abrupt end during 2016. In fact, the second half of 2016 is characterized by a very substantial drop in the number of newly built detached houses relative to all detached houses and the garden area of traded detached houses ceased to grow any further from 2016 onwards. So what happened in 2016? One policy event we already discussed above: the introduction of a Stamp Duty surcharge on second homes. However, this can hardly explain the compositional change – new vs. old – within the class of detached houses. The other major policy event was of course the Brexit referendum on 23 June 2016. This triggered a loss of consumer confidence and caused the UK construction sector to slip into recession for the first time since 2012. It also appears to have halted – if probably temporarily – the trend towards construction of detached houses beyond the London Green Belt.
Interestingly, the pandemic year 2020 has been remarkable only in that the share of newly built detached houses relative to all traded detached houses slumped from over 3% to close to 0%. New construction of all types of houses was hit but that of detached houses was perhaps hit more – data are not yet available to be sure. The garden area size of traded detached houses, however, showed neither a clear upward- nor a clear downward-trend.

13
The analysis of garden sizes of transacted detached houses can be summed up with two stylized facts: first, what we appear to observe in the data is a longer-term trend towards the construction of more detached houses with larger gardens beyond London’s Green Belt. This is subject to the caveat that we only know about garden sizes in detail for houses inside the GLA area. This trend would appear to reflect an increase in the preferences for more living space and larger garden sizes. Detached houses are built further and further out, because more central locations are – as a consequence of strong demand in conjunction with a dysfunctional planning system limiting supply – simply no longer affordable (see Hilber and Vermeulen, 2016; Cheshire, 2018).
Second, the main short-term effect of COVID-19 has been to slow down housing construction – including the construction of detached houses. Put differently, the housing stock has more or less been fixed during 2020 and, as a consequence, also the urban form. COVID-19 may have induced stronger preferences for more living space and access to gardens in most people. However, the available stock of such houses has roughly remained unchanged in the short-term; hence the scarcity-driven increase in house prices illustrated in Figures 6a and 6b.
4. The role of policy and the dangers of reinforcing the downturn When anticipating future price movements in the housing market it is above all essential to have the best possible forecast of demand fundamentals: and demand for housing is most importantly determined by incomes. As we noted in the introduction, the actions the Chancellor took early in the pandemic to support incomes – the Furlough scheme and the scheme for the self-employed together with the support for businesses – effectively supported personal incomes very substantially.
There were in addition specific measures directed at supporting activity in the housing market and house prices and the position of renters. The scheme getting most attention has been the SDLT holiday. This started in July 2020 and was originally due to end on 31 March 2021 but in the March Budget it was extended to June 30, 2021. This was worth up to £15,000 on a £500,000 house, with bigger discounts for more expensive houses up to the ceiling of £500,000. There were other measures too – aside from the extraordinarily low interest rates - such as potential mortgage payment holidays for 6 months to those who had lost income from COVID-19. To qualify, applications had to be lodged by end of March 2021. In the Budget of March 2021 there was a new scheme of government guarantees for first time buyers with deposits of only 5% instead of the 20% normal since the financial crash.4 There was also some help for tenants with a stop on evictions except in the most extreme circumstances.
4 This scheme is a reincarnation of the first iteration of the Help to Buy policy implemented back in
2013. Carozzi et al. (2020) show how the main effect of the Help to Buy equity loan scheme was to increase house prices in the Greater London area, with no significant positive effects on housing construction. In fact, the Help to Buy induced house price increase has been estimated to be greater than the interest rate subsidy embodied in the Help to Buy equity loan scheme.
14
As we have seen, in aggregate these measures prevented a downturn in the housing market following the initial shock of March 2020.
As one saw in 2016, beating SDLT deadlines has a substantial effect on housing market turnover. Government actions have generally supported demand but particularly demand for larger and more expensive houses (so detached and semi-detached) and in more expensive regions. This is because, up to the level of £500,000, the SDLT holiday was worth more the more expensive the house. The combination of very low interest rates and, for those in financial difficulties, mortgage holidays for up to 6 months, will have headed off forced sales. It was forced sales resulting from mortgage defaults that really accelerated the fall in house prices in 1991: it was the relative lack of forced sales in the aftermath of the financial crisis of 2008 which resulted in only modest house price falls in the UK. Post the financial crisis, repossessions in the UK peaked in 2008 at less than half their early 1990s levels whereas the comparable US foreclosure rate during the financial crisis was far above any previously recorded level (Aran and Muellbauer, 2016).
Aran and Muellbauer (2016) found the main determinants of the repossession rate over the period 1983-2014 were the aggregate debt-service ratio, the proportion of mortgages in negative equity and the unemployment rate. Government actions since March 2020 have kept unemployment low and a combination of financial policy and world financial conditions have kept interest rates low.
Unemployment is inevitably going to rise sharply from the end of the Furlough scheme until the economy recovers. An OECD forecast suggests that unemployment will plateau during 2021 at almost twice its 2019 level and falling gradually from 2022. Economic forecasting is currently subject to even more uncertainties than is normal: not just the progression of the pandemic and how effective vaccinations will be at returning economic activity – indeed all activity – to more normal conditions, but in the UK there is also the impact on recovery of Brexit. This is already looking more negative than anticipated, although again interpretation is confounded by the pandemic and its effects on both travel and trade.
Before speculating about how the economic hit and reactions to it will affect the housing market over the short and medium term, there is one more relevant comparison with the late 1980s and the 1990-91 recession and housing market collapse to consider. That is the effect on the housing market of the advance announcement of the end of a subsidy. In the current situation that subsidy is the SDLT holiday: in 1988 it was the advance notice of the end of pooled tax relief on mortgage interest.
The Thatcher government increased the subsidy on mortgage interest rate payments - the so-called Mortgage interest relief at source or MIRAS scheme - in 1983 to a limit of £30,000. This was a part of its drive for home ownership. MIRAS also allowed unmarried couples to pool their tax relief, so doubling the tax free limit to £60,000.
In his 1988 budget Nigel Lawson announced he would end this pooling arrangement: but not until August. This was against the background of an existing rapid acceleration of house prices but a movement of the economy towards recession. The effect of the pre-announced end to the

15
subsidy was to trigger a major rush to beat the deadline and near price explosion in the housing market. But this boom was followed by a bust: between 1989 and 1991 house prices fell more than 30% in real terms. The severe recession, high interest rates and failure to restrain repossessions played a major role in the collapse of house prices but the surge in prices triggered by the advance warning of the end of tax relief pooling certainly made it worse and acted as a trigger.
With an increase of up to 20% (depending on house type) between May and November 2020, the recent rate of price increase seems to meet the ‘post-Lawson 1988’ test. The earlier introduction of a Stamp Duty holiday or the 5% deposits for first time buyers as we enter an economic downturn seems risky. There is a significant risk of policy trying to prop up house price growth. The implemented policies – such as the Stamp Duty holiday – are costly to the government and eventually are likely to be reversed. If this coincides with an economic downturn there is a significant risk that the policy ends up triggering a housing market downturn, reinforcing the economic downturn.
In principle, of course, the British obsession with booming housing markets as a symptom of economic health is absurd. As two of us have frequently argued, housing is seriously unaffordable in Britain. The problem is the reasons for price reductions and the context. In a context of falling disposable personal incomes (business failures, job losses and rising taxes to pay off the increase in national debt accumulated over the crisis, will likely generate such a fall) a fall in house prices may not make housing any more affordable.
5. The immediate and medium-term outlook After their rapid rise between May and November, incomplete data from the Land Registry for December and from Nationwide suggest that house prices may have stabilised towards the end of 2020. Given that periods with stable prices, low volumes on the market and a growth in the period taken to make a sale typically signify the end of a boom period and pre-date falling house prices, the price trend in London towards the end of 2020 might indicate that a downturn is finally around the corner. Such a downturn might be particularly focussed on detached and semi-detached houses because it is the more expensive categories of housing that have benefitted most from the SDLT holiday – ending on June 30th. All that said, the extensions of the Furlough scheme and the Stamp Duty holiday and the reincarnation of the first iteration of Help to Buy, announced in the Budget, and the ‘innovation’ of 40-year fixed-rate mortgages by Habito into the British mortgage market, may quite possibly spark yet another temporary spurt in prices, before the downturn eventually takes effect.
One further thought is that the effects of the COVID-19 crisis are in the context of absorbing the impacts of Brexit. In common with nearly all other economists we expect Brexit to lead to slower economic growth and lower incomes than would otherwise have been the case. Moreover, there are reasons to think that Brexit may affect London and its housing market relatively more than other regions – at least for the medium term. This is because of the strong concentration of EU citizens in London and the reliance of London’s economy on tradeable services - most of which are excluded from the deal negotiated with the EU at the end of 2020.

16
Thus London is likely disproportionally to suffer a loss of (skilled) people and a hit to its economy in the post-Brexit period. Together with the fact that the SDLT holiday disproportionately boosted more expensive houses and housing markets, we would therefore expect the historically unusual situation of a housing market downturn more substantial in London and the South East than in most other parts of the UK. Not a levelling up, so much as a dressing down.
6. The long-term outlook As we have consistently stressed it is very dangerous to generalise long into the future on the basis of an extraordinary set of circumstances. Commentators - even bankers - have been quick to argue that the world and its cities will never be the same again. However, cities, which were invented perhaps 12,500 years ago, have ‘survived’ countless natural catastrophes, epidemics or pandemics. In 1665 and 1666 London suffered far worse catastrophes than are being experienced at the present. The 1665 plague killed between 15 and 20% of its population: the Great Fire in 1666 destroyed most of the City – home to 80,000 people – and a significant area of the inner suburbs to the west. London recovered, indeed prospered. Its attraction for migrants, including religious refugees – this is when the Huguenots and Jewish groups arrived in numbers – strengthened.
While proximity helps to spread COVID-19, the same proximity helps big cities thrive economically and socially (Nathan and Overman, 2020). Cities have powerful agglomeration economies in production: people are more productive in larger cities and the larger the city, the more productive they are (see for example, De la Roca and Puga, 2017). There are however also agglomeration economies of consumption in larger cities. Cities have come to completely dominate our patterns of settlement, living and working. The fastest growth sectors of big city economies over recent decades - cultural industries, entertainment, media, tourism, even higher education – are as much about consumption as production. There are powerful reasons for this which are not going to go away. So we are firmly in the camp of post-COVID-19 urban revival.
This does not mean to say that some changes may not linger. International business travel is very expensive in terms of not just cost but of time. Zoom, or its equivalent, has the potential to produce massive productivity gains. Technical progress in remote video based interactions has had a major boost as a result of the COVID-19 pandemic: moreover people have adapted to the technology. Its use in many applications will remain because it not only offers huge savings in travel times and costs but opens up new possibilities, but these new opportunities may come with their own costs.
To illustrate from academic life: attendance at specialised research seminars has increased, as the need to physically attend has disappeared – and that ease of attendance also applies to speakers, who can be drawn from a wider pool. This means that it is easier now to hear from the top researchers – or to speak at the top universities – across the world, a great benefit to researchers. But such increased competition could also lead to a ‘superstar effect’ in which the best known researchers get more exposure at the expense of younger or just competent

17
researchers. In other words, the opportunities provided by Zoom may reinforce the strength of the strongest and make the university system and researchers more hierarchical.
But Zoom is not a perfect substitute for the face to face experience. While online seminars are in many ways a success, one loses informal interaction with colleagues and interaction before and afterwards. It is much more difficult to recreate the conference experience with online conferences. Similarly there are dynamic learning benefits of working closely with others, both in a single workplace but also in densely populated cities lost in homeworking or using Zoom or its equivalents. Nor can more confidential business and government meetings be effectively replaced by Zoom. So although we have learnt the benefits Zoom can bring, still it is a partial replacement for the face-to-face contact only large cities effectively facilitate.
Similarly, the five days a week in the office may become less common with working from home part of the time established as a norm. While this may generate an even stronger long term shift in housing preferences towards more space, it does not mean abandonment of cities. If you can afford it, you can work from your study in one of the more central London boroughs three days a week but enjoy London’s cultural life and recreations every day.
On the margin there may be some development of office nodes in suburban locations but in our judgement the attractions of the central business district will be maintained. Even if office occupation is less intensive, still accessibility is critical. That is truer the larger a city is and the more specialised its labour force. It is specialisation which significantly fuels agglomeration economies.
In terms of the housing market what this implies is a rising cost of space especially if the British planning system is as restrictive of space in the future as it has been over the past 75 years. Our system of property taxes and local government finance adds to this problem since it continues to penalise local authorities which permit residential development. Without radical reform, space in housing and gardens will increasingly become the privilege of the rich.
18
References Aron, J. and J. Muellbauer (2016) ‘Modelling and forecasting mortgage delinquency and
foreclosure in the UK’, Journal of Urban Economics, 94, 32-53.
BBC News (2021) ‘Covid map: Coronavirus cases, deaths, vaccinations by country’, 5 March. (https://www.bbc.co.uk/news/world-51235105).
Best, M.C. and H.J. Kleven (2018) ‘Housing Market Responses to Transaction Taxes: Evidence from Notches and Stimulus in the U.K.’, Review of Economic Studies, 85(1), 157-193.
Blundell, R., M. Costa Dias, R. Joyce and X. Xu (2020) Covid-19 and Inequalities, Inequality: The IFS Deaton Review, Institute for Fiscal Studies (IFS), 11 June.
Blundell, J., S. Machin and M. Ventura (2021) Covid-19 and the self-employed – ten months into the crisis, CEP: CEP Covid-19 Analysis, March.
Carozzi, F., C.A.L. Hilber and X. Yu (2020) ‘On the Economic Impacts of Mortgage Credit Expansion Policies: Evidence from Help to Buy’, CEP Discussion Paper No. 1681, March.
Cheshire, P. (2009) Urban Containment, Housing Affordability and Price Stability – Irreconcilable Goals, LSE: SERC Policy Paper No 4.
Cheshire, P. (2018) ‘Broken market or broken policy? The unintended consequences of restrictive planning’, National Institute Economic Review 245: R9-19.
Cheshire, P. and F. Carozzi, (2019) Housing Sprint: land report. Housing Sprint. Saïd Business School, Oxford, UK. http://eprints.lse.ac.uk/102339/
Cheshire, P. and C. Hilber (2019) Housing, Centre for Economic Performance, Election Analysis, Paper EA051, LSE: CEP: UK Housing Policies: Evidence from economic research.
Cheshire, P. and C. Hilber (2020) ‘COVID-19: Crashing the Economy so what will it do for the Housing Market?’, CEP Urban and Spatial Programme Blog, 17 April.
Cheshire, P. and S. Sheppard (2004) ‘Introduction to Feature: The Price of Access to Better Neighbourhoods’, Economic Journal, November, F391-97.
De la Roca, J and D. Puga (2017) ‘Learning by Working in Big Cities’, Review of Economic Studies, 84(1), 106-42.
Financial Times (2021) ‘City centre housing rents fall as tenants move to suburbs’, 12th February.
Guardian (2020) ‘Market for high-end country homes in UK strongest in decade’, 23rd December.
Ha, S., C.A.L. Hilber and O. Schöni (2021) ‘Do Long-Distance Moves Discourage Homeownership? Evidence from England’, forthcoming Journal of Housing Economics.
Hilber, C.A.L. and T. Lyytikäinen (2017) ‘Transfer Taxes and Household Mobility: Distortion on the Housing or Labor Market?’, Journal of Urban Economics, 101, 57-73.

19
Hilber, C.A.L. and A. Mense (2021) ‘Why Have House Prices Risen So Much More Than Rents in Superstar Cities? CEP Discussion Paper, No. 1743, January.
Hilber, C.A.L. and W. Vermeulen (2016) ‘The Impact of Supply Constraints on House Prices in England’, Economic Journal, 126(591), 358-405.
Nathan, M. and H. Overman (2020) ‘Will coronavirus cause a big city exodus?,’ Economics Observatory blog, 22nd of September.
Terry, Mark (2020) ‘Compare: 1918 Spanish Influenza Pandemic Versus COVID-19,’ biospace.com, 2nd of April. (https://www.biospace.com/article/compare-1918-spanish-influenza-pandemic-versus-covid-19/)
Zoopla (2021) UK Rental Market Report: Latest insight on the UK Rental Market based on Zoopla’s Rental Index, Zoopla, February.

20
Author information
Paul Cheshire is Emeritus Professor of Economic Geography at the London School of Economics and an associate of the Centre for Economic Performance.
Christian Hilber is Professor of Economic Geography at the London School of Economics and an associate of the Centre for Economic Performance.
Olivier Schöni is an Assistant Professor in the Department of Finance, Insurance and Real Estate at the University of Laval, Canada and an associate of the Centre for Economic Performance.
For further information, contact:
Paul Cheshire: [email protected]
Christian Hilber: [email protected]
Olivier Schöni: [email protected]
Helen Ward, communications manager, CEP: 07970 254872, [email protected] Romesh Vaitilingam, press and public relations, CEP: [email protected]

The Centre for Economic Performance is a world-leading economics and policy research
institute. CEP studies the determinants of economic performance at the level of the company,
the nation and the global economy by focusing on the major links between globalisation,
technology, the educational system and the labour market and their impact on productivity,
inequality, employment, stability and wellbeing. It is part-funded by the Economic and Social
Research Council and based at the London School of Economics and Political Science.
[email protected] | cep.lse.ac.uk/ | @CEP_LSE
We would like to acknowledge the excellent research assistance provided by Elena Lutz.