Embed Size (px)
Citation preview

The Other Side of the Trade-Off: The Impact of Risk on Executive Compensation A Comment
John Core*
Wayne Guay
The Wharton School
University of Pennsylvania, 2400 Steinberg-Dietrich Hall
Philadelphia, PA 19104-6365
First draft: November, 2000
This draft: October, 2001
*Corresponding author. Tel: (215) 898-4821; fax:(215) 573-2054; e-mail: [email protected]. We appreciate the helpful comments of Rajesh Aggarwal, Stan Baiman, Bob Holthausen, Steven Levitt (the editor), Michael Raith, Andrew Samwick, seminar participants at the University of Chicago, Pennsylvania State University, and Northwestern University, and an anonymous referee. We gratefully acknowledge the research assistance of Scott Mooney and the financial support of the Wharton School.

The Other Side of the Trade-Off: The Impact of Risk on Executive Compensation A Comment
Abstract In contrast to studies such as Demsetz and Lehn (1985) that predict and find a strong positive association between firm risk and ownership incentives, Aggarwal and Samwick (A&S 1999) predict and find a strong negative association. A key assumption of A&S's analysis is that firm risk is the sole determinant of the pay-performance sensitivity. Neither prior research nor the data support this assumption. When we replicate the A&S model with an augmented but parsimonious model of the CEO pay-performance sensitivity that controls for firm market value, we find that the pay-performance sensitivity is significantly positively related to firm risk.

1
I. Introduction
In a recent article in this Journal, Aggarwal and Samwick (A&S 1999) state that they
"demonstrate strong empirical confirmation" of a principal-agent model's "key prediction" that
an executive's "pay-performance sensitivity is decreasing in the variance of the firm's
performance" (p. 65). A key assumption of A&S's analysis is that the variance of a firm's
performance is either the sole determinant of the pay-performance sensitivity or that other
determinants of the pay-performance sensitivity are uncorrelated with variance. As we discuss
below, neither prior research nor the data support this assumption. Further, we document that
because this assumption is critical to A&S's empirical analysis, their results cannot be interpreted
as evidence of a negative relation between risk and the pay-performance sensitivity.
The assumption that firm risk is the sole determinant of a manager's pay-performance
sensitivity is not supported by related agency research such as Baker and Hall (1998) and
Schaefer (1998), who emphasize the importance of controlling for an expected positive
association between firm size and the CEO's marginal product. This assumption is also rejected
by an extensive literature that examines the determinants of managerial ownership. Because
almost all of an executive's pay-performance sensitivity is determined by his or her percentage
ownership of the firm (Jensen and Murphy 1990), the determinants of executive ownership are
important determinants of the total pay-performance sensitivity. The literature that examines the
determinants of managerial ownership originated with Demsetz and Lehn (1985) in an earlier
article in this Journal. Demsetz and Lehn (1985) predict and find that ownership concentration
is negatively rela ted to firm market value and positively related to firm risk. Subsequent
research predicts and finds that both firm characteristics (e.g., size, risk, and other proxies for
monitoring costs and managerial discretion) and manager characteristics (e.g., tenure and
2
education as proxies for the manager's marginal product) explain cross-sectional variation in
managerial ownership.1
We argue that the exclusion of known determinants of the pay-performance sensitivity
from A&S's regression models greatly alters the inference with respect to the included
determinants. To show these inference problems, we replicate A&S's results by estimating the
pay-performance sensitivity in a regression of the CEO's change in firm-specific wealth on dollar
returns and dollar returns interacted with firm risk (as measured by the variance of dollar
returns). We then add an interaction with firm size (as measured by market value) to the
regression and show that it has a significantly negative relation with the pay-performance
sensit ivity, consistent with the findings of the managerial ownership literature. Finally, we show
that market value is correlated with the variance of dollar returns in such a way that its omission
from the A&S specification reverses the inference with respect to firm risk: With market value
included, firm risk is significantly positively associated with the pay-performance sensitivity,
consistent with the prediction and findings of the managerial ownership literature. Because the
decreasing relation between risk and incentives is a comparative static prediction of A&S's
version of the standard principal-agent model, this relation should hold among firms of equal
size (as well as among firms that are similar along other dimensions). Our evidence documents
that this is not the case. We do not argue that market value is the only important determinant
omitted from the A&S regression, but simply that a parsimonious model that includes market
value is sufficient to illustrate our arguments. For robustness, we show that when additional
1 For example, see Jensen, Solberg, and Zorn 1992; Holthausen and Larcker 1993; Loderer and Martin 1997; Cho 1998; Core and Guay 1999; Himmelberg, Hubbard, and Palia 1999; Holderness, Kroszner and Sheehan 1999; Bushman, Chen, Engel, and Smith 2000; and Palia 2001.

3
determinants of the pay-performance sensitivity are included in the empirical model, firm risk
remains positively associated with the pay-performance sensitivity.
II. Theoretical Specification
A&S test a very specific and restricted version of the principal-agent model, which is
described by Holmstrom and Milgrom (1987). A&S's principal-agent framework (p. 76) assumes
that: (1) firm performance is normally distributed; (2) the CEO has constant absolute risk
aversion; (3) the CEO's action increases the mean of firm performance, but not its variance; (4)
the CEO's contract is linear; and (5) all CEOs have the effort aversion parameter k and risk
aversion parameter ρ. Holmstrom and Milgrom (p. 324) emphasize that a key restriction of the
standard agency model is that the CEO has no discretion over project selection, or, equivalently,
that the shareholders specify which project the CEO chooses. Given these assumptions, one firm-
specific characteristic that influences the optimal pay-performance sensitivity is risk, and greater
risk is predicted to lower the pay-performance sensitivity.
To test for a negative relation between risk and the pay-performance sensitivity, A&S
estimate whether the slope parameter in a regression of change in firm-specific executive wealth
on firm performance is negatively related to firm risk. A&S test this hypothesis using firm
performance measured as dollar returns (percentage returns) and risk measured as the variance of
dollar returns (percentage returns).
As emphasized by Baker and Hall (1998), Holmstrom (1992), Rosen (1992) and Schaefer
(1998), how the CEO's marginal product varies with firm size also affects the pay-performance
sensitivity. Although A&S do not make explicit assumptions in this regard, their dollar returns
specification implicitly assumes that CEO marginal product is independent of market value, and
their percentage returns specification implicitly assumes that CEO marginal product increases

4
one-for-one with market value. To illustrate the specific assumptions made by A&S about the
relation between CEO marginal product and market value within a general framework, we use
the following equation that shows a relation between CEO marginal product, beginning market
value Vt-1, and the firm's current dollar return, which is the change in market value of equity plus
dividends (Vt + dt - Vt-1):
Vt + dt - Vt-1 = (Vt-1)ηx + ε (1)
We follow the A&S notation in this equation: x is effort and ε is noise in dollar returns. The term
(Vt-1)η is the CEO's marginal product of effort, and η ≥ 0 measures the elasticity of the CEO's
marginal product to Vt-1. As shown in Baker and Hall (1998) and Schaefer (1998), the optimal
linear contract for the specification shown in Equation (1) has slope parameter:
( ) ( )21
221
21
221
21*
1−−
−
−
−+
=+
=trt
t
t
tVkV
VkV
Vσρσρ
α η
η
η
η
(2)
where 2σ is dollar return variance, and the second equality follows because dollar return
variance is equal to 21−tV times percentage return variance 2
rσ .
When η = 0, Equation (1) reduces to:
Vt + dt - Vt-1 = x + ε, (3)
In this case, the middle expression in Equation (2) indicates that the optimal slope is independent
of market value in a specification where firm risk is measured as the variance of dollar returns.
Thus, when η = 0, the A&S empirical model using dollar return variance is well-specified
without a control for Vt-1.
When η = 1, and when both sides of Equation (1) are divided by Vt-1, Equation (1)
becomes:
Rt = (Vt + dt - Vt-1)/Vt-1 = x + ε/Vt-1, (4)

5
In this case, the right-hand side of Equation (2) indicates that the optimal slope is independent of
market value in a specification where firm risk is measured as the variance of percentage returns.
Thus, when η = 1, the A&S empirical model using percentage return variance is well-specified
without a control for Vt-1.2
There does not appear to be a strong ex ante reason to expect that η equals either 0 or 1 as
assumed by the A&S specifications. Baker and Hall (1998) show empirical estimates of η that
range from 0.3 to 0.6, and show that the data strongly reject the hypothesis that η equals 0 or 1.
This evidence, combined with Equation (2), suggests that the optimal pay-performance slope is a
function of Vt-1. Given that Vt-1 is correlated with A&S’s measures of firm risk (e.g., A&S note
on p.78 “that larger firms will tend to have larger [dollar] variances by virtue of scale”), the
omission of market value from the A&S specification is expected to result in biased slope
estimates. In Section III, we illustrate empirically that Vt-1 exhibits strong correlations with both
dollar return variance and percentage return variance. Thus, it seems important to include a
control for market value in addition to risk in a test of the principal-agent model.
Implicit in the managerial ownership literature is a more general model of the agency
relation between the shareholders and the CEO, in which shareholders cannot specify which
project the CEO chooses, but must instead delegate this choice to the CEO. This model assumes
that the CEO can choose from a set of projects, and that prior to making the decision, she has
acquired superior information about the projects. The greater the uncertainty in the operating
environment, the more difficult it is for the shareholders or board of directors to know why the
2 A&S note on page 78 that the percentage returns specification assumes that "the extra compensation that the ex-ecutive would receive for a 1 percent increase in the value of the firm is independent of the size of the firm. In a cross-section of firms this assumption is likely to be false." This statement indicates that A&S recognize that firm size and incentives are related, and that η is unlikely to equal 1, on average, in a cross-section of firms. That η does not equal 1, however, does not imply that η equals 0, as is assumed in the A&S dollar returns specification.

6
project was selected (i.e., to maximize firm value or to maximize the CEO's private benefits),
even if they know what project was selected (e.g., Demsetz and Lehn 1985; Smith and Watts
1992; Prendergast 2000a, 2000b). Thus, in more uncertain environments, the CEO must be given
greater pay-performance sensitivity to motivate the best choice for shareholders (Smith and
Watts 1992; Prendergast 2000a, 2000b). In this model, firm risk (measured empirically by the
variance of percentage returns) proxies for both uncertainty in the operating environment and
noise in the performance measure. Provided that there is sufficient uncertainty about the CEO's
project choice, a positive association is predicted between risk and the pay-performance
sensitivity. When there is no uncertainty, the shareholders can direct the CEO's project selection,
and the model becomes a standard principal-agent model, in which the CEO has no project
selection responsibilities, and an unambiguously negative relation is predicted between risk and
incentives.
This more general model predicts that other firm characteristics besides risk, such as size
and other proxies for monitoring costs, influence CEO incentives. For example, many studies
predict and find a negative relation between CEO incentives and firm market value (e.g.,
Holthausen and Larcker 1993; Cho 1998; Core and Guay 1999; Holderness, Kroszner and
Sheehan 1999; and Bushman, Chen, Engel, and Smith 2000; Palia 2001). One reason why the
pay-performance sensitivity is expected to decrease with the market value of equity is that the
cost of a given amount fractional ownership increases with firms' market value. When CEOs are
risk-averse and wealth-constrained, firms with target ownership levels will find it increasingly
costly to maintain the desired fractional ownership as market capitalization increases (Demsetz
and Lehn 1985). It is important to remember that when CEOs are risk-averse and wealth-

7
constrained, even a small fractional share of a large firm translates into powerful dollar
incentives (Haubrich 1994; Baker and Hall 1998; Hall and Liebman 1998).
Because both the agency literature and the managerial ownership literature suggest that it
is important to control for market value, we augment the A&S regression model to control for
the lagged market value of equity, Vt-1:
Change in CEO firm-specific wealth = α + β1 Dollar return + β2(Dollar return × CDF of $ Variance) + β3 CDF of $ Variance
+ β4(Dollar return × CDF of Vt-1) + β5 CDF of Vt-1 + year dummies + ε, (5) where $ Variance denotes the variance of dollar returns. We follow the extensive findings in the
managerial ownership literature and predict a positive coefficient on the proxy for firm risk and a
negative coefficient on market value.
III. Empirical Analysis
We begin our analysis by presenting descriptive statistics for the sample and by
replicating A&S's pay-performance sensitivity regressions. We then show how the apparent
negative relation between pay-performance sensitivity and risk in this specification is driven by
two factors: (1) market value is omitted as an economic determinant of equity incentives, and (2)
A&S's measure of risk in these regressions differs from more commonly employed measures in
that it has a very large positive correlation with firm market value and a very large negative
correlation with stock-return volatility. In our expanded model, we document a positive and
significant relation between the pay-performance sensitivity and risk that is consistent with the
prediction and findings of the managerial ownership literature.
Sample selection and variable construction
To create our sample, we use the same data restrictions as A&S (1999), and compute

8
compensation variables consistent with the A&S measures. We obtain a sample of 4,812 CEO-
year observations from the ExecuComp database for Compustat data years 1992 to 1996. From
ExecuComp, we obtain data on CEO compensation, stock ownership, and the degree to which
the CEO's options are in the money. To compute the CEO's annual flow compensation, we sum
the CEO's salary, bonus, the value of grants of options and restricted stock, and other annual pay.
Like A&S, we take the value of the annual option grant to be the value reported in the company's
proxy statement. Consistent with A&S, we adjust all level variables to 1995 dollars using the
consumer price index, and we compute real returns by subtracting growth in the CPI.
The dependent variable in the pay-performance sensitivity regressions is the change in
the CEO's firm-specific wealth. This variable is the sum of annual flow compensation plus the
change in the estimated value of stock and option holdings. We follow A&S and compute the
change in the CEO's stock portfolio during the year by multiplying the beginning of the year
portfolio value by the firm's real return for the year. We compute the change in the CEO's option
portfolio as the difference between the extent to which the portfolio is in-the-money at the end of
the year and the beginning of the year.3
Like A&S, we compute each firm's "dollar return" for a period as the firm's beginning of
period market value of equity multiplied by the firm's real (net of inflation) percentage return for
the period. We measure annual firm performance as the annual "dollar return." To compute the
variance of monthly dollar returns (i.e., A&S's measure of firm risk), we use a time series of no
less than 48 months and no more than 60 months of returns ending the month prior to the fiscal
year in which compensation is determined. Consistent with A&S, we compute the cumulative
3 Like Aggarwal and Samwick, we recognize that the option portfolio's intrinsic value is a noisy measure of the change in option portfolio value, but we compute it in this way to replicate Aggarwal and Samwick as closely as possible. Our results are qualitatively the same if we calculate the change in option portfolio value using the Black-Scholes model as in Core and Guay (2001).

9
distribution function of the variance of monthly dollar returns (CDF of $ Variance) by ranking
the observations, and then transforming the ranks so that they lie uniformly between zero and
one. We compute the CDF of Vt-1 by using the same procedure on the market value of equity at
the beginning of the year. The CDF values of zero and one correspond to the smallest and largest
variances of dollar returns (and market values of equity) in our sample, and a CDF of 0.5
corresponds to the median value.
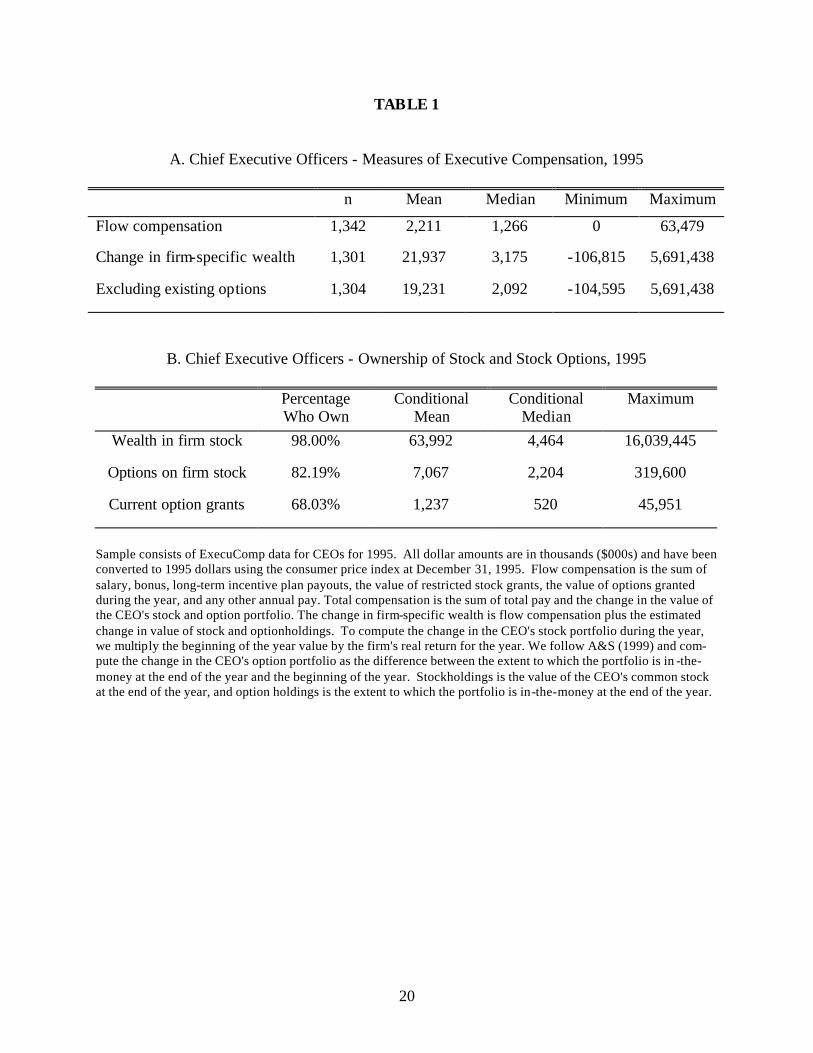
Table 1 reports descriptive statistics for 1995 CEO compensation, and shows that our
sample and variables closely replicate those reported in A&S Table 1 (p. 72).4 The mean
(median) flow compensation (i.e., total annual pay) is $2.2 ($1.3) million in our sample
compared to $2.3 ($1.4) million in the A&S sample. Similarly, the mean (median) compensation
due to the change in firm-specific wealth is $21.9 ($3.2) million for the CEOs in our sample,
compared to $24.2 ($3.1) million in the A&S sample. The levels of stock and option holdings for
the two samples are also very similar. For example, mean and median values of stockholdings,
option holdings, and current option grants for our CEOs are all within 5% of the values reported
for the A&S sample. Untabulated descriptive statistics also indicate that annual returns and
variance of returns for our sample are similar to those reported by A&S.
Pay-performance sensitivity results
We replicate and extend the A&S pay-performance sensitivity regressions. Following
A&S, we estimate regression Equation (5) using median regressions and calculate standard
errors using 20 replications of the bootstrap procedure in Gould (1992). The pay-performance
sensitivity for a firm of given risk and market value is β1 + (β2 × CDF of $ Variance) + (β4 ×
4 Our sample size is slightly larger than Aggarwal and Samwick. Part of this difference occurs because we use a later version of ExecuComp that includes more firms.

10
CDF of Vt-1). A significantly negative estimate of β2 is interpreted as evidence supporting the
standard principal-agent model prediction of a negative relation between risk and the pay-
performance sensitivity. Following the prediction of the managerial ownership literature, β4 is
expected to be negative.
Column (a) of Table 2 reports results for the regression specification where market value
is omitted from Equation (5). For parsimony in Table 2, we report only the coefficients on the
interactive variables. Similar to the findings of A&S, the coefficient on Dollar return (β1) is
significantly positive and the coefficient on the interactive term Dollar return × CDF of $
Variance (β2) is significantly negative. The coefficient estimates and significance levels closely
correspond to A&S’s Table 3, Panel A, Column 1. The negative coefficient, β2, forms the basis
for A&S's conclusion that the CEO's pay-performance sensitivity is negatively correlated with
firm risk.
Column (b) of Table 2 reports results for the regression specification where CDF of
market value is substituted for CDF of $ Variance in the regression. The coefficient on the
interactive term Dollar return × CDF of Vt-1 is significantly negative, and the explanatory power
is greater than that for the model in Column (a). This finding is consistent with the findings in
much agency and managerial ownership literature that the pay-performance sensitivity is
decreasing in firm market value.
Column (c) of Table 2 reports the results for the regression specification in Equation (5).
When both CDF of Vt-1 and CDF of $ Variance and their interactive terms are included, the
coefficient on CDF of Vt-1 remains significantly negative, but the coefficient on CDF of $
Variance changes sign and becomes significantly positive. This finding supports the prediction
of Demsetz and Lehn (1985) and others that firms operating in more uncertain environments find

11
it optimal to use greater ownership incentives and hence impose greater pay-performance
sensitivity on their CEOs. That is, the results in Column (c) indicate that among firms of similar
market value, there is a positive relation between risk and CEO pay-performance sensitivity.
Again, the intuition for a negative coefficient on market value is that a given amount of
fractional ownership is more costly to impose on a CEO of a large firm than a CEO of a small
firm. In untabulated results, we also find that when CDF of Vt-1 is included as a control variable
in the A&S specification that measures firm performance as percentage returns (A&S’s Table 3,
Panel B), the coefficient on the CDF of % return variance changes sign and becomes
significantly positive.
In the managerial ownership literature, the variance of dollar returns is not used as a
proxy for firm risk. Instead, the variance of percentage returns is commonly used in this
literature as a proxy for operating environment uncertainty with the prediction of a positive
relation between uncertainty and incentives. In Column (d), we substitute the CDF of % return
variance and the CDF of Vt-1 for the CDF of $ dollar variance in the specification shown in
Column (a). Equation (2) shows that the variance of percentage returns and market value can be
substituted for the variance of dollar returns in a test of the dollar returns specification of the
agency model. The positive and significant coefficient on the CDF of % return variance in
Column (d) contradicts the A&S prediction, and again indicates that among firms of similar
market value, there is a positive relation between risk and CEO pay-performance sensitivity.
In Column (e) of Table 2, we augment the regression Equation (5) to control for two
other variables that are frequently used to explain incentives in the managerial ownership litera-
ture. First, we include the market-to-book assets ratio as a proxy for growth opportunities (Smith
and Watts, 1992). Firms with higher growth opportunities are predicted to be more difficult to

12
monitor and to use higher incentives (Core and Guay, 1999). Second, we include CEO tenure
and predict a positive association with the pay-performance slope, either because more risk can
be imposed on the agent as uncertainty about his ability is resolved (Gibbons and Murphy,
1992), or because CEO wealth increases as tenure increases, and dollar incentives increase as
CEO wealth increases (Core and Guay, 1999). Finally, we include the variance of percentage
returns as a competing risk proxy with the variance of dollar returns.
We rank these additional explanatory variables and include both their interaction with
dollar return and the variable rank in the regression. Again, for parsimony, we report only the
coefficients on the interactive variables. Consistent with the predictions and findings of Core
and Guay (1999) on a similar sample of ExecuComp CEOs from 1992 to 1996, Column (e)
shows that the pay performance sensitivity is negatively associated with market value and posi-
tively associated with growth opportunities, CEO tenure, and the variance of percentage returns.
The coefficient on variance of dollar returns is insignificant in the presence of variance of per-
centage returns.5 The positive and significant coefficient on the variance of percentage returns
indicates that, controlling for market value, growth opportunities, and CEO tenure, firms with
riskier stock returns use more incentives. Consistent with the findings in Columns (c) and (d), we
find no evidence that risk is negatively associated with the pay-performance sensitivity.
What accounts for these markedly different findings when firm market value and other
controls are included in the regression? From Column (b) of Table 2, firm market value is
negatively related to the pay-performance sensitivity. Therefore, econometrically, if market
value is negatively correlated with the proxy for risk, the omission of market value from
5 If the variance of percentage returns is omitted from the regression, the coefficient on the variance of dollar returns is positive and significant. If CEO tenure and the market-to-book ratio are omitted, the coefficient on the variance of percentage returns remains positive and significant, and the variance of dollar returns remains insignificant.
13
Equation (5) results in positive bias on the implied relation between risk and pay-performance
sensitivity (i.e., positive bias on β2). If market value is positively correlated with the proxy for
risk, the omission of market value results in a negative bias on the implied relation between risk
and pay-performance sensitivity (i.e., negative bias on β2). From Columns (a) and (c) of Table 2,
the bias on β2 is shown to be negative. Given that a large body of asset pricing literature (e.g.,
Fama and French 1992) suggests a negative correlation between firm size and risk, the nega tive
bias is at first counterintuitive.
To clarify the source of this bias, we first report correlations between market value, the
variance of dollar returns, and the variance of percentage returns in Panel A of Table 3. Each
variable is constructed using the cumulative distribution function for the sample firms.
Consistent with intuition, firm market value has a negative correlation of -0.52 with the variance
of percentage returns. However, the correlation between variance of dollar returns and size is a
large and positive 0.92. This is because, by definition, holding percentage returns constant, firms
with greater market value experience larger dollar changes in shareholder value. Even though
larger firms do experience smaller variation in percentage returns, the cross-sectional variation in
dollar returns is driven primarily by firm market value. To see this, note that even if a $100
million biotechnology firm has 100% volatility, its volatility of dollar returns is equal to that of a
$1,000 million electric utility with 10% volatility.
In addition to this econometric specification issue, the economic driver of the mis-
specification is illustrated by the following derivation, which shows that the change in CEO
firm-specific wealth is primarily determined by the percentage of the firm he or she owns. We
obtain this expression by first setting all of the coefficients in Equation (5) equal to zero, except

14
for the coefficients on Dollar return and the terms interacted with Dollar return, and rearranging:
Change in CEO firm-specific wealth ≈ [β1 + β2(CDF of $ Variance) + β4(CDF of Vt-1)]× Dollar return (6)
A&S note (pg. 85) that CEO pay-performance sensitivities are primarily the result of incentives
provided by the executives' ownership of stock and stock options. That is, because the variance
of annual flow compensation is trivial compared to that of the change in the value of the CEO's
equity portfolio (see Table 1), the change in firm-specific wealth is driven primarily by the
change in the CEO's equity based wealth:
Change in CEO firm-specific wealth ≈ Change in CEO equity-based wealth (7) We also observe that the term in brackets in Equation (6) is the CEO's ownership share; that is,
the bracketed term transforms a given change in the market value of the firm into a change in the
CEO's equity-based wealth:
[β1 + β2(CDF of Dollar return variance) + β4(CDF of Vt-1)] ≈ CEO ownership share (8)
Substituting Equations (7) and (8) into Equation (6) yields:
Change in CEO equity-based wealth ≈ CEO ownership share × Dollar Return (9)
The CEO ownership share has been the focus of considerable research in the managerial
ownership literature. As stated above, researchers have consistently found that the CEO's
ownership share is a decreasing function of market value (β4 < 0) and have generally found it to
be an increasing function of firm uncertainty (β2 > 0).6 The A&S empirical framework implicitly
models the CEO ownership share solely as a function of firm risk, i.e., β4 is restricted to equal 0.
6 Counterexamples include the following: In the presence of a number of other proxies for monitoring costs and managerial discretion, Himmelberg, Hubbard, and Palia (1999) find a negative relation between percentage return volatility and percentage equity ownership. Holderness, Kroszner and Sheehan (1999) use a regression specification similar to Demsetz and Lehn (1985), and find the striking contrasts of a significant negative (positive) relation be-tween percentage return volatility and percentage equity ownership in 1935 (1995) for managers of New York stock exchange firms.

15
In Panel B of Table 3, we show why these two models yield different inferences by
estimating the relation between CEO ownership share and market value and risk. Our measure of
the CEO ownership share includes both stock and option holdings. The CEO's portfolio of
options are converted to equivalent common shares using the option "delta" as described in
Jensen and Murphy (1990) and Yermack (1995). For example, the typical executive stock option
increases in value by about $0.70 for each $1.00 change in the stock price, so that this option
provides equity incentives equivalent to 0.70 shares of stock.7 As in Table 2, we estimate the
relation between CEO ownership share and market value and risk with median regressions, and
calculate standard errors using 20 replications of the bootstrap procedure in Gould (1992).
When CEO ownership share is regressed on either market value or the variance of dollar
returns alone, the inferred relation is negative and significant. However, similar to the findings
in Table 2, when size and risk are both included in the regression, the coefficient on risk changes
sign and becomes significantly positive. This finding confirms the positive relation between
share ownership and risk documented in previous research.
IV. Conclusion
In this paper, we reconcile contrasting empirical findings documented by managerial
ownership researchers and those of A&S (1999) on the relation between firm risk and the pay-
performance sensitivity in CEO contracts. The principal-agent theory employed by A&S yields a
comparative static prediction for a negative relation between this sensitivity and risk. However,
because this theory assumes that the CEO has no private information about potential projects and
no discretion over projection selection, it excludes important determinants of CEO incentives
documented in the managerial ownership literature. In addition, A&S employ two very
7 We compute the delta of the CEO's option portfolio using the method described in Core and Guay (2001) under the assumption that the expected time-to-exercise is 70% of the each option's stated maturity.

16
restrictive assumptions about how CEO marginal product increases with firm market value. Prior
empirical evidence does not support these restrictions and suggests that market value should be
included as a control in a test of the principal-agent model. Using a parsimonious model of CEO
incentives that includes market value and risk as explanatory variables, we find that the pay-
performance sensitivity does not vary as predicted by A&S. Instead, our results are consistent
with Demsetz and Lehn's (1985) prediction that controlling for market value, there is an
increasing relation between risk and ownership incentives.
We do not conclude that the principal-agent model's prediction of a decreasing relation
between risk and incentives is not descriptive of CEO incentives. Rather, we suggest that more
research is necessary to demonstrate this trade-off. Although most empir ical research to date
finds a positive relation between risk and managerial ownership, there are exceptions such as
Himmelberg, Hubbard, and Palia (1999). That we have an incomplete understanding of this
relation is well illustrated by Holderness, Kroszne r and Sheehan (1999), who find in regression
models similar to those of Demsetz and Lehn (1985), that risk was negatively (positively)
associated with the ownership of executives in New York stock exchange firms in 1935 (1995).
Complicating this exploration is the fact that a firm's information environment is a choice
variable, and firms face a trade-off between the level of information that helps it raise capital and
the level of information that is best for contracting purposes (Baiman and Verrecchia 1996;
Burkart, Gromb, and Panunzi 1997). Exploring and understanding how firm characteristics
interact to determine managerial incentives will enhance our understanding of how executive pay
arrangements are jointly determined with other elements of corporate governance and corporate
finance.

17
References
Aggarwal, Rajesh K., and Samwick, Andrew A. "The Other Side of the Trade-Off: The Impact
of Risk on Executive Compensation." Journal of Political Economy 107 (February 1999):
65-105.
Baiman, Stanley, and Verrecchia, Robert. "The Relation among Capital Markets, Financial Dis-
closure, Production Efficiency, and Insider Trading." Journal of Accounting Research 34
(Spring 1996): 1-22.
Baker, George P. and Hall, Brian J. "CEO Incentives and Firm Size." NBER Working paper
6868 (1998).
Black, Fischer, and Scholes, Myron. "The Pricing of Options and Corporate Liabilities." Journal
of Political Economy 81 (May/June 1973): 637-654.
Burkart, Mike; Gromb, Denis; and Panunzi, Fausto. "Large Shareholders, Monitoring, and the
Value of the Firm." The Quarterly Journal of Economics 112 (August 1997): 693-728.
Bushman, Robert; Chen, Qi; Engel, Ellen; and Smith, Abbie. "The Sensitivity of Corporate
Governance Systems to the Timeliness of Accounting Earnings." Manuscript. University
of Chicago (2000).
Cho, Myeong-Hyeon. "Ownership Structure, Investment, and the Corporate Value: An Empirical
Analysis." Journal of Financial Economics 47 (January 1998): 103-121.
Core, John, and Guay, Wayne. "The Use of Equity Grants to Manage Optimal Equity Incentive
Levels." Journal of Accounting & Economics 28 (December 1999): 151-184.
Core, John, and Guay, Wayne. "Estimating the value of stock option portfolios and their
sensitivities to price and volatility." Journal of Accounting Research, forthcoming (2001).

18
Demsetz, Harold, and Lehn, Kenneth. "The Structure of Corporate Ownership: Causes and
Consequences." Journal of Political Economy 93 (December 1985): 1155-1177.
Fama, Eugene F., and French, Kenneth R . "The Cross-Section of Expected Stock Returns." The
Journal of Finance 47 (June 1992): 427-465.
Gould, W. W. "Quantile Regression with Bootstrapped Standard Errors" Stata Technical Bulletin
9. College Station, Texas: Stata Press (1992): 19-21.
Haubrich, Joseph G. "Risk Aversion, Performance Pay, and the Principal-Agent Problem."
Journal of Political Economy 102 (April 1994): 258-276.
Himmelberg, Charles P.; Hubbard, Glenn R.; and Palia, Darius. "Understanding the
Determinants of Managerial Ownership and the Link between Ownership and
Performance." Journal of Financial Economics 53 (September 1999): 353-384.
Holderness, Clifford G.; Kroszner, Randall S.; and Sheehan, Dennis P. "Were the Good Old
Days That Good? Changes In Managerial Stock Ownership Since The Great Depression."
Journal of Finance 54 (April 1999): 435-469.
Holmstrom, Bengt. "Contracts and the Market for Executives: Comments." In Contract
Economics, edited by Lars Werin and Hans Wijkander (Cambridge, MA: Blackwell,
1992): 212-217.
Holmstrom, Bengt, and Milgrom, Paul. "Aggregation and Linearity in the Provision of
Intertemporal Incentives." Econometrica 55 (March 1987): 303-328.
Holthausen Robert W., and Larcker, David F. "Organizational Structure and Firm Performance."
Manuscript. University of Pennsylvania (1993).

19
Jensen, Gerald R.; Solberg, Donald P.; and Zorn, Thomas S. "Simultaneous Determination of
Insider Ownership, Debt, and Dividend Policies." Journal of Financial & Quantitative
Analysis 27(June 1992): 247-263.
Jensen, Michael C., and Murphy, Kevin J. "Performance Pay and Top-management Incentives."
Journal of Political Economy 98 (April 1990): 225-264.
Loderer, Claudio, and Martin, Kenneth. "Executive Stock Ownership and Performance: Tracking
Faint Traces." Journal of Financial Economics 45 (August 1997): 223-255.
Palia, Darius. "The Endogeneity of Managerial Compensation in Firm Valuation: A Solution."
The Review of Financial Studies 14 (Fall 2001): 735-764.
Prendergast, Canice. "The Tenuous Trade-off of Risk and Incentives," Manuscript. University of
Chicago (2000a).
Prendergast, Canice. "What Trade-off of Risk and Incentives," American Economic Review,
Papers and Proceedings 90 (May, 2000b): 421-425.
Rosen, Sherwin "Contracts and the Market for Executives" edited by Lars Werin and Hans
Wijkander (Cambridge, MA: Blackwell, 1992):181-211.
Schaefer, Scott. "The Dependence of Pay-Performance Sensitivity on the Size of the Firm" The
Review of Economics and Statistics 80 (August 1998) 436-443.
Smith, Clifford J., and Watts, Ross L. "The Investment Opportunity Set and Corporate
Financing, Dividends, and Compensation Policies." Journal of Financial Economics 32
(December 1992): 263-292.
Yermack, David. "Do Corporations Award CEO Stock Options Effectively?" Journal of
Financial Economics 39 (October/November 1995): 237-269.
20
TABLE 1
A. Chief Executive Officers - Measures of Executive Compensation, 1995
n Mean Median Minimum Maximum
Flow compensation 1,342 2,211 1,266 0 63,479
Change in firm-specific wealth 1,301 21,937 3,175 -106,815 5,691,438
Excluding existing options 1,304 19,231 2,092 -104,595 5,691,438
B. Chief Executive Officers - Ownership of Stock and Stock Options, 1995
Percentage Who Own
Conditional Mean
Conditional Median
Maximum
Wealth in firm stock 98.00% 63,992 4,464 16,039,445
Options on firm stock 82.19% 7,067 2,204 319,600
Current option grants 68.03% 1,237 520 45,951
Sample consists of ExecuComp data for CEOs for 1995. All dollar amounts are in thousands ($000s) and have been converted to 1995 dollars using the consumer price index at December 31, 1995. Flow compensation is the sum of salary, bonus, long-term incentive plan payouts, the value of restricted stock grants, the value of options granted during the year, and any other annual pay. Total compensation is the sum of total pay and the change in the value of the CEO's stock and option portfolio. The change in firm-specific wealth is flow compensation plus the estimated change in value of stock and optionholdings. To compute the change in the CEO's stock portfolio during the year, we multiply the beginning of the year value by the firm's real return for the year. We follow A&S (1999) and com-pute the change in the CEO's option portfolio as the difference between the extent to which the portfolio is in -the-money at the end of the year and the beginning of the year. Stockholdings is the value of the CEO's common stock at the end of the year, and option holdings is the extent to which the portfolio is in-the-money at the end of the year.

21
TABLE 2
Median Regressions of CEO Change in Firm-specific Wealth on Dollar Returns
Dependent Variable: Change in Firm-specific Wealth
(a) (b) (c) (d) (e)
Dollar return 26.75
(34.22) 30.48
(35.22) 30.74
(30.33) 21.67
(11.87) 20.24 (5.85)
Dollar return × CDF of $ Variance -25.63 (-30.83)
7.37 (1.91)
-4.03 (-0.72)
Dollar return × CDF of Vt-1 -29.53 (-33.83)
-37.15 (-8.17)
-23.40 (-14.41)
-19.19 (-2.47)
Dollar return × CDF of Market-to-Book Ratio
3.53 (3.14)
Dollar return × CDF of CEO tenure 6.22 (5.71)
Dollar return × CDF of % Variance 45.27 (5.14)
50.94 (2.37)
Pseudo R2 8.78% 9.28% 9.34% 9.86% 11.51%
The sample consists of 4,812 CEO-year observations from ExecuComp for 1993 to 1996. t-statistics (in parentheses) are calculated using 20 replications of the bootstrap procedure in Gould (1992). Coefficients on the intercept and three year indicator variables not shown. All dollar amounts are in $thousands ($000s) and have been converted to 1995 dollars using the consumer price index at December 31, 1995. The change in firm-specific wealth is flow compensation plus the estimated change in value of stock and optionholdings. To compute the change in the CEO's stock portfolio during the year, we multiply the beginning of the year value by the firm's real return for the year. We follow A&S (1999) and compute the change in the CEO's option portfolio as the difference between the extent to which the portfolio is in-the-money at the end of the year and the beginning of the year. Dollar return for the year is the firm's beginning of period market value of equity multiplied by the firm's real (net of inflation) percentage return for the year. $ variance (% variance) refers to the variance of dollar (percent) returns. We compute these return variances with a time series of no less that 48 months and no more than 60 months of returns ending the month prior to the fiscal year in which compensation is determined. Vt-1 refers to the market value of the firm's equity at the beginning of the year. The Market-to-Book ratio refers of the ratio of the market value of the firm's assets to the firm's book value of assets at the beginning of the year. CEO tenure is the number of years the CEO has served as CEO measured at the beginning of the year. We compute the cumulative distribution function (CDF) by ranking the observations, and then transforming the ranks so that they lie uniformly between zero and one. The CDF values of zero and one correspond to the smallest and largest variances of dollar returns (market values) in our sample.

22
TABLE 3
A. Correlations between Dollar Return Variance, Market Value and Percentage Return Variance CDF of Dollar
Return Variance
CDF of Market Value CDF of Percentage
Return Variance CDF of $ Variance 1.00
CDF of Market Value 0.92 1.00
CDF of % Variance -0.30 -0.52 1.00
B. Median regressions of CEO ownership share on Market Value and Dollar Return Variance
CEO Ownership Share
(a) (b) (c)
CDF of Dollar Return Variance -2.60
(-19.66) 2.06
(7.34)
CDF of Market Value -2.98 (-22.71)
-5.00 (-16.52)
Pseudo R2 5.16% 6.81% 7.21%

23
The sample consists of 4,812 CEO-year observations from ExecuComp for 1993 to 1996. t-statistics (in parentheses) are calculated using 20 replications of the bootstrap procedure in Gould (1992). Coefficients on the intercept and three year indicator variables not shown. All dollar amounts have been converted to 1995 dollars using the consumer price index at December 31, 1995. The CDF of dollar return (percentage return) variance refers to the CDF of the variance of dollar returns (percentage returns). We compute the variance of monthly dollar returns (percentage re-turns) by using a time series of no less that 48 months and no more than 60 months of returns ending the month prior to the fiscal year in which compensation is determined. The CDF of market value refers to the CDF of the market value of the firm's equity at the beginning of the year. We compute the cumulative distribution function (CDF) by ranking the observations, and then transforming the ranks so that they lie uniformly between zero and one. The CDF values of zero and one correspond to the smallest and largest variances of dollar returns (market values) in our sam-ple. CEO ownership share is equivalent shares owned by the CEO divided by total shares outstanding. CEO option holdings are converted to equivalent common shares using the option "delta" as described in Jensen and Murphy (1990) and Yermack (1995). CEO ownership value is equal to the total of the value of the CEO's common stock at the end of the year and the extent to which the option portfolio is in -the-money at the end of the year.