Embed Size (px)
Citation preview

The other 1%: Class Leavening, Contamination and Voting for Redistribution
Lars Lefgren
David Sims
Olga Stoddard*
December 2016
Abstract
We perform an experiment to measure how changes in the effort exerted by a small fraction of a low-reward group affect the willingness of the high-reward group to vote for redistributive taxation. We find that a substantial fraction of high reward subjects vote in favor of greater redistribution when a very small fraction of high-effort individuals is added to a pool of otherwise low-effort poor. Also, contaminating a group of high-effort poor with a small number of low-effort individuals causes the most generous rich subjects to vote for less redistribution. These results suggest that anecdotes about the deservedness of a small group of transfer recipients may be effective in changing support for redistribution. We find large gender differences in the results. Relative to men, women respond three times more strongly to the existence of deserving individuals among the poor. This behavior may help explain gender differences in support for redistribution more generally.
* Department of Economics, 130 FOB, Provo UT 84602. The authors may be reached at [email protected], [email protected], and [email protected]. The authors thank Rebecca Jack for excellent research assistance. We acknowledge helpful comments and suggestions from Scott Condie, Gordon Dahl, Laura Gee, and seminar participants at Brigham Young University.
2
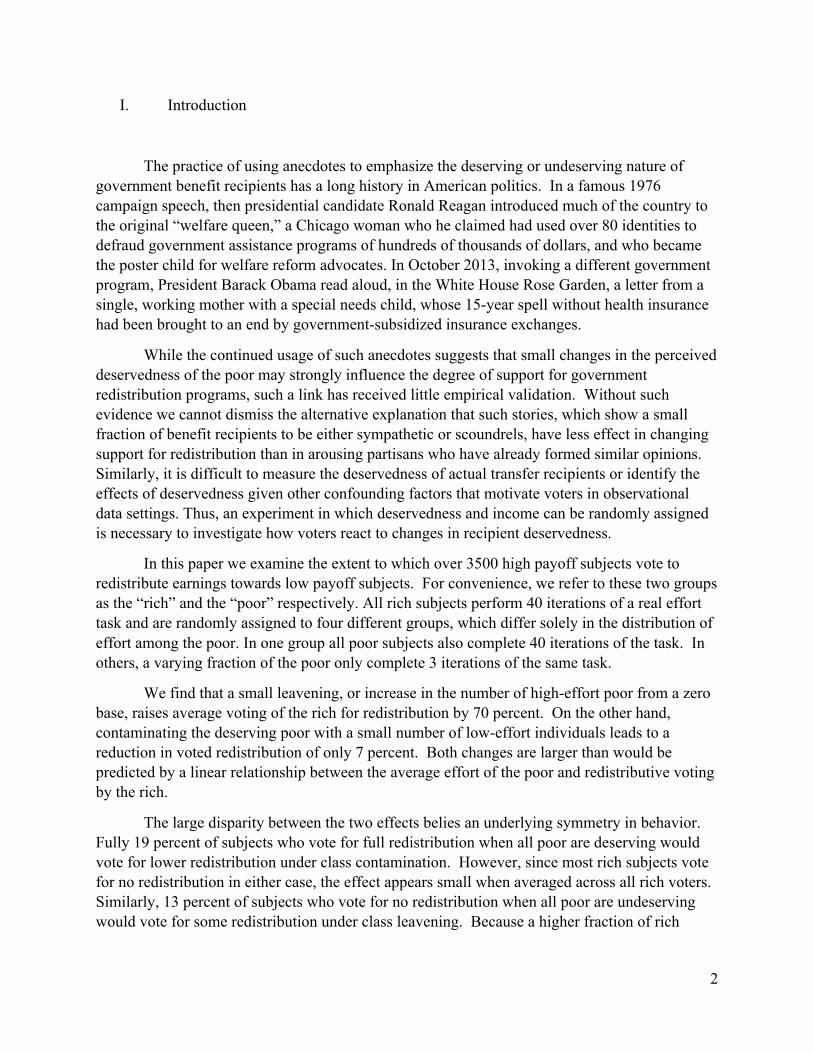
I. Introduction
The practice of using anecdotes to emphasize the deserving or undeserving nature of government benefit recipients has a long history in American politics. In a famous 1976 campaign speech, then presidential candidate Ronald Reagan introduced much of the country to the original “welfare queen,” a Chicago woman who he claimed had used over 80 identities to defraud government assistance programs of hundreds of thousands of dollars, and who became the poster child for welfare reform advocates. In October 2013, invoking a different government program, President Barack Obama read aloud, in the White House Rose Garden, a letter from a single, working mother with a special needs child, whose 15-year spell without health insurance had been brought to an end by government-subsidized insurance exchanges.
While the continued usage of such anecdotes suggests that small changes in the perceived deservedness of the poor may strongly influence the degree of support for government redistribution programs, such a link has received little empirical validation. Without such evidence we cannot dismiss the alternative explanation that such stories, which show a small fraction of benefit recipients to be either sympathetic or scoundrels, have less effect in changing support for redistribution than in arousing partisans who have already formed similar opinions. Similarly, it is difficult to measure the deservedness of actual transfer recipients or identify the effects of deservedness given other confounding factors that motivate voters in observational data settings. Thus, an experiment in which deservedness and income can be randomly assigned is necessary to investigate how voters react to changes in recipient deservedness.
In this paper we examine the extent to which over 3500 high payoff subjects vote to redistribute earnings towards low payoff subjects. For convenience, we refer to these two groups as the “rich” and the “poor” respectively. All rich subjects perform 40 iterations of a real effort task and are randomly assigned to four different groups, which differ solely in the distribution of effort among the poor. In one group all poor subjects also complete 40 iterations of the task. In others, a varying fraction of the poor only complete 3 iterations of the same task.
We find that a small leavening, or increase in the number of high-effort poor from a zero base, raises average voting of the rich for redistribution by 70 percent. On the other hand, contaminating the deserving poor with a small number of low-effort individuals leads to a reduction in voted redistribution of only 7 percent. Both changes are larger than would be predicted by a linear relationship between the average effort of the poor and redistributive voting by the rich.
The large disparity between the two effects belies an underlying symmetry in behavior. Fully 19 percent of subjects who vote for full redistribution when all poor are deserving would vote for lower redistribution under class contamination. However, since most rich subjects vote for no redistribution in either case, the effect appears small when averaged across all rich voters. Similarly, 13 percent of subjects who vote for no redistribution when all poor are undeserving would vote for some redistribution under class leavening. Because a higher fraction of rich

3
voters are able to increase their vote than decrease it, this change has a sizable effect on the average voted level of redistribution among the rich.
We outline two theoretical frameworks for the observed behavior. The first explanation relies on Prospect Theory, in which voters overweight small fractions and probabilities in decision-making. This can lead to large individual responses to very small changes in the composition of deservedness. Alternatively, we can rationalize the findings with a simple neoclassical framework in which voters’ utility depends disproportionately on the most or least deserving members of a class. We discuss ways for future researchers to distinguish between these two frameworks.
We find striking differences between the voting patterns of men and women. When a small number of the poor increase their effort from low to high, the fraction of rich women voting for redistribution almost doubles, and the fraction of rich women voting for full redistribution to the poor triples. This effect works in the same direction as the response from men, but is much larger in magnitude. By comparison, we find only small, insignificant differences in the voting behavior of men and women when we contaminate a group of high-effort poor with a small percentage of low effort individuals.
Thus, our results contribute to both the literature on how effort differences between reward groups influence preferences for redistribution, and the related literature that attempts to understand gender differences in redistributive preferences. Prior experimental evidence examining how the deservedness of the poor affects redistribution only considers two extreme cases: one in which all income disparities are due to effort or skill and the second in which disparities are purely randomly determined. To our knowledge, there is no experimental literature that examines gender differences in how individuals change redistribution in response to perceived deservedness.
Our findings are important because they help explain how very small differences in perceptions about the causes of income disparities can lead to large changes in the level of popular support for redistribution. While there is a literature that establishes that differences in national beliefs about the deservedness of income disparities can lead to separate equilibria with widely varying levels of redistribution (Alesina and Angeletos 2005, Benabou and Tirole 2006), much less is known about the stability of such beliefs or how they translate to personal decisions. Our results suggest that a particular individual level of support for redistribution can be quite sensitive to perceived effort levels, and perhaps more generally, deservedness of the poor. They also suggest that the broad general equilibrium story told in country-level models is founded on empirically verifiable microeconomic behavior, albeit outside a general equilibrium setting. Thus, we conclude that anecdotes about the deservedness of small numbers of the poor might matter a great deal in both the politics and economics of redistribution.
Our findings may also offer insights into other policy areas where public support for controversial policies may show discontinuous jumps. For example, support for refugee resettlement may sharply diminish when a very small proportion of potential refugees are anecdotally implicated as criminals, or may increase following the media portrayal of a

4
particularly sympathetic refugee. Similarly, attitudes towards police could be quite sensitive to comparatively infrequent instances of police brutality which are highly publicized.
Prior studies document that women support higher levels of redistribution than men both in real world voting and in laboratory experiments (Besley and Case, 2002; Alessina and LaFerrrera, 2005; Schildberg-Hörisch, 2010). However, the literature has yet to agree on a parsimonious set of explanations for these differences. Some emphasize explanations where women hope to gain a larger share of increased transfer payments and government jobs (Lott and Kenney, 1999). Others emphasize the role of redistribution as a transfer or insurance policy in response to a decline in marriage rates (Edlund and Pande, 2002; Edlund, Pande, and Haider 2005). Still others suggest that gender-specific differences in fundamental preferences over the welfare of certain parties may explain gender differences in support for redistribution (Alessia and Giuliano 2009). Our experimental results support a model in which women’s preferences appear to depend disproportionately on the well-being of the most deserving individuals within a population. Thus, our findings provide an important insight into understanding gender differences in preferences for redistribution.
The remainder of this paper proceeds as follows: Section 2 briefly introduces the background literature and our experiment, Section 3 presents and discusses the results, Section 4 shows how the results can be interpreted in either a neoclassical or behavioral framework, and Section 5 concludes.
II. The Experiment
A. Background
This study highlights the importance of small changes in the effort distribution among the poor for the voting behavior of the rich. In approaching this question, we build on two important strands of the experimental economics literature on redistributive preferences. First, experimental economists have repeatedly shown that subjects are more willing to redistribute to those that they feel have exerted similar effort to their own but were unlucky, than to a group that has demonstrated relatively less effort or skill. This result has been observed in a variety of settings including dictator, ultimatum and public goods games (Balafoutas, Kocher, Putterman and Sutter 2013, Carlsson, He and Martinsson 2012, Cherry, Frykblom and Shogren 2002, Erkal, Gangadharan and Nikiforakis 2011, Hoffman, McCabe, Shachat and Smith 1994). More recently the literature has extended this insight to situations that involve group voting over redistribution. In particular, both Krawczyk (2010) and Gee, Migueis and Parsa (2015) show that there is less voting for redistribution in situations where reward disparities match with skill or effort differences rather than being driven by luck. Finally, Lefgren, Sims and Stoddard (2016) show that both rich and poor voters favor more redistribution when everyone exerts equal effort than when the rich exert more effort than the poor.

5
With one exception, however, this literature considers cases where low reward individuals are uniformly and easily classifiable in terms of relative effort. In other words, it validates the prediction that rich voters will treat identifiable groups of entirely high-effort poor more generously than groups entirely composed of low-effort poor. In real life situations, however, voters often choose how much to redistribute to the poor, recognizing that there is a distribution of effort within that group. While this literature can also explain the high levels of support for policies that contain self-revelatory mechanisms designed to separate the poor into effort groups (e.g. the EITC), such distinctions are often impossible to make, either as a matter of policy or at the time of voting. Thus, our experiment seeks to test whether the support of high reward voters for redistribution is responsive to small changes in the distribution of deservedness (effort) for the low reward group from the two extremes.
A graphical representation of some possible outcomes can be seen in Figure 1. The horizontal axis shows the fraction of the poor that exert a high effort level—a level of effort identical to that of the rich in the experiment—while the vertical axis measures the level of redistributive voting by the rich. The key findings of the literature to date can be represented by points A and F. The rich will vote for much lower levels of redistribution to a group of entirely low-effort poor (A) than to a group solely made up of higher-effort poor (F). When presented with a discernable distribution of effort levels, a simple, statistical response might be to linearly vary support for redistribution according to the proportion of deserving poor. This would produce a weighted average represented by the line in Figure 1. Thus, a group that consisted of half deserving poor would see the rich vote for redistribution at a midpoint, in this case point D.
While this simple weighting may provide a useful baseline hypothesis, it is possible that voters could react in other ways. One particular alternative, which we refer to as the class leavening hypothesis, would be that voters react more strongly to a small improvement in an otherwise undeserving class of poor than a linear relationship would predict. Such a response might happen if voters have strong preferences concerning the consumption or rewards of the most deserving poor individuals or if voters treated small fractions of a group as if they were much larger. In this scenario, we would expect to see behavior represented by a point such as B. At this point, the presence of a relatively small number of high-effort individuals causes a more than proportionate increase in redistribution. On the other hand, a point such as E would represent the opposite phenomenon, which we refer to as class contamination. Here, the existence of a relatively small number of low-effort poor leads to a disproportionately large decrease in support for redistribution among the rich.
To this point the only study that provides significant results about voting behavior of the rich when the poor demonstrate a known, non-degenerate distribution of effort levels is Lefgren, Sims and Stoddard (2016). In one of their treatments the rich are allowed to vote for redistribution to a group of poor subjects that is equally split between high and low effort individuals. Though this is not the focus of their study, we can use their results to calculate an additional point on Figure 1. Interestingly, subjects in this experiment voted for more redistribution that a linear relationship would predict, something much more like point C than point D. However, even this study only provides information about behavior in the center of

6
Figure 1, when the two effort classes are evenly mixed. To provide evidence regarding how voters respond to small changes in composition, we need to construct a dataset that is much larger than most laboratory experiments to identify differences in voting behavior that are smaller than when comparing starkly different pools.
Our experiment uses online delivery and the large samples made available through the online Amazon Mechanical Turk (MTurk) platform to allow us to test the class contamination and leavening hypotheses. We look at how the support of the rich for redistribution changes when we make small deviations in the fraction of the poor that are high-effort. Indeed, we make these deviations even smaller than those shown in Figure 1, and highlight the substantial impact of the 1% of poor who differ from an otherwise homogenous deserving or undeserving class on the voting behavior of the rich.
The second empirical foundation for our study is the commonly cited result in experimental economics that women support higher levels of redistribution than men under a variety of conditions (Alesina and Giuliano 2009, Durante, Putterman and Weele 2014, Eckel and Grossman 1998, Kamas and Preston 2015). There are several hypotheses about the mechanisms underlying this gender difference, but no consensus view on which are most important. For example, the experimental literature is often unable to distinguish between mechanisms which rely on general inequity aversion as opposed to a specific distaste for undeserved inequality or a lack of proportionality in rewards. This study provides more insight into an area where the gender difference is especially pronounced, suggesting that women are more sensitive to the existence of unfairness, meaning a lack of rewards proportional to effort, even when it affects a very small group.
B. Experimental Design
Our experiment consists of two parts, both of which are explained to the subjects during the initial instructions stage. We include multiple comprehension checks throughout the experiment to ensure the subjects understand the instructions. In part 1, each subject has to encode four-letter words into numbers given a table that provides a random number for each of the letters of the alphabet. This encoding task was first introduced in an experiment designed to elicit subject effort, by Erkal, Gangadharan and Nikiforakis (2011). The task has been found to be both gender neutral (Kuhn and Villeval 2015) and free from learning by doing effects (Charness, Masclet and Villeval 2013).
Each treatment in the experiment has high-payoff individuals, the rich, who are randomly assigned to encode 40 words correctly for a payment of $3. Each treatment also has low-payoff individuals, the poor, who are all randomly assigned a payment of $1. There is variation in the number of words the poor are assigned to encode, both within and across treatments, as follows:
Treatment 1 (All deserving): All subjects were assigned to encode 40 words correctly, with some randomly assigned to receive $3 and the others assigned to receive $1.
7
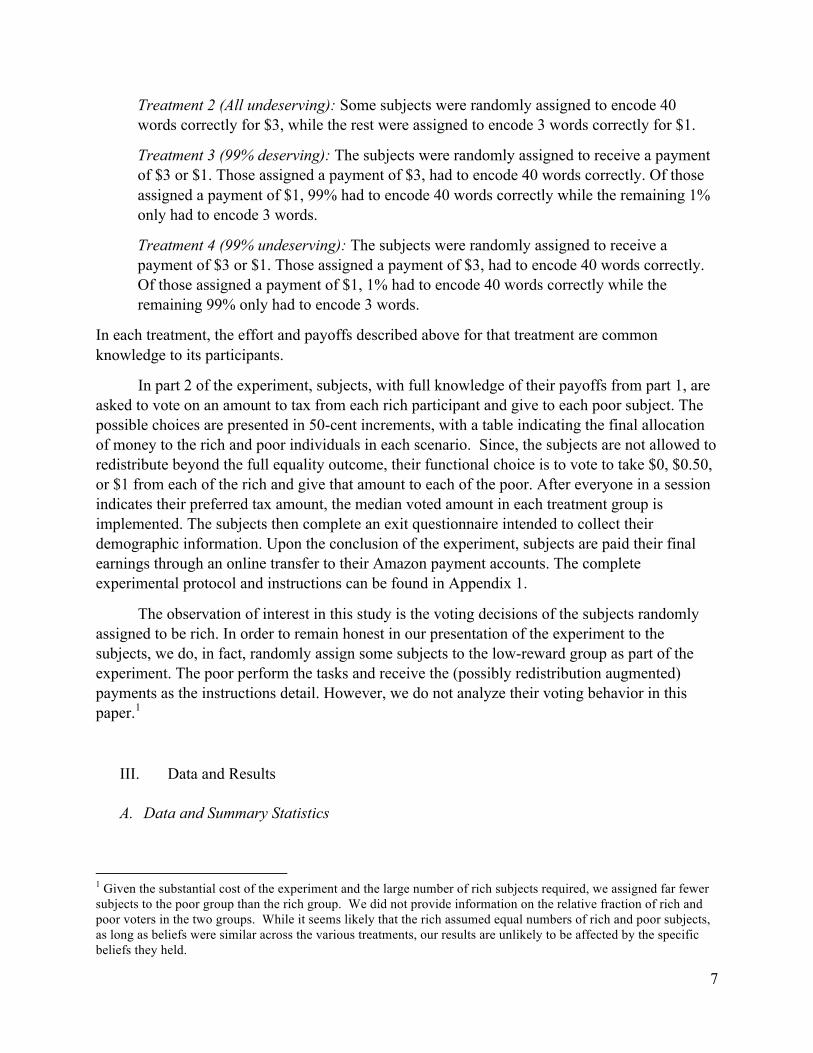
Treatment 2 (All undeserving): Some subjects were randomly assigned to encode 40 words correctly for $3, while the rest were assigned to encode 3 words correctly for $1.
Treatment 3 (99% deserving): The subjects were randomly assigned to receive a payment of $3 or $1. Those assigned a payment of $3, had to encode 40 words correctly. Of those assigned a payment of $1, 99% had to encode 40 words correctly while the remaining 1% only had to encode 3 words.
Treatment 4 (99% undeserving): The subjects were randomly assigned to receive a payment of $3 or $1. Those assigned a payment of $3, had to encode 40 words correctly. Of those assigned a payment of $1, 1% had to encode 40 words correctly while the remaining 99% only had to encode 3 words.
In each treatment, the effort and payoffs described above for that treatment are common knowledge to its participants.
In part 2 of the experiment, subjects, with full knowledge of their payoffs from part 1, are asked to vote on an amount to tax from each rich participant and give to each poor subject. The possible choices are presented in 50-cent increments, with a table indicating the final allocation of money to the rich and poor individuals in each scenario. Since, the subjects are not allowed to redistribute beyond the full equality outcome, their functional choice is to vote to take $0, $0.50, or $1 from each of the rich and give that amount to each of the poor. After everyone in a session indicates their preferred tax amount, the median voted amount in each treatment group is implemented. The subjects then complete an exit questionnaire intended to collect their demographic information. Upon the conclusion of the experiment, subjects are paid their final earnings through an online transfer to their Amazon payment accounts. The complete experimental protocol and instructions can be found in Appendix 1.
The observation of interest in this study is the voting decisions of the subjects randomly assigned to be rich. In order to remain honest in our presentation of the experiment to the subjects, we do, in fact, randomly assign some subjects to the low-reward group as part of the experiment. The poor perform the tasks and receive the (possibly redistribution augmented) payments as the instructions detail. However, we do not analyze their voting behavior in this paper.1
III. Data and Results
A. Data and Summary Statistics
1 Given the substantial cost of the experiment and the large number of rich subjects required, we assigned far fewer subjects to the poor group than the rich group. We did not provide information on the relative fraction of rich and poor voters in the two groups. While it seems likely that the rich assumed equal numbers of rich and poor subjects, as long as beliefs were similar across the various treatments, our results are unlikely to be affected by the specific beliefs they held.

8
We obtain our experimental sample from MTurk, an online labor market that has shown promise as a platform for experimental economic research, including experiments about preferences for redistribution (Horton, Rand and Zeckhauser 2011, Kuziemko, Norton and Saez 2015).2 Respondents follow a hyperlink to our experiment, which is housed on Qualtrics and programmed using Javascript. Subjects are free to drop out at any time during the experiment but are only paid upon completion. The experiment take an average of 15 minutes to complete. The average payment to MTurk participants who completed the experiment was close to $3.
In response to our request for participation, 4230 MTurk workers chose to participate in the experiment and passed our sample validation procedures, which are as follows: First, we restrict the survey to workers who reside in the U.S. and ask the respondents to confirm their residency.3 Second, we implement a prescreening measure in order to prevent MTurkers from completing the experiment more than once. Finally, we include a CAPTCHA feature to exclude non-human participants. Once the experiment started, 15% of the subjects that were randomized to treatment dropped out before completing the voting task, leaving us with an analysis sample of 3577 completers. Regression analyses find no statistical relationship between dropping out and the treatment assignment of the subject.
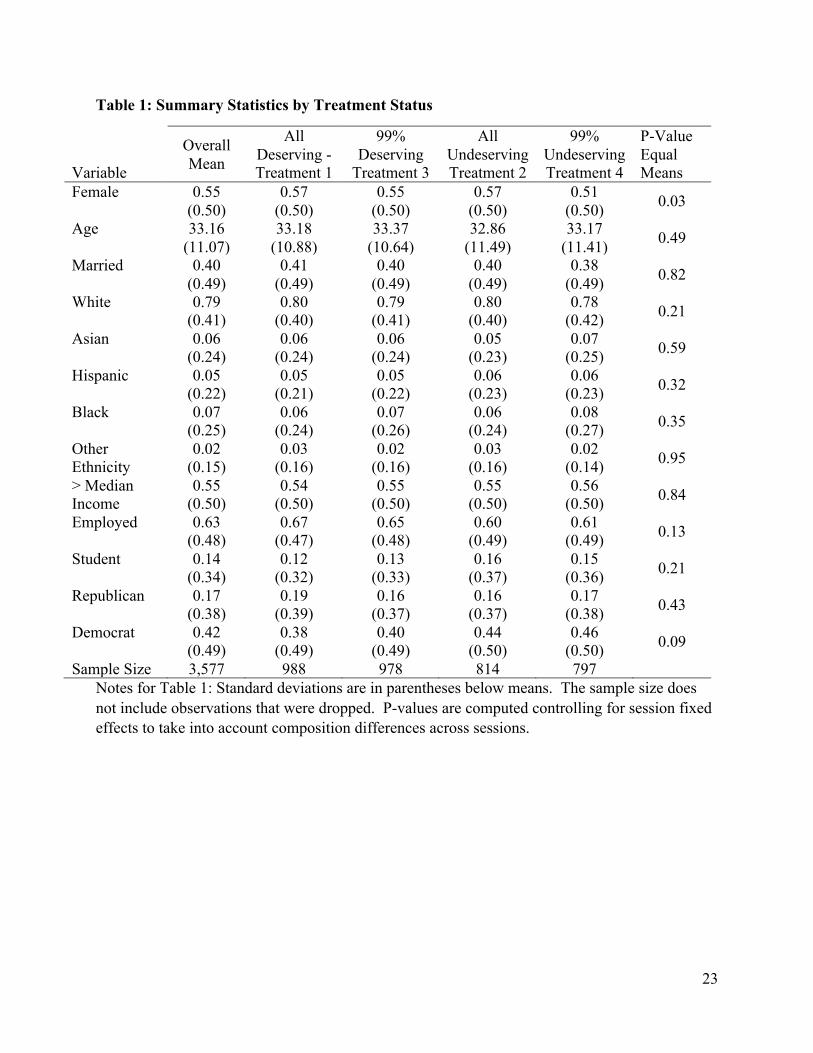
We present the descriptive statistics for each treatment in Table 1 as well as statistics for the overall group. As might be expected from a group recruited via computer through a service maintained by a large internet retailer, the group as a whole is relatively younger on average (age 33 years) than the U.S voting-age population as a whole. Additionally, relative to the U.S. voting-age population, blacks and Hispanics are underrepresented in the sample while Asians and whites are overrepresented. More importantly, perhaps, for an experiment about voting over redistribution, the group also appears to have a much higher proportion of subjects that self-identify with the Democratic party and a much lower proportion that identify with the Republican party than in the U.S. voting-age population. These distributions hold true as we examine each treatment individually as well.4
In presenting the further columns of Table 1, we have ordered the treatments to make the most relevant comparisons salient. This ordering is also relevant as sample sizes for Treatments 1 and 3 should be considered as a pair, as should treatments 2 and 4. Due to the higher donation rates in the cases in which subjects are overwhelmingly deserving, the standard errors on the mean voting rates and corresponding differences in these rates are higher for Treatments 1 and 3. Consequently, we oversampled these treatments.
The final column of the table tests the success of the randomization by looking for differences in demographic measures across the randomly assigned treatment groups. Specifically, it presents p-values for the joint test of equality across the four treatment group 2 Lefgren, Sims, and Stoddard (2016) discuss the costs and benefits of MTurk samples versus traditional laboratory samples in greater detail. 3 To discourage foreign workers even further, our survey was launched during the normal business hours of US EST. 4 Lefgren, Sims, and Stoddard (2016) were able to replicate the results of their redistributive voting experiment from MTurk in an outside sample with much more conservative political leanings, suggesting that this sample need not produce unusual results.

9
means for each variable. In thirteen tests we find one characteristic where we reject the hypothesis of a common average across all treatment groups at the five-percent level (male/female), and one where we reject group mean equality at the ten percent level (Democratic identification). These equality test results are in line with what we would expect from a successful randomization, however we also present covariate-adjusted results in our analysis tables as a demonstration of robustness.
B. Baseline Results
The central aim of this paper is to investigate the class leavening and contamination hypotheses. Specifically, do the rich subjects respond more when faced with small deviations in the composition of an otherwise homogenous class of deserving or undeserving poor than a linear prediction would suggest. We are able to explore this question because we have both a large experimental sample and because we randomly assign effort. This contrasts with almost all prior redistribution voting experiments where subjects play in contests or tournaments, and the experimenters are thus unable to guarantee that fine distinctions in effort or skill will manifest themselves in the experiment. And the distinctions we make are very fine, with only one percent of the poor changing their effort level in Treatments 3 or 4 from the two baseline treatments.
One graphical representation of our main results can be found in Figure 2. This figure has a layout analogous to figure 1, except now it presents our actual findings rather than the hypotheticals and results from the previous literature shown in the first figure. As before, the horizontal axis represents the fraction of the poor in each treatment that exerted the same effort as the rich, while the vertical axis shows the average amount the rich in that scenario voted to redistribute to the poor. Treatments 1 and 2 present the extreme situations where the poor are entirely high effort or low effort respectively.
As in prior experiments (Lefgren, Sims and Stoddard 2016), we find that the rich vote for much higher redistribution to the high effort poor, almost three times as much, than to the low-effort poor. We note, however, that the voted level of redistribution is still far from a level that would achieve equality ($1.00). The graph also suggests evidence of the class leavening and contamination phenomena at work. In both cases, one percent alterations in the number of the poor that are high effort appear to change voting for redistribution more than predicted by the line averaging the extreme groups. It also appears, at least to casual inspection, that the effects are not symmetric, with the increase in redistribution from adding a small number of deserving individuals seeming larger than the decrease from contaminating the poor with a few low-effort individuals.
Table 2 puts these results in a regression framework to provide exact numerical values and standard errors. The top panel corresponds to the class contamination intervention (treatments 1 versus 3), or the points shown on the right-hand side of figure 2. While the addition of one percent low-effort individuals to the previously high-effort poor is estimated to reduce the redistribution provided by the rich by two percentage points, this difference is not statistically significant even in a sample size of nearly 2000 rich voters. In contrast the lower
10
panel of the Table shows that the class leavening effect is much larger (in an absolute value sense) and statistically significant. Adding one-percent deserving poor to the previously low effort group increased the redistribution voted by the rich by seven percentage points, or seventy percent! This is precisely estimated and significantly different from a predicted linear relationship between the fraction of the group deserving and redistribution. The addition of demographic covariates has no effect on either of these results.
Thus, examining simple average voting patterns provides evidence of class leavening effects. It also suggests the absence of a symmetric class contamination effect. However, because each individual was allowed to vote for no redistribution, full redistribution, or partial redistribution, the average amount of voted redistribution may conflate voting changes on multiple margins and may not capture all the interesting behavioral effects.
To account for this possibility, Figures 3 and 4 show the fraction of subjects in various treatment groups that voted for each of the possible redistribution alternatives. Figure 3 suggests that introducing a small number of undeserving individuals does not change the fraction of voters who oppose any redistribution. In other words, it does not appear that any more people are persuaded to vote against all redistribution by the presence of the undeserving individuals. If we are willing to assume that the results of this change are subject to a monotonicity restriction, namely no one is induced to vote for more redistribution as the target population exerts less effort, we can further see that the relevant change in behavior is likely a reduction in the generosity of redistribution on the intensive margin.
Table 3 examines this possibility in a regression framework, comparing the fraction of rich individuals in Treatments 1 and 3 that voted for any redistribution in the top panel, and the fraction that voted for full redistribution in the bottom panel. The simple and covariate-adjusted differences are located in the right hand columns. As the graphical evidence suggests, there is no statistical difference between the number of voters that vote for no redistribution when a small number of undeserving recipients are introduced. While it makes sense that none of the voters who opposed any redistribution would change their mind when faced with a less deserving target population, it is also interesting that there is no evidence that those who favored some redistribution in the case of fully deserving recipients change their votes to no redistribution at all.
On the other hand, Table 3 does show evidence of a potentially important behavior. When faced with a small percent of transfer recipients that exert lower effort, the support for full redistribution among the rich is 4 percentage points lower, a statistically significant reduction. Furthermore, if we assume that the effect of this change follows our above monotonicity assumption, the true marginal subject population we should consider as available to be influenced by the change in effort is the 36 percent of the population that voted for some redistribution when all the poor were deserving. This would suggest that fully one-ninth of these individuals were affected by the change. Furthermore, since there is no evidence that those who voted for an intermediate level of redistribution were induced to modify their support to no redistribution, it might be more appropriate to conclude that the true marginal voters in this case were those individuals who initially voted for full redistribution. In that case the effect of the

11
small change in effort level was to reduce the redistribution generosity of almost twenty percent of the initial full redistribution voters. Given the large change among the voters who would be alternatively most in favor of redistributing to the high effort poor indicates that class contamination could represent a significant effect in the behavioral as well as statistical sense.
Figure 4 considers the specific voting choices in the class leavening treatments. More specifically, it presents the voting choices made by the rich when all poor participants are low effort, as opposed to the case when one percent are high effort. The voting patterns appear quite different from those shown in the class contamination case. In particular, it appears that a substantial number of voters move away from voting against all redistribution when a small number of deserving recipients is introduced. Furthermore, there appear to be more individuals that favor both potential levels of redistribution (partial and full) under these circumstances.
Table 4 confirms these visual conclusions. The vote share in favor of a positive level of redistribution increases by eleven percentage points when one percent of the recipients become deserving. This results in an approximately eight percentage point increase in the voters voting for the intermediate redistribution level and three percentage points more voting for the full redistribution level. If we again assume a monotonic response, we would conclude that we should exclude the four percent of voters who always vote for full redistribution from the marginal group. This would suggest that 11 out of 96 potentially marginal subjects are led to increase their support for redistribution, which is quite close to the 1/9 figure we arrived at in the class contamination case, suggesting that the apparent asymmetry in the behaviors is due to drawing comparisons across group means rather than measuring voting changes by those for whom a change could actually be marginal. These large magnitudes also suggest that class leavening effects can be important determinants of voting behavior regarding redistribution.
Indeed, the results of the experiment to this point indicate that the existence of a small number of poor with effort levels different from an otherwise homogenous class has important consequences on the willingness of the rich to engage in redistribution.
This lends support to a common interpretation in the prior literature that effort is a key source of perceived deservedness. To the extent this is true, this experiment further suggests that support for redistribution might also be sensitive to very small changes in perceived deservedness of other sorts, such as cultural or ethnic similarity to the rich voters.
C. Gender differences in redistributive voting patterns
As previously noted, the literature on voting for redistribution also suggests that women behave in systematically different ways than men in making these choices. We next investigate whether gender differences in redistributive voting might help to explain the pattern of results seen so far. Table 5 is similar to the structure of Table 2, in that it gives the average amount of redistribution voted by the rich, broken down by treatment status. This time, however, we further separate the average redistribution amounts voted by men versus women under each treatment.
12
As before, the top panel shows the class contamination treatments (1 and 3) while the bottom panel shows the leavening treatments (2 and 4).
Three of the treatments confirm the finding of the previous literature that women vote for higher redistribution than men. When all subjects are deserving, the rich women vote for five percent more redistribution than the men. In both cases with a mix of deserving and undeserving recipients the women vote for eight percentage points more redistribution than the men. These differences are statistically significant. More interesting, however, is the case in which all the recipients are undeserving. This is the one case in which the women do not appear to vote for more redistribution than the men. In fact, the point estimates are identical for both men and women.
Comparing this identical behavior of men and women when all recipients are undeserving with the response when one percent deserving poor are introduced is startling. In the latter case men increase the amount of redistribution by a small and statistically insignificant amount, while women more than double the voted amount of redistribution. Thus the voting behavior of women is responsible for most of the class leavening effect found in Table 2.
Another interesting gender difference suggested by the table is that men respond similarly to leavening and contamination, while women respond more strongly to leavening. Although we cannot identify it precisely, the magnitude by which men reduce their votes for redistribution under class contamination is estimated to be statistically similar to the amount they increase it under class leavening. The women, in contrast, appear almost completely unresponsive to the class contamination scenario despite their strong reaction to leavening. One interpretation of these results could be that women are much more sensitive to the possibility that someone deserving could fail to be rewarded than the possibility that someone will be given rewards they do not deserve.
In Tables 6 and 7, we consider how our assessment of gender differences in redistributive voting might be affected by considering votes for partial versus full redistribution, rather than average amounts redistributed. Table 6 considers the class contamination treatments. Here a more complex picture of the differences emerges. Women are more likely to vote for both partial and full redistribution than men in all cases. Most of the reduction in redistribution voted by men when faced with a small number of undeserving recipients comes from a statistically significant decrease in the number of men who vote for full redistribution. Furthermore, this roughly matches the decrease in the fraction of women who vote for full redistribution when 1% of the recipients are undeserving. This suggests that our observed class contamination effect, where a large proportion of the most generous redistribution voters are the ones to reduce their support for redistribution, is not gender-specific but is general to both groups.
Table 7, by contrast, confirms the earlier conclusion that the strong class leavening effect is driven by the votes of the women in the sample. While a significantly higher fraction of men vote for some redistribution when there are 1% deserving poor, the number of men voting for full redistribution remains the same. Meanwhile the response of women voters is much stronger,

13
with almost double the increase in the number moved to vote for some redistribution, relative to men, and a tripling in the number of women voting for full redistribution.
IV. Theoretical frameworks
To this point we have presented clear evidence that voting choices over redistribution amounts may be strongly affected by changes in the effort level of a small fraction of recipients. In this section we sketch two theoretical frameworks that help illuminate the patterns revealed in our experiment. The first posits that individual preferences reflect a disproportionate concern about the least deserving or most deserving member of a class more than the average deservedness of the poor. We refer to this as the “imperfect substitutability” explanation. The second explanation is that individuals have probability weighting functions that place excess weight on small fractions of a class that deviate from the norm. We refer to this as the “probability weighting function” explanation.
A. Imperfect Substitutability of Effort
To formalize the idea of imperfect substitutability we begin with a simple framework that corresponds to the environment of our experiment. Consider a setting in which individuals differ according to their perceived deservedness, D. There are two classes of individuals, the rich (R) and the poor (P), each composed of N agents. In our context, R agents are homogenous with respect to their deservedness, though the reference R individual may, due to self-interest, consider himself more deserving relative to the other individuals in his class. Type P individuals, however, may vary in their deservedness.
In this case, we can write down the preferences of a representative rich individual in the following way:
(1) 𝑈! 𝐶! ,𝐶!;𝐷∗,𝐷! ,𝐷!!,𝐷!!,𝐷!!, . . ,𝐷!" .
Note that 𝐷∗ is the self-perceived deservedness of the reference rich individual. 𝐷! is the deservedness of the other homogenous rich individuals and 𝐷!" is the deservedness of the 𝑛!! poor individual.
One general class of preferences that has been used in the literature5 is the CES preferences of the following form:
(2) 𝑈! = 𝐷∗𝐶!! + 𝑁 − 1 𝐷!𝐶!
! + 𝐷!"!!!! 𝐶!
!!!
!!.
This form is flexible and attractive in that it allows for perfect self-interest (𝐷∗ > 0 and 𝐷! = 𝐷!" = 0), Rawlsian preferences (𝛾 = 𝜌 = −∞), utilitarianism (𝐷∗ = 𝐷! = 𝐷!" and 𝛾 = 𝜌 = 1), and a host of interesting intermediate cases, while allowing the deservedness of 5 See for example Andreoni and Miller (2002).

14
different individuals to vary, a key feature of our study. This particular formulation also has testable empirical predictions regarding the effect of changing the deservedness of a small fraction of class P on preferred transfers. In particular, we can rewrite the utility function as:
(3) 𝑈! = 𝐷∗𝐶!! + 𝑁 − 1 𝐷!𝐶!
! + 𝑁𝐷!𝐶!!
!!
!!
Where 𝐷! represents the average deservedness of the class of poor individuals. This utility function, given a large class, implies that a change in the deservedness of a very small fraction of the class only affects the utility of the reference person to the degree it changes the average deservedness of group P. Since changing the deservedness of a very small fraction has little effect on the group average, this formulation predicts that such a change should minimally affect class-wide preferences for redistribution.6 Implicitly, the deservedness of one individual is a perfect substitute for the deservedness of another individual of the same class.
However, we can generalize these preferences to change the relative weight of the most deserving and least deserving individuals within a class. In particular, consider preferences of the form:
(4) 𝑈! = 𝐷∗𝐶!! + 𝑁 − 1 𝐷!!
!!𝐶!
!+ 𝐷!"!!
!!!!!𝐶!
!!!
!!
Under this specification, the substitutability of deservedness among potential transfer recipients within a class is captured by the parameter 𝛼. Indeed the CES preferences of equation (2) can be restored by setting the perfect substitutes case (𝛼 = 1). As 𝛼 → −∞, the deservedness of the least deserving member of the class drives preferences over consumption for the class. In contrast, as 𝛼 → ∞, the deservedness of the most deserving member becomes paramount. Thus, for some values of 𝛼, small fractions of more deserving or less deserving members of a class could heavily influence the utility of voting for more redistribution.
Of course, the value of 𝛼 need not be constant across all subjects in group R. For some individuals, it may be that 𝛼 < 1, implying that the individual cares relatively more about the least deserving members of the class. Another individual may have preferences such that 𝛼 > 1 implying that the utility of redistribution depends on the most deserving members of a class. To identify the distribution of preferences within our sample, we would need to elicit multiple redistribution votes under different circumstances for the same individual, a task beyond the scope of the current study.7
Figure 5, calibrated to the setting of our experiment, shows preferred levels of redistribution among the rich for two values of 𝛼. The details of the calibration are available in Appendix 2. The solid line shows the preferred redistribution levels when 𝛼 = 1, the setting in 6 Naturally, it could have a large effect on preferences for redistribution towards the specific undeserving members of the class if such a redistribution program was possible. 7 For individuals who are sufficiently self-interested that they never vote for positive levels of redistribution, it is impossible to identify 𝛼.
15
which deservedness is perfectly substitutable between members of the class. In this case, we see a linear response to the fraction of high effort poor. The dashed line corresponds to the case in which 𝛼 = 32.5. In this setting voters place disproportionate weight on the most deserving members of the class. We see that small additions of deserving poor to an otherwise undeserving class has large impacts on the willingness to redistribute, matching the empirical results from treatments 2 and 4 of the experiment. Though not shown in the figure, heterogeneity in 𝛼 across voters allows for measurable effects of both class contamination as well as class leavening.
B. Probability weighting functions
A second potential explanation finds its root in the observation that individuals tend to act as if very unlikely outcomes occur with much great probability than objectively warranted. Kahneman and Tversky (1979) modeled the concept of probability weighting functions as part of Prospect Theory. Their models take into account the overweighting of small probabilities and underweighting of large probabilities that can accompany choice under uncertainty. Probability weighting functions provide a framework to understand why some individuals might overpay to ensure against low probability events while still purchasing a lottery ticket.
In the context of the current study, non-classical probability weighting functions suggest that an individual voting for redistribution to a class with 1 percent deserving individuals and 99 percent undeserving individuals may overweight the small fraction of deserving individuals and act as if it was substantially larger. That same individual might also overweight a small fraction of undeserving individuals. This framework can potentially explain both class contamination and class leavening phenomena and the importance of both negative and positive anecdotes in political arguments about redistribution.
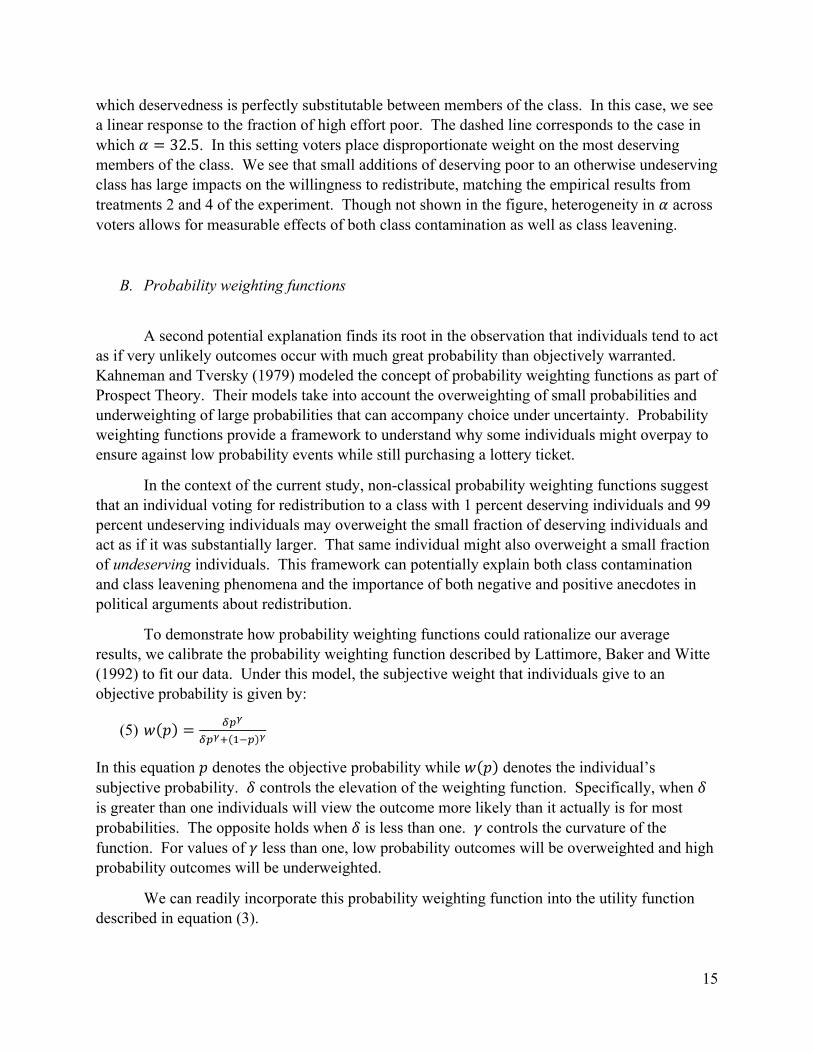
To demonstrate how probability weighting functions could rationalize our average results, we calibrate the probability weighting function described by Lattimore, Baker and Witte (1992) to fit our data. Under this model, the subjective weight that individuals give to an objective probability is given by:
(5) 𝑤 𝑝 = !!!
!!!! !!! !
In this equation 𝑝 denotes the objective probability while 𝑤 𝑝 denotes the individual’s subjective probability. 𝛿 controls the elevation of the weighting function. Specifically, when 𝛿 is greater than one individuals will view the outcome more likely than it actually is for most probabilities. The opposite holds when 𝛿 is less than one. 𝛾 controls the curvature of the function. For values of 𝛾 less than one, low probability outcomes will be overweighted and high probability outcomes will be underweighted.
We can readily incorporate this probability weighting function into the utility function described in equation (3).

16
(6) 𝑈! =
𝐷∗𝐶!! + 𝑁 − 1 𝐷!𝐶!
! + 𝑁 𝑤 𝑝 𝐷!,!"#"$%&'( + 1− 𝑤 𝑝 𝐷!,!"#$%$&'(") 𝐶!!
!!
!!
As in equation (3), an individual makes decisions based on the average deservedness of the class P. However, that average is now weighted according to the function described in equation (5). To the extent that small fractions are overweighted and large fractions are underweighted when constructing this average, injecting a small fraction of deserving individuals to an otherwise undeserving pool can have a large impact on the average. The converse is also true.
In Figure 6, we show preferred redistribution levels that correspond to two different parameterizations of our probability weighting function given by equation (5), again calibrated to the particulars of our experimental protocol and detailed in Appendix 2. The solid line shows voted redistribution levels in a setting in which the probability weights are equal to objective fractions of each type in the population (𝛿 = 1 and 𝛾 = 1). In this case, we see that changes in the fraction of deserving individuals have a linear effect on the willingness to contribute. The dashed line corresponds to the case in which the parameters of the probability weighting function are given by 𝛿 = −2.2 and 𝛾 = −0.3. Under this parameterization, the change from no high-effort poor to one percent high-effort poor increases the probability weight on deserving poor from zero to .36. This explains why we see the large increase in the willingness to redistribute under the class leavening setting. Similarly, a small decrease from all high-effort poor to 99 percent high-effort poor reduces the probability weight on deserving poor from one to 0.9, which explains the observed class contamination effect. Thus, our empirical evidence can also be explained by probability weighting functions that overweight small fractions of deserving or undeserving poor.
C. Comparing the explanations
If there is non-trivial heterogeneity in subject preferences, cross-sectional data cannot distinguish between the imperfect substitutability and probability weighting function explanations. Indeed, these mechanisms are not mutually exclusive, and both could be operating simultaneously. However, the imperfect substitutability mechanism does make a prediction that could potentially differentiate it from the probability weighting explanation: In the imperfect substitutability story, a particular voter may place excess weight on only the most deserving or least deserving individuals of a class. In other words, imperfect substitutability does not allow any single individual to be sensitive to both class leavening and contamination. To test this prediction, however, we would have to observe a panel of voting behavior of a particular individual with varying fractions of deserving and undeserving poor. This is beyond the scope of our data and hence the current study.
V. Conclusion

17
This study presents novel, experimental evidence that voters can be highly sensitive to the effort level of the poor when voting for redistribution. Prior research has established that the rich vote for more redistribution when the poor recipients exert high effort than when they exert low effort. We show that the uniformity of group effort is crucial to these results. In particular, our experimental evidence suggests about one-eighth of voters chose to increase the level of redistribution they support, as indicated by their vote, when a previously low effort recipient group is “leavened” by 1% high-effort recipients. Furthermore, a similar fraction of those already voting for redistribution, when the recipient population is all high-effort, vote for less redistribution when the recipient group is contaminated by 1% of low-effort subjects.
We also find there are important gender differences in these effects. Notably, women are far more sensitive to class leavening than men, with more than twice as many women responding to small changes in the effort level of the poor. While women are also more generous across most of the redistribution scenarios, the size of this particular effect suggests that it is important for understanding some of the mechanisms behind the greater female support for redistribution.
We present two candidate theoretical frameworks to explain our results. First, voters may exhibit strong preferences for the consumption of the most or least deserving individuals. Alternatively, our findings may be the product of the human tendency to make large distinctions between always/everyone and almost always/nearly everyone as described in Prospect Theory.
Our experiment provides multiple insights into voter behavior in broader contexts. First, our results imply that small changes in beliefs about the deservedness of the recipients of government transfer programs can translate into major changes in support for redistribution. In our experiment there is, by construction, a single, verifiable measure of deservedness, relative effort. More generally, the deservedness of recipients may be ambiguous. Combining this ambiguity with voters’ willingness to support large changes in redistribution in response to recipient deservedness may well explain the prevalence of anecdotal descriptions of the poor in politics.
A second implication of our findings is subtler. Figures 5 and 6 show that our models predict that though there are large changes in voting behavior in response to movements at the extremes of the deservedness distribution, there is little response in the middle. Thus, while anecdotes might produce an initially strong voting reaction, once voters believe there is heterogeneity in deservedness, additional information will have little impact on voting.
Our study also suggests some important topics for future inquiry. One would be confirming the flat, low-response portion of figures 5 and 6 in experimental data. Even more important might be studying observable characteristics of the poor that might proxy for deservedness in the minds of voters. Understanding how perceptions of deservedness are formed when effort data is unavailable or suspect might be an important step in understanding actual voting data.
In the meantime, it seems certain that political candidates and advocates of all persuasions will attempt to use stories about the deservedness of the poor in an attempt to leverage the type of large voting changes we document in this paper.

18
Figure 1: Redistribution and the effort of the poor: The past literature and hypothetical examples.
0
0.05
0.1
0.15
0.2
0.25
0.3
0.35
0 0.1 0.2 0.3 0.4 0.5 0.6 0.7 0.8 0.9 1 Fraction of High-Effort Poor
Average Voted Redistribution Among the Rich
A
B
E
F
C
D

19
Figure 2: Redistribution and effort based deservedness in the experiment
Notes: The points show the experimentally observed relationship between the percentage of deserving poor and the amount of redistribution the rich subjects voted for. Also shown is what a linear relationship between redistribution and in deservedness would predict.
0
0.05
0.1
0.15
0.2
0.25
0.3
0.35
0 0.1 0.2 0.3 0.4 0.5 0.6 0.7 0.8 0.9 1
Vote
d R
edis
tribu
tion
to P
oor
Fraction of High-Effort Poor
Experimental High-Effort Support for Redistribution

20
Figure 3: The class contamination effect of introducing 1% low effort among the poor on the voting of the rich
Figure 4: The class leavening effect of introducing 1% high effort among the poor on the voting of the rich
0 0.1 0.2 0.3 0.4 0.5 0.6 0.7
Treatment 3 - 1% Undeserving
Treatment 1 - All Deserving
Fraction of the Rich who vote for:
Redistribution to Equality ($1.00) Half-redistribution ($0.50) No redistribution ($0)
0 0.1 0.2 0.3 0.4 0.5 0.6 0.7 0.8 0.9
Treatment 4 - 1% Deserving
Treatment 2 - All Undeserving
Fraction of the Rich who Vote for:
Redistribution to Equality ($1.00) Half-redistribution ($0.50) No redistribution ($0)

21
Figure 5: Preference parameters and the voting behavior of the rich.
0
0.05
0.1
0.15
0.2
0.25
0.3
0.35
0 0.1 0.2 0.3 0.4 0.5 0.6 0.7 0.8 0.9 1
Vote
d R
edis
tribu
tion
to P
oor
Fraction of High-Effort Poor
Voted Tax and Fraction Deserving: The role of α
Voted Tax (α=1) Voted Tax (α=32.5)

22
Figure 6: Probability weighting function approach: parameters to fit the experimental data
0
0.05
0.1
0.15
0.2
0.25
0.3
0.35
0 0.1 0.2 0.3 0.4 0.5 0.6 0.7 0.8 0.9 1
Vote
d R
edis
tribu
tion
to P
oor
Fraction of High-Effort Poor
Voted Tax and a Probability Weighting Function
Voted Tax (δ=1,ϒ=1) Voted Tax (δ=2.2,ϒ=.3)
23
Table 1: Summary Statistics by Treatment Status
Variable
Overall Mean
All Deserving - Treatment 1
99% Deserving
Treatment 3
All Undeserving Treatment 2
99% Undeserving Treatment 4
P-Value Equal Means
Female 0.55 (0.50)
0.57 (0.50)
0.55 (0.50)
0.57 (0.50)
0.51 (0.50) 0.03
Age 33.16 (11.07)
33.18 (10.88)
33.37 (10.64)
32.86 (11.49)
33.17 (11.41) 0.49
Married 0.40 (0.49)
0.41 (0.49)
0.40 (0.49)
0.40 (0.49)
0.38 (0.49) 0.82
White 0.79 (0.41)
0.80 (0.40)
0.79 (0.41)
0.80 (0.40)
0.78 (0.42) 0.21
Asian 0.06 (0.24)
0.06 (0.24)
0.06 (0.24)
0.05 (0.23)
0.07 (0.25) 0.59
Hispanic 0.05 (0.22)
0.05 (0.21)
0.05 (0.22)
0.06 (0.23)
0.06 (0.23) 0.32
Black 0.07 (0.25)
0.06 (0.24)
0.07 (0.26)
0.06 (0.24)
0.08 (0.27) 0.35
Other Ethnicity
0.02 (0.15)
0.03 (0.16)
0.02 (0.16)
0.03 (0.16)
0.02 (0.14) 0.95
> Median Income
0.55 (0.50)
0.54 (0.50)
0.55 (0.50)
0.55 (0.50)
0.56 (0.50) 0.84
Employed 0.63 (0.48)
0.67 (0.47)
0.65 (0.48)
0.60 (0.49)
0.61 (0.49) 0.13
Student 0.14 (0.34)
0.12 (0.32)
0.13 (0.33)
0.16 (0.37)
0.15 (0.36) 0.21
Republican 0.17 (0.38)
0.19 (0.39)
0.16 (0.37)
0.16 (0.37)
0.17 (0.38) 0.43
Democrat 0.42 (0.49)
0.38 (0.49)
0.40 (0.49)
0.44 (0.50)
0.46 (0.50) 0.09
Sample Size 3,577 988 978 814 797 Notes for Table 1: Standard deviations are in parentheses below means. The sample size does not include observations that were dropped. P-values are computed controlling for session fixed effects to take into account composition differences across sessions.

24
Table 2: Mean Voted Tax Amounts by Treatment Status
Voted Tax Levels Comparison All Deserving 99% Deserving Raw Difference Covariate Adjusted
0.29** (0.01)
0.27** (0.01)
0.02 (0.02)
0.02 (0.02)
All Undeserving 99% Undeserving Raw Difference Covariate Adjusted 0.10** (0.01)
0.17** (0.01)
-0.07** (0.01)
-0.07** (0.01)
Notes to Table 2: Listed amounts are the average voted redistribution amount in dollars for the particular group. Redistribution to full equality would involve an amount of $1.00 being redistributed from high to low earner groups. ** indicates statistical significance at the 5 percent level. Covariates include gender, high income, ethnicity, employed, student, Republican, and Democrat dummy variables along with a linear age control.
Table 3: Fraction Voting for Redistribution Levels – Class Contamination Treatments
Fraction Voting for Any Redistribution Comparison All Deserving 99% Deserving Raw Difference Covariate Adjusted
0.36** (0.02)
0.37** (0.02)
0.01 (0.02)
0.01 (0.02)
Fraction Voting for Full Redistribution Comparison All Deserving 99% Deserving Raw Difference Covariate Adjusted
0.21** (0.01)
0.17** (0.01)
0.04** (0.02)
0.04** (0.02)
Notes to Table 3: Listed amounts are the fractions of the rich who vote for the indicated redistribution option in Treatments 1 and 3. ** indicates statistical significance at the 5 percent level. Covariates include session fixed effects, gender, high income, ethnicity, employed, student, Republican, and Democrat dummy variables along with a linear age control.

25
Table 4: Fraction Voting for Redistribution Levels – Class Leavening Treatments
Fraction Voting for Any Redistribution Comparison All Undeserving 99% Undeserving Raw Difference Covariate Adjusted
0.16** (0.01)
0.27** (0.02)
-0.11** (0.02)
-0.11** (0.02)
Fraction Voting for Full Redistribution Comparison All Undeserving 99% Undeserving Raw Difference Covariate Adjusted
0.04** (0.01)
0.07** (0.01)
-0.03** (0.01)
-0.03** (0.01)
Notes to Table 4: Listed amounts are the fractions of the rich who vote for the indicated redistribution option in Treatments 2 and 4. ** indicates statistical significance at the 5 percent level. Covariates include session fixed effects, gender, high income, ethnicity, employed, student, Republican, and Democrat dummy variables along with a linear age control.
Table 5: Mean Voted Tax Amounts by Treatment Status and Gender
Voted Tax Levels Comparison Gender All Deserving 99% Deserving Raw Difference Covariate
Adjusted Male 0.26**
(0.02) 0.23** (0.02)
0.03 (0.03)
0.03 (0.03)
Female 0.31** (0.02)
0.30** (0.02)
0.00 (0.02)
0.01 (0.02)
Difference -0.05* (0.03)
-0.08** (0.02)
0.03 (0.04)
0.03 (0.08)
All Undeserving 99% Undeserving Raw Difference Covariate Adjusted
Male 0.10** (0.01)
0.13** (0.01)
-0.03 (0.02)
-0.03 (0.02)
Female 0.10** (0.01)
0.21** (0.02)
-0.11** (0.02)
-0.11** (0.02)
Difference 0.00 (0.02)
-0.08** (0.02)
0.07** (0.03)
0.07** (0.03)
Notes to Table 5: Listed amounts are the average voted redistribution amount in dollars for the particular group. Redistribution to full equality would involve an amount of $1.00 being redistributed from high to low earner groups. ** indicates statistical significance at the 5 percent level. Covariates include gender, high income, ethnicity, employed, student, Republican, and Democrat dummy variables along with a linear age control.

26
Table 6: Fraction Voting for Redistribution Levels – Class Contamination Treatments by Gender
Fraction Voting for Any Redistribution Comparison Gender All Deserving 99% Deserving Raw Difference Covariate
Adjusted Male 0.33**
(0.02) 0.31** (0.02)
-0.02 (0.03)
-0.02 (0.03)
Female 0.39** (0.02)
0.42** (0.02)
0.03 (0.03)
0.03 (0.03)
Difference -0.05* (0.03)
-0.11** (0.03)
-0.05 (0.04)
-0.04 (0.04)
Fraction Voting for Full Redistribution Comparison All Deserving 99% Deserving Raw Difference Covariate
Adjusted Male 0.19**
(0.02) 0.14** (0.02)
0.04* (0.03)
0.04 (0.03)
Female 0.23** (0.02)
0.19** (0.02)
0.04 (0.02)
0.04* (0.02)
Difference -0.04 (0.02)
-0.04* (0.02)
0.00 (0.04)
0.00 (0.04)
Notes to Table 6: Listed amounts are the fractions of the rich who vote for the indicated redistribution option in Treatments 1 and 3. ** indicates statistical significance at the 5 percent level. Covariates include session fixed effects, gender, high income, ethnicity, employed, student, Republican, and Democrat dummy variables along with a linear age control.

27
Table 7: Fraction Voting for Redistribution Levels – Class Leavening Treatments by Gender
Fraction Voting for Any Redistribution Comparison Sex All Undeserving 99% Undeserving Raw Difference Covariate
Adjusted Male 0.15**
(0.02) 0.22** (0.02)
-0.07** (0.03)
-0.07** (0.03)
Female 0.18** (0.02)
0.32** (0.02)
-0.15** (0.03)
-0.15** (0.03)
Difference -0.03 (0.03)
-0.11** (0.03)
0.08** (0.04)
0.08* (0.04)
Fraction Voting for Full Redistribution Comparison All Undeserving 99% Undeserving Raw Difference Covariate
Adjusted Male 0.05**
(0.01) 0.05** (0.01)
0.01 (0.02)
0.01 (0.02)
Female 0.03** (0.01)
0.10** (0.01)
-0.06** (0.02)
-0.06** (0.02)
Difference 0.02 (0.01)
-0.05** (0.02)
0.07** (0.02)
0.07** (0.02)
Notes to Table 7: Listed amounts are the fractions of the rich who vote for the indicated redistribution option in Treatments 2 and 4. ** indicates statistical significance at the 5 percent level. Covariates include session fixed effects, gender, high income, ethnicity, employed, student, Republican, and Democrat dummy variables along with a linear age control.

28
References
Alesina, Alberto, and George-Marios Angeletos, "Fairness and redistribution," American Economic Review, (2005), 960-980. Alesina, Alberto F, and Paola Giuliano, "Preferences for redistribution," (National Bureau of Economic Research, 2009). Alesina, Alberto, and Eliana La Ferrara, "Preferences for redistribution in the land of opportunities," Journal of Public Economics, 89 (2005), 897-931. Andreoni, James, and John Miller, "Giving according to GARP: An experimental test of the consistency of preferences for altruism," Econometrica, 70 (2002), 737-753. Balafoutas, Loukas, Martin G Kocher, Louis Putterman, and Matthias Sutter, "Equality, equity and incentives: An experiment," European Economic Review, (2013). Benabou, Roland, and Jean Tirole, "Belief in a just world and redistributive politics," The Quarterly Journal of Economics, 121 (2006), 699-746. Besley, Timothy, and Anne Case, "Political institutions and policy choices: evidence from the United States," Journal of Economic literature, 41 (2003), 7-73. Carlsson, Fredrik, Haoran He, and Peter Martinsson, "Easy come, easy go," Experimental Economics, (2012), 1-18. Charness, Gary, David Masclet, and Marie Claire Villeval, "The dark side of competition for status," Management Science, 60 (2013), 38-55. Cherry, Todd L, Peter Frykblom, and Jason F Shogren, "Hardnose the dictator," The American Economic Review, 92 (2002), 1218-1221. Durante, Ruben, Louis Putterman, and Joël Weele, "Preferences for redistribution and perception of fairness: An experimental study," Journal of the European Economic Association, 12 (2014), 1059-1086. Eckel, Catherine C, and Philip J Grossman, "Are women less selfish than men?: Evidence from dictator experiments," The Economic Journal, 108 (1998), 726-735. Edlund, Lena, Laila Haider, and Rohini Pande, "Unmarried parenthood and redistributive politics," Journal of the European Economic Association, 3 (2005), 95-119. Edlund, Lena, and Rohini Pande, "Why have women become left-wing? The political gender gap and the decline in marriage," Quarterly Journal of Economics, (2002), 917-961. Erkal, Nisvan, Lata Gangadharan, and Nikos Nikiforakis, "Relative Earnings and Giving in a Real-Effort Experiment," American Economic Review, 101 (2011), 3330-3348. Gee, Laura K., Marco Migueis, and Sahar Parsa, "Redistributive Choices and Income Inequality: Experimental Evidence for Income as a Signal of Deservingness," Working Paper Tufts University, (2015). Hoffman, Elizabeth, Kevin McCabe, Keith Shachat, and Vernon Smith, "Preferences, property rights, and anonymity in bargaining games," Games and Economic Behavior, 7 (1994), 346-380. Horton, JohnJ, DavidG Rand, and RichardJ Zeckhauser, "The online laboratory: conducting experiments in a real labor market," Experimental Economics, 14 (2011), 399-425. Kahneman, Daniel, and Amos Tversky, "Prospect theory: An analysis of decision under risk," Econometrica: Journal of the econometric society, (1979), 263-291. Kamas, Linda, and Anne Preston, "Can social preferences explain gender differences in economic behavior?," Journal of Economic Behavior & Organization, 116 (2015), 525-539.

29
Krawczyk, Michał, "A glimpse through the veil of ignorance: Equality of opportunity and support for redistribution," Journal of Public Economics, 94 (2010), 131-141. Kuhn, Peter, and Marie Claire Villeval, "Are Women More Attracted to Co�operation Than Men?," The Economic Journal, 125 (2015), 115-140. Kuziemko, Ilyana, Michael I Norton, and Emmanuel Saez, "How Elastic Are Preferences for Redistribution? Evidence from Randomized Survey Experiments," American Economic Review, 105 (2015), 1478-1508. Lattimore, Pamela K, Joanna R Baker, and Ann D Witte, "The influence of probability on risky choice: A parametric examination," Journal of Economic Behavior & Organization, 17 (1992), 377-400. Lefgren, Lars J, David P. Sims, and Olga Stoddard, "Effort, Luck and Voting for Redistribution," Journal of Public Economics, 143 (2016), 89-97. Lott, John R, and Larry W. Kenney, "How dramatically did women's suffrage change the size and scope of government?," Journal of political Economy, 107 (1999), 1163-1198. Schildberg-Hörisch, Hannah, "Is the veil of ignorance only a concept about risk? An experiment," Journal of Public Economics, 94 (2010), 1062-1066.