Embed Size (px)
Citation preview
CEO Dag J. Opedal
SEB Enskilda Nordic SeminarCopenhagen, 8 January 2010
The Orkla GroupStrategic direction
SEB Enskilda Nordic Seminar 20102
Agenda
Status
Portfolio
Business units
Comprehensive actions – improved financials
Active development to support value creation
Clear strategic business plans defined to improve returns
SEB Enskilda Nordic Seminar 20103
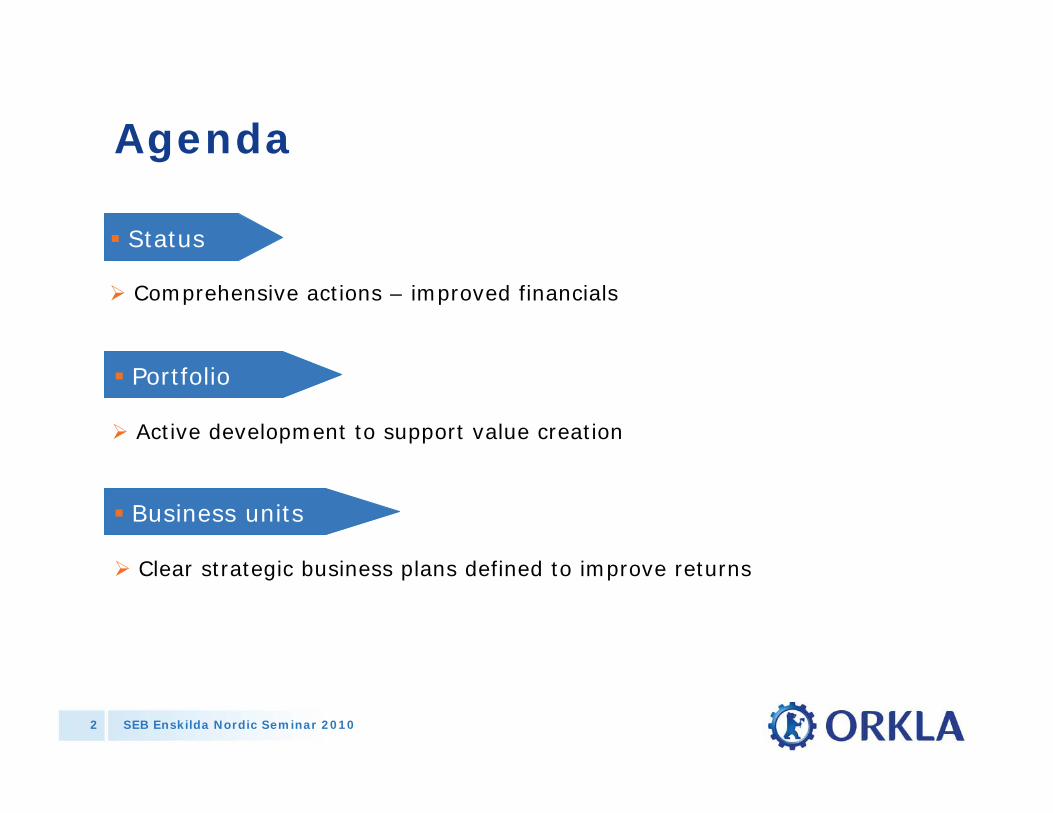
Operating revenues: NOK 55 billion*• Norway 18 %• Other Nordics 21 % • Central & Eastern Europe 9 %• Rest of Europe 31 %• Asia 7 %• North America 13 %• Rest of world 1 %
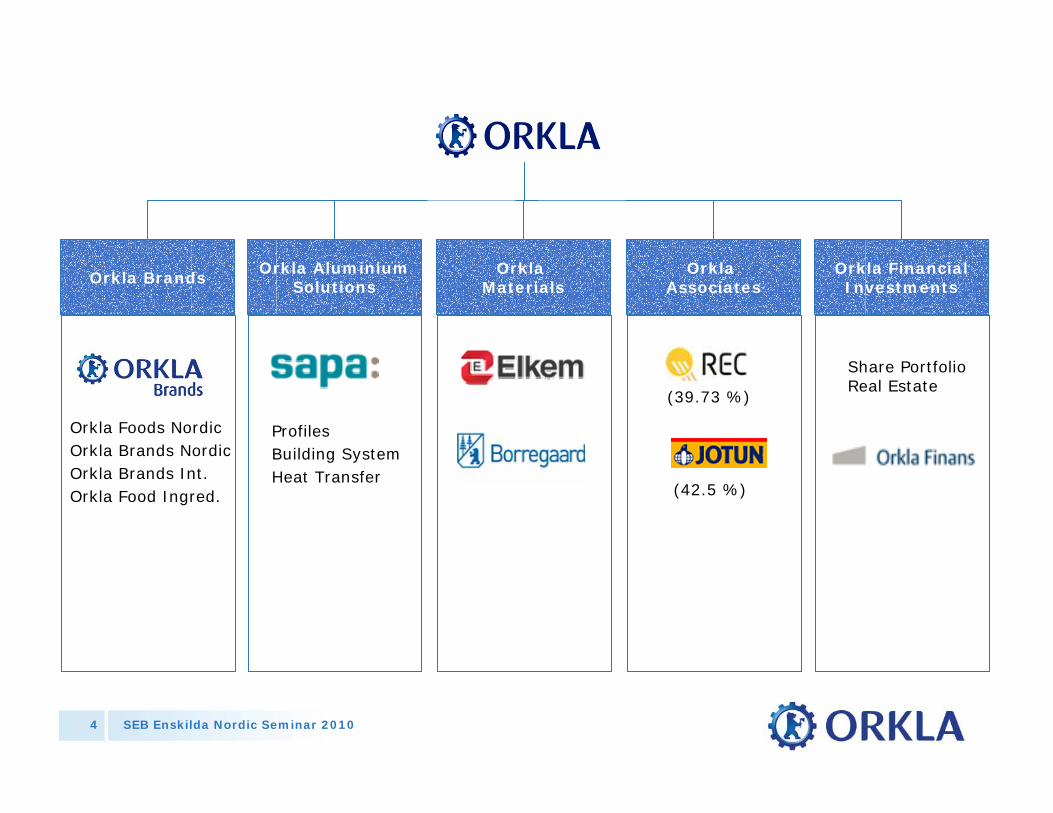
Business Areas: 5• Orkla Brands• Orkla Aluminium Solutions• Orkla Materials• Orkla Associates• Orkla Financial Investments
Market value**: NOK 59 billion
Established: 1654
Employees: 31 000
* Geo. breakdown of net sales at year-end 2008** 31 Dec 2009
This is Orkla
SEB Enskilda Nordic Seminar 20104
(39.73 %)
Orkla BrandsOrkla Aluminium
SolutionsOrkla
MaterialsOrkla
AssociatesOrkla FinancialInvestments
Share PortfolioReal Estate
Orkla Foods NordicOrkla Brands NordicOrkla Brands Int. Orkla Food Ingred.
Profiles Building System Heat Transfer
(42.5 %)

SEB Enskilda Nordic Seminar 20105
Orkla –Comprehensive actions – improved financials
• Continued contribution from extensive action plans
• Important structural actions in 2009 – Acquisition of Indalex – Sale of hydropower assets– Asset swap between Orkla and Alcoa
• Market outlook slightly firmer– Clear signs of stabilisation at a low level from mid-2009– Somewhat more positive underlying momentum
in second half of 2009– Still uncertainty in economic trends
SEB Enskilda Nordic Seminar 20106
Highlights Q3-09• Continued profit growth for Orkla Brands
• Positive EBITA for Orkla Aluminium Solutions in Q3– Comprehensive structural and cost-cutting measures – Successful integration of Indalex
• General weak market conditions for Orkla Materials– Capacity utilisation of 57 % in Q3 for Elkem silicon-related– Improved profit in Borregaard Chemicals due to favourable raw
material prices and currency effects
• Challenging solar markets – REC; EBITDA at NOK 429 million in Q3– Elkem Solar; hot commissioning started mid October
• Return on Share Portfolio + 26.2 %

SEB Enskilda Nordic Seminar 20107
Improved profit vs. last quarter….
811
334
177
170
121
51 -15-28 1
Q2-09 OrklaAluminiumSolutions
Elkem ex.Solar
Orkla Brands Borregaard OrklaFinancial
Investments
Elkem Solar Other Q3-09
EBITA performance from Q2-09 to Q3-09(figures in NOK million)
SEB Enskilda Nordic Seminar 20108
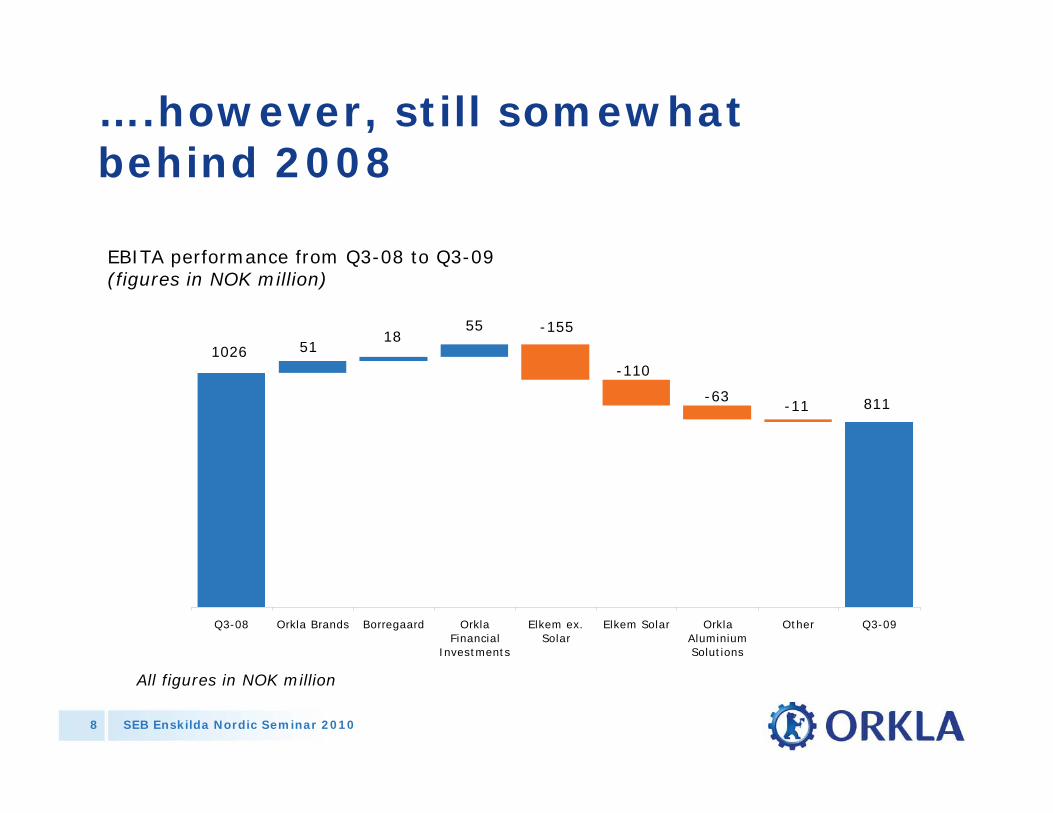
….however, still somewhat behind 2008
All figures in NOK million
811
1026 5118
55 -155
-110
-63-11
Q3-08 Orkla Brands Borregaard OrklaFinancial
Investments
Elkem ex.Solar
Elkem Solar OrklaAluminiumSolutions
Other Q3-09
EBITA performance from Q3-08 to Q3-09(figures in NOK million)

SEB Enskilda Nordic Seminar 20109
Focus on short-term cash flow –comprehensive action plan pr. business area
• Orkla Brands – continuous improvement– Reinforced action plan
– Restructuring of unprofitable entities
• Sapa is taking strong measures to operate on a cash neutral basis in 2009– Reduction of 2 200 FTEs, September year-on-year1)
– Several factories closed down
• Capacity in Elkem silicon-related adjusted to current market conditions– Planned capacity reduction of approx. 40 % in 2009– Periodic close-downs of furnaces throughout 2009
• Closure of Borregaard’s Swiss operations– Capacity reduction of 1/3 in specialty cellulose
(1) Excluding Indalex
SEB Enskilda Nordic Seminar 201010
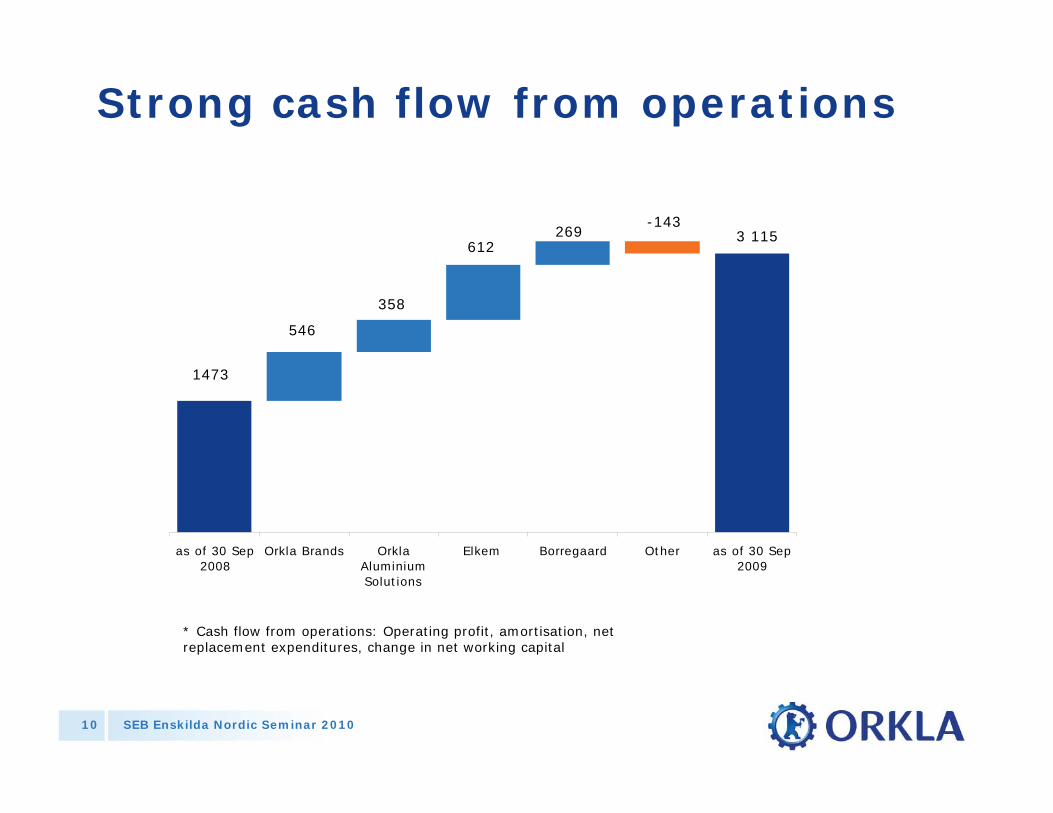
Strong cash flow from operations
* Cash flow from operations: Operating profit, amortisation, netreplacement expenditures, change in net working capital
All figures in NOK million
1473
546
358
612269
-1433 115
as of 30 Sep2008
Orkla Brands OrklaAluminiumSolutions
Elkem Borregaard Other as of 30 Sep2009
SEB Enskilda Nordic Seminar 201011
Orkla is well prepared for stormy weather
• A diversified portfolio reduces risk from business-specific volatility– Large share of cash flow from less cyclical areas
• Robust balance sheet and gearing*)
– equity ratio ~55 %– net gearing ~0.45
• Unutilised committed credit facilities cover instalments well into 2011
• No financial covenants
• Financial assets provide flexibility– Readiness to act on emerging opportunities
*) Pro forma after spin out of hydropower assets
SEB Enskilda Nordic Seminar 201012
Orkla portfolio developmentMultiple criteria being considered
• Value creation plan per business unit– Fits the overall strategy
• Levers of differentiation in complex value chain• No 1 or strong no 2 position• Benefit from Orkla’s skill base• ROCE > pre-tax WACC 10 %
• Balance in terms of– Cash flow vs. growth phase– Cyclicality– Capital intensity– Diversification
• Exploiting the frontier of opportunities– Timing– Opportunism– Deal flow– Darwinism

SEB Enskilda Nordic Seminar 201013
The Indalex acquisition
• Sapa to merge No 1 and No 2 players in North America through the acquisition of Indalex
• Market share in North America increased to 26 %
• Strong synergy-driven case– Production, logistics and shared services
• Successful integration process
SEB Enskilda Nordic Seminar 201014
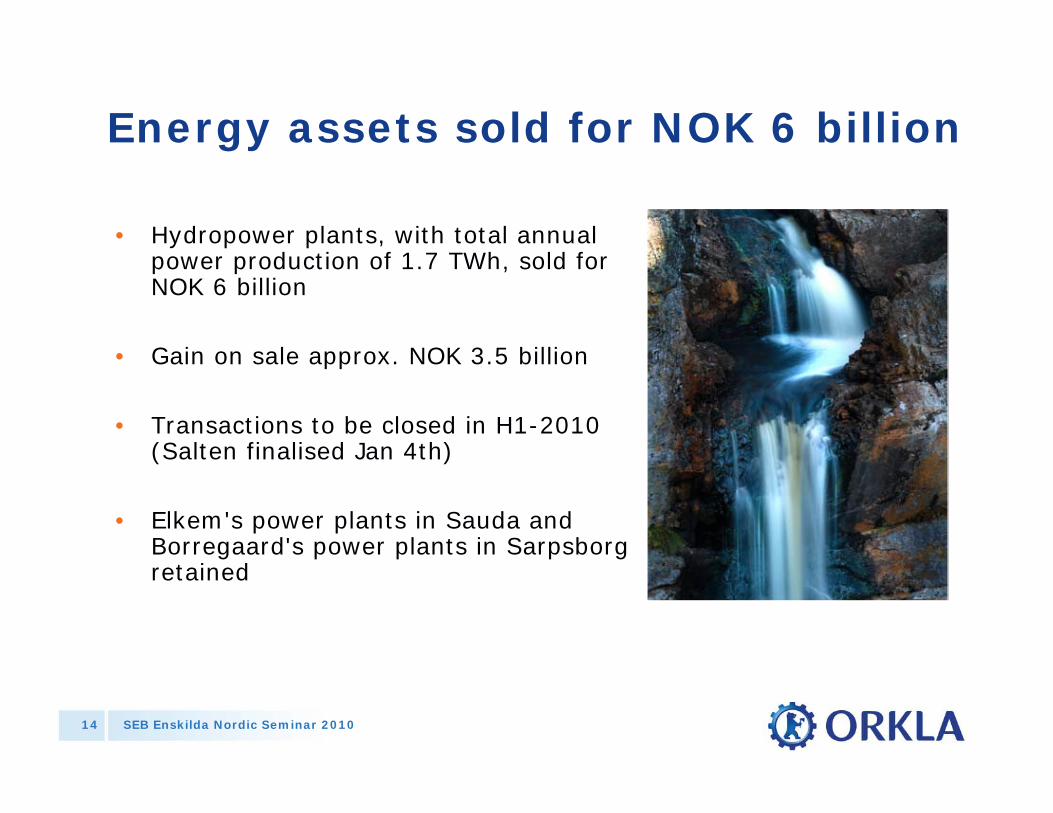
Energy assets sold for NOK 6 billion
• Hydropower plants, with total annual power production of 1.7 TWh, sold for NOK 6 billion
• Gain on sale approx. NOK 3.5 billion
• Transactions to be closed in H1-2010(Salten finalised Jan 4th)
• Elkem's power plants in Sauda and Borregaard's power plants in Sarpsborgretained
SEB Enskilda Nordic Seminar 201015
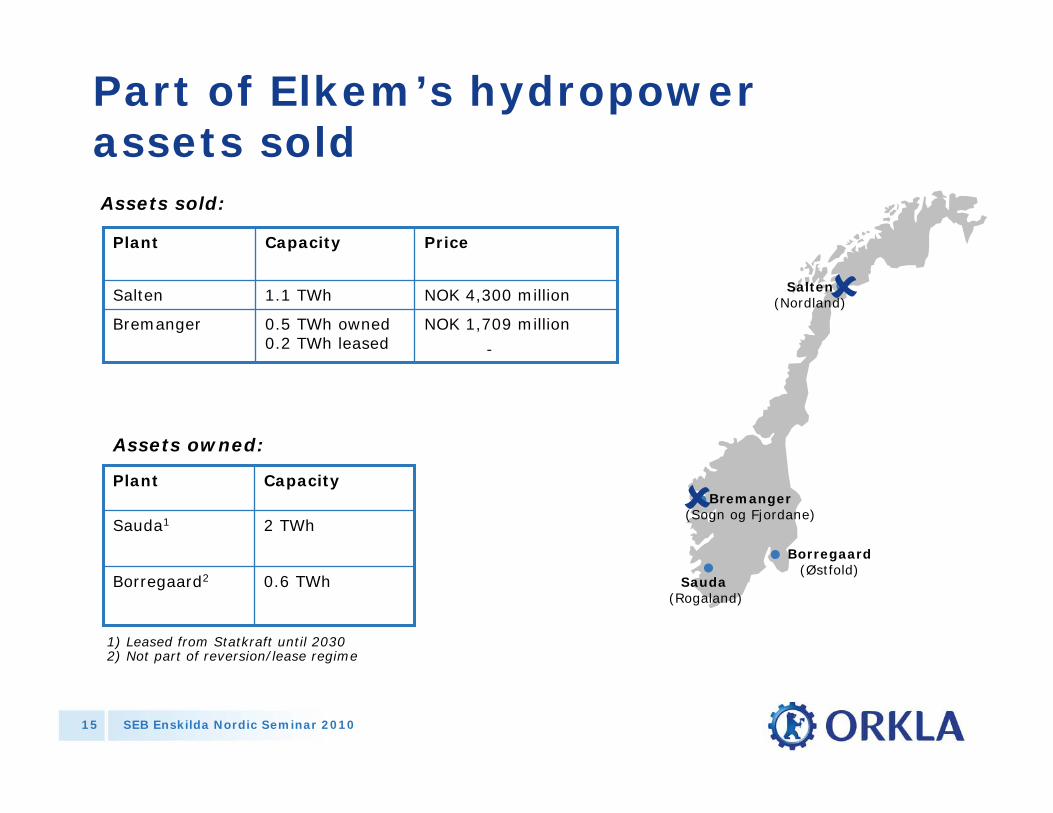
Part of Elkem’s hydropower assets sold
Sauda(Rogaland)
Bremanger(Sogn og Fjordane)
Salten(Nordland)
Borregaard(Østfold)
NOK 1,709 million
-
NOK 4,300 million
Price
0.5 TWh owned0.2 TWh leased
Bremanger
1.1 TWhSalten
CapacityPlant
0.6 TWhBorregaard2
2 TWhSauda1
CapacityPlant
Assets sold:
Assets owned:
1) Leased from Statkraft until 20302) Not part of reversion/lease regime

SEB Enskilda Nordic Seminar 201016
Enabling skills
M & Aactivities
Organicimprovement
Competencedriven
Orkla – leveraging active ownership skills
• Designing valuecreation masterplans
• Management and governance set-up
• Performance culture
• Development of expertise
• Internal transfer of functional skills
• Orkla Academies
• Innovation/Marketing
• Customer processes
• Lean supply chain and EHS
• Developing ideas based on disciplined strategic thinking
• Integration
• ”Orkla Business System” to boost performance
VALUECREATION

SEB Enskilda Nordic Seminar 201017
Value creation through M&A
Year Company Industry1986 Borregaard Chemicals
- Lilleborg Branded Consumer Goods- Stabburet Branded Consumer Goods- Jotun (42.5 %) Paints and coatings
1991 Nora Industrier Branded Consumer Goods- Ringnes- Nora Foods- Nidar
1995 Abba Seafood Seafood1995 Procordia Food Food1997 Pripps Ringnes 100 % Beverages2000 Carlsberg Breweries 40 % Beverages2000 Det Berlingske Officin Printed newspapers2005 Chips Snacks2005 Elkem/Elkem Solar Metals/hydropower/solar energy2005 Sapa Aluminium extrusion2007 Sapa/Alcoa JV Aluminium extrusion2007 REC (39.73 %) Solar energy2009 Sapa 100 % Aluminium extrusion2009 Indalex Aluminium extrusion

SEB Enskilda Nordic Seminar 201018
Value creation through divestments
Year Company Industry
1991 Orkla real estate Real estate
1995 Norgro Animal feed
1995 Helly Hansen (50 %) Clothing
1996 Abba in Denmark and in Germany Seafood
1996 Frionor (51 %) Frozen products
1996 Hansa Beverages
1997 Ringstads Ferskvare Fresh meat products
1999 Regal Mølle AS Food ingredients/flour
1999 Viking Fottøy Footwear
2000 Orkla Finans (Fondsmegling) Investment bank
2001 Oyj Hartwall Abp (20 %) Beverages
2003 Enskilda Securities (22.5 %) Investment bank/broker
2004 Carlsberg Breweries (40 %) Beverages
2004 Borregaard Hellefoss/Vafos Book paper, mechanical pulp
2005 Denofa's extraction plant (X-Works) Soya products for the feed industries2006 Orkla Media Printed newspapers and web-sites2008 Hjemmet Mortensen (40 %) Printed magazines2009 Elkem Aluminium (50 %) Primary Aluminium2009 Energy Assets (Salten/Bremanger) Hydro Power
SEB Enskilda Nordic Seminar 201019
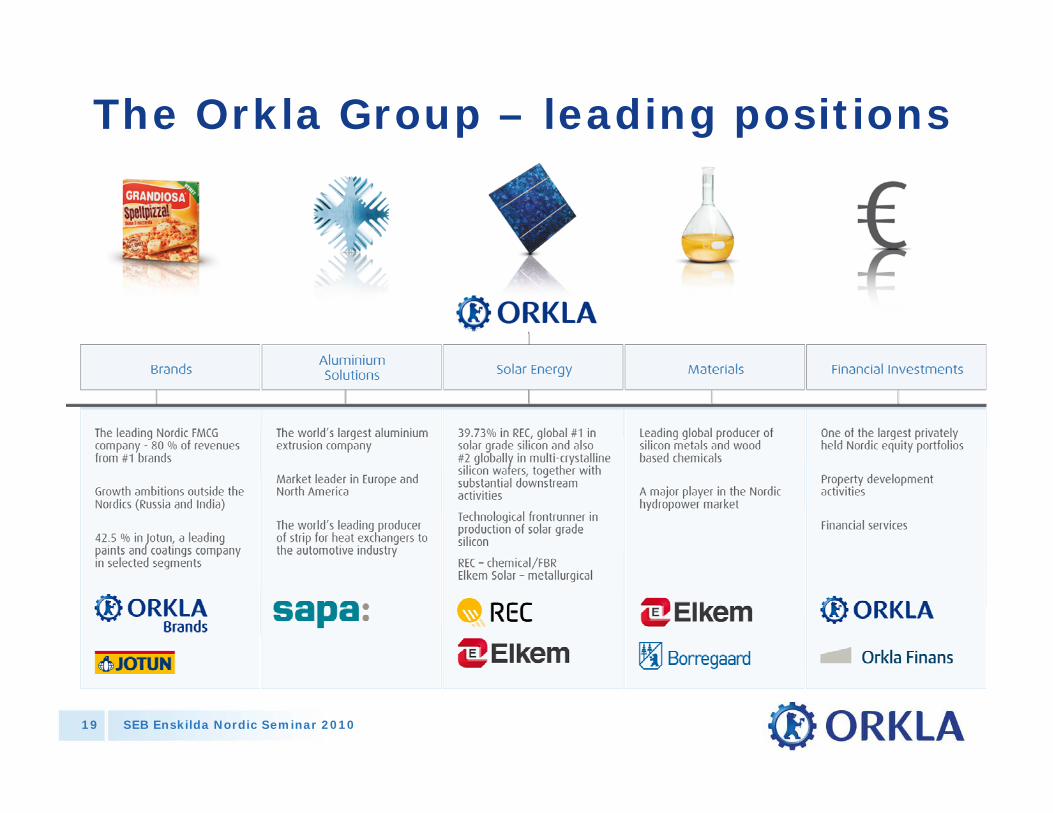
The Orkla Group – leading positions

SEB Enskilda Nordic Seminar 201020
Orkla exploits different ownership models:
Basis in industry • Primarily seeks 100 % ownership
• Deployment of Orkla’s skill base
• Control of structural development
• Source of cash flow that can be leveraged
For all models: Seek ”100 % ownership of key competencies”
• When 100 % ownership is not desirable or possible
• Industrial positions – active ownershipHolding (~20-50 %)
• Financial investments in order to create capital returns and industrial options
Investment (<20 %)

SEB Enskilda Nordic Seminar 201021
Orkla has employed the holding model primarily when 100 % ownership has not been possible or desirable
Holdings:
• REC (39.73 %)
• Jotun (42.5 %)
• Sapa/Alcoa (54 % → 100%)
• Chips Oy (20 % → JV → 100%)
• Dragsbæk (50 % → 67 %)
Exits:
• Elkem Aluminium ANS (50 % → exit 2009)
• Hjemmet Mortensen (40 % → exit 2008)
• Carlsberg (40 % → exit 2004)
• Hartwall (20 % → BBH → exit 2004)
• Enskilda Securities (22.5 % → exit 2003)

SEB Enskilda Nordic Seminar 201022
Financial Investments
• Netcom
• Dyno
• Carema
• Elkjøp
• Lindex
• Storebrand
• Capio
• Nokia
• Freia
Industrial options Financial value creation
Engine for Orkla’s development
Borregaard• Lilleborg• Stabburet• Jotun (42.5 %)
Nora Industrier• Ringnes -> BBH• Nora Foods• Nidar
Chips Oy
Elkem• Sapa• REC (39.73 %)• Elkem Solar
SEB Enskilda Nordic Seminar 201023
0
20
40
60
80
100
120
140
jan. 01 jul. 01 jan. 02 jul. 02 jan. 03 jul. 03 jan. 04 jul. 04 jan. 05 jul. 05 jan. 06 jul. 06 jan. 07 jul. 07 jan. 08 jul. 08 jan. 09 jul. 09 jan. 10
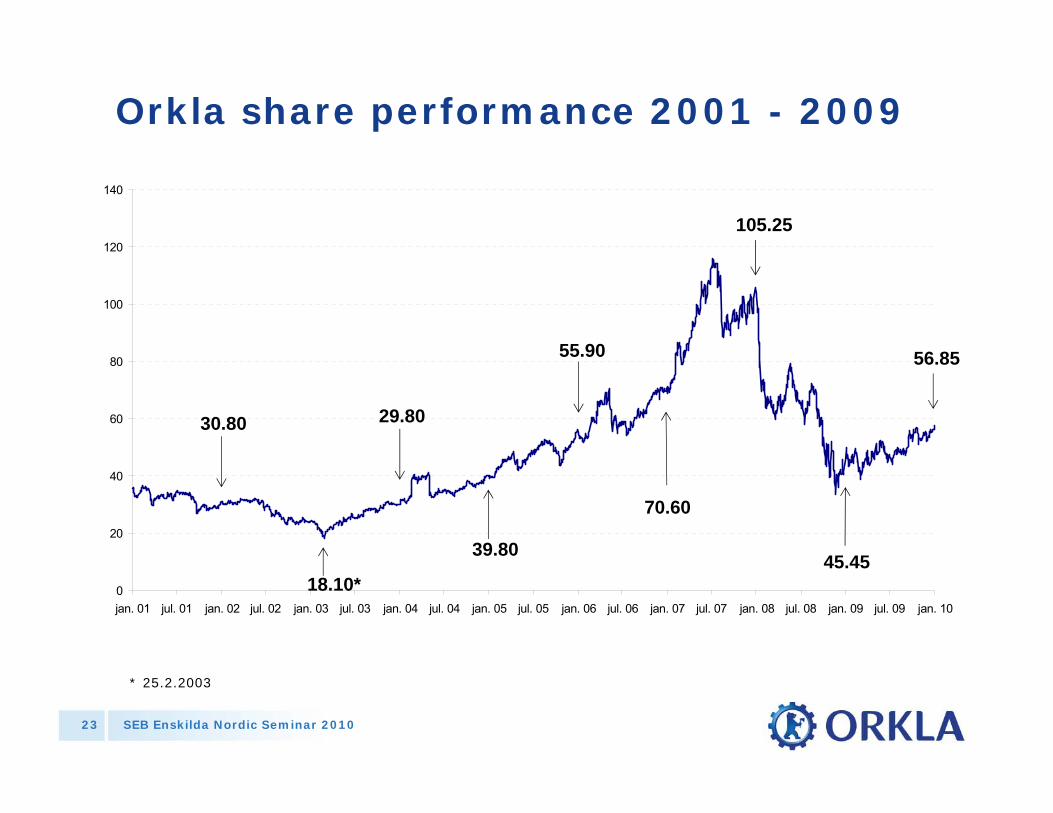
Orkla share performance 2001 - 2009
39.80
55.90
70.60
18.10*
29.80
45.45
105.25
30.80
56.85
* 25.2.2003

SEB Enskilda Nordic Seminar 201024
813
40
32
105
48
1418
45
0
20
40
60
80
100
120
1992 1994 1998 2002/2003 2008
Shar
e pr
ice
(NO
K)
Orkla’s record of recovering after downturns
Banks Orkla-specific events in volatile markets
Asia Dot-com Financial crisis

SEB Enskilda Nordic Seminar 201025
Orkla’s long-term business model has worked
* Based on share price year-end 2009, dividend reinvested
16 % compounded annual return last 25 years*
16 % 15 %
12 %11 %
10 % 9 %
6 %
9 %
From 31.12.84 From 31.12.94 From 31.12.99 From 31.12.04
The Orkla share OSEBX

SEB Enskilda Nordic Seminar 201026
Orkla share performance relative to peers last 5 years
30.12.2004-30.12.2009. Dividend assumed re-invested in the share. Return measured in companies’ local currency.Source: Bloomberg; Orkla IR
Annual return
1,2 %
3,5 %
5,0 %
8,3 %
14,1 %
15,0 %
11,0 %
-2,5 %
11,5 %
-13,5 %General Electric
Kraft
Berkshire Hathaway
Procter & Gamble
Heinz
Danone
Unilever
Reckitt Benckiser
Nestlé
Orkla

SEB Enskilda Nordic Seminar 201027
Dividend strategy –NOK 18 billion returned to shareholders since 2004*
2,252,25
1,50
0,19 0,23 0,27 0,320,50 0,60 0,65 0,68
0,410,39
2,00
0.80+5.00
1993 1994 1995 1996 1997 1998 1999 2000 2001 2002 2003 2004 2005 2006 2007 2008
Ordinary dividend Special dividend
0.90+1.00
* Dividend (16.6) and share buy backs (1.3)
SEB Enskilda Nordic Seminar 201028
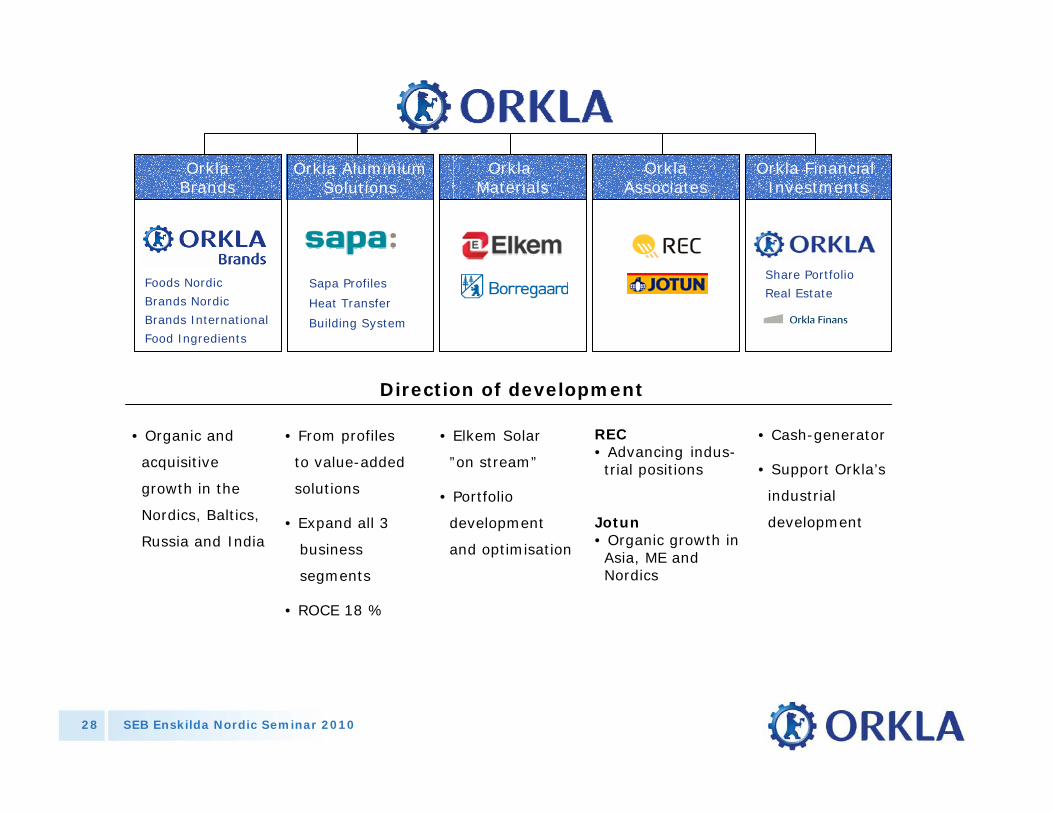
OrklaBrands
Orkla AluminiumSolutions
Orkla Materials
Orkla Financial Investments
Sapa Profiles
Heat Transfer
Building System
Foods Nordic
Brands Nordic
Brands International
Food Ingredients
Share Portfolio
Real Estate
OrklaAssociates
• Organic and
acquisitive
growth in the
Nordics, Baltics,
Russia and India
Direction of development
• From profiles
to value-added
solutions
• Expand all 3
business
segments
• ROCE 18 %
• Elkem Solar
”on stream”
• Portfolio
development
and optimisation
REC• Advancing indus-trial positions
Jotun• Organic growth in Asia, ME and Nordics
• Cash-generator
• Support Orkla’s
industrial
development

SEB Enskilda Nordic Seminar 201029
Orkla Brands

SEB Enskilda Nordic Seminar 201030
Orkla Brands – EBITA 12 month rolling
NOK million
1 200
1 400
1 600
1 800
2 000
2 200
2 400
2 600
2 800
Q1-03 Q3-03 Q1-04 Q3-04 Q1-05 Q3-05 Q1-06 Q3-06 Q1-07 Q3-07 Q1-08 Q3-08 Q1-09 Q3-09
SEB Enskilda Nordic Seminar 201031
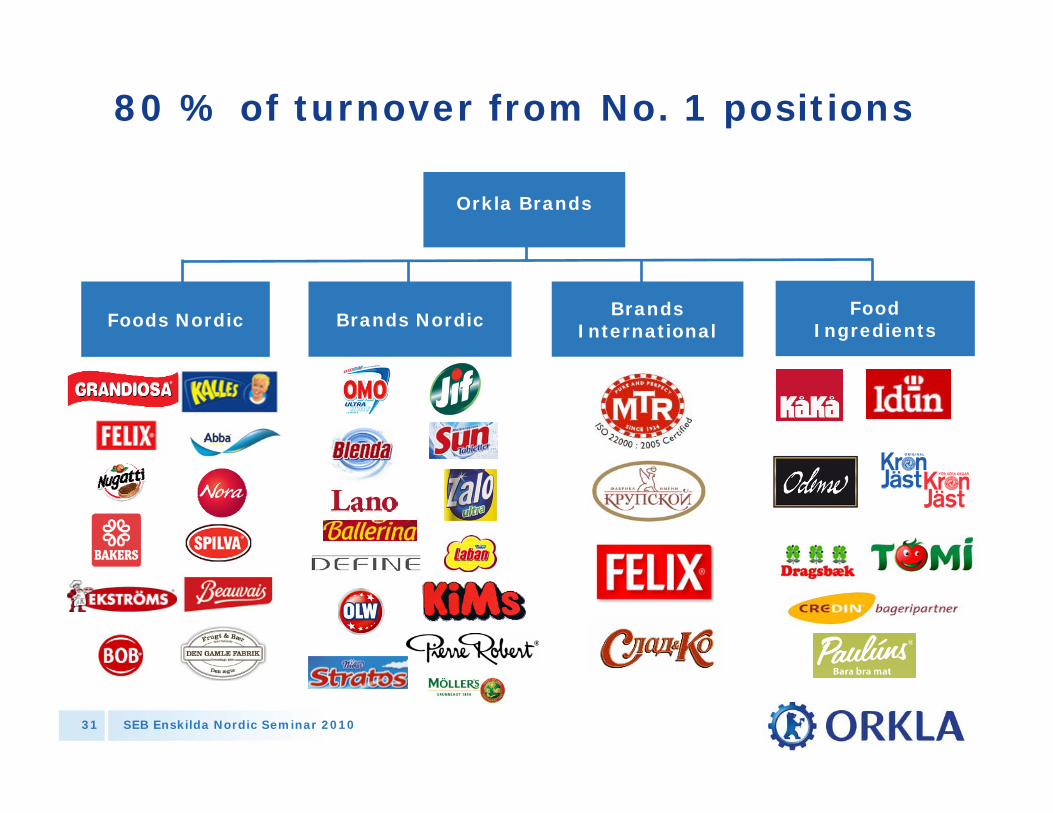
80 % of turnover from No. 1 positions
Foods NordicBrands
International
Orkla Brands
Brands NordicFood
Ingredients
SEB Enskilda Nordic Seminar 201032
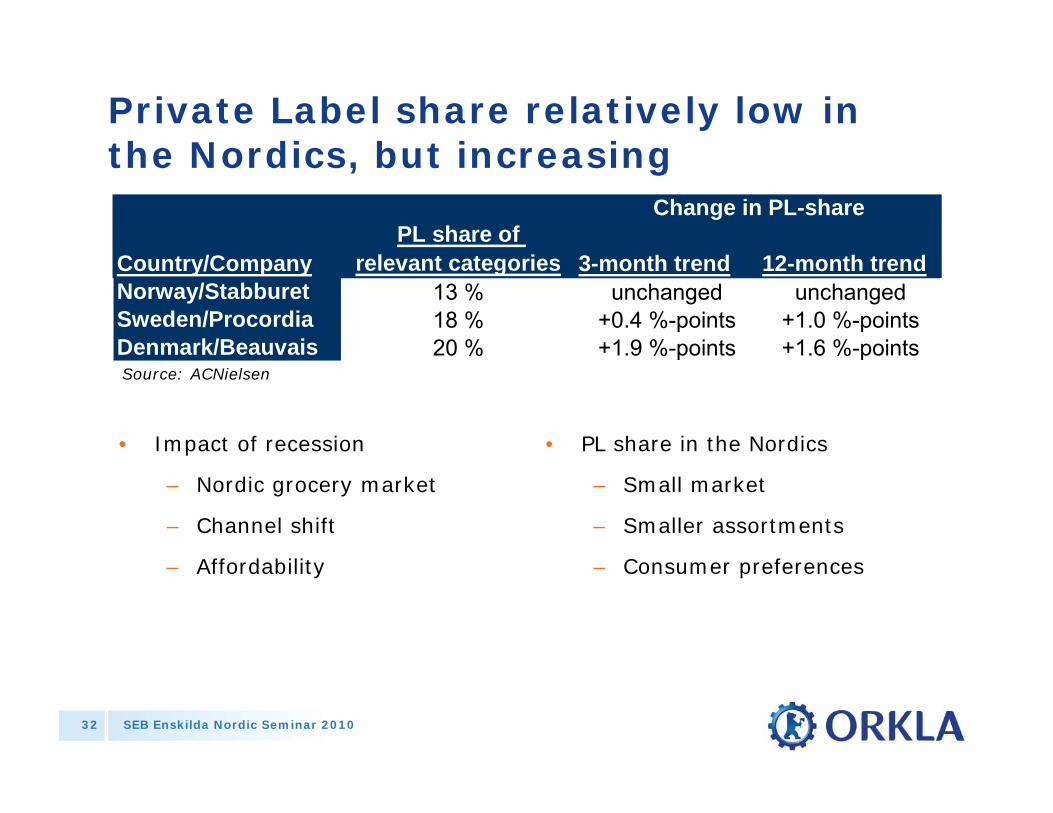
Private Label share relatively low in the Nordics, but increasing
• Impact of recession
– Nordic grocery market
– Channel shift
– Affordability
• PL share in the Nordics
– Small market
– Smaller assortments
– Consumer preferences
Source: ACNielsen
Country/CompanyPL share of
relevant categories 3-month trend 12-month trendNorway/Stabburet 13 % unchanged unchangedSweden/Procordia 18 % +0.4 %-points +1.0 %-pointsDenmark/Beauvais 20 % +1.9 %-points +1.6 %-points
Change in PL-share
SEB Enskilda Nordic Seminar 201033
Orkla Brands development planned in 2 stages:
• 2008-09: Back on track
• 2010 : Focus on growth

SEB Enskilda Nordic Seminar 201034
Getting back on track was the priority in 2008-09
• Restoring margins
• Organisational and modus operandi improvements
• Less focus on structural growth
• Restructuring outside the Nordic area
SEB Enskilda Nordic Seminar 201035
2010 : Focusing on growth
• Defining clear growth directions in all business units
• Focus both on organic and structural growth
• Innovation most important lever
• Enhanced synergy capture in Orkla Brands

SEB Enskilda Nordic Seminar 201036
Orkla Aluminium Solutions –Sapa
SEB Enskilda Nordic Seminar 201037
The world leader in aluminium solutions
• Dedicated and focused provider of aluminium solutions
• Global presence and strong position on local markets
• Clearly defined value creation plan

SEB Enskilda Nordic Seminar 201038
2001–2004 2005 2007 2008
Merger of Sapa Profiles and Alcoa Extrusions
Orkla has 55% interest in JV
Orkla acquires remaining 26% for 1.6 bn NOK
Orkla swaps Elkem Aluminium for Alcoa’s 45% interest in JV
Elkem acquires 74% of Sapa for 4.0 bn NOK
2009
Orkla acquires Indalex for approx. 0.6 bn. NOK
Total cost of Sapa for Orkla is 6.2 bn. NOK plus value ofthe swap
(1) Pro-Forma 2008 incl. former Indalex locations
Sapa sales 199910.5 bn. NOK
Sapa sales 20081)
33 bn. NOK
The Sapa growth story
SEB Enskilda Nordic Seminar 201039
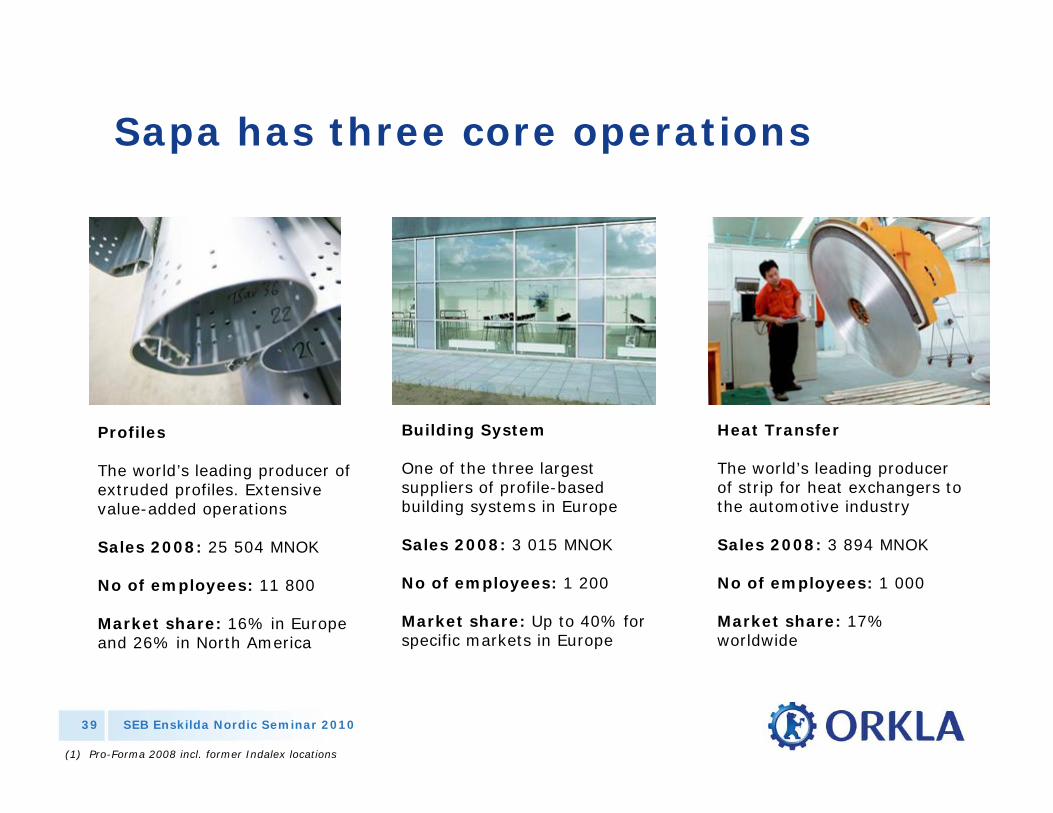
Profiles
The world’s leading producer of extruded profiles. Extensive value-added operations
Sales 2008: 25 504 MNOK
No of employees: 11 800
Market share: 16% in Europe and 26% in North America
Building System
One of the three largest suppliers of profile-based building systems in Europe
Sales 2008: 3 015 MNOK
No of employees: 1 200
Market share: Up to 40% for specific markets in Europe
Heat Transfer
The world’s leading producer of strip for heat exchangers to the automotive industry
Sales 2008: 3 894 MNOK
No of employees: 1 000
Market share: 17% worldwide
(1) Pro-Forma 2008 incl. former Indalex locations
Sapa has three core operations

SEB Enskilda Nordic Seminar 201040
• Favourable Price/Sales ratio
• Applying the Orkla framework within– Enabling skills
– Transfer of competence
– Organic improvement
– M&A
• Long-term mid-cycle ROCE target of 18 % vs Orkla’s 10 % WACC– EBITA-margin 6 %
– Capital turnover of 3
Sapa value creation plan

SEB Enskilda Nordic Seminar 201041
EBITA-marginCapital Turnover Rate
- Profiles - - Building System - - Heat Transfer -
Targets remain firm: EBITA margin 6 % and ROCE of 18 % over a cycle
4,1%3,1%
0,6%
0 %
5 %
10 %
15 %
2006 2007 20080
1
2
3
4
4,9%
7,0%8,4%
0 %
5 %
10 %
15 %
2006 2007 20080
1
2
3
4
8,8%
10,5%
9,4%
0 %
5 %
10 %
15 %
2006 2007 20080
1
2
3
4
Sapa Group EBITA Margin And Capital Turnover Rate

SEB Enskilda Nordic Seminar 201042
Sapa shows improvement
343364
92
-102
-342
-148
29
Q1-08 Q2-08 Q3-08 Q4-08 Q1-09 Q2-09 Q3-09
EBITA figures in NOK million
SEB Enskilda Nordic Seminar 201043
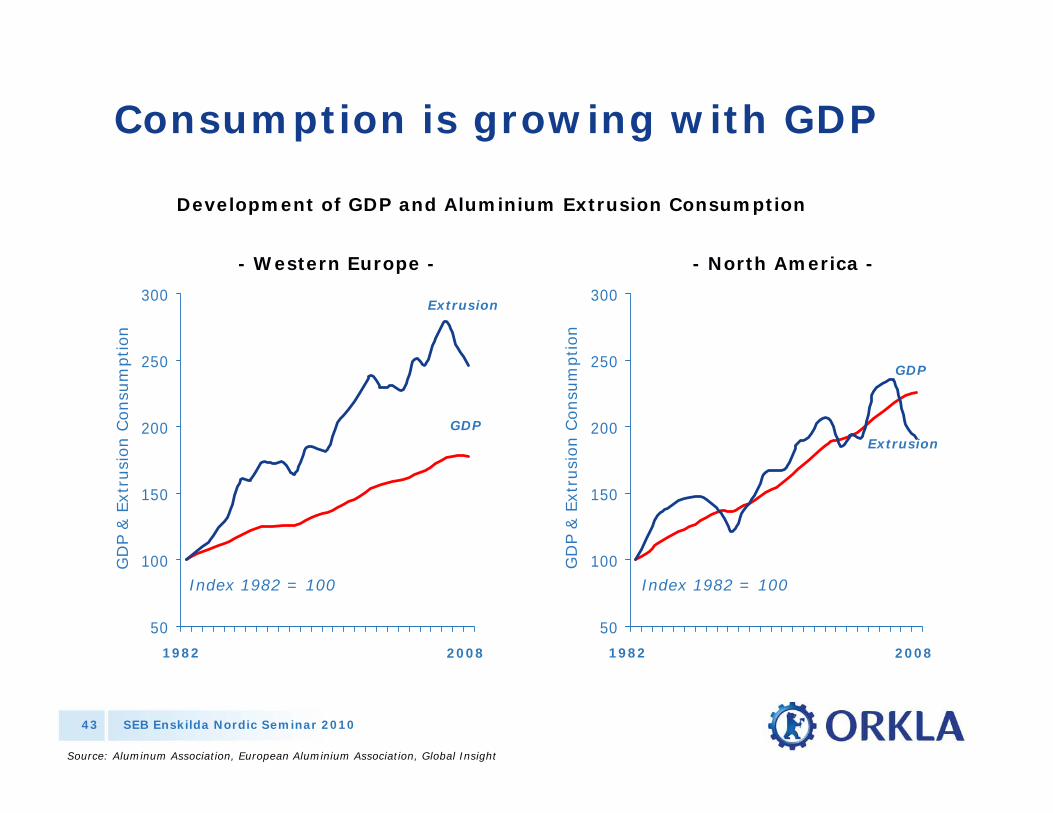
Development of GDP and Aluminium Extrusion Consumption
50
100
150
200
250
300Extrusion
GDP
GD
P &
Ext
rusi
on C
onsu
mption
Source: Aluminum Association, European Aluminium Association, Global Insight
Index 1982 = 100
- Western Europe - - North America -
50
100
150
200
250
300
Index 1982 = 100
Extrusion
GDP
GD
P &
Ext
rusi
on C
onsu
mption
1982 2008 1982 2008
Consumption is growing with GDP
SEB Enskilda Nordic Seminar 201044
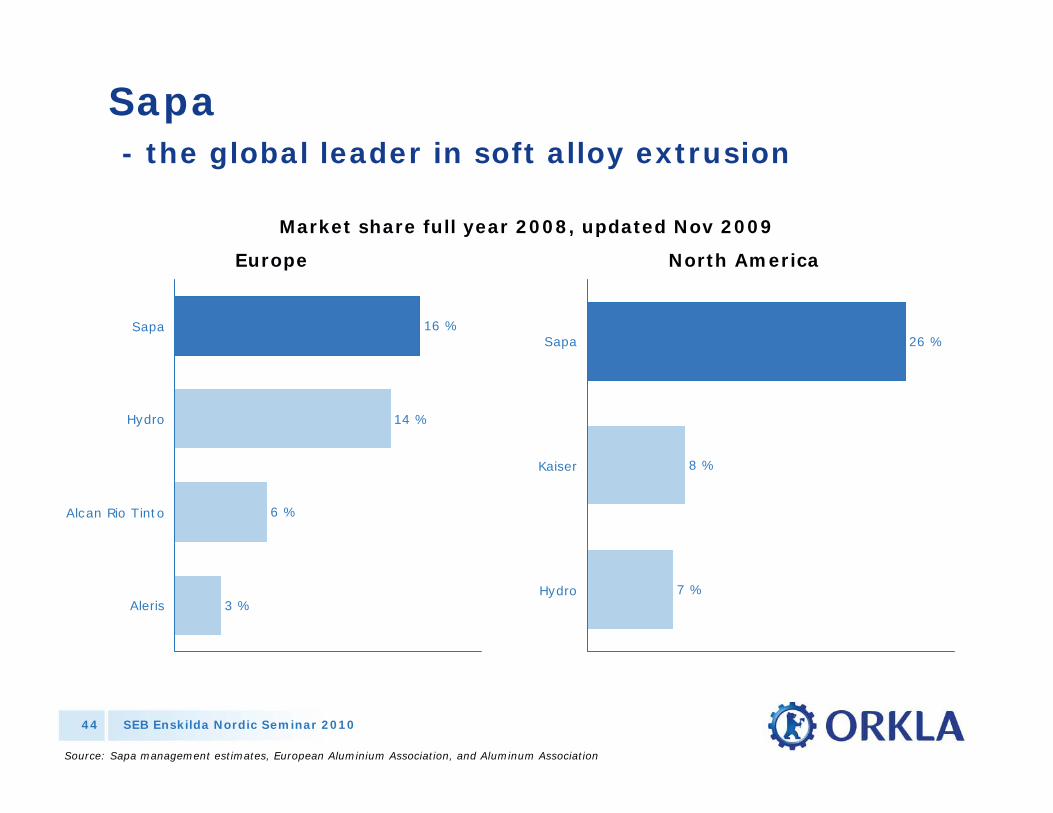
Sapa- the global leader in soft alloy extrusion
16 %
14 %
6 %
3 %
Sapa
Hydro
Alcan Rio Tinto
Aleris
Europe
26 %
8 %
7 %
Sapa
Kaiser
Hydro
North America
Market share full year 2008, updated Nov 2009
Source: Sapa management estimates, European Aluminium Association, and Aluminum Association

SEB Enskilda Nordic Seminar 201045
The European extrusion market is highly fragmented
European Extrusion Market Shares
Sapa Profiles 16%
Other61%
Hydro14%
Alcan6%
3%
Source: Sapa management estimates & European Aluminium Association
Aleris
Sapa European Production Sites
SEB Enskilda Nordic Seminar 201046
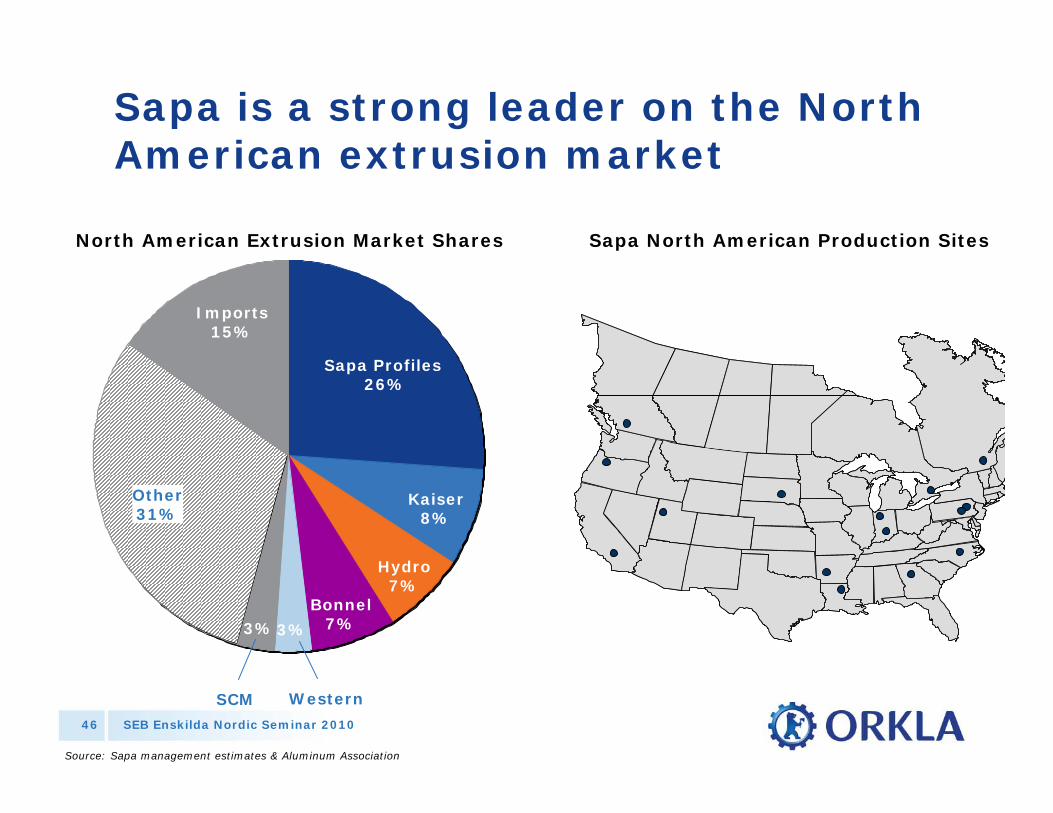
Sapa is a strong leader on the North American extrusion market
Imports15%
North American Extrusion Market Shares
Sapa Profiles 26%
Other31%
Kaiser8%
Hydro7%
Bonnel7%3%3%
Source: Sapa management estimates & Aluminum Association
WesternSCM
Sapa North American Production Sites

SEB Enskilda Nordic Seminar 201047
Actions taken by Sapa to counter global recession
• Plant footprint optimisation
• Productivity improvement
• Cost and capital reduction
• Continued investments in market development and innovation
• Industry restructuring (Indalex)
• A number of selected add-ons, e.g. Haticon (solar, Germany) and Autocar(trailer systems, Italy)
SEB Enskilda Nordic Seminar 201048
Key focus in 2009 has been to reduce the break even levels
• In 2009 in total NOK 1.6 bn volume driven cost has been taken out to adjust to declining market volumes
• In addition, NOK 320 million of sustainable savings have been achieved until end of Q3 through;– Productivity improvements– Overhead reductions– Plant footprint optimisation
• Reduction of 2 200 FTEs September year-on-year1)
• Potential of realising an additionalNOK 160 million sustainable savings in Q4
(1) Excluding Indalex
SEB Enskilda Nordic Seminar 201049
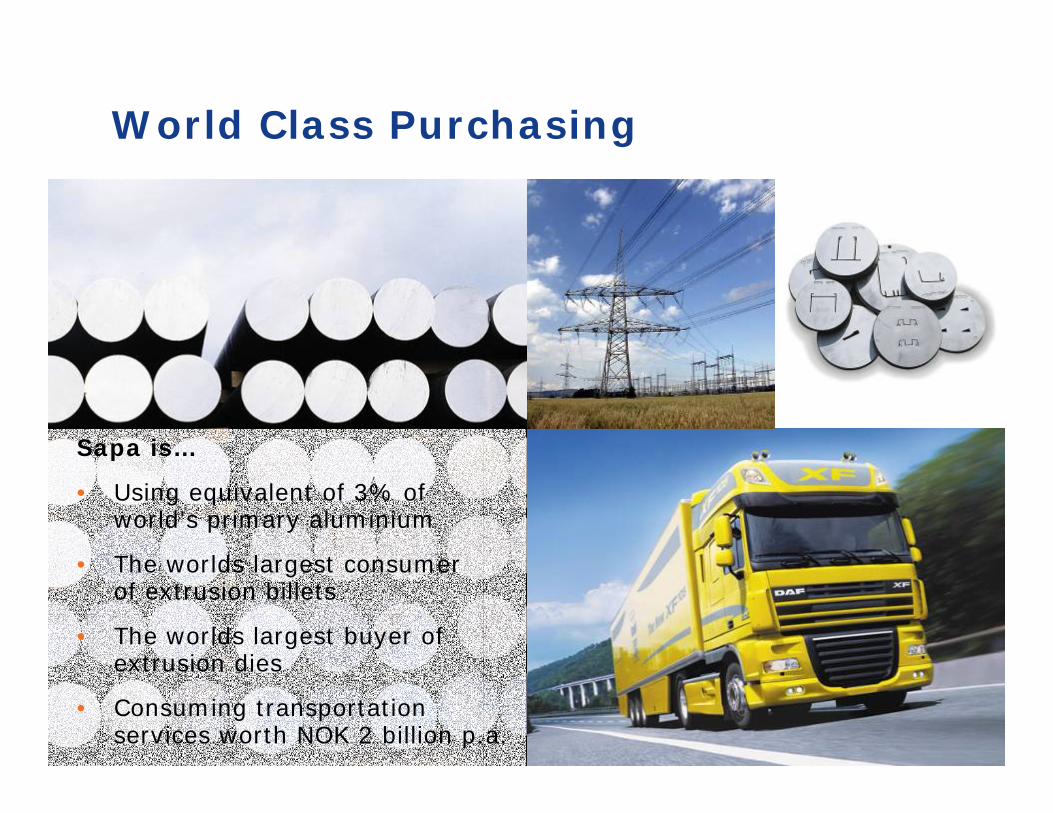
World Class Purchasing
Sapa is…
• Using equivalent of 3% of world’s primary aluminium
• The worlds largest consumerof extrusion billets
• The worlds largest buyer of extrusion dies
• Consuming transportation services worth NOK 2 billion p.a.
SEB Enskilda Nordic Seminar 201050
Solar - REC (39.73 %) and Elkem Solar

SEB Enskilda Nordic Seminar 201051
183675 865 830
1,3281,855272
290 300
230
230640
2,463
140
220
357
1,042
Stable PV market 2009 vs 2008
300 400500
1 1001 300
200
1 700
5 900
2 800
2000
• Weak H1 due to financial crisis
• Strong H2 driven by increased end user return
• Significant volume growth in most markets
• Significant price pressure reducing revenue and profit pools
~6 000
2009e20082007200620052004200320022001
Spain
*Main markets include Italy, South Korea and FranceSource: SolarBuzz (SB), IEA, Photon, EPIA, own analyses
Estimated annual module installations (MW)
Germany
Japan
ROW*
USA

SEB Enskilda Nordic Seminar 201052
• Improved demand after weak H1 2009
– Strong end user IRR
– Most other markets compensating for cap in Spain
– Improved financing
• Oversupply
• Price pressure/quality focus
2008 Currently 2011
• Incentive driven demand growth
• Silicon bottleneck causing undersupply/ super profits
• High margins/volume focus
Attracting new players Imbalances/shake-out
• Renegotiations
• Production moving east
• Financial distress
Attractive opportunities provided clear competitive advantages
• Robust long term drivers
• Increased PV competitiveness
• Growth for cost/quality leaders
• Differentiated profitability
Anticipated shifts in the PV market

SEB Enskilda Nordic Seminar 201053
Long term drivers remain strong
• Economic growth and increased energy demand
• Environmental concerns
• Strong political support from current and new markets
• Continued cost reductions improve PV competitiveness
• However, continued cost reduction and political support will continue to be important for future growth
Source: SolarBuzz (SB), IEA, Photon, EPIA, own analyses
Estimated annual module installations (MW)
675 865 8301,328
1,855272290 300
230
230640
2,463
140
220
357
1,042
1 1001 300
1 700
5 900
2 800
~6 000
2009e20082007200620052004
SEB Enskilda Nordic Seminar 201054
• Production ramp-up– Successful restart in October after fire
– Ramp-up according to revised plan
– Targeting full capacity by end 2010
• Quality– Production according to customer specifications
– Equivalent performance as polysilicon on key metrics (cell efficiency, yield*, degradation etc)
• Market– Continued dialogue with customers regarding 2010 deliveries
– Market introduction more challenging due to oversupply
Elkem Solar: Ramp-up the main focus in 2010
* Slightly lower ingot yield at 100% Elkem Solar Silicon due to thicker top cut

SEB Enskilda Nordic Seminar 201055
REC (39.73 %)
• Obtain technical and cost leadership within silicon with the FBR technology and be among the top players within wafers
• Finalise ongoing expansion projects (Moses Lake, Singapore, Herøya and Glomfjord), including a successful ramp-up to industrial scale
• Establish ”world class operations” in all parts of the operations

SEB Enskilda Nordic Seminar 201056
Thank you for your attention!