Embed Size (px)
Citation preview

ELSEVIER European Journal of Operational Research 103 (1997) 83-94
EUROPEAN JOURNAL
OF OPERATIONAL RESEARCH
Theory and Methodology
The option value of advanced R & D
Enrico Pennings ", Onno Lint Department of Industrial Economics, EUR H17-25, P.O. Box 1738, 3000 DR Rotterdam, The Netherlands
Received l September 1995; accepted 1 September 1996
Abstract
Existing tools for making R&D investment decisions cannot properly capture the option value in R&D. Since many new products are identified as failures during the R & D stages, the possibility of refraining from market introduction may add a significant value to the NPV of the R&D project. ]'his paper presents new theoretical insight by developing a stochastic jump amplitude model in a real setting. The option value of the proposed model depends on the expected number of jumps and the expected size of the jumps in a particular business. The model is verified with empirical knowledge of current research in the field of multimedia at Philips Corporate Research. ]'his way, the gap between real option theory and the practice of decision making with respect to investments in R &D is diminished. © 1997 Elsevier Science B.V.
Keywords: Research and development; Capital budgeting; Real options
1. Introduction
Major international companies with large research departments time and time again face the difficulty of selecting an appropriate portfolio of research pro- jects. The net present value (NPV) rule and other discounted cash flow techniques for capital budget- ing seem to be inapt to build a portfolio of research projects as they favor short term projects in rela- tively certain markets over long term and relatively uncertain projects. Without turning risks to develop products with uncertain future payoffs into opportu- nities to gain competitive advantage, companies can- not survive in the long run. The costs of developing these new products in uncertain markets are low in comparison to the investment costs which are neces- sa W for a global market introduction. Therefore R& D investments can be thought of as the price of an
• E-mail: [email protected].
option on major follow-on investments. Accordingly, the theory of real options can be applied to R & D investments as we will discuss next.
Up to the moment of market introduction, man- agement has the flexibility to react on unexpectcd events which change the NPV of the research project and hence to revise the decision to continue with research on the new product and eventually market this product. The theory of real options, introduced by Kester (1984) and Myers (1984), takes market uncertainty and managerial flexibility to abandon projects that appear not to bc fruitful into account. From a real option perspective, it might be worth- while to undertake R & D investments with a nega- tive NPV when early investment can provide infor- mation about future benefits or losses of a project, a notion that is consistent with the analysis by Roberts and Weitzman (1981). Since R & D projects are char- acterised by a long planning horizon and high uncer- tainty, the value of managerial flexibility can be substantial. Only when market and technology uncer-
0377-2217/97/$17.00 ,~3 1997 Elsevier Science B.V. All rights reserved. PII S0377-2217(96)00283-4

84 E. Pennings, O. Lint/European Journal of Operational Research 103 (1997) 83-94
tainty tend to zero and the investment that is required for market introduction of the newly developed prod- uct is reversible - i.e. the investment can be undone and expenditures can be recovered - the conven- tional NPV-rule for capital budgeting yields the same results as real option analysis. Mitchell (1990) out- lined in this journal a real option framework for developing a strategy for technology and argues that it could be a major tool for new business assessment since senior business management in successful cor- porations is constantly probing the R & D organisa- tions for quantifiable impact or potential benefit from technical programs. We will extend his strate- gic view with a quantitative model for the option value of R & D , which can be used for managerial decision making.
The aim of this paper is to present a model for estimating the uncertainty of the underlying asset of R & D options and to diminish the gap between theory and empiricism in real options analysis, con- cerning R & D investments. Almost all theoretical contributions on real option analysis end with the conclusion that theory has run ahead without empiri- cal support; see for example the recent review of investment under uncertainty in Dixit and Pindyck (1994). In co-ordination with Philips we developed and implemented an easy model to value their re- search projects and to get the finance department involved in research at an early stage. A study by Szakonyi (1994) shows that on average there does not exist any discussion between finance and R & D departments. This stems from traditional product de- velopment processes in which R&D, finance and marketing appear sequentially. In order to develop an appropriate framework, we will briefly discuss major issues in options assessment. We will respectively give attention to the exercise moment (European versus American option), risk-neutral valuation, non-tradability, biases in estimates and discontinuous arrival of information due to business shifts.
Real options investment analysis mainly uses the Black and Scholes (1973) formula for pricing Euro- pean options. These options cannot be exercised prior to maturity in contrast to American options which can be exercised at any moment up to matu- rity. R & D options are typically European since mar- ket introduction before successful completion of the R & D stages may have severe implicatiovls on future
market share. On the other hand, by waiting to introduce the new product, a company may lose first mover or pioneering advantages, see for example Urban et al. (1986). Especially in markets which are characterised by decreasing product-life cycles and growing competition, competitive advantage primar- ily exists in the early stages of the product-life cycle. Therefore management will exercise R & D options just at the industrialisation moment when the NPV is positive at that moment. For an overview of the current status of real option theory and applications, see Trigeorgis (1993).
The Black and Scholes formula was originally derived for options in financial markets, where it has become a major tool for valuing contingent claims. For the derivation of their formula Black and Sc- holes assumed that the asset, on which the option is contingent (the underlying assct) is traded and con- structed a hedge portfolio with a long position in the asset ,and a short position in the option. They used a no-arbitrage argument to argue that this portfolio is riskless. This argument cnables us to use risk-neutral valuation. With real options however, the underlying asset is non-traded and hence we need the assump- tion of complete markets in order to use risk-neutral valuation; see for example Majd and Pindyck (1987). When markets are complete, all risk can be hedged by trading securities. Complete markets are assumed throughout the literature on capital budgeting includ- ing this article. It allows us to derive the strongest results.
A far more striking problem that arises from the observation that the underlying asset of a real option is non-traded concerns the estimation of the volatility of the underlying asset. In contrast with financial options, there are no historic time scrics that enable us to estimate the uncertainty of the underlying asset. However, it is a well-established fact that the option value is very sensitive to the uncertainty of the underlying asset. Reasonable estimates of the volatil- ity are therefore required. Often, the value of the underlying asset depends on price movements of natural resources. Brennan and Schwartz (1985), fol example, value the option to mothball and later reactivate a copper mine. With a time series of copper prices, an estimate of the variance can be obtained. Another example is given in Quigg (1993). She values the option to wait to develop land and

E. Pennings, O. Lint/European Journal of Operational Research 103 (1997) 83-94 85
uses data on land transactions to get an estimate of the variance. Options in R&D require another esti- mation approach. At Merck, they take stock volatil- ity in order to approximate the volatility of the NPV of future cash flows resulting from pharmaceutical R&D; see Nichols (1994). Using judgements of senior management to attain reasonable values for the uncertainty provides another approach. Unfortu- nately, no convincing heuristics have been proposed so far.
Another interesting difference with financial op- tions is imbedded in the underlying value of the option. While the current value of the underlying asset of financial options is known, the underlying value of real options is stochastic at present, as it hinges on estimates of future profits. However, un- certainty in the estimate of the underlying value will not change the option value at present nor the invest- ment rule at maturity of the option. This result follows from the irreversibility of the investment. When the option is in the money at maturity, the investment rule is to invest. In fact, the usual NPV- rule applies. By the stochastic nature of the underly- ing value, the option may appear to be out of the money after the product has been introduced as well as deeper in the money. However, when the underly- ing value is an unbiased estimator, the expected value of the project value outcome equals the esti- mated underlying value. Since at maturity the invest- ment rule only depends on the underlying value and hence the spread around this value is irrelevant, estimation errors in the underlying value do not affect the option value and can hence be assumed to equal zero.
In this article we assume that unbiased estimates of net cash flows that are generated by the irre- versible investment are provided to management. Clearly, this assumption is used in all discounted cash flow studies. We also assume that the costs associated with the irreversible investment, required for market introduction, and the necessary time for completing R&D can be given with reasonable ac- curacy. In order to focus on uncertainty and the arrival of information over time, we will abstain from dividends.
The approach we propose in this paper builds upon discontinuous arrival of information that affects the present value of future net cash flows. Black and
Scholes analysis assumes that the underlying asset follows a geometric Brownian motion, which is highly questionable for the value of innovative re- search projects. It implies a continuous arrival of information that changes the underlying variable. In financial markets the underlying assets are traded and new information will directly be reflected in the prices of the assets. Information that affects future net cash flows of research projects will however arrive at discrete points in time. So in real markets managers will not continuously adjust the present value of future cash flows, but will only adjust it when information with strategic impact arrives. Moreover, from interviews with senior management we found that currently the financial status of re- search projects, once undertaken, will only sporadi- cally be revised in the case of arrival of new infor- mation. Examples of adjustments in the present value of future net cash flows include the discovery of new production technologies resulting in cost reduction, or the fast entrance of competitors with a market penetrating strategy so that future prices erode. In the first example cash outflows drop and accordingly the present value of future cash flows increases. The second example induces a reduction in cash inflows and hence in the net present value of future cash flows. A Poisson (jump) process would be able to describe these movements in the underlying variable. This way, the variance of the underlying asset can be decomposed in three parameters, respectively reflect- ing the expected number of information arrivals and the expected jump sizes of both upward and down- ward shifts.
When a business shift has occurred, management can revise the business plan, recalculate the option value and rebalance the R&D portfolio. Positive shifts might result in a higher budget and more R&D efforts while negative shifts might have an opposite effect. Investment decisions with a positive probability that the present value of future cash flows jumps to zero have been examined by McDon- ald and Siegel (1986). Jumps in financial assets in general were first introduced by Cox and Ross (1975). In their paper, the jump process follows a determinis- tic movement upon which are superimposed discrete jumps. Merton (1976) suggests a model in which the stock price has stochastic jumps superimposed upon geometric Brownian motion. From our experience

86 E. Pennings, O. Lint /European Journal o f Operational Research 103 (1997) 83 -94
that information arrives discontinuous in time we present a model in which the present value of future cash flows follows a deterministic movement upon which are superimposed stochastic jumps. Baldwin and Meyer (1979) also consider Poisson jump pro- cesses and irreversible investments in real assets. Their model differs from our approach in that the arrival rate of investment opportunities - instead of the arrival rate of information that changes a single project value - is Poisson distributed, though the arrival of a new invcstment opportunity might be information that affects the value of an existing project.
Strebel (1992) argues that business discontinuities are oRen accompanied by sharp shills in competitive behaviour. Competitive shifts consist of standardisa- tion shifts and rejuvenation shifts. Successive exam- ples of these shifts include standardisation of tech- nique and introduction of differentiated products, designed to increase perceived value. With the shrinking product and technology life cycles in to- day 's markets, he asserts that standardisation shifts often follow closely on rejuvenation shifts. We found that such competitive breakpoints frequently occur in the product development process and have a large impact on the decision whether to industrialise the new product at the end of the R & D stage or not.
This article is organised as follows. In Section 2 we develop a model for valuing options on R & D projects. From approximating the distribution of the present value of future net cash flows by a lognormal distribution, we can deduce the standard deviation of the lognormal distribution fi'om the parameters m the jump diffusion model. Subsequently, the option value of advanced R & D is calculated. Section 3 deals with a case on the option value of R & D on optical tapc that we studied at Philips. From a sample of jumps during the R & D process in the field of muhimedia, an estimate of the uncertainty of the underlying asset will be derived. Finally, Section 4 concludes.
2. A real option model for valuing R & D projects
In the introduction we argued that a geometric Brownian motion does not seem to fit with a man- agerial decision making process. It seems that uncer- tainty about the NPV of the new product at the
moment of industrialisation arises due to unforeseen events. A manager will only exercise a real option - market the new product - at the moment of industri- alisation (T) when the expected present value of future net cash flows (S) exceeds the investment sum (I) . The expected present value of future profits will be adjusted a random number of times between the present time (t) and the moment of industrialisation. We will assume that the waiting time until new information arrives, w, that has such strategic impact that future cash flows will be revised, is exponen- tially distributed with parameter 0:
Wi ~ exp( O ). (1)
During this waiting time, no random shocks occur. A major advantage of the exponential distribution is the no-memory property. This implies that the probabil- ity of arrival of new strategic information does not depend on the arrival of past strategic information. The exponential distribution also implies that the number of strategic information arrivals, n, follows a homogeneous Poisson process with intensity parame- ter h = 1 /0 . Hence the expected number of arrivals of strategic information during the research period [t,T] is equal to hi7/'--t]. The parameter h will typically depend on the kind of business of the research projects.
Philips acts in technology-based markets which are characterised by a large number of events as there exists both technology and market uncertainty; see Moriarty and Kosnik (1989). Technological im- provements are rapidly expanding and it is crucial which standard will be accepted in the market. At the same time consumer preferences rapidly change and product life cycles are shrinking. Both styliscd facts have a positive impact on the number of business events during the R & D stage. During this stage standardisation of new products is the most impor- tant goal, since only one technology standard can survive. Well-known examples inch, de the analog video market in which Philips (V2000), Sony (Be- tamax) and Matsushita (VlfS) competed for an ana- log video standard and recently the digital video standard for which Philips and Sony jointly com- peted with Toshiba and Time Warner.
From a financial perspective, market introduction of a new product depends on the NPV at time T. The NPV in turn depends on the preferences of software

E. Pennings, O. Lint~European Journal of Operational Research 103 (1997) 83-94 87
producers who will eventually choose the new stan- dard. Issues on standardisation can be considered as events as they positively affect market uncertainty. So in technology based markets A will be large. On the other hand irreversible investments in, for exam- ple, infrastructure will not yield very much strategic information during the research period, and hence A will be lower in these markets.
The market value of future net cash flows condi- tional on industrialisation, based upon all informa- tion at time t, .(~(t), with .(2(t) _c_ .Q(s) for t < s _< T, is equal to
a c
S(t) = E e x p ( - ( V + i)lx)E[CVr+i[g2(t)], (2) i = 0
where /x denotes the f i rm's cost of capital and CF r.. the net cash flow, i years after the irreversible investment. We assume that all cash flows have equal risk characteristics and hence that p. is con- stant for all cash flows. The option value, F , at the moment of industrialisation is defined as
F ( S ( T ) ) = max[0, S ( T ) - 11. (3)
Since T is fixed and the option cannot be exercised prior to the moment of industrialisation as industrial- ising the new product requires full completion of the R & D stage, the option is European.
Under some conditions, Black and Scholes (1973) show that it is possible to create a riskless hedge portfolio and the resulting differential equation is free of risk preferences. Consequentially, they can take any growth rate for the underlying asset and calculate the expected value of the underlying asset at maturity. Risk neutral valuation, which uses the risk-free rate as a growth rate of the underlying asset, is most common in financial markets to value contin- gent claims. When the underlying asset follows a jump diffusion process, Merton (1976) argues that it is not possible to construct a riskless hedge portfolio, consisting of stocks and options, l le also shows that the expected return on these securities should equal the riskless rate, when it is assumed that the Capital Asset Pricing Model holds and the jump component will be uncorrelated with the world economy. In that case the CAPM /3 is zero and the jump components only represent non-systematic risk. When the under- lying variable is traded, the non-systematic risk can be diversified and Merton (1976) derives an option
pricing formula, but unfortunately it is not a closed form solution.
Jump components in R & D projects will in gen- eral be uncorrelated with the aggregate market, as most of these jumps occur due to innovations in technology, actions of competitors, changes in strat- egy or shifts in demand of particular lines of busi- ness. Hence, assuming complete markets, we can apply risk-neutral valuation and take the risk-free rate, r, as growth rate of the underlying asset.
From the previous analysis we suggest that the process for S(t) in a risk-neutral world follows a jump process with drift r :
d S ( t ) = rS( t)dt + S( ,)dn, (4)
where dn equals 0 with probabili ty 1 - - A d t and a jump of size '-'", with probabili ty Adt . When the jump amplitude, measured as a proportional increase in the underlying variable, is deterministic and posi- tive, the process for S boils down to the pure jump model, suggested by Cox and Ross (1975). The idea of stochastic jump amplitudes closely matches our perception of management ' s decision making pro- cess, as the impact of new information is random. From the observation that the underlying variable does not change when no new information arrives, a geometric Brownian motion that captures continuous changes in the value of the underlying asset can be disregarded. So our basic model is less complicated than Merton 's (1976) jump diffusion model. Our analysis rather focuses on a model for the stochastic jump amplitude and the consequences of the use of the stochastic jump amplitude model in a real setting.
An important issue is that we can only observe jumps with amplitudes that will be different from zero. This results from the definition that jumps only occur when strategic information arrives which alters future cash inflows or cash outflows. There is a probabili ty that the strategic information affects the cash inflows and cash outflows in the same way, such that their joint impact on the underlying vari- able will be close to zero. Since this will seldom occur in practice, we will assume a probabili ty den- sity function which will take the value of zero when the jump amplitude is zero. In our analysis we will treat the jump amplitude as a product of two random variables, one variable describing the direction of the jump and one variable describing the absolute size of

88 E. Pennings, O. Lint~European Journal of Operational Research 103 (1997) 83-94
the jump. The Weibull distribution with shape pa- rameter 2, known as the Rayleigh distribution, seems to fit the absolute jump size best. The jump ampli- tude, "-",, is therefore given by
= = x , r , , (5)
where
1 with probability p,
Xi = - 1 with probability 1 - p, (6)
[',.IX i + Wei(Yx ,2 ). (7)
When p = 0.5 and y_ ] = y] the distribution is sym- metric. The model however allows for non-symmet- ric jumps, so that up-side jumps may be more likely than down-side jumps. Illustrations of a symmetric density and an asymmetric density of ~ are respec- tively given in Fig. la and Fig. lb.
Of particular interest is that it must hold that the expected jump size is larger for down-side jumps than for up-side jumps when upward jumps are more likely than downward jumps. This results fi'om the obserw~tion that the unconditional distribution of the jump anaplitude always has to equal zero. Otherwise the expected future cash flows should be changed since these cash flows reflect the mean of the ex- pected jump sizes. For empirical purposes it seems that it is more convenient to assume a symmetric stochastic jump amplitude. The mean and variance of ~_ilX i a r e given by
E[ x,] = (8)
and
VAR[~-,IXi] = (1 - ¼v)yx2,. (9)
Hence, the unconditional meart of ~ is zero when the following equation holds:
p'y] = ( 1 - - P ) 7 ,- (10)
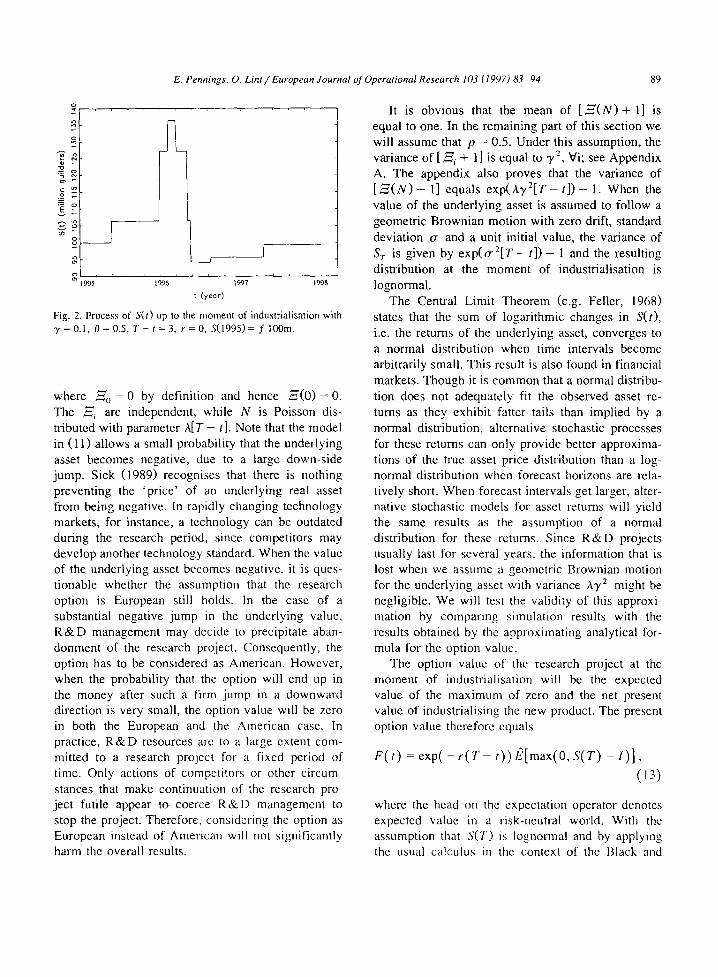
It is straightforward that y~ = y_ ~ when the proba- bility of positive and negative jumps is equal. In that case we will refer to these parameters as y. Follow- ing the lines of Merton (1976), the resulting sample path for S(t) will show finite .jumps with stochastic amplitude at discrete points in time. A realisation of such a sample path, with ( 7 " - t ) is 3 years, an expected waiting time for strategic information of half a year and an expected absolute jump amplitnde
c
o E
(a) o
+/, o
d
o __ o - 0 , 3 -0 .2
\ L O0 02
I
- 0 . ! 0.1 0.3
I l
-0.5 -0.4 -0.2 0.0
E,
Fig. I. (a) Dens i ty o f j u m p ampl i tude --~, with p = 0.5, 3' = 0 . 1 ;
(b) dens i ty o f j u m p ampl i t ude ~ , with p = 0.75, y: == 0.08.
,'y ~ = 0.24.
\ C.2 C.( 0.5
of 0.05(,-r is given in Fig. 2. This parameter choice implies that the expected number of jumps is equal to 6.
In order to calculate the option value, we need the distribution of S(T). Observe that S(T) can be writ- ten as
S ( T ) = S ( t ) [ ~ ' ( N ) + 1], (11)
with for N > 0,
N
+ 1] = F I [_=, + 1], ( ]2) i = 0
E. Pennings, O. Lint/European Journal of Operational Research 103 (1997)83-94 89
o
o
.~ o
3~ 3~ t.o
o o _ _
o 1995'
I
l _ _ _ _ I i , i ~ L , • , i
1996 1997
: (year)
~199g
Fig. 2. Process of S(t) up to the moment of industrialisation with 3' = 0.l, 0 = 0.5, i t ' - t = 3, r = 0, S(1995) = f 100m.
where --~o = 0 by definition and hence ~ ( 0 ) = 0. The ~ . are independent, while N is Poisson dis- tributed with parameter A [ T - t]. Note that the model in (11) allows a small probabili ty that the underlying asset becomes negative, due to a large down-side jump. Sick (1989) recognises that there is nothing preventing the 'p r ice ' of an underlying real asset from being negative. In rapidly changing technology markets, for instance, a technology can be outdated during the research period, since competitors may develop another technology standard. When the value of the underlying asset becomes negative, it is ques- tionable whether the assumption that the research option is European still holds. In the case of a substantial negative jump in the underlying value, R & D management may decide to precipitate aban- donment of the research project. Consequently, the option has to be considered as American. However, when the probabili ty that the option will end up in the money after such a firm jump in a downward direction is very small, the option value will be zero in both the European and the American case. In practice, R & D resources arc to a large extent com- mitted to a research project for a fixed period of time. Only actions of competitors or other circum- stances that make continuation of the research pro- ject futile appear to coerce R & l ) management to stop the project. Therefore, considering the option as European instead of American will not significantly harm the overall results.
It is obvious that the mean of [ ~ ( N ) + 1] is equal to one. In the remaining part of this section we will assume that p = 0.5. Under this assumption, the variance of [ ~ i + 1] is equal to y 2, Vi; see Appendix A, The appendix also proves that the variance of [ ~ ( N ) + 1] equals exp(Ay2[T - t ] ) - 1. When the value of the underlying asset is assumed to follow a geometric Brownian motion with zero drift, standard deviation o- and a unit initial value, the variance of S T is given by e x p ( o - 2 [ T - t]) - 1 and the resulting distribution at the moment of industrialisation is lognonnal.
The Central Limit Theorem (e.g. Feller, 1968) states that the sum of logarithmic changes in S(t), i.e. the returns of the underlying asset, converges to a normal distribution when time intervals become arbitrarily small. This result is also found in financial markets. Though it is common that a normal distribu- tion does not adequately fit the observed asset re- turns as they exhibit fatter tails than implied by a normal distribution, alternative stochastic processes for these returns can only provide better approxima- tions of the true asset price distribution than a log- normal distribution when forecast horizons are rela- tively short. When forecast intervals get larger, alter- native stochastic models for asset returns will yield the same results as the assumption of a normal distribution for these returns. Since R & D projects usually last for several years, the information that is lost when we assume a geometric Brownian motion for the underlying asset with variance AT 2 might be negligible. We will test the validity of this approxi- mation by comparing simulation results with the results obtained by the approximating analytical for- mula for the option value.
The option value of the research project at the moment of industrialisation will be the expected value of the maximum of zero and the net present value of industrialising the new product. The present option value therefore equals
F ( t ) = exp( - r ( T - t ) ) 12[max(O, S ( T ) - I ) ] ,
(]3)
where the head on the expectation operator denotes expected value in a risk-neutral world. With the assumption that S(T) is lognormal and by applying the usual calculus in the context of the Black and

90 E. Pennings, O. Lint~European Journal of Operational Research 103 (1997) 83-94
Scholes analysis, it can be shown that this equation can be rewritten as
F( ,) = S( ,),I,( +
- 1~( d)exp( - - r ( T - - t)), (14)
where
ln( S ( t ) / l ) + (r-- ½AT2)(T - t) d = ; . ( 15 )
v , a ( r - t) r
and q3 denotes the cumulative density function of a standard normal distribution.
3. Case: the option value of R & D in optical tape recording
A main research topic at Philips Electronics at this moment are innovations in the field of multime- dia. Research topics include a variety of differenti- ated and complementary items, such as blue lasers, multimedia IC's, High Density Compact Disc (HDCD), solid state data storage and optical tape. Philips spends approximately 600 million Dutch guilders ( f 600m) on research annually, while, in total, Philips spends approximately f 3500m on R& D. In this article we analyze the results of the option approach to the research project on optical tape recording and focus on three main issues: technol- ogy, market and finance.
It should be noted that the data in this section are stylised and do not necessarily correspond with real- ity and the standpoints in this article do not represent former or current standpoints of Philips on resea,ch or product development policy. The research back- ground of the case, however, is based on the actual situation as Philips has already disclosed the current research and technological status of the project; see Van Rosmalen et al. (1994). The case is used to offer new insight in the option value of advanccd R & I ) and to show how the model can be used as an operational tool for managerial decision making on product development.
First, we will give a brief description of the technology that forms the basis for the optical tape. The new optical tape recording system is based on a very fast rotating polygon mirror. This system com- bines a high data rate with a high storage density and
fast access. The recording system is compact and, apart from the polygon mirror, requires only simple mechanics. As optical storage has entered the audio, data and, now, digital-video domains, the search for higher information densities has led, for example, to lasers with shorter wavelengths. Using higher-quality optics, today's most advanced source-coding tech- niques (MPEG) and bluc lasers, instead of current infrared lasers, will result in a major increase in the CD's capacity, which now contains 784 Mbyte. Moreover, with the latest double-layered HDCD, developed in conjunction with Sony, the CD capacity has already been increased by a factor 10 to 7.4 GByte.
However, advanced multimedia applications in the foreseeable future will require even more storage capacity. Optical tape rccording offers a solution to this issue. Also, with optical tape both read and write applications are easily possible. The research on optical tape recording within Philips has been led by the idea of developing a mass storage system for a mass storage application and therefore it should be non-expensive and simple. The concept is originally based on film recording. It is a one-laser system based on beam deflection by a polygon mirror. An objective lens with a field of 1 mm and an aperture of 0.45 can resolve approximately 1600 bits per scan. The data rate is limited by the scan frequency of the polygon. If a data rate in the order of 30 Mhi t / s is desirable, which is reasonable for a system with a very high storage capacity, the scanrate has to be around 18 kHz. For a six facet polygon, this results in a rotation flequency of 3 kHz which implies 180000 rotations per minute. Philips has proven that such a device can be made. This way, optical tape recording carl provide an attractive way to store anti - contactlessly .... distribute large amounts of data and therefore provides exclusive opportuni- ties for mt, ltimedia applications. At this moment the storage capacity of optical tape amounts to 75 Ghyte. This is a hundred times more capacity than the p,'esent CI-) and ten tinms more than the double- layered H1)CD.
When we take a glance at the marketing aspects of optical tape recording, wc note that market condi- tions for optical tape seem to be flourishing in today's information age. Muhimcdia and electronic highways will demand high data storage capacities

E. l'ennings, O. Lint / European Journal of Operational Research 103 (1997) 83-94 91
for relatively low prices in the near future. Optical tape might suffice this future demand, but its market- ing success will mainly depend on product strategies of competitors, the adoption of software producers and standardisation. Negotiations with other large electronic companies, like Sony, will be necessary for a successful market introduction.
Now that the technological and marketing back- ground of optical tape recording have been de- scribed, we will discuss the financial implications of the investment project. Research on the optical tape will take about five years before a potential market introduction of the optical tape. After these five years, in 2000, irreversible capital and marketing expenditures will be required to m~mufacture the optical tape in large amounts. During these years a lot of events may occur that change future net cash flows. It may even be the case that market conditions change in a negative way and hence market introduc- tion will not be fruitful in 2000 because of large downward jumps.
To be able to calculate the option value, which can be regarded as discounted cash flows plus a flexibility premium, we need estimates of the un- known parameters 0, ",/_ i and y~. Standard text- books on statistics show that maximum likelihood estimators of these parameters are given by
r / i , 1
i E_, v , , x . . . . . 1 , 1 , ( 1 7 )
with N i denoting the number of observations for which X~= X. These estimators are known to be asymptotical ly normal and efficient. As the number of observations for a historic unique investment pro- ject is not large, the parameter estimates may be cumbersome. Pooling data of investment projects in the same business can improve the parameter esti- mates. The data we obtained from our optical tape investment analysis were mingled with the data we obtained from other investment projects in multime- dia, It will do no harm to the results as the risk characteristics of the optical tape project are quite similar to the characteristics of other multimedia projects. 'Fo ease computation, y_~ and "g~ are
Table l Parameter estimates
/) 0.299 0.107
assumed to be equal. The parameter estimates we obtained are given in Table 1.
These parameter estimates are based on a number of events in mult imedia that happened between Jan- uary 1990 and February 1995. Hence the length of the time interval we considered is 5.08 years. In total 17 events are gathered and, by the relationship be- tween A and 0, it can be verified that the estimate of 0 in Table 1 matches 5 .08 /17 . Some of the events studied are company confidential, but most of them are publicly known. All events have been judged by senior management to gauge their impact on the NPV of the different research projects. Events in- clude discussions on standardisation, strategic al- liances, patent positions and technological break- throughs. As our application of a Rayleigh distribu- tion to the absolute jump size may look arbitrary', a chi-squarcd goodness-of-fi t test is used to test Ho:
l ; - W c i ( r , 2 ) .
Appendix A shows that we cannot reject H o at the a = 0.10 level of significance and hence it appears that the Weibull distribution well fits the absolute jump sizes.
Estimates of future net cash flows from 2000 to 2007 are obtained from senior management. They are based on expected market size, the expected market share of Philips and the market profitability. The value of these future cash flows at time T, generated by market introduction of optical tape, equals f 1200m. The investment at the industrialisa- tion moment, necessary for rnarket introduction, has been estimated at f 1400m. These investment costs include building manufacturing plants and market introduction costs. It is obvious that the NPV of total future cash flows is negative and therefore conven- tional capital budgeting would not support investing in optical tape. The NPV calculation however denies the flexibility of not investing in optical tape at the moment of industrialisation.
To enable the determination of the option value, we need to specify the remaining parameters: /2. and

92 E. Pennings, O. Lint / European Journal of Operational Research 103 (1997) 83-94
r. The firm's costs of capital at Philips is fixed at 12% and the risk-free rate over the period 1995 to 2000 is set equal to the annual return on govcrnmcnt bonds with a maturity of five years (7.0%). Hcnce S ( 1 9 9 0 ) = f 6 6 0 m . From the parameter values in Table 1, it follows that the annual volatility (the square root of AT 2) equals 0.2. With these parame- ters, it can be verified that the option value of the optical tape recording project amounts to f 33.1m. Monte Carlo simulation of 5000 sample paths yields an option value of f 32.3m. Despite this relatively small error, the most delicate problem that causes far more serious errors in the option value is still the estimation of future cash flows.
As we discussed in the introduction, the option value serves as a concrete instrument to research management and shows two sides of the same coin: on the one hand the overall R & D budget for optical tape recording should not exceed f 33.1 m. This way, in terms of capabilities and allocation of researchers, guidelines for the optimal total number of re- searchers working on this project throughout the R & D phase can be derived. Moreover, a balanced and optimised R & D portfolio that is consistent with current financial thinking can be created.
On the other hand, the option value of the poten- tial benefits of marketing optical tape recording is estimated in an appropriate way that goes far beyond conventional myopic methods like payback, NPV, ROI or percentage methods. The option wdue can be used in practice for transparent communication and open discussions with relevant Product Divisions or Business Groups: the optical tape recording project is of interest, not in spite of the risk characteristics and a negative NPV, but because of these risk char- acteristics, since they can be handled proactively by management. With proactive option management downward risk is limited while upward potential is maximised.
this tool would therefore be limited. Accordingly, we changed our plan, and proposed a model which appeared to be a closer match to reality. It appeared that changes in the underlying variable - the NPV of future cash inflows generated by market introduction of the new product - occurred at a random number of times during the R & D period. These up- or downward changes have different impact on the underlying variable and are therefore assumed to be stochastic. To calculate the option value, stochastic processes for the events and their impact have been specified and its parameters have been estimated in the case of a specific research project in the field of multimedia. At Philips Corporate Research we were able to calculate the option value of seventeen R & D projects of which one is illustrated in this paper. Though the NPV of the whole project was ncgative, the large uncertainty in the field of multimedia ac- counted for an option value of approximately 5% of the underlying value. Besides financial grounds there are, of course, strategic reasons to invest in an R & D program. Empirically based option models provide a first step into the amalgamation of finance and strat- egy as they assign a higher value to long tcrm strategic R & D projects than traditional discounted cash flow models.
Directions for future research include estimation of the jump parameters in other R&D-dr ivcn indus- tries. Also, the assumption of a European option might be relaxed by introducing a special kind of Bermudan options or compound options. Bermudan options can only be exercised at particular moments, for instance when constlmer demand for luxury prod- ucts is sufficiently large. When market introduction is considered as a timing option (an American per- petual option), investment in R & D can be thought of as an option on an option, i.e. a compound option.
Acknowledgements
4. Discussion and conclusion
Our first intention at Philips was to implement a kind of Black and Scholes option formula to value their research projects. Determining the standard de- viation of the underlying value, however, appeared to be arduous within R & D practice and future use of
The authors would like to thank three anonymous referees, most notewo,thy the referee who completed the proof in Appendix A. Also they are indebted to discussants at Philips Corporate Research, especially Feijc Meijer and Cecs vail Uycn. Furthermore they wish to thank Enrico Perotti for helpful comments and suggestions, qhe tisual disclaimer applies. Finan-

E. Pennings, O. Lint / European Journal of Operational Research 103 (1997) 83- 94 93
cial support from the Technology Foundat ion (STW) in the Nether lands is greatfully acknowledged.
Append ix A
A.1. Derivat ion o f the variance o f [~--i + 11
Table 2 Observed and expected frequencies of the absolute jump size
Absolute jump size <0.08 0.08-0.11 >0.11
Observed (o i) 8 5 5 Probabilities (pl) 0.45 0.24 0.32 Expected ( e i) 7.65 3.91 5.44
V A R [ ~ + 1]
= V A R [ X i ~ . ] = E x [ V A R ( X i F / Xi)]
+ VARy, [ E(XF, IX,)] =(1-' u r r ) y + VARx,
= (1 - ¼~r)y 2 + ¼"rr'y2Ex,[ Xi 21
= y 2"
A.2. P r o o f that V A R ( ~--(N)) = e x p ( A T 2 ( T - t)) - 1
Proof , Let 3'~ = T- ~ = Y and p = 0.5. First of all we have that
E [ ( ~ ' ( N ) + 1) 2 ]
= =-1) e N = n n = O
= Y'. E ~ i + 1) 2 P N = n n = 0 =
=) i=
'~ ~ ( A ( T - t ) ) " e x p ( - A ( T - t ) ) = E + l)
n! n = 0
= e x p ( A ( T - t ) y 2 ) .
The first and second equality follow from the independence of ~',, i = 0 . . . . . N, the third from the fact that E[ "-~i] = 0 and the fourth from the fact that v A R [ -=,1 = ,,/L
Because
E[ , . ~ ( N ) - F - 1 ] -- 1,
we have that
V A R [ ~ ( N ) + 1] = e x p ( a ( T t ) T -~) I. 17
A.3. A chi-squared goodness-of-f i t test applied to the
distribution o f
Suppose we wish to test H 0 : F ~ W e i ( y , 2) us ing a chi-squared goodness-of-f i t test. First, divide the sample space into 3 cells, say A~ . . . . . A 3, let p j - -
P[ F E Aft and let o./ denote the n u m b e r of observa- t ions that fall into the j - th cell. Under H 0 the expected n u m b e r in the j - th cell equals 18,o/.
H0: F ~ W e i ( y , 2 ) is rejected at the 10% signifi- cance level if
X 2 = E > xo.9o(l) = 2 .71. j= 1 ej
Table 2 depicts the observed and expected frequen- cies for the chi-squared test of a Rayleigh distribu- tion with o~ estimated at 0.103. We find that X 2 :-: 0.70 and hence we cannot reject H 0 at the a - 0 . 1 0 level of significance.
R e f e r e n c e s
Baldwin, C.Y., and Meyer, R.F. (1979), "Liquidity preference under uncertainty: A model of dynamic investment in illiquid opporlunities", Journal of Financial Economics 7/2, 347- 374.
Black, F., and Scholes, M. (1973), "The pricing of options and corporate liabilities", Journal of l'olitical Economy 81/3, 637-659.
Brennan, M.J., and Schwartz. E.S. (1985), "Evaluating natural resource investments", Journal of Bu.~iness 58/I , 135-157.
Cox, J.C., and Ross, S.A. (1975), "The pricing of options for jump processes", Working Paper. Rodney I.. White Center for Financial Research, University of Pennsylvania.
Dixit, A.K., and Pindyck, R.S. (1994), hu;es'tment under Uncer- tainty, Princeton University Press. Princeton, NJ.
Feller, W. (1968), An lntroduciion to Probability Theory and its Applications, Vol. 1, 3rd ed., Wiley, New York.
Kester, W.C. (1984), "Today's options for tomor.,-ow's growth", ttarvard Business Review 62/2, 153 160.
Majd, S., and Pindyck, R.S. (1987). "'Time to build, option value

94 E. Pennings, O. Lint / European Journal of Operational Research 103 (1997) 83.- 94
and investment decisions", Journal of Financial Economics 18/1, 7--27.
McDonald, R., and Siegel, D. (1986), "The value of waiting to invest", Quarterly Journal of Economics 101/4, 707-728.
Merton, R.C. (1976), "Option pricing when underlying stock returns are discontinuous", .lournal of Financial Economics 3/1, 125-144.
Mitchell, G.R. (1990), "Alternative frameworks for technology strategy", European Journal of Operational Research 47/2, 153-161.
Moriarty, R.T., and Kosnik, T.J. (1989), "lligh-tech marketing: Concepts, continuity and change", Sloan Management Ret;iew 30/4, 7-17.
Myers, S.C. (1984), "Finance theory and financial strategy", lnterJaces 14/I, 126- 137.
Nichols, N.A. (1994), "The new pharmaceutical paradigm", Harc'ard Business Ret;iew 72/1, 88-105.
Quigg, I.. (1993), "Empirical testing of real option-pricing rood. els", Journal of Finance 48/2, 621-639.
Roberts, K., and Weitzman, IM.L. (1981), "Funding criteria for
research, development and exploration projects", Economet- rica 49/5, 1261-1288.
Sick, G. (1989), "Capital budgeting with real options", Mono- graph, New York University, Salomon Brothers Center, New York.
Strcbel, P. (1992), Breakpoints: How Managers Exploit Radical Business Change, Harvard Business School l~ress, Boston, MA.
Szakonyi, R. (1994), "Measuring R and D effectiveness II", Research-Technology Management 37/2, 27-32.
Trigeorgis, L. (1993), "Real options and interactions with finan- cial flexibility", Financial Management 22/3, 202.-224.
Urban, G.L., Carter, T., Gaskins, S., and Mucha, Z. (1986), "Market share rewards to pioneering brands: An empirical analysis and strategic implications", Management Science 32/6, 645-659.
Van Rosmalen, G.E., Kahlman, J.A.II., Put, P.LM., and Van Uyen, C.M.J. (1994), "A compact optical tape recording system", Invited paper, presented at the 1994 Topical Meeting on Optical Data Storage, Dana Point, CA.