Embed Size (px)
Citation preview

THE OF
H O M E L E SS N E SSSTAT E
IN AMERICA2 0 1 5
AN EXAMINATION OF TRENDS IN HOMELESSNESS, HOMELESSNESS ASSISTANCE,
AND AT-RISK POPULATIONS AT THE NATIONAL AND STATE LEVELS.

The National Alliance to End Homelessness (Alliance) is a lead-
ing national voice on the issue of homelessness. To accomplish
its mission of ending homelessness, the Alliance uses data and
research to identify the nature of, and solutions to, the prob-
lem. It analyzes policy to determine how best to advance these
solutions. And, it helps build the capacity of communities to imple-
ment strategies that help them end homelessness.
The Homelessness Research Institute (HRI), the research and
education arm of the National Alliance to End Homelessness, works
to end homelessness by building and disseminating knowledge.
The goals of HRI are to build the intellectual capital around solu-
tions to homelessness; to advance data and research to ensure that
policymakers, practitioners, and the caring public have the best
information about trends in homelessness and emerging solutions;
and to engage the media to promote the proliferation of solid data
and information on homelessness.
0206365476

EXECUTIVE SUMMARY
E X E C U T I V E S U M M A RY
CHAPTER ONE
T H E S TAT E O F H O M E L E S S N E S S I N A M E R I C A
CHAPTER TWO
P O P U L AT I O N S AT R I S K O F H O M E L E S S N E S S
CHAPTER THREE
T H E S TAT E O F T H E H O M E L E S S A S S I S TA N C E S Y S T E M
APPENDIX
A P P E N D I X : M E T H O D O L O G Y

The State of Homelessness in America 2015 is the fifth in a series of reports that
chart progress in ending homelessness in the United States. It uses the most
recently available data to present national and state trends in homelessness
between 2013 and 2014, trends in populations at risk of homelessness from 2012
to 2013, and trends in the types and utilization of assistance available to people
experiencing homelessness.
REPORT CONTENTS
This report is intended to serve as a desktop reference for policymakers, journalists, and
community and state leaders. Chapter 1 details national and state trends in the overall
homeless population and subpopulations, including individuals, families, and veterans. 1
While Chapter 1 presents national and state data on youth homlessness for 2014,
changes in youth homelessness from 2013 to 2014 are not presented as the data
is considered less complete than data in other categories. Chapter 2 presents
trends in populations at-risk of homelessness, including households experienc-
ing severe housing cost burden and people living doubled up with family and
friends. Chapter 3 analyzes the types and scope of assistance available to people
experiencing homelessness and utilization of those resources. This report uses
the most recently available data from a variety of sources: the U.S. Department
of Housing and Urban Development (HUD), the U.S. Census Bureau, and the U.S.
Bureau of Labor Statistics.
E X E C U T I V E SU M M A RY
EXEC
UTI
VE
SUM
MA
RY
1 National estimates of homelessness include the 50 states, the District of Columbia, Guam, Puerto Rico, and the U.S. Virgin Islands. For the purposes of discussing state trends in this report, we refer to the 51 states, which includes the 50 states and the District of Columbia.

3
E X E C U T I V E SU M M A RY
REPORT HIGHLIGHTS
HOMELESSNESS
On a single night in January 2014, 578,424 people
were experiencing homelessness—meaning they
were sleeping outside or in an emergency shelter or
transitional housing program. From 2013 to 2014, a
period of ongoing recovery from the Great Recession,
overall homelessness decreased by 2.3 percent and
homelessness decreased among every major sub-
population: unsheltered persons (10 percent), families
(2.7 percent), chronically homeless individuals (2.5
percent), and veterans (10.5 percent).
• 34 states had decrease in overall homelessness, while
17 states saw increases. 40 states had decreases in
the number of people living in unsheltered locations,
including the street, cars, and abandoned buildings.
• The national rate of homelessness fell to 18.3 homeless
people per 10,000 people in the general population,
but the rate in individual states ranged from 120 in
Washington, D.C. to 7 in Mississippi.
• The rate of veteran homelessness continued its descent
of the past several years to 25.5 homeless veterans per
10,000 veterans in the general population, but the rate
in individual states ranged from 146 in Washington,
D.C. to 9 in Virginia.
• The majority of states had decreases in every major
subpopulation: family homelessness (32 states),
chronically homeless individuals (27 states), and
veteran homelessness (28 states).
POPULATIONS AT RISK OF HOMELESSNESS
Many poor people are at risk of homelessness. Ulti-
mately, this is because it is hard for them to afford
housing. Unemployment, housing cost burden, and
living doubled up are indications of this struggle to
afford housing. Longitudinal trends and changes from
2012 to 2013 indicate populations at risk of home-
lessness may not be experiencing the benefits of the
economic recovery.
• The number of unemployed people fell 8.4 percent
and the unemployment rate continued its multi-year
decline, falling to 7.4 percent. Nearly all states saw
decreases in the number of people unemployed, with
only 6 states seeing modest increases in the number
of unemployed people.
• Despite improvements in employment, the number of
people in poverty (4.8 million) and the poverty rate
(15.8 percent) remained relatively steady. 26 states
saw an increase in the number of people in poverty;
25 saw a decrease.
• The number of people in poor households living doubled
up with family and friends grew to 7.7 million people,
an increase of 3.7 percent from 2012 to 2013, with 39
states seeing increases. Since 2007, the number of
people living doubled up has increased 67 percent.
• The number of poor renter households experienc-
ing severe housing cost burden, those households in
poverty paying more than 50 percent of their income
toward housing, total 6.4 million in 2013, decreasing
by 2.8 percent nationally from 2013 with 37 states
seeing a decrease. Since 2007, the number of poor
households with severe housing cost burden has in-
creased 25 percent.
THE STATE OF HOMELESSNESS IN AMERICA EXECUTIVE SUMMARY

HOMELESS ASSISTANCE SYSTEM
Communities across the country respond to homeless-
ness with a variety of programs: emergency shelters,
transitional housing, rapid re-housing, and permanent
supportive housing. The HEARTH Act, passed in 2009,
placed a greater emphasis on permanent supportive
housing and rapid re-housing as permanent housing
solutions to homelessness. The shift away from tran-
sitional housing as a response to homelessness began
to be seen in 2013 and continued in 2014.
• Rapid re-housing capacity grew dramatically—nearly
doubling from 19,847 beds in 2013 to 37,783 beds in
2014, a 90 percent increase. 40 states increased rapid
re-housing inventory.
• The number of permanent supportive housing beds
continued to grow from 2013 to 2014 by 15,984 beds
(5.6 percent) to a total of 300,282 beds. 35 states saw
increases and 15 states saw decreases.
• Nationwide, emergency shelter utilization remained
at the same highs seen between 2007 and 2013, with
102 percent of emergency shelter beds full at the
time of the point-in-time count. Transitional housing
utilization was lower, at 84 percent.
MOVING FORWARD
The number of people who are homeless, defined as
those sleeping outside and in homeless assistance
programs, continues to decrease despite the fact
that housing situations for low-income populations
continue to be poor. This is probably in part because
targeted federal funding to address homelessness is
at its highest level in history: $4.5 billion in fiscal year
2015 for a variety of programs spanning HUD, VA,
the U.S. Department of Health and Human Services,
and the U.S. Department of Education. In addition to
increased resources, the homeless assistance field
has shifted its focus to permanent housing solutions
to homelessness: permanent supportive housing and
rapid re-housing capacity continues to grow.
Homelessness may be decreasing, possibly due to
improvements in the homeless assistance system,
but this system alone cannot overcome the afford-
able housing crisis. Housing remains unaffordable
for a large swath of the American public. This was
the case prior to the recession, worsened during the
recession, and has not improved since the end of
the recession. Mainstream low-income assistance
programs should be attentive to households’ living
situations and help maintain housing stability when-
ever possible and, more importantly, communities,
states, and the federal government should urgently
prioritize investment in affordable housing.
4
$ 4.5 BIN 2015, FEDERAL FUNDING TO ADDRESS HOMELESSNESS TOTALED
EXECUTIVE SUMMARY THE STATE OF HOMELESSNESS IN AMERICA

THE STATE OF HOMELESSNESS IN AMERICA
5

The January 2014 point-in-time count2 is the most recent national estimate of
homelessness in the United States. The count identified 578,424 people expe-
riencing homelessness,3 which translated to a national rate of homelessness
of approximately 18 homeless persons out of every 10,000 persons in the
general public. From 2013 to 2014, homelessness decreased overall and amongst
every major subpopulation: unsheltered homelessness, families, chronical-
ly homeless individuals, and veterans. Homeless unaccompanied youth and
children represented 7.8 percent of the overall homeless population, but it
remains unlikely that the point-in-time counts present an accurate enumeration
of this population.4
This chapter provides longitudinal national trends in overall homelessness and
all subpopulations. State by state changes from 2013 to 2014 are detailed for
overall homelessness and for each subpopulation.
CH
APT
ER O
NE
THE OF
IN AMERICA
H O M E L E SS N E SSSTAT E
2 Every year, during the last 10 days of January, communities across the country conduct an enumeration of home-less persons living in emergency shelter, transitional housing, or on the street, in what is commonly known as a point-in-time count.
3 For the purposes of this report, homelessness or homeless refers to the definition set by HUD, which considers an individual homeless if he or she lives in an emergency shelter, transitional housing program (including safe havens), or a place not meant for human habitation, such as a car, abandoned building, or on the streets.
4 Unccompanied children and youth were first differentiated in the point-in-time counts in 2013 and communities are still adopting and developing strategies to ensure that homeless youth are captured during the point-in-time count.

7
HOMELESS POPULATION AND SUBPOPULATIONS
The January 2014 point-in-time count identified 578,424 people experiencing homelessness. Figures 1.1 and
1.2 illustrate the breakdown of homeless populations and subpopulations in 2014. Though the vast majority
of the homeless population (401,051 people) lived in some form of shelter or in transitional housing in 2014,
approximately 31 percent of all the population (177,373 people) lived in a place not meant for human
habitation, such as the street or an abandoned building.
The largest subpopulation experiencing homelessness was individuals, comprising almost 63 percent
(362,163 people) of all homeless people. About 37 percent were people in families (216,261 people in 67,513
households). Individuals who were chronically homeless represented almost 15 percent (84,291 people) of
the homeless population, while people in chronically homeless families made up approximately 3 percent
(15,143 people) of the homeless population. About 9 percent (49,933 people) of the homeless population
was made up of veterans. Unaccompanied youth and children accounted for 7.8 percent (45,205 people) of
the total homeless population.5
THE STATE OF HOMELESSNESS IN AMERICA CHAPTER ONE
FIGURE 1.1 H O M E L E S S P O P U L AT I O N A N D S U B P O P U L AT I O N S , 2 0 1 4
OVER
ALL
SHELT
ERED
UNSH
ELTER
ED
INDIV
IDUALS
PEOPLE IN
FAM
ILIE
S
CHRO
NIC
ALLY
HO
MELESS
INDIV
IDUALS
CHRO
NIC
ALLY
HO
MELESS
PERSO
NS IN
FAM
ILIE
S
UNACCO
MPA
NIE
D
CHIL
DREN
AND
YOUTHV
ETERANS
7 0 0,0 0 0
5 0 0,0 0 0
3 0 0,0 0 0
1 0 0,0 0 0
8 0,0 0 0
6 0,0 0 0
4 0,0 0 0
2 0,0 0 0
0
FAM
ILY
HO
USEH
OLD
S
5 7 8,4 2 4
4 0 1 , 5 0 1
1 7 7, 3 7 3
3 6 2 , 1 63
2 1 6 , 2 6 1
8 4 , 2 9 1
1 5,14 3
4 9,9 3 3 4 5, 2 0 5
6 7, 5 1 3
5 An individual or family is considered chronically homeless if he or she or, in the case of a family, a head of a household, has a disabling condition and has been continuously homeless for 1 year or more or has experienced at least 4 episodes of homelessness in the last 3 years. Prior to the 2013 point-in-time count, information on chronic homelessness was collected only for individuals. In 2013 and 2014, information on chronic homelessness was collected for both individuals and families.

8
CHAPTER ONE THE STATE OF HOMELESSNESS IN AMERICA
TRENDS IN HOMELESS POPULATION AND SUBPOPULATIONS
Figure 1.3 displays the trends in homelessness in America since 2007, showing a decrease overall and across
every subpopulation since initial measurement. The most dramatic decreases in homelessness have been
amongst veterans and people experiencing chronic homelessness: a 33 percent decline in veteran homeless-
ness since 2009 and a 30 percent decline in chronic homelessness since 2007.
NON-CHRONIC PEOPLE IN FAMILIES (201,118)
NON-CHRONIC INDIVIDUALS (277,872)
CHRONIC INDIVIDUALS (84,291)
CHRONIC PEOPLE IN FAMILIES (15,143)
3 %
4 8%
3 5 %
1 5 % FIGURE 1.2 M A J O R H O M E L E S S S U B P O P U L AT I O N S , 2 0 1 4
3 3 %DECREASE IN VETERAN
HOMELESSNESS IN 5 YEARS

7 0 0,0 0 0
6 0 0,0 0 0
5 0 0,0 0 0
4 0 0,0 0 0
3 0 0,0 0 0
2 0 0,0 0 0
1 0 0,0 0 0
6 5 1 , 1 4 2
4 1 5, 5 9 7
2 3 5, 5 4 5
2 5 9,74 1
1 2 0,4 8 8 1 2 0,7 9 01 0 8 , 3 3 3 1 0 7,1 8 3 1 0 3 , 9 1 5
74 ,0 5 0 74 ,7 7 0 6 5,6 4 5 6 0,7 6 9
4 5, 2 0 51 5,14 3
1 6 , 5 3 9
9 6 ,6 6 1 8 6,4 5 5 8 4 , 2 9 1
2 3 6, 2 4 6
2 5 7, 3 0 7 2 3 8,110
2 3 0, 3 0 8
2 4 1 ,9 5 1
2 3 6 , 9 2 3
2 3 6 , 1 8 1
2 3 2 ,9 0 1
2 3 9,4 0 3
2 3 2 ,8 2 7
2 2 2 , 1 9 7
1 9 7,0 7 0
2 1 6 , 2 6 1
1 7 7, 3 7 3
4 0 7,4 2 23 9 5, 5 0 6 3 9 8 , 5 1 5
3 8 9,0 3 6 3 8 3 , 5 7 93 6 9, 5 7 1 3 6 2 , 1 6 3
6 4 3 ,6 6 8 6 3 3 ,6 1 6 6 4 0,4 6 66 2 5, 2 1 7 6 2 2 ,9 8 2
5 9 1 ,7 6 85 7 8 ,4 2 4
0
5 5,7 7 9
4 5,6 1 64 9,9 3 3
2007 2008 2009 2010 2011 2012 2013 2014
OVERALL
INDIVIDUALS
PEOPLE IN FAMILIES
UNSHELTERED PEOPLE
CHRONICALLY HOMELESS INDIVIDUALS
VETERANS
UNACCOMPANIED CHILDREN & YOUTH
CHRONICALLY HOMELESS PEOPLE IN FAMILIES
FIGURE 1.3 S U B P O P U L AT I O N T R E N D S , 2 0 0 7 -2 0 1 4
9
THE STATE OF HOMELESSNESS IN AMERICA CHAPTER ONE
3 3 %

POINT-IN-TIME
E ST I M AT E S OF
H O M E L E SS N E SS

The State of Homelessness in America series and
prior reports on the incidence and prevalence of
homelessness use point-in-time counts as the mea-
sure of homelessness. On a given night in January,
communities, organized into Continuums of Care
(CoCs), count the number of people experiencing
homelessness in emergency shelters and transition-
al housing and those sleeping outside and in other
places not meant for human habitation.6 CoCs re-
port the data to HUD through the annual application
for homeless assistance grants as well as through
the homelessness Data Exchange (HDX). This data
is disseminated through the Annual Homeless
Assessment Report to Congress (AHAR). Electron-
ic administrative records are used to enumerate
people living in emergency shelters and transitional
housing. An organized unsheltered count that enu-
merates people living in places not meant for human
habitation is required every other year, although
most communities conduct an unsheltered count
annually as well. These two counts, the sheltered
and unsheltered counts, provide information on
nationwide trends in homelessness.
The point-in-time counts are not without limita-
tions. There is variation in count methodology
year to year within and across communities. Point-
in-time counts are, however, the only measure
that enumerates people experiencing unsheltered
homelessness in addition to those who are sheltered.
Communities were not mandated to conduct an
unsheltered count in 2014, and yet 78 percent of
communities completed one. Unsheltered counts
are conducted by outreach workers and volunteers
who canvas CoCs and count the number of people
who appear to be living in places not meant for
human habitation. Unsheltered counts have more
limitations than sheltered counts and there is more
variation in methodology.
Despite its flaws, the annual point-in-time counts
result in the most reliable estimate of people expe-
riencing homelessness in the United States.
POINT-IN-TIME COUNTS ARE
THE ONLY MEASURE THAT
CAPTURE SHELTERED AND
UNSHELTERED PEOPLE
EXPERIENCING HOMELESSNESS.
E ST I M AT E SH O M E L E SS N E SS
6 There are populations other than those captured in the point-in-time count who are eligible for homeless assistance services, including those who will be without housing within 14 days or are living unstably doubled up or couch-surfing.

12
AK(24.3)
AL(9.4)
AR(9.9)
AZ(15.8)
CA(29.7)
CO(19.0)
CT(12.4)
DC(119.9)
DE(9.7)
FL(21.2)
GA(16.5)
HI(49.3)
IA(10.1)
ID(13.1)
IL(10.2) IN
(9.1)
KS(9.6)
KY(11.6)
LA(10.0)
MA(31.7)
MD(13.3)
ME(20.5)
MI(12.4)
MN(15.5)
MO(12.0)
MS(7.4)
MT(17.2)
NC(11.7)
ND(17.4) NE
(16.2)
NH(10.4)
NJ(13.1)
NM(13.2)
NV(37.8)
NY(41.0)
OH(10.2)
OK(10.9)
OR(31.0)
PA(12.0) PR
(11.4)RI
(11.3) SC(10.6)
SD(10.5)
TN(14.5)
TX(10.8) UT
(10.6)
VA(8.5)
VT(24.9)
WA(26.5)
WI(10.5)
WV(10.9)
WY(13.0)
18.3 18.3
FIGURE 1.4 2 0 1 4 S TAT E R AT E S O F H O M E L E S S N E S S C O M PA R E D T O N AT I O N A L R AT E ( 1 8 . 3 )
CHAPTER ONE THE STATE OF HOMELESSNESS IN AMERICA
National Rate (18.3)

13
AK(24.3)
AL(9.4)
AR(9.9)
AZ(15.8)
CA(29.7)
CO(19.0)
CT(12.4)
DC(119.9)
DE(9.7)
FL(21.2)
GA(16.5)
HI(49.3)
IA(10.1)
ID(13.1)
IL(10.2) IN
(9.1)
KS(9.6)
KY(11.6)
LA(10.0)
MA(31.7)
MD(13.3)
ME(20.5)
MI(12.4)
MN(15.5)
MO(12.0)
MS(7.4)
MT(17.2)
NC(11.7)
ND(17.4) NE
(16.2)
NH(10.4)
NJ(13.1)
NM(13.2)
NV(37.8)
NY(41.0)
OH(10.2)
OK(10.9)
OR(31.0)
PA(12.0) PR
(11.4)RI
(11.3) SC(10.6)
SD(10.5)
TN(14.5)
TX(10.8) UT
(10.6)
VA(8.5)
VT(24.9)
WA(26.5)
WI(10.5)
WV(10.9)
WY(13.0)
18.3 18.3
HOMELESSNESS BY STATE
National trends do not provide a detailed picture
of homelessness across the country. The following
sections examine homelessness at a state level to
illustrate contrasts throughout the 50 states and the
District of Columbia.
RATE OF HOMELESSNESS BY STATE
Figure 1.4 shows the variation in rates of homeless-
ness by state per 10,000 people compared to the
national rate. In 2014, the national rate of people
experiencing homelessness was 18.3 people per
10,000 people. This is a decrease of about 1 person
per 10,000 people from 2013.
THE STATE OF HOMELESSNESS IN AMERICA CHAPTER ONE

MAP 1.1
C H A N G E I N OV E R A L L H O M E L E S S N E S S , 2 0 1 3 -2 0 1 4
-9.6%
3.8%
-12.0%
-3.9%
25.0%
18.1%
-7.1%
-20.6%
-6.0%
-0.6%-2.6%
2.8%
-39.2%
-19.1%
-3.8%
3.3%
-4.9%
-3.8%
-11.9%
-23.0%
-15.1%
1.2%
2.0%
-0.8%
-2.4%-2.1%
-3.0%
-1.2%
-7.4% -2.7% -2.7%
-13.2%
-22.7%
-5.6%
-7.9%
-4.1%
6.1%
1.6%
4.1%
7.2%
-4.9%
11.6%
-14.0%0.0%
-2.8%
-4.8%
-4.3%-10.1%
-8.3%
9.2%
Less Than -15% -15% to -10% -10% to 0% More Than 0%
DC 12.9%
14
OVERALL HOMELESSNESS BY STATE
The number of people experiencing homelessness in America decreased by 2.3 percent from 2013 to 2014.
While some states—Arizona, North Dakota, South Carolina, and Wyoming—reported decreases in homeless-
ness more than 20 percent, other states—Idaho and Nevada—reported substantial increases. Map 1.1 and
Table 1.1 show the year-to-year changes in overall homelessness for each state. Figure 1.5 shows the propor-
tions of the homeless population that were sheltered and unsheltered in 2014.
CHAPTER ONE THE STATE OF HOMELESSNESS IN AMERICA

TABLE 1.1
C H A N G E I N OV E R A L L H O M E L E S S N E S S , 2 0 1 3 -2 0 1 4
ST2014
Homeless Persons
2013 Homeless Persons
% Change
2014 Rateper 10,000
AK 1,784 1,946 -8.3% 24.3
AL 4,561 4,689 -2.7% 9.4
AR 2,936 3,812 -23.0% 9.9
AZ 10,495 10,562 -0.6% 15.8
CA 113,952 118,552 -3.9% 29.7
CO 10,028 9,754 2.8% 19.0
CT 4,450 4,448 0.0% 12.4
DC 7,748 6,865 12.9% 119.9
DE 901 946 -4.8% 9.7
FL 41,542 47,862 -13.2% 21.2
GA 16,521 16,971 -2.7% 16.5
GU 1,356 1,271 6.7% –
HI 6,918 6,335 9.2% 49.3
IA 3,122 3,084 1.2% 10.1
ID 2,104 1,781 18.1% 13.1
IL 13,107 13,425 -2.4% 10.2
IN 5,971 6,096 -2.1% 9.1
KS 2,783 2,693 3.3% 9.6
KY 5,089 5,245 -3.0% 11.6
LA 4,606 5,226 -11.9% 10.0
MA 21,237 19,029 11.6% 31.7
MD 7,856 8,205 -4.3% 13.3
ME 2,726 3,016 -9.6% 20.5
MI 12,227 11,527 6.1% 12.4
MN 8,377 8,214 2.0% 15.5
MO 7,282 8,581 -15.1% 12.0
MS 2,226 2,403 -7.4% 7.4
ST2014
Homeless Persons
2013 Homeless Persons
% Change
2013 Rateper 10,000
MT 1,745 1,878 -7.1% 17.2
NC 11,491 12,168 -5.6% 11.7
ND 1,258 2,069 -39.2% 17.4
NE 3,026 3,145 -3.8% 16.2
NH 1,376 1,447 -4.9% 10.4
NJ 11,671 12,002 -2.8% 13.1
NM 2,746 2,819 -2.6% 13.2
NV 10,556 8,443 25.0% 37.8
NY 80,590 77,430 4.1% 41.0
OH 11,823 12,325 -4.1% 10.2
OK 4,191 4,408 -4.9% 10.9
OR 12,164 13,822 -12.0% 31.0
PA 15,333 15,086 1.6% 12.0
PR 4,132 4,128 0.1% 11.4
RI 1,190 1,384 -14.0% 11.3
SC 5,057 6,544 -22.7% 10.6
SD 885 1,094 -19.1% 10.5
TN 9,415 9,528 -1.2% 14.5
TX 28,495 29,615 -3.8% 10.8
UT 3,081 3,277 -6.0% 10.6
VA 7,020 7,625 -7.9% 8.5
VI 448 482 -7.1% –
VT 1,559 1,454 7.2% 24.9
WA 18,442 17,760 3.8% 26.5
WI 6,055 6,104 -0.8% 10.5
WV 2,013 2,240 -10.1% 10.9
WY 757 953 -20.6% 13.0
US 578,424 591,768 -2.3% 18.3
15
FIGURE 1.5
S H E LT E R E D A N D U N S H E LT E R E D P R O P O RT I O N S , OV E R A L L H O M E L E S S N E S S , 2 0 1 4
TOTAL UNSHELTERED (177,373)
TOTAL SHELTERED (401,051)6 9. 3 %
3 0.7 %
THE STATE OF HOMELESSNESS IN AMERICA CHAPTER ONE

16
MAP 1.2
C H A N G E I N U N S H E LT E R E D H O M E L E S S N E S S , 2 0 1 3 -2 0 1 4
50.0%
16.8%
-18.0%
-2.1%
21.4%
68.7%
6.4%
-57.1%
-25.1%
-17.9%0.0%
-10.1%
-66.7%
-83.8%
-37.0%
-19.9%
-18.7%
-15.1%
-30.0%
-33.3%
-53.2%
46.3%
-13.1%
-6.8%
-22.7%-42.4%
10.2%
-5.5%
-37.8%-27.7% -1.8%
-23.1%
-42.3%
-17.1%
-32.5%
-17.6%
-1.6%
-24.1%
-1.3%
-11.4%
-34.2%
-10.7%
-82.9%0.0%
-33.2%
270.0%
-17.3%-31.5%
-29.3%
19.9%
DC -22.7%
Less Than -30% -30% to -10% -10% to 0% More Than 0%
UNSHELTERED HOMELESSNESS BY STATE
Most people experiencing homelessness do so while in emergency shelter or transitional housing, but
approximately one-third (31 percent) of the homeless population was unsheltered during a single night
in January 2014 (see Figure 1.5). This means they were living in a place unfit for human habitation, such as
on the street, in a car, or in an abandoned building.
From 2013 to 2014 the number of people experiencing unsheltered homelessness decreased by 10 per-
cent. Map 1.2 and Table 1.2 illustrate changes in unsheltered homelessness from 2013 to 2014 in each state.
Because, Continuums of Care in some states and territories—Connecticut, New Mexico, Puerto Rico, and
Virgin Islands—reported no change in unsheltered homelessness.
CHAPTER ONE THE STATE OF HOMELESSNESS IN AMERICA

TABLE 1.2
C H A N G E I N U N S H E LT E R E D H O M E L E S S N E S S , 2 0 1 3 -2 0 1 4
ST2014
Unsheltered Persons
2013 Unsheltered
Persons
% Change
AK 145 205 -29.3%
AL 1,043 1,443 -27.7%
AR 1,433 2,148 -33.3%
AZ 2,569 3,131 -17.9%
CA 71,437 72,998 -2.1%
CO 1,945 2,163 -10.1%
CT 919 919 0.0%
DC 396 512 -22.7%
DE 37 10 270.0%
FL 21,691 28,192 -23.1%
GA 8,307 8,461 -1.8%
GU 1,230 1,143 7.6%
HI 3,105 2,590 19.9%
IA 196 134 46.3%
ID 636 377 68.7%
IL 1,698 2,196 -22.7%
IN 403 700 -42.4%
KS 249 311 -19.9%
KY 831 754 10.2%
LA 1,103 1,575 -30.0%
MA 759 850 -10.7%
MD 1,589 1,922 -17.3%
ME 93 62 50.0%
MI 2,152 2,188 -1.6%
MN 795 915 -13.1%
MO 973 2,080 -53.2%
MS 821 1,320 -37.8%
ST2014
Unsheltered Persons
2013 Unsheltered
Persons
% Change
MT 834 784 6.4%
NC 2,617 3,155 -17.1%
ND 464 1,395 -66.7%
NE 109 173 -37.0%
NH 133 202 -34.2%
NJ 935 1,399 -33.2%
NM 428 428 0.0%
NV 5,759 4,745 21.4%
NY 4,103 4,157 -1.3%
OH 1,103 1,338 -17.6%
OK 932 1,146 -18.7%
OR 6,063 7,390 -18.0%
PA 1,032 1,359 -24.1%
PR 2,726 2,726 0.0%
RI 20 117 -82.9%
SC 1,808 3,133 -42.3%
SD 55 339 -83.8%
TN 3,032 3,207 -5.5%
TX 10,267 12,090 -15.1%
UT 313 418 -25.1%
VA 690 1,022 -32.5%
VI 363 363 0.0%
VT 163 184 -11.4%
WA 5,902 5,053 16.8%
WI 343 368 -6.8%
WV 430 628 -31.5%
WY 194 452 -57.1%
US 177,373 197,070 -10.0%
17
4 0 STATES REPORTED A DECREASE
IN UNSHELTERED HOMELESSNESS FROM 2013 TO 2014
THE STATE OF HOMELESSNESS IN AMERICA CHAPTER ONE

18
MAP 1.3
C H A N G E I N P E O P L E I N H O M E L E S S FA M I L I E S , 2 0 1 3 -2 0 1 4
-5.2%
-1.3%
-13.5%
-7.6%
44.9%
24.8%
-13.3%
6.5%
2.6%
6.1%-8.8%
-12.5%
-55.7%
-26.4%
-9.6%
3.1%
-0.2%
5.2%
-11.8%
-0.8%
-24.3%
1.2%
5.3%
0.9%
5.3% -13.9%
-10.6%
-0.2%
-21.2%11.1% 0.7%
-22.4%
-31.2%
-13.9%
-9.9%
-12.6%
9.3%
-2.0%
3.8%
-2.3%
-10.5%
17.1%
-21.3%2.5%
-11.6%
-14.6%
-3.6%-24.6%
-1.5%
6.3%
Less Than -20% -20% to -10% -10% to 0% More Than 0%
DC 19.8%
FAMILY HOMELESSNESS BY STATE
The number of people in homeless families reported in point-in-time counts in 2014 decreased by nearly
3 percent from 2013. The vast majority of homeless families were in sheltered locations (see Figure 1.6).
Map 1.3 and Table 1.3 show the changes in people in homeless families by state from 2013 to 2014. Table 1.4
shows the changes in homeless family households by state from 2013 to 2014.
CHAPTER ONE THE STATE OF HOMELESSNESS IN AMERICA

19
TABLE 1.3
C H A N G E I N P E O P L E I N H O M E L E S S FA M I L I E S , 2 0 1 3 -2 0 1 4
FIGURE 1.6
S H E LT E R E D A N D U N S H E LT E R E D P R O P O RT I O N S , P E O P L E I N H O M E L E S S FA M I L I E S , 2 0 1 4
ST2014 Persons
in Families2013 Persons
in Families%
Change
AK 575 584 -1.5%
AL 1,446 1,302 11.1%
AR 633 638 -0.8%
AZ 4,301 4,052 6.1%
CA 23,187 25,094 -7.6%
CO 4,455 5,090 -12.5%
CT 1,381 1,347 2.5%
DC 3,795 3,169 19.8%
DE 317 371 -14.6%
FL 12,812 16,503 -22.4%
GA 4,118 4,091 0.7%
GU 1,024 975 5.0%
HI 3,168 2,980 6.3%
IA 1,578 1,560 1.2%
ID 870 697 24.8%
IL 5,757 5,467 5.3%
IN 2,018 2,345 -13.9%
KS 1,250 1,213 3.1%
KY 1,737 1,943 -10.6%
LA 1,162 1,318 -11.8%
MA 14,449 12,335 17.1%
MD 2,876 2,984 -3.6%
ME 1,378 1,453 -5.2%
MI 4,692 4,291 9.3%
MN 4,725 4,486 5.3%
MO 2,975 3,929 -24.3%
MS 512 650 -21.2%
ST2014 Persons
in Families2013 Persons
in Families%
Change
MT 578 667 -13.3%
NC 3,993 4,638 -13.9%
ND 372 839 -55.7%
NE 1,133 1,253 -9.6%
NH 581 649 -10.5%
NJ 5,225 5,909 -11.6%
NM 942 1,033 -8.8%
NV 1,226 846 44.9%
NY 47,947 46,195 3.8%
OH 4,119 4,714 -12.6%
OK 1,227 1,229 -0.2%
OR 4,176 4,828 -13.5%
PA 6,974 7,113 -2.0%
PR 700 658 6.4%
RI 411 522 -21.3%
SC 1,244 1,808 -31.2%
SD 395 537 -26.4%
TN 2,615 2,619 -0.2%
TX 9,318 8,857 5.2%
UT 1,352 1,318 2.6%
VA 2,786 3,093 -9.9%
VI 23 38 -39.5%
VT 736 753 -2.3%
WA 7,052 7,143 -1.3%
WI 3,126 3,099 0.9%
WV 525 696 -24.6%
WY 294 276 6.5%
US 216,261 222,197 -2.7%
THE STATE OF HOMELESSNESS IN AMERICA CHAPTER ONE
UNSHELTERED PEOPLE IN HOMELESS FAMILIES (24,358)
SHELTERED PEOPLE IN HOMELESS FAMILIES (191,903)
8 8.7 %
1 1 . 3 %

20
TABLE 1.4
C H A N G E I N H O M E L E S S FA M I LY H O U S E H O L D S , 2 0 1 3 -2 0 1 4
ST2014 FamilyHouseholds
2013 FamilyHouseholds
% Change
AK 193 196 -1.5%
AL 457 495 -7.7%
AR 240 218 10.1%
AZ 1,295 1,291 0.3%
CA 6,956 8,267 -15.9%
CO 1,317 1,444 -8.8%
CT 495 475 4.2%
DC 1,231 983 25.2%
DE 104 119 -12.6%
FL 4,550 5,806 -21.6%
GA 1,291 1,257 2.7%
GU 180 167 7.8%
HI 790 736 7.3%
IA 487 495 -1.6%
ID 264 211 25.1%
IL 1,880 1,730 8.7%
IN 654 739 -11.5%
KS 395 387 2.1%
KY 564 672 -16.1%
LA 376 415 -9.4%
MA 4,781 4,327 10.5%
MD 948 997 -4.9%
ME 388 494 -21.5%
MI 1,521 1,412 7.7%
MN 1,422 1,338 6.3%
MO 902 1,259 -28.4%
MS 179 192 -6.8%
ST2014 FamilyHouseholds
2013 FamilyHouseholds
% Change
MT 166 207 -19.8%
NC 1,303 1,520 -14.3%
ND 120 244 -50.8%
NE 347 397 -12.6%
NH 213 229 -7.0%
NJ 1,716 1,994 -13.9%
NM 306 323 -5.3%
NV 397 319 24.5%
NY 14,338 13,675 4.8%
OH 1,314 1,501 -12.5%
OK 400 426 -6.1%
OR 1,275 1,524 -16.3%
PA 2,384 2,409 -1.0%
PR 208 185 12.4%
RI 132 177 -25.4%
SC 445 640 -30.5%
SD 121 154 -21.4%
TN 804 880 -8.6%
TX 2,784 2,826 -1.5%
UT 298 406 -26.6%
VA 883 984 -10.3%
VI 9 11 -18.2%
VT 239 262 -8.8%
WA 2,182 2,217 -1.6%
WI 1,007 1,016 -0.9%
WV 173 228 -24.1%
WY 89 84 6.0%
US 67,513 70,960 -4.9%
CHAPTER ONE THE STATE OF HOMELESSNESS IN AMERICA

21
3 6 STATES REPORTED A DECREASE IN HOMELESS FAMILY HOUSEHOLDS FROM 2013 TO 2014
THE STATE OF HOMELESSNESS IN AMERICA CHAPTER ONE

22
MAP 1.4
C H A N G E I N C H R O N I C A L LY H O M E L E S S I N D I V I D UA L S , 2 0 1 3 -2 0 1 4
37.1%19.9%
-9.7%
-3.6%
13.0%
-19.2%
21.9%
-52.5%
11.2%
-15.0% 54.6%
-1.4%
0.9%
-30.8%
7.7%
-4.6%
-5.2%
3.8%
-26.8%
-8.7%
5.8%
-23.8%
-3.3%
-2.9%
-3.8% 6.1%
55.8%
-1.3%
-32.6%-19.5% -2.5%
-12.0%
-39.7%
-11.5%
-23.5%
-20.1%
19.7%
-5.7%
7.5%
8.7%
33.2%
0.8%
-16.0%17.7%
14.8%
35.4%
21.3%8.7%
9.6%
7.6%
Less Than -20% -20% to -10% -10% to 0% More Than 0%
DC -8.8%
CHRONIC HOMELESSNESS BY STATE
Chronic homelessness is defined as homelessness among people who have a disability—including serious
mental illness, chronic substance use disorders, or chronic medical issues—and who are homeless repeat-
edly or for long periods of time.
CHRONIC HOMELESSNESS AMONG INDIVIDUALS
From 2013 to 2014, the total number of individuals experiencing chronic homelessness fell by 2.5 percent
and the majority of them were living in unsheltered locations (see Figure 1.7). Map 1.4 and Table 1.5 illus-
trate the change in the number of reported chronically homeless individuals by state from 2013 to 2014.
While some states—such as Louisiana, Mississippi, South Carolina, and Wyoming—reported large decreases
in individual chronic homelessness, other states—such as Maine, New Hampshire, and New Mexico—saw
large increases.
CHAPTER ONE THE STATE OF HOMELESSNESS IN AMERICA

TABLE 1.5
C H A N G E I N C H R O N I C A L LY H O M E L E S S I N D I V I D UA L S , 2 0 1 3 -2 0 1 4
ST2014 Chronically
Homeless Individuals
2013 Chronically Homeless
Individuals
% Change
AK 182 166 9.6%
AL 618 768 -19.5%
AR 516 565 -8.7%
AZ 904 1,064 -15.0%
CA 28,200 29,248 -3.6%
CO 1,335 1,354 -1.4%
CT 1,026 872 17.7%
DC 1,609 1,764 -8.8%
DE 88 65 35.4%
FL 6,843 7,778 -12.0%
GA 2,645 2,713 -2.5%
GU 24 51 -52.9%
HI 1,109 1,031 7.6%
IA 211 277 -23.8%
ID 156 193 -19.2%
IL 1,349 1,403 -3.8%
IN 542 511 6.1%
KS 290 304 -4.6%
KY 614 394 55.8%
LA 743 1,015 -26.8%
MA 1,590 1,577 0.8%
MD 1,515 1,249 21.3%
ME 218 159 37.1%
MI 1,160 969 19.7%
MN 885 915 -3.3%
MO 735 695 5.8%
MS 275 408 -32.6%
ST2014 Chronically
Homeless Individuals
2013 Chronically Homeless
Individuals
% Change
MT 256 210 21.9%
NC 1,284 1,451 -11.5%
ND 111 110 0.9%
NE 365 339 7.7%
NH 301 226 33.2%
NJ 1,150 1,002 14.8%
NM 617 399 54.6%
NV 999 884 13.0%
NY 4,350 4,045 7.5%
OH 1,340 1,677 -20.1%
OK 585 617 -5.2%
OR 2,207 2,444 -9.7%
PA 1,449 1,536 -5.7%
PR 1,567 1,629 -3.8%
RI 204 243 -16.0%
SC 273 453 -39.7%
SD 81 117 -30.8%
TN 1,904 1,929 -1.3%
TX 4,952 4,770 3.8%
UT 386 347 11.2%
VA 965 1,262 -23.5%
VI 88 87 1.1%
VT 199 183 8.7%
WA 2,311 1,927 19.9%
WI 436 449 -2.9%
WV 424 390 8.7%
WY 105 221 -52.5%
US 84,291 86,455 -2.5%
23
FIGURE 1.7
S H E LT E R E D A N D U N S H E LT E R E D P R O P O RT I O N S , C H R O N I C A L LY H O M E L E S S I N D I V I D UA L S , 2 0 1 4
THE STATE OF HOMELESSNESS IN AMERICA CHAPTER ONE
SHELTERED CHRONICALLY HOMELESS INDIVIDUALS (31,203)
UNSHELTERED CHRONICALLY HOMELESS INDIVIDUALS (53,088)
3 7.0 %
6 3 .0 %

CHRONIC HOMELESSNESS AMONG FAMILIES
In 2014, 7 percent of all people in homeless families were chronically homeless. 38.2 percent of people
in families experiencing chronic homelessness were unsheltered, a much higher proportion than among
all people in homeless families (see Figure 1.8). Map 1.5 and Table 1.6 display the percentage of people in
homeless families experiencing chronic homelessness by state.
24
MAP 1.5
P E R C E N TA G E O F P E O P L E I N H O M E L E S S FA M I L I E S W H O A R E C H R O N I C A L LY H O M E L E S S , 2 0 1 4
1.9%3.2%
11.7%
12.4%
0.7%
10.1%
2.4%
13.3%
2.7%
1.3% 9.8%
6.4%
1.1%
9.4%
5.4%
2.4%
7.0%
5.0%
2.8%
0.5%
8.8%
2.1%
7.4%
2.8%
2.4% 2.7%
6.5%
11.1%
1.4% 7.7% 8.7%
8.9%
0.0%
3.7%
2.0%
3.4%
2.8%
2.3%
6.0%
11.4%
6.4%
11.9%
0.0%13.7%
4.8%
0.9%
7.8%11.0%
4.2%
6.1%
DC 11.1%
0% to 5% 5% to 10%10% to 15%More Than 15%
CHAPTER ONE THE STATE OF HOMELESSNESS IN AMERICA

25
TABLE 1.6
P E R C E N TA G E O F P E O P L E I N H O M E L E S S FA M I L I E S W H O A R E C H R O N I C A L LY H O M E L E S S , 2 0 1 4
ST2014 Persons
in Chronic Families
2014 Persons in Homeless
Families
2014 Percentage of Persons in Homeless
Families That Are Chronically Homeless
AK 24 575 4.2%
AL 111 1,446 7.7%
AR 3 633 0.5%
AZ 55 4,301 1.3%
CA 2,878 23,187 12.4%
CO 286 4,455 6.4%
CT 189 1,381 13.7%
DC 420 3,795 11.1%
DE 3 317 0.9%
FL 1,146 12,812 8.9%
GA 359 4,118 8.7%
GU 43 1,024 4.2%
HI 192 3,168 6.1%
IA 33 1,578 2.1%
ID 88 870 10.1%
IL 139 5,757 2.4%
IN 54 2,018 2.7%
KS 30 1,250 2.4%
KY 113 1,737 6.5%
LA 33 1,162 2.8%
MA 1,721 14,449 11.9%
MD 225 2,876 7.8%
ME 26 1,378 1.9%
MI 133 4,692 2.8%
MN 350 4,725 7.4%
MO 262 2,975 8.8%
MS 7 512 1.4%
ST2014 Persons
in Chronic Families
2014 Persons in Homeless
Families
2014 Percentage of Persons in Homeless
Families That Are Chronically Homeless
MT 14 578 2.4%
NC 147 3,993 3.7%
ND 4 372 1.1%
NE 61 1,133 5.4%
NH 37 581 6.4%
NJ 249 5,225 4.8%
NM 92 942 9.8%
NV 8 1,226 0.7%
NY 2,862 47,947 6.0%
OH 141 4,119 3.4%
OK 86 1,227 7.0%
OR 488 4,176 11.7%
PA 158 6,974 2.3%
PR 496 700 70.9%
RI 0 411 0.0%
SC 0 1,244 0.0%
SD 37 395 9.4%
TN 291 2,615 11.1%
TX 464 9,318 5.0%
UT 36 1,352 2.7%
VA 56 2,786 2.0%
VI 0 23 0.0%
VT 84 736 11.4%
WA 224 7,052 3.2%
WI 88 3,126 2.8%
WV 58 525 11.0%
WY 39 294 13.3%
US 15,143 216,261 7.0%
FIGURE 1.8
S H E LT E R E D A N D U N S H E LT E R E D P R O P O RT I O N S , C H R O N I C A L LY H O M E L E S S P E O P L E I N FA M I L I E S , 2 0 1 4
THE STATE OF HOMELESSNESS IN AMERICA CHAPTER ONE
UNSHELTERED CHRONICALLY HOMELESS PEOPLE IN FAMILIES (5,781)
SHELTERED CHRONICALLY HOMELESS PEOPLE IN FAMILIES (9,362)
6 1 .8%3 8. 2 %

26
MAP 1.6
C H A N G E I N V E T E R A N H O M E L E S S N E S S , 2 0 1 3 -2 0 1 4
-7.3%8.7%
-13.5%
-6.2%
44.1%
3.4%
-17.2%
-15.3%
-3.1%
-29.8% 30.9%
9.9%
-37.3%
5.6%
31.7%
-5.1%
-6.6%
-29.9%
-24.0%
-21.9%
-22.7%
-11.8%
-9.2%
-5.8%
-2.6% -2.4%
-1.2%
15.2%
32.9% 6.1% -20.1%
-17.3%
10.5%
3.7%
-13.8%
2.0%
2.0%
-3.5%
-45.4%
-6.3%
36.8%
0.9%
11.3%-13.5%
16.7%
4.5%
-2.8%1.2%
-57.6%
6.3%
Less Than -20% -20% to -10% -10% to 0% More Than 0%
DC -18.6%
VETERAN HOMELESSNESS BY STATE
Veteran homelessness decreased by 10.5 percent from 2013 to 2014 across the nation. The majority of
homeless veterans were in shelters in 2014 (see Figure 1.9). Map 1.6 and Table 1.7 illustrate the changes in
veteran homelessness between 2013 and 2014 in each state. Some states—such as New Alaska, Arizona,
North Dakota, New York, and Texas—had substantially large decreases in veteran homelessness, while oth-
ers states—such as Nebraska, New Hampshire, New Mexico, and Nevada—had sizable increases in veteran
homelessness.
CHAPTER ONE THE STATE OF HOMELESSNESS IN AMERICA

27
TABLE 1.7
C H A N G E I N V E T E R A N H O M E L E S S N E S S , 2 0 1 3 -2 0 1 4 A N D R AT E O F V E T E R A N H O M E L E S S N E S S , 2 0 1 4
FIGURE 1.9
S H E LT E R E D A N D U N S H E LT E R E D P R O P O RT I O N S , H O M E L E S S V E T E R A N S , 2 0 1 4
ST2014
Veterans2013
Veterans% Change
2014 Rate Per 10,000
Veterans
AK 89 210 -57.6% 14.1
AL 542 511 6.1% 15.3
AR 361 462 -21.9% 16.5
AZ 858 1,222 -29.8% 17.2
CA 12,096 12,895 -6.2% 69.4
CO 753 685 9.9% 19.8
CT 295 341 -13.5% 15.5
DC 406 499 -18.6% 145.8
DE 93 89 4.5% 13.5
FL 4,552 5,505 -17.3% 31.3
GA 1,443 1,805 -20.1% 22.3
GU 36 32 12.5% –
HI 593 558 6.3% 55.0
IA 202 229 -11.8% 9.7
ID 215 208 3.4% 18.0
IL 1,234 1,267 -2.6% 18.8
IN 725 743 -2.4% 17.2
KS 393 414 -5.1% 19.9
KY 600 607 -1.2% 20.5
LA 437 575 -24.0% 16.3
MA 1,264 1,253 0.9% 37.1
MD 654 673 -2.8% 16.3
ME 152 164 -7.3% 12.7
MI 1,122 1,100 2.0% 18.1
MN 317 349 -9.2% 9.4
MO 652 843 -22.7% 14.9
MS 279 210 32.9% 15.2
ST2014
Veterans2013
Veterans% Change
2014 Rate Per 10,000
Veterans
MT 256 309 -17.2% 31.0
NC 1,164 1,123 3.7% 17.1
ND 151 241 -37.3% 30.9
NE 241 183 31.7% 19.3
NH 171 125 36.8% 16.1
NJ 630 540 16.7% 16.4
NM 318 243 30.9% 19.8
NV 1,369 950 44.1% 63.5
NY 2,542 4,659 -45.4% 31.6
OH 1,236 1,212 2.0% 15.6
OK 408 437 -6.6% 14.5
OR 1,292 1,494 -13.5% 44.1
PA 1,411 1,462 -3.5% 16.6
PR 87 82 6.1% –
RI 108 97 11.3% 16.8
SC 703 636 10.5% 19.2
SD 132 125 5.6% 21.3
TN 1,142 991 15.2% 24.5
TX 2,718 3,878 -29.9% 18.3
UT 317 327 -3.1% 24.2
VA 620 719 -13.8% 9.0
VI 32 33 -3.0% –
VT 120 128 -6.3% 29.2
WA 1,433 1,318 8.7% 26.5
WI 520 552 -5.8% 14.1
WV 333 329 1.2% 22.1
WY 116 137 -15.3% 23.7
US 49,933 55,779 -10.5% 25.5
THE STATE OF HOMELESSNESS IN AMERICA CHAPTER ONE
UNSHELTERED HOMELESS VETERANS (17,885)
SHELTERED HOMELESS VETERANS (32,048)6 4 . 2 %3 5.8%

28
AK(14.1)
AL(15.3)
AR(16.5)
AZ(17.2)
CA(69.4)
CO(19.8)
CT(15.5)
DC(145.8)
DE(13.5)
FL(31.3)
GA(22.3)
HI(55.0)
IA(9.7)
ID(18.0)
IL(18.8) IN
(17.2)
KS(19.9)
KY(20.5) LA
(16.3)
MA(37.1)
MD(16.3) ME
(12.7)
MI(18.1)
MN(9.4)
MO(14.9)
MS(15.2)
MT(31.0)
NC(17.1)
ND(30.9)
NE(19.3) NH
(16.1)NJ
(16.4)
NM(19.8)
NV(63.5)
NY(31.6)
OH(15.6)
OK(14.5)
OR(44.1)
PA(16.6)
RI(16.8)
SC(19.2)
SD(21.3)
TN(24.5)
TX(18.3)
UT(24.2)
VA(9.0)
VT(29.2) WA
(26.5)
WI(14.1)
WV(22.1)
WY(23.7)
25.5 25.5
CHAPTER ONE THE STATE OF HOMELESSNESS IN AMERICA

29
AK(14.1)
AL(15.3)
AR(16.5)
AZ(17.2)
CA(69.4)
CO(19.8)
CT(15.5)
DC(145.8)
DE(13.5)
FL(31.3)
GA(22.3)
HI(55.0)
IA(9.7)
ID(18.0)
IL(18.8) IN
(17.2)
KS(19.9)
KY(20.5) LA
(16.3)
MA(37.1)
MD(16.3) ME
(12.7)
MI(18.1)
MN(9.4)
MO(14.9)
MS(15.2)
MT(31.0)
NC(17.1)
ND(30.9)
NE(19.3) NH
(16.1)NJ
(16.4)
NM(19.8)
NV(63.5)
NY(31.6)
OH(15.6)
OK(14.5)
OR(44.1)
PA(16.6)
RI(16.8)
SC(19.2)
SD(21.3)
TN(24.5)
TX(18.3)
UT(24.2)
VA(9.0)
VT(29.2) WA
(26.5)
WI(14.1)
WV(22.1)
WY(23.7)
25.5 25.5
National Rate (25.5)
FIGURE 1.10 S TAT E - BY- S TAT E R AT E S O F V E T E R A N H O M E L E S S N E S S C O M PA R E D T O N AT I O N A L R AT E ( 2 5 . 5 )
Per 10,000 veterans in the United States, 25.5 were homeless in the 2014 point-in-time count. Figure 1.10
shows the rate of homeless veterans per 10,000 veterans in each state, with the District of Columbia having
the highest rate in the country.
THE STATE OF HOMELESSNESS IN AMERICA CHAPTER ONE

30
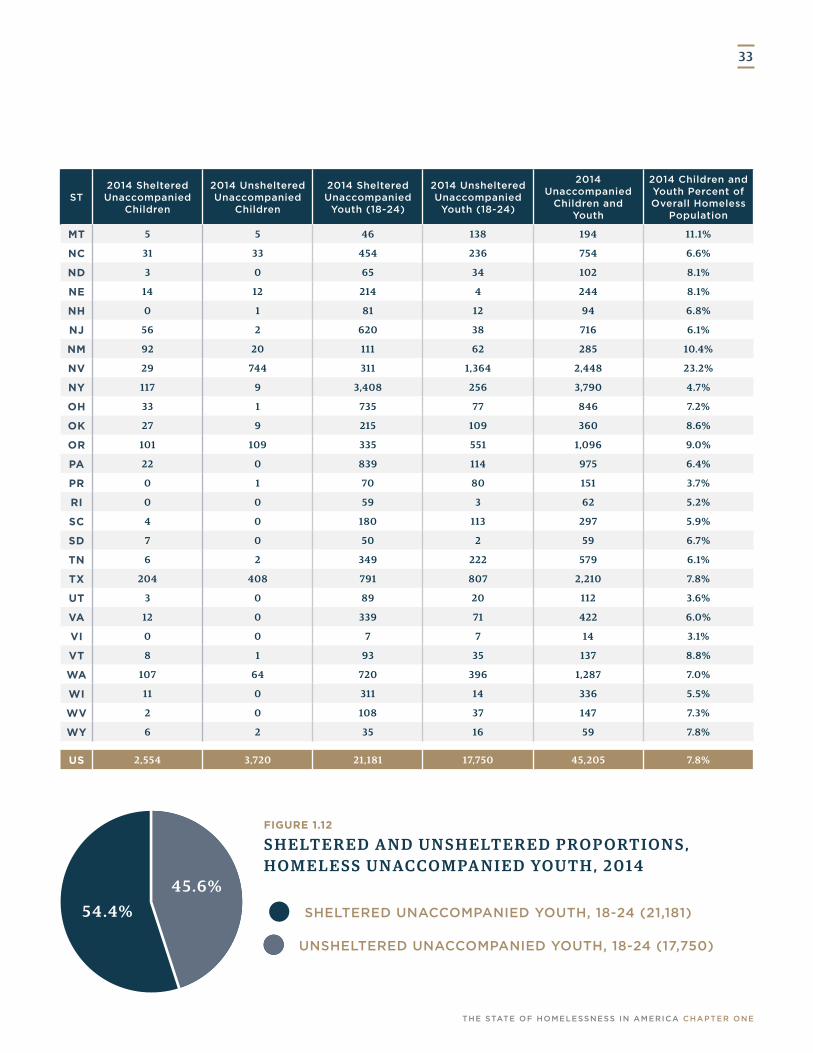
UNACCOMPANIED CHILDREN AND YOUTH BY STATE
The number of unaccompanied children and youth7 is not likely to be accurately represented in point-in-
time counts currently. There are limited beds available for this population nationwide, which impacts the
size of the sheltered population, and it is widely accepted that homeless young people do not congregate
in the same areas as older homeless adults, so targeted outreach during point-in-time counts is required. It
is not clear how many CoCs implement specific strategies to capture unsheltered children and youth during
their point-in-time counts.
Still, these numbers provide a snapshot of unaccompanied children and youth homelessness in each state.
Unaccompanied children and youth are a population that appears to be particularly at risk of being unshel-
tered (see figure 1.11). Only chronically homeless individuals are more likely to be unsheltered.
Table 1.8 displays the number of sheltered and unsheltered unaccompanied children and youth in each state
reported during the 2014 point-in-time count, as well as the state-by-state percentage of unaccompanied
youth and children in the overall homeless population in 2014. Map 1.7 shows the state-by-state percentage
of unaccompanied youth and children in the overall homeless population in 2014.
7 Unaccompanied children are those individuals experiencing homelessness who are unattached to a family household and under the age of 18. Unaccompanied youth are those individuals experiencing homelessness who are unattached to a family household and age of 18 to 24.
CHAPTER ONE THE STATE OF HOMELESSNESS IN AMERICA

31
MAP 1.7
P E R C E N TA G E O F H O M E L E S S P E O P L E W H O A R E U N A C C O M PA N I E D C H I L D R E N A N D YO U T H , 2 0 1 4
8.5%7.0%
9.0%
12.0%
23.2%
5.6%
11.1%
7.8%
3.6%
6.8% 10.4%
6.4%
8.1%
6.7%
8.1%
4.3%
8.6%
7.8%
10.7%
8.6%
5.9%
5.7%
7.6%
5.5%
6.4% 6.7%
6.9%
6.1%
7.7% 6.1% 6.2%
8.8%
5.9%
6.6%
6.0%
7.2%
9.7%
6.4%
4.7%
8.8%
6.8%
2.8%
5.2%4.4%
6.1%
4.9%
5.2%7.3%
10.9%
4.4%
0% to 5% 5% to 10% 10% to 15% More Than 15%
DC 2.8%
THE STATE OF HOMELESSNESS IN AMERICA CHAPTER ONE

32
TABLE 1.8
H O M E L E S S U N A C C O M PA N I E D C H I L D R E N A N D YO U T H , 2 0 1 4
ST2014 Sheltered Unaccompanied
Children
2014 Unsheltered Unaccompanied
Children
2014 Sheltered Unaccompanied
Youth (18-24)
2014 Unsheltered Unaccompanied
Youth (18-24)
2014 Unaccompanied
Children and Youth
2014 Children and Youth Percent of Overall Homeless
Population
AK 13 1 156 25 195 10.9%
AL 11 3 196 66 276 6.1%
AR 1 2 108 142 253 8.6%
AZ 47 3 457 210 717 6.8%
CA 238 1,544 2,721 9,206 13,709 12.0%
CO 41 4 426 174 645 6.4%
CT 5 0 136 53 194 4.4%
DC 5 0 192 18 215 2.8%
DE 7 0 35 2 44 4.9%
FL 687 543 1,264 1,162 3,656 8.8%
GA 10 84 419 516 1,029 6.2%
GU 4 0 2 25 31 2.3%
HI 7 8 75 212 302 4.4%
IA 6 0 160 11 177 5.7%
ID 6 0 75 36 117 5.6%
IL 37 1 684 121 843 6.4%
IN 21 1 326 55 403 6.7%
KS 2 0 96 22 120 4.3%
KY 33 0 242 75 350 6.9%
LA 112 3 241 135 491 10.7%
MA 2 4 502 97 605 2.8%
MD 22 8 277 104 411 5.2%
ME 28 0 186 18 232 8.5%
MI 161 73 731 215 1,180 9.7%
MN 38 10 478 110 636 7.6%
MO 78 5 279 65 427 5.9%
MS 32 0 82 57 171 7.7%
FIGURE 1.11
S H E LT E R E D A N D U N S H E LT E R E D P R O P O RT I O N S , H O M E L E S S U N A C C O M PA N I E D C H I L D R E N, 2 0 1 4
CHAPTER ONE THE STATE OF HOMELESSNESS IN AMERICA
UNSHELTERED UNACCOMPANIED CHILDREN (3,720)
SHELTERED UNACCOMPANIED CHILDREN (2,554)5 9. 3 %
4 0.7 %
33
ST2014 Sheltered Unaccompanied
Children
2014 Unsheltered Unaccompanied
Children
2014 Sheltered Unaccompanied
Youth (18-24)
2014 Unsheltered Unaccompanied
Youth (18-24)
2014 Unaccompanied
Children and Youth
2014 Children and Youth Percent of Overall Homeless
Population
MT 5 5 46 138 194 11.1%
NC 31 33 454 236 754 6.6%
ND 3 0 65 34 102 8.1%
NE 14 12 214 4 244 8.1%
NH 0 1 81 12 94 6.8%
NJ 56 2 620 38 716 6.1%
NM 92 20 111 62 285 10.4%
NV 29 744 311 1,364 2,448 23.2%
NY 117 9 3,408 256 3,790 4.7%
OH 33 1 735 77 846 7.2%
OK 27 9 215 109 360 8.6%
OR 101 109 335 551 1,096 9.0%
PA 22 0 839 114 975 6.4%
PR 0 1 70 80 151 3.7%
RI 0 0 59 3 62 5.2%
SC 4 0 180 113 297 5.9%
SD 7 0 50 2 59 6.7%
TN 6 2 349 222 579 6.1%
TX 204 408 791 807 2,210 7.8%
UT 3 0 89 20 112 3.6%
VA 12 0 339 71 422 6.0%
VI 0 0 7 7 14 3.1%
VT 8 1 93 35 137 8.8%
WA 107 64 720 396 1,287 7.0%
WI 11 0 311 14 336 5.5%
WV 2 0 108 37 147 7.3%
WY 6 2 35 16 59 7.8%
US 2,554 3,720 21,181 17,750 45,205 7.8%
FIGURE 1.12
S H E LT E R E D A N D U N S H E LT E R E D P R O P O RT I O N S , H O M E L E S S U N A C C O M PA N I E D YO U T H , 2 0 1 4
FIGURE 1.11
S H E LT E R E D A N D U N S H E LT E R E D P R O P O RT I O N S , H O M E L E S S U N A C C O M PA N I E D C H I L D R E N, 2 0 1 4
THE STATE OF HOMELESSNESS IN AMERICA CHAPTER ONE
UNSHELTERED UNACCOMPANIED YOUTH, 18-24 (17,750)
SHELTERED UNACCOMPANIED YOUTH, 18-24 (21,181)5 4 .4%4 5.6%

ST Overall Sheltered Unsheltered IndividualsPersons in Families
Family Households
Chronic Individuals
Veterans
AK -8.3% -5.9% -29.3% -11.2% -1.5% -1.5% 9.6% -57.6%
AL -2.7% 8.4% -27.7% -8.0% 11.1% -7.7% -19.5% 6.1%
AR -23.0% -9.7% -33.3% -27.4% -0.8% 10.1% -8.7% -21.9%
AZ -0.6% 6.7% -17.9% -4.9% 6.1% 0.3% -15.0% -29.8%
CA -3.9% -6.7% -2.1% -2.9% -7.6% -15.9% -3.6% -6.2%
CO 2.8% 6.5% -10.1% 19.5% -12.5% -8.8% -1.4% 9.9%
CT 0.0% 0.1% 0.0% -1.0% 2.5% 4.2% 17.7% -13.5%
DC 12.9% 15.7% -22.7% 7.0% 19.8% 25.2% -8.8% -18.6%
DE -4.8% -7.7% 270.0% 1.6% -14.6% -12.6% 35.4% 4.5%
FL -13.2% 0.9% -23.1% -8.4% -22.4% -21.6% -12.0% -17.3%
GA -2.7% -3.5% -1.8% -3.7% 0.7% 2.7% -2.5% -20.1%
GU 6.7% -1.6% 7.6% 12.2% 5.0% 7.8% -52.9% 12.5%
HI 9.2% 1.8% 19.9% 11.8% 6.3% 7.3% 7.6% 6.3%
IA 1.2% -0.8% 46.3% 1.3% 1.2% -1.6% -23.8% -11.8%
ID 18.1% 4.6% 68.7% 13.8% 24.8% 25.1% -19.2% 3.4%
IL -2.4% 1.6% -22.7% -7.6% 5.3% 8.7% -3.8% -2.6%
IN -2.1% 3.2% -42.4% 5.4% -13.9% -11.5% 6.1% -2.4%
KS 3.3% 6.4% -19.9% 3.6% 3.1% 2.1% -4.6% -5.1%
KY -3.0% -5.2% 10.2% 1.5% -10.6% -16.1% 55.8% -1.2%
LA -11.9% -4.1% -30.0% -11.9% -11.8% -9.4% -26.8% -24.0%
MA 11.6% 12.6% -10.7% 1.4% 17.1% 10.5% 0.8% 0.9%
MD -4.3% -0.3% -17.3% -4.6% -3.6% -4.9% 21.3% -2.8%
ME -9.6% -10.9% 50.0% -13.8% -5.2% -21.5% 37.1% -7.3%
MI 6.1% 7.9% -1.6% 4.1% 9.3% 7.7% 19.7% 2.0%
MN 2.0% 3.9% -13.1% -2.0% 5.3% 6.3% -3.3% -9.2%
MO -15.1% -3.0% -53.2% -7.4% -24.3% -28.4% 5.8% -22.7%
MS -7.4% 29.7% -37.8% -2.2% -21.2% -6.8% -32.6% 32.9%
CHAPTER ONE SUMMARY
Table 1.9 summarizes trends in the homeless population and subpopulations
between points-in-time in January 2013 and January 2014.
TABLE 1.9
C H A N G E S I N H O M E L E S S P O P U L AT I O N A N D S U B P O P U L AT I O N S , 2 0 1 3 -2 0 1 4
34
CHAPTER ONE THE STATE OF HOMELESSNESS IN AMERICA

ST Overall Sheltered Unsheltered IndividualsPersons in Families
Family Households
Chronic Individuals
Veterans
MT -7.1% -16.7% 6.4% -3.6% -13.3% -19.8% 21.9% -17.2%
NC -5.6% -1.5% -17.1% -0.4% -13.9% -14.3% -11.5% 3.7%
ND -39.2% 17.8% -66.7% -28.0% -55.7% -50.8% 0.9% -37.3%
NE -3.8% -1.9% -37.0% 0.1% -9.6% -12.6% 7.7% 31.7%
NH -4.9% -0.2% -34.2% -0.4% -10.5% -7.0% 33.2% 36.8%
NJ -2.8% 1.3% -33.2% 5.8% -11.6% -13.9% 14.8% 16.7%
NM -2.6% -3.1% 0.0% 1.0% -8.8% -5.3% 54.6% 30.9%
NV 25.0% 29.7% 21.4% 22.8% 44.9% 24.5% 13.0% 44.1%
NY 4.1% 4.4% -1.3% 4.5% 3.8% 4.8% 7.5% -45.4%
OH -4.1% -2.4% -17.6% 1.2% -12.6% -12.5% -20.1% 2.0%
OK -4.9% -0.1% -18.7% -6.8% -0.2% -6.1% -5.2% -6.6%
OR -12.0% -5.1% -18.0% -11.2% -13.5% -16.3% -9.7% -13.5%
PA 1.6% 4.2% -24.1% 4.8% -2.0% -1.0% -5.7% -3.5%
PR 0.1% 0.3% 0.0% -1.1% 6.4% 12.4% -3.8% 6.1%
RI -14.0% -7.7% -82.9% -9.6% -21.3% -25.4% -16.0% 11.3%
SC -22.7% -4.7% -42.3% -19.5% -31.2% -30.5% -39.7% 10.5%
SD -19.1% 9.9% -83.8% -12.0% -26.4% -21.4% -30.8% 5.6%
TN -1.2% 1.0% -5.5% -1.6% -0.2% -8.6% -1.3% 15.2%
TX -3.8% 4.0% -15.1% -7.6% 5.2% -1.5% 3.8% -29.9%
UT -6.0% -3.2% -25.1% -11.7% 2.6% -26.6% 11.2% -3.1%
VA -7.9% -4.1% -32.5% -6.6% -9.9% -10.3% -23.5% -13.8%
VI -7.1% -28.6% 0.0% -4.3% -39.5% -18.2% 1.1% -3.0%
VT 7.2% 9.9% -11.4% 17.4% -2.3% -8.8% 8.7% -6.3%
WA 3.8% -1.3% 16.8% 7.3% -1.3% -1.6% 19.9% 8.7%
WI -0.8% -0.4% -6.8% -2.5% 0.9% -0.9% -2.9% -5.8%
WV -10.1% -1.8% -31.5% -3.6% -24.6% -24.1% 8.7% 1.2%
WY -20.6% 12.4% -57.1% -31.6% 6.5% 6.0% -52.5% -15.3%
US -2.3% 1.6% -10.0% -2.0% -2.7% -4.9% -2.5% -10.5%
35
THE STATE OF HOMELESSNESS IN AMERICA CHAPTER ONE

For the most part, people who ultimately become homeless have strained financial
resources and are challenged by the cost of housing. Lower income households
often pay large portions of their income towards housing. For those that cannot
afford housing independently, living with family and friends, known as doubling
up, in order to reduce individual housing-related costs is an option. This is often
the last living situation of households that become homeless.8 The impacts of
economics and housing trends are often delayed, meaning that homelessness may
not be effected by these factors immediately, but measures of severe housing cost
burden and people living doubled up show that the economic recovery may be
leaving behind low-income populations.
This chapter examines the trends in populations that are plausibly at risk of home-
lessness, those that are in poverty, unemployed, experiencing severe housing cost
burden, and those that are living doubled up, illustrating both national and state
prevalence and 2012-2013 changes in these populations.
8 The 2013 Annual Homeless Assessment Report to Congress (AHAR) showed that 74.7 percent of people who had housing prior to accessing shelter were living in the home of a family or friend.
CH
APT
ER T
WO
AT RISK OF
P O P U L AT I O N S
H O M E L E SS N E SS

37
National changes in economic and housing related factors between 2012 and 2013 present a mixed picture,
as seen in Table 2.1. While the unemployment rate fell from 8.1 percent to 7.4 percent, the poverty rate and
number of people in poverty remained relatively unchanged. There was an almost 3 percent decline in the
number of poor renter households with severe housing cost burden, but the number of poor people doubled
up with family and friends increased by nearly 4 percent.
Figure 2.1 shows how the economic and housing related factors that may increase vulnerability to home-
lessness changed from 2007 to 2013. While the number of people in poverty has been steadily increasing,
the number of unemployed people has continuously decreased since peaking in 2009. Both the number of
households experiencing severe housing cost burden and the number of people living doubled up increased
since 2007. Both have also leveled off since the recovery from the recession began, but neither has returned
to pre-recession levels.
TABLE 2.1 AT- R I S K P O P U L AT I O N T R E N D S , 2 0 1 2 -2 0 1 3
ECONOMIC FACTORS 2013 2012 % CHANGE
Persons in Poverty 48,810,868 48,760,123 0.1%
Poverty Rate* 15.8% 15.9% -0.1
Unemployment Persons 11,459,887 12,512,946 -8.4%
Unemployment Rate* 7.4% 8.1% -0.7
HOUSING-RELATED FACTORS 2013 2012 % CHANGE
Poor Renter Households with Severe Housing Cost Burden
6,416,946 6,601,994 -2.8%
People in Poor Households Living Doubled up
7,691,313 7,416,170 3.7%
* Percent change column represents change in percentage point.
THE STATE OF HOMELESSNESS IN AMERICA CHAPTER TWO

38
FIGURE 2.1 N AT I O N A L E C O N O M I C A N D H O U S I N G - R E L AT E D T R E N D S , 2 0 0 7 -2 0 1 3
2007
2008
2009
2010
2011
2012
2013
PERSONS IN POVERTY
3 8 ,0 5 2 , 2 47
3 9, 1 0 8,4 2 2
4 2 , 8 6 8 , 1 6 3
4 6, 2 1 5,9 5 6
4 8,4 5 2 ,0 3 5
4 8,7 6 0,1 2 3
4 8 , 8 1 0, 8 6 8
2007
2008
2009
2010
2011
2012
2013
UNEMPLOYED PERSONS
9,4 8 8 , 3 9 0
9,9 5 8 , 8 2 4
1 5,4 4 1 ,9 8 3
1 4 , 8 6 0,4 6 1
1 3 , 8 3 3 , 3 4 0
1 2 , 5 1 2 ,9 4 6
1 1 ,4 5 9,8 8 7
2007
2008
2009
2010
2011
2012
2013
POOR RENTER HOUSEHOLDS WITH SEVERE HOUSING COST BURDEN
5, 3 9 8 , 3 7 9
5,1 2 8 ,9 6 8
5,8 8 6 , 2 9 3
6, 2 1 5,0 8 0
6, 5 5 7,0 6 3
6,6 0 1 ,9 9 4
6,4 1 6 ,9 4 6
2007
2008
2009
2010
2011
2012
2013
PEOPLE IN POOR HOUSEHOLDS DOUBLED UP
5,4 0 2 ,0 7 5
4 ,6 0 7,9 7 7
6,0 3 7, 2 5 6
6 , 8 0 0, 5 8 7
7,4 4 1 , 2 6 5
7,4 1 6 , 1 70
7,6 9 1 , 3 1 3
CHAPTER TWO THE STATE OF HOMELESSNESS IN AMERICA

39
THE STATE OF HOMELESSNESS IN AMERICA CHAPTER TWO

40
MAP 2.1
C H A N G E I N P E O P L E I N P OV E RT Y, 2 0 1 2 -2 0 1 3
-4.8%
5.7%
-2.5%
0.1%
-3.0%
-0.8%
7.5%
-12.6%
0.3%
1.0%5.2%
-3.9%
8.8%
7.1%
2.3%
0.4%
-1.7%
-0.7%
-0.4%
-0.5%
-1.8%
0.4%
-1.0%
2.5%
-0.3% 2.5%
-2.7%
-0.2%
-0.3% -1.0% -0.3%
0.5%
2.7%
0.1%
0.7%
-1.5%
-2.2%
-0.2%
1.0%
4.2%
-13.2%
1.0%
4.0%0.4%
6.8%
3.7%
-0.9%3.8%
-7.4%
-5.6%
Less Than -10% -10% to 0% 0% to 10% More Than 10%
DC 6.3%
STATE TRENDS IN POPULATIONS AT RISK OF HOMELESSNESS
POVERTY
From 2012 to 2013, the number of people in poverty essentially stayed the same, increasing by 0.1 percent.
Map 2.1 shows how the number of people living in poverty changed between 2012 and 2013 for each state.
Table 2.2 displays both the change in the number of people in poverty between 2012 and 2013 and the 2013
poverty rate for each state.
CHAPTER TWO THE STATE OF HOMELESSNESS IN AMERICA

41
TABLE 2.2
C H A N G E I N P E O P L E I N P OV E RT Y, 2 0 1 2 -2 0 1 3 A N D P OV E RT Y R AT E , 2 0 1 3
ST2013 Persons
in Poverty2012 Persons
in Poverty%Change
2013 Poverty
Rate
AK 67,016 72,400 -7.4% 9.3
AL 883,371 892,564 -1.0% 18.7
AR 565,469 568,065 -0.5% 19.7
AZ 1,206,460 1,194,506 1.0% 18.6
CA 6,328,824 6,325,319 0.1% 16.8
CO 667,446 694,842 -3.9% 13.0
CT 373,900 372,390 0.4% 10.7
DC 115,551 108,732 6.3% 18.9
DE 111,327 107,307 3.7% 12.4
FL 3,253,333 3,238,581 0.5% 17.0
GA 1,843,768 1,848,533 -0.3% 19.0
HI 148,368 157,243 -5.6% 10.8
IA 379,127 377,484 0.4% 12.7
ID 246,550 248,494 -0.8% 15.6
IL 1,845,393 1,850,562 -0.3% 14.7
IN 1,015,127 990,325 2.5% 15.9
KS 393,358 391,734 0.4% 14.0
KY 800,635 823,197 -2.7% 18.8
LA 888,019 891,981 -0.4% 19.8
MA 770,513 762,645 1.0% 11.9
MD 585,571 590,803 -0.9% 10.1
ME 180,639 189,786 -4.8% 14.0
MI 1,648,436 1,685,178 -2.2% 17.0
MN 592,422 598,371 -1.0% 11.2
MO 931,066 947,792 -1.8% 15.9
MS 695,915 698,252 -0.3% 24.0
ST2013 Persons
in Poverty2012 Persons
in Poverty%Change
2013 Poverty
Rate
MT 163,637 152,199 7.5% 16.5
NC 1,715,397 1,713,132 0.1% 17.9
ND 82,398 75,703 8.8% 11.8
NE 239,433 233,973 2.3% 13.2
NH 111,495 128,466 -13.2% 8.7
NJ 998,549 934,943 6.8% 11.4
NM 448,461 426,245 5.2% 21.9
NV 433,576 446,840 -3.0% 15.8
NY 3,055,645 3,025,016 1.0% 16.0
OH 1,796,942 1,824,628 -1.5% 16.0
OK 626,906 637,429 -1.7% 16.8
OR 642,138 658,359 -2.5% 16.7
PA 1,690,405 1,693,285 -0.2% 13.7
RI 144,446 138,907 4.0% 14.3
SC 860,380 837,770 2.7% 18.6
SD 115,454 107,846 7.1% 14.2
TN 1,126,772 1,129,330 -0.2% 17.8
TX 4,530,039 4,562,352 -0.7% 17.5
UT 361,181 360,017 0.3% 12.7
VA 938,733 931,805 0.7% 11.7
VT 74,058 71,084 4.2% 12.3
WA 967,282 915,278 5.7% 14.1
WI 755,551 737,356 2.5% 13.5
WV 332,347 320,055 3.8% 18.5
WY 62,039 71,019 -12.6% 10.9
US 48,810,868 48,760,123 0.1% 15.8
THE STATE OF HOMELESSNESS IN AMERICA CHAPTER TWO

42
FIGURE 2.2 2 0 1 3 S TAT E - BY- S TAT E R AT E O F P OV E RT Y C O M PA R E D T O N AT I O N A L R AT E ( 1 5 . 8 )
Figure 2.2 shows how state poverty rates compare to the national poverty rate of 15.8 percent.
CHAPTER TWO THE STATE OF HOMELESSNESS IN AMERICA
AK(9.3)
AL(18.7)
AR(19.7)
AZ(18.6)
CA(16.8)
CO(13.0)
CT(10.7)
DC(18.9)
DE(12.4)
FL(17.0)
GA(19.0)
HI(10.8)
IA(12.7)
ID(15.6)
IL(14.7)
IN(15.9)
KS(14.0)
KY(18.8)
LA(19.8)
MA(11.9)
MD(10.1)
ME(14.0)
MI(17.0)
MN(11.2)
MO(15.9)
MS(24.0)
MT(16.5)
NC(17.9)
ND(11.8)
NE(13.2)
NH(8.7)
NJ(11.4)
NM(21.9)
NV(15.8)
NY(16.0)
OH(16.0)
OK(16.8) OR
(16.7)
PA(13.7)
RI(14.3)
SC(18.6)
SD(14.2)
TN(17.8) TX
(17.5)
UT(12.7)
VA(11.7)
VT(12.3)
WA(14.1)
WI(13.5)
WV(18.5)
WY(10.9)
15.8 15.8
National Rate (15.8)

43
THE STATE OF HOMELESSNESS IN AMERICA CHAPTER TWO
AK(9.3)
AL(18.7)
AR(19.7)
AZ(18.6)
CA(16.8)
CO(13.0)
CT(10.7)
DC(18.9)
DE(12.4)
FL(17.0)
GA(19.0)
HI(10.8)
IA(12.7)
ID(15.6)
IL(14.7)
IN(15.9)
KS(14.0)
KY(18.8)
LA(19.8)
MA(11.9)
MD(10.1)
ME(14.0)
MI(17.0)
MN(11.2)
MO(15.9)
MS(24.0)
MT(16.5)
NC(17.9)
ND(11.8)
NE(13.2)
NH(8.7)
NJ(11.4)
NM(21.9)
NV(15.8)
NY(16.0)
OH(16.0)
OK(16.8) OR
(16.7)
PA(13.7)
RI(14.3)
SC(18.6)
SD(14.2)
TN(17.8) TX
(17.5)
UT(12.7)
VA(11.7)
VT(12.3)
WA(14.1)
WI(13.5)
WV(18.5)
WY(10.9)
15.8 15.8

44
MAP 2.2
C H A N G E I N N U M B E R O F U N E M P L OY E D P E O P L E , 2 0 1 2 -2 0 1 3
-8.2%
-14.6%
-13.1%
-14.0%
-11.4%
-11.8%
-5.1%
-13.5%
-18.8%
-4.5%-1.4%
-15.0%
-5.1%
-12.9%
-0.5%
-5.9%
5.1%
-5.0%
-3.9%
1.3%
-4.9%
-9.4%
-10.3%
-2.2%
2.5% -9.5%
-0.1%
1.0%
-9.3% -12.0.% -10.4%
-15.4%
-16.1%
-15.9%
-4.8%
2.9%
-3.0%
-6.8%
-9.5%
-14.0%
-4.9%
5.5%
-9.6%-8.0%
-14.8%
-5.8%
-3.4%-12.8%
-6.9%
-18.4%
Less Than -10% -10% to -5% -5% to 0% More Than 0%
DC -4.8%
UNEMPLOYMENT
Unemployment often precedes homelessness and is frequently cited in research as a risk factor for experienc-
ing homelessness. This factor is measured by the number of people in the workforce who are actively seeking
a job but do not have one. Map 2.2 and Table 2.3 show the change between 2012 and 2013 in the number of
unemployed people in each state. Overall unemployment decreased by 8.4 percent. Table 2.3 also shows
the unemployment rate in each state.
CHAPTER TWO THE STATE OF HOMELESSNESS IN AMERICA

45
TABLE 2.3
C H A N G E I N N U M B E R O F U N E M P L OY E D P E O P L E , 2 0 1 2 -2 0 1 3A N D U N E M P L OY M E N T R AT E , 2 0 1 3
ST
2013 Number of
Unemployed Persons
2012 Number of
Unemployed Persons
% Change
2013 Unemployment
Rate
AK 23,817 25,586 -6.9% 6.5
AL 138,200 157,119 -12.0% 6.5
AR 100,123 98,834 1.3% 7.5
AZ 240,231 251,659 -4.5% 8.0
CA 1,663,497 1,934,533 -14.0% 8.9
CO 186,720 219,729 -15.0% 6.8
CT 144,536 157,058 -8.0% 7.8
DC 30,774 32,340 -4.8% 8.3
DE 29,760 31,598 -5.8% 6.7
FL 682,703 806,808 -15.4% 7.2
GA 389,294 434,495 -10.4% 8.2
HI 30,951 37,918 -18.4% 4.8
IA 77,674 85,724 -9.4% 4.6
ID 48,177 54,621 -11.8% 6.2
IL 599,891 585,039 2.5% 9.2
IN 239,038 263,993 -9.5% 7.5
KS 80,444 85,454 -5.9% 5.4
KY 170,792 170,926 -0.1% 8.3
LA 129,177 134,361 -3.9% 6.2
MA 246,465 233,684 5.5% 7.1
MD 205,745 213,058 -3.4% 6.6
ME 47,352 51,596 -8.2% 6.7
MI 413,295 425,953 -3.0% 8.8
MN 150,418 167,696 -10.3% 5.1
MO 197,309 207,391 -4.9% 6.5
MS 110,763 122,060 -9.3% 8.6
ST
2013 Number of
Unemployed Persons
2012 Number of
Unemployed Persons
% Change
2013 Unemployment
Rate
MT 28,947 30,515 -5.1% 5.6
NC 376,620 447,930 -15.9% 8.0
ND 11,613 12,236 -5.1% 2.9
NE 40,033 40,245 -0.5% 3.9
NH 39,101 41,133 -4.9% 5.3
NJ 371,791 436,174 -14.8% 8.2
NM 63,679 64,591 -1.4% 6.9
NV 135,136 152,468 -11.4% 9.8
NY 737,271 814,645 -9.5% 7.7
OH 424,844 413,023 2.9% 7.4
OK 98,623 93,842 5.1% 5.4
OR 148,714 171,178 -13.1% 7.7
PA 478,264 513,171 -6.8% 7.4
RI 52,721 58,293 -9.6% 9.5
SC 165,451 197,083 -16.1% 7.6
SD 17,102 19,628 -12.9% 3.8
TN 251,953 249,400 1.0% 8.2
TX 812,541 854,865 -5.0% 6.3
UT 62,802 77,348 -18.8% 4.4
VA 235,130 247,036 -4.8% 5.5
VT 15,292 17,777 -14.0% 4.4
WA 242,714 284,170 -14.6% 7.0
WI 206,687 211,444 -2.2% 6.7
WV 51,493 59,075 -12.8% 6.5
WY 14,219 16,443 -13.5% 4.6
US 11,459,887 12,512,946 -8.4% 7.4
THE STATE OF HOMELESSNESS IN AMERICA CHAPTER TWO

46
AK(6.5)
AL(6.5)
AR(7.5)
AZ(8.0)
CA(8.9)
CO(6.8)
CT(7.8)
DC(8.3)
DE(6.7)
FL(7.2)
GA(8.2)
HI(4.8) IA
(4.6)
ID(6.2)
IL(9.2)
IN(7.5)
KS(5.4)
KY(8.3)
LA(6.2)
MA(7.1)
MD(6.6)
ME(6.7)
MI(8.8)
MN(5.1)
MO(6.5)
MS(8.6)
MT(5.6)
NC(8.0)
ND(2.9)
NE(3.9)
NH(5.3)
NJ(8.2)
NM(6.9)
NV(9.8)
NY(7.7)
OH(7.4)
OK(5.4)
OR(7.7)
PA(7.4)
RI(9.5)
SC(7.6)
SD(3.8)
TN(8.2)
TX(6.3)
UT(4.4)
VA(5.5)
VT(4.4)
WA(7.0) WI
(6.7) WV(6.5)
WY(4.6)
7.4 7.4
FIGURE 2.3 2 0 1 3 S TAT E - BY- S TAT E U N E M P L OY M E N T R AT E C O M PA R E D T O N AT I O N A L R AT E ( 7.4 )
Figure 2.3 illustrates how the unemployment rate in each state compared to the national unemployment rate
of 7.4 percent in 2013.
CHAPTER TWO THE STATE OF HOMELESSNESS IN AMERICA
National Rate (7.4)

47
AK(6.5)
AL(6.5)
AR(7.5)
AZ(8.0)
CA(8.9)
CO(6.8)
CT(7.8)
DC(8.3)
DE(6.7)
FL(7.2)
GA(8.2)
HI(4.8) IA
(4.6)
ID(6.2)
IL(9.2)
IN(7.5)
KS(5.4)
KY(8.3)
LA(6.2)
MA(7.1)
MD(6.6)
ME(6.7)
MI(8.8)
MN(5.1)
MO(6.5)
MS(8.6)
MT(5.6)
NC(8.0)
ND(2.9)
NE(3.9)
NH(5.3)
NJ(8.2)
NM(6.9)
NV(9.8)
NY(7.7)
OH(7.4)
OK(5.4)
OR(7.7)
PA(7.4)
RI(9.5)
SC(7.6)
SD(3.8)
TN(8.2)
TX(6.3)
UT(4.4)
VA(5.5)
VT(4.4)
WA(7.0) WI
(6.7) WV(6.5)
WY(4.6)
7.4 7.4
THE STATE OF HOMELESSNESS IN AMERICA CHAPTER TWO

48
MAP 2.3
C H A N G E I N P O O R R E N T E R H O U S E H O L D S ( P R H ) W I T H S E V E R E H O U S I N G C O S T B U R D E N ( S H C B ) , 2 0 1 2 -2 0 1 3
-17.3%
0.3%
-4.0%
-4.3%
-10.6%
-0.8%
3.0%
-21.8%
5.5%
-3.8%-7.7%
-9.1%
31.2%
4.9%
20.2%
-6.9%
-1.5%
-0.8%
5.9%
-4.3%
-3.4%
-1.6%
-2.1%
-7.3%
-48.5% 87.6%
-9.2%
-3.3%
9.7% 2.4% -3.4%
-3.1%
-8.4%
-4.3%
-3.0%
-5.5%
-2.2%
-1.0%
-0.6%
2.1%
6.3%
-8.2%
-4.5%-11.4%
0.8%
-9.8%
0.7%-4.7%
-50.8%
-14.8%
Less Than -10% -10% to 0% 0% to 10% More Than 10%
DC 8.4%
POOR RENTER HOUSEHOLDS WITH SEVERE HOUSING COST BURDEN
When more than 50 percent of a household’s income goes to paying rent, that household is experiencing
what is known as severe housing cost burden. Households that fall into this category spend a dispropor-
tionate amount of income on housing, and are more likely to have an unexpected event—such as loss of
employment or medical costs—result in an experience of homelessness.
Map 2.3 and Table 2.4 show the state-by-state change in the number of poor renter households experiencing
severe housing cost burden. From 2012 to 2013, this number decreased nationally by 2.8 percent. However,
in some states—such as Indiana, Nebraska, and North Dakota—the number of households living in this situ-
ation increased dramatically from 2012 to 2013.
CHAPTER TWO THE STATE OF HOMELESSNESS IN AMERICA

49
TABLE 2.4
C H A N G E I N P O O R R E N T E R H O U S E H O L D S ( P R H ) W I T H S E V E R E H O U S I N G C O S T B U R D E N ( S H C B ) , 2 0 1 2 -2 0 1 3
ST2013 PRH with SHCB
2012 PRH with SHCB
% Change
AK 4,855 9,876 -50.8%
AL 104,002 101,611 2.4%
AR 62,348 65,119 -4.3%
AZ 132,836 138,090 -3.8%
CA 861,575 900,021 -4.3%
CO 94,933 104,387 -9.1%
CT 58,880 66,432 -11.4%
DC 21,287 19,640 8.4%
DE 12,820 14,216 -9.8%
FL 401,344 414,041 -3.1%
GA 220,192 227,849 -3.4%
HI 16,853 19,790 -14.8%
IA 55,951 56,879 -1.6%
ID 27,455 27,690 -0.8%
IL 135,098 262,579 -48.5%
IN 265,420 141,449 87.6%
KS 53,330 57,297 -6.9%
KY 89,179 98,267 -9.2%
LA 113,120 106,848 5.9%
MA 118,239 128,757 -8.2%
MD 84,026 83,468 0.7%
ME 23,527 28,454 -17.3%
MI 211,904 216,714 -2.2%
MN 88,558 90,421 -2.1%
MO 128,926 133,506 -3.4%
MS 69,742 63,577 9.7%
ST2013 PRH with SHCB
2012 PRH with SHCB
% Change
MT 20,638 20,039 3.0%
NC 205,835 215,004 -4.3%
ND 14,010 10,682 31.2%
NE 37,795 31,443 20.2%
NH 17,405 16,368 6.3%
NJ 158,661 157,401 0.8%
NM 42,730 46,294 -7.7%
NV 58,551 65,475 -10.6%
NY 518,697 521,728 -0.6%
OH 263,390 278,792 -5.5%
OK 70,561 71,640 -1.5%
OR 96,494 100,485 -4.0%
PA 241,261 243,689 -1.0%
RI 22,126 23,169 -4.5%
SC 91,603 100,046 -8.4%
SD 11,662 11,115 4.9%
TN 136,307 141,004 -3.3%
TX 497,207 501,290 -0.8%
UT 40,105 38,007 5.5%
VA 125,055 128,874 -3.0%
VT 8,868 8,684 2.1%
WA 127,564 127,182 0.3%
WI 110,977 119,739 -7.3%
WV 35,610 37,361 -4.7%
WY 7,434 9,505 -21.8%
US 6,416,946 6,601,994 -2.8%
THE STATE OF HOMELESSNESS IN AMERICA CHAPTER TWO

50
MAP 2.4
C H A N G E I N P E O P L E I N P O O R H O U S E H O L D S D O U B L E D U P, 2 0 1 2 -2 0 1 3
14.4%
0.5%
19.5%
3.8%
6.0%
11.7%
18.1%
-30.0%
-8.4%
-1.2%11.6%
-7.9%
23.5%
24.2%
16.4%
4.1%
-6.9%
-3.8%
6.9%
-2.7%
-5.1%
6.6%
7.9%
-6.5%
1.3% 7.6%
5.7%
3.5%
0.4% 9.3% -2.6%
4.3%
12.8%
7.2%
2.9%
1.0%
5.7%
8.5%
9.4%
15.5%
27.7%
29.5%
16.6%24.8%
9.7%
40.3%
-2.8%0.9%
-25.3%
11.3%
Less Than -10% -10% to 0% 0% to 10% More Than 10%
DC 7.7%
PEOPLE IN POOR HOUSEHOLDS LIVING DOUBLED UP
People who are living with family and friends are described as living doubled up. Some people may
choose to live doubled up for personal or economic reasons. Others may be forced into the situation
by financial circumstances. Living doubled up is the most common prior living situation of people who
become homeless.9
Map 2.4 and Table 2.5 show the state-by-state change from 2012 to 2013 in the number of persons in poor
households living doubled up. Nationally, this number increased by 3.7 percent.
CHAPTER TWO THE STATE OF HOMELESSNESS IN AMERICA
9 People living in precarious doubled up situations (unable to remain for more than 14 days or moving repeatedly) are not included in point-in-time counts, but are eligible for homeless assistance.

51
TABLE 2.5
C H A N G E I N P E O P L E I N P O O R H O U S E H O L D S D O U B L E D U P, 2 0 1 2 -2 0 1 3
ST2013 People In Poor HH Doubled Up
2012 People In Poor HH Doubled Up
% Change
AK 14,656 19,625 -25.3%
AL 133,912 122,548 9.3%
AR 77,155 79,320 -2.7%
AZ 206,783 209,326 -1.2%
CA 1,181,533 1,138,222 3.8%
CO 85,590 92,960 -7.9%
CT 54,698 43,838 24.8%
DC 17,346 16,109 7.7%
DE 22,901 16,325 40.3%
FL 623,306 597,603 4.3%
GA 305,680 313,683 -2.6%
HI 27,946 25,098 11.3%
IA 38,283 35,897 6.6%
ID 29,849 26,727 11.7%
IL 292,578 288,695 1.3%
IN 143,349 133,168 7.6%
KS 44,769 43,016 4.1%
KY 114,836 108,635 5.7%
LA 146,393 136,938 6.9%
MA 109,556 84,585 29.5%
MD 99,955 102,855 -2.8%
ME 24,611 21,517 14.4%
MI 249,982 236,442 5.7%
MN 74,513 69,084 7.9%
MO 124,360 131,005 -5.1%
MS 114,285 113,845 0.4%
ST2013 People In Poor HH Doubled Up
2012 People In Poor HH Doubled Up
% Change
MT 19,635 16,631 18.1%
NC 265,088 247,224 7.2%
ND 11,179 9,050 23.5%
NE 27,158 23,334 16.4%
NH 20,349 15,936 27.7%
NJ 169,075 154,170 9.7%
NM 72,998 65,422 11.6%
NV 75,294 71,057 6.0%
NY 503,403 460,208 9.4%
OH 240,832 238,544 1.0%
OK 79,389 85,280 -6.9%
OR 87,833 73,525 19.5%
PA 244,446 225,229 8.5%
RI 22,851 19,592 16.6%
SC 136,836 121,299 12.8%
SD 17,192 13,838 24.2%
TN 167,914 162,278 3.5%
TX 698,985 726,819 -3.8%
UT 44,507 48,568 -8.4%
VA 142,371 138,318 2.9%
VT 9,536 8,256 15.5%
WA 125,749 125,156 0.5%
WI 91,814 98,246 -6.5%
WV 49,738 49,279 0.9%
WY 8,296 11,845 -30.0%
US 7,691,313 7,416,170 3.7%
THE STATE OF HOMELESSNESS IN AMERICA CHAPTER TWO

STPersons in
PovertyPoverty Rate*
Unemployed Persons
Unemployment Rate*
Poor Renter Households with Severe Housing
Cost Burden
People in Poor Households Living Doubles
Up
AK -7.4% 0.8 -6.9% 0.5 -50.8% -25.3%
AL -1.0% 0.3 -12.0% 0.8 2.4% 9.3%
AR -0.5% 0.1 1.3% -0.2 -4.3% -2.7%
AZ 1.0% 0.1 -4.5% 0.3 -3.8% -1.2%
CA 0.1% 0.2 -14.0% 1.6 -4.3% 3.8%
CO -3.9% 0.7 -15.0% 1.2 -9.1% -7.9%
CT 0.4% 0.0 -8.0% 0.6 -11.4% 24.8%
DC 6.3% -0.7 -4.8% 0.6 8.4% 7.7%
DE 3.7% -0.4 -5.8% 0.4 -9.8% 40.3%
FL 0.5% 0.1 -15.4% 1.4 -3.1% 4.3%
GA -0.3% 0.2 -10.4% 0.8 -3.4% -2.6%
HI -5.6% 0.8 -18.4% 1.0 -14.8% 11.3%
IA 0.4% 0.0 -9.4% 0.6 -1.6% 6.6%
ID -0.8% 0.3 -11.8% 0.9 -0.8% 11.7%
IL -0.3% 0.0 2.5% -0.3 -48.5% 1.3%
IN 2.5% -0.3 -9.5% 0.9 87.6% 7.6%
KS 0.4% 0.0 -5.9% 0.3 -6.9% 4.1%
KY -2.7% 0.6 -0.1% -0.1 -9.2% 5.7%
LA -0.4% 0.1 -3.9% 0.2 5.9% 6.9%
MA 1.0% 0.0 5.5% -0.4 -8.2% 29.5%
MD -0.9% 0.2 -3.4% 0.2 0.7% -2.8%
ME -4.8% 0.7 -8.2% 0.6 -17.3% 14.4%
MI -2.2% 0.4 -3.0% 0.3 -2.2% 5.7%
MN -1.0% 0.2 -10.3% 0.5 -2.1% 7.9%
MO -1.8% 0.3 -4.9% 0.4 -3.4% -5.1%
MS -0.3% 0.2 -9.3% 0.6 9.7% 0.4%
CHAPTER TWO SUMMARY
Table 2.8 summarizes trends in the populations vulnerable to homelessness
between 2012 and 2013.
TABLE 2.8
C H A N G E I N P O P U L AT I O N S AT R I S K O F H O M E L E S S N E S S BY S TAT E , 2 0 1 2 -2 0 1 3
52
CHAPTER TWO THE STATE OF HOMELESSNESS IN AMERICA

STPersons in
PovertyPoverty Rate*
Unemployed Persons
Unemployment Rate*
Poor Renter Households with Severe Housing
Cost Burden
People in Poor Households Living Doubles
Up
MT 7.5% -1.0 -5.1% 0.4 3.0% 18.1%
NC 0.1% 0.1 -15.9% 1.5 -4.3% 7.2%
ND 8.8% -0.6 -5.1% 0.2 31.2% 23.5%
NE 2.3% -0.2 -0.5% 0.0 20.2% 16.4%
NH -13.2% 1.3 -4.9% 0.2 6.3% 27.7%
NJ 6.8% -0.6 -14.8% 1.3 0.8% 9.7%
NM 5.2% -1.1 -1.4% 0.0 -7.7% 11.6%
NV -3.0% 0.6 -11.4% 1.3 -10.6% 6.0%
NY 1.0% -0.1 -9.5% 0.8 -0.6% 9.4%
OH -1.5% 0.3 2.9% -0.2 -5.5% 1.0%
OK -1.7% 0.4 5.1% -0.2 -1.5% -6.9%
OR -2.5% 0.5 -13.1% 1.0 -4.0% 19.5%
PA -0.2% 0.0 -6.8% 0.5 -1.0% 8.5%
RI 4.0% -0.6 -9.6% 0.9 -4.5% 16.6%
SC 2.7% -0.3 -16.1% 1.5 -8.4% 12.8%
SD 7.1% -0.8 -12.9% 0.6 4.9% 24.2%
TN -0.2% 0.1 1.0% -0.2 -3.3% 3.5%
TX -0.7% 0.4 -5.0% 0.5 -0.8% -3.8%
UT 0.3% 0.1 -18.8% 1.3 5.5% -8.4%
VA 0.7% 0.0 -4.8% 0.4 -3.0% 2.9%
VT 4.2% -0.5 -14.0% 0.6 2.1% 15.5%
WA 5.7% -0.6 -14.6% 1.2 0.3% 0.5%
WI 2.5% -0.3 -2.2% 0.2 -7.3% -6.5%
WV 3.8% -0.7 -12.8% 0.8 -4.7% 0.9%
WY -12.6% 1.7 -13.5% 0.8 -21.8% -30.0%
US 0.1% 0.1 -8.4% 0.7 -2.8% 3.7%
* Column represents change in percentage point.
53
THE STATE OF HOMELESSNESS IN AMERICA CHAPTER TWO

Each year since 2007, communities have conducted a housing inventory count
(HIC), enumerating emergency shelter, transitional housing, permanent support-
ive housing, and, beginning in 2013, rapid re-housing beds. Longitudinal trends
in bed inventory show a shift in homeless assistance toward permanent housing
solutions. Permanent supportive housing beds continued multi-year increases in
2014 and rapid re-housing capacity, short-term assistance to help people access
permanent housing, nearly doubled. Simultaneously, transitional housing inven-
tory continued to decrease. Communities also report on the number people in
each type of housing.
In this chapter, housing inventory and sheltered point-in-time data were used
to calculate utilization rates and estimate the current capacity of the homeless
assistance system.
CH
APT
ER T
HR
EE
THE STATE OF THE HOMELESS
SYST E MA SS I STA N C E

55
TABLE 3.1 H O M E L E S S A S S I S TA N C E BY B E D T Y P E A N D TA R G E T H O U S E H O L D T Y P E , 2 0 1 4
HOUSEHOLDS WITH CHILDREN
HOUSEHOLDS WITHOUT CHILDREN
ONLY CHILD HOUSEHOLDS
TOTAL
EMERGENCY SHELTER 123,252 123,173 3,072 249,497
TRANSITIONAL HOUSING 94,149 79,765 1,469 175,383
PERMANENT SUPPORTIVE HOUSING
113,487 186,623 172 300,282
RAPID RE-HOUSING 29,506 8,253 24 37,783
OVERALL 360,394 397,814 4,737 762,945
NATIONAL HOMELESS ASSISTANCE SYSTEM CAPACITY
In January 2014, communities across the nation reported a total of 762,945 beds designated for use by people
experiencing homelessness. Regardless of the funding source for the bed, communities are required to report
on all beds for use by people experiencing homelessness. Funding sources include HUD, VA, and the Runaway
and Homeless Youth program administered by the U.S. Department of Health and Human Services (HHS).
Table 3.1 shows all reported beds by type and target population. Permanent supportive housing beds
accounted for approximately 39 percent of the total. Approximately 33 percent of all beds were desig-
nated for use in emergency shelter, and 23 percent were transitional housing beds.10 Rapid re-housing beds
comprised the remaining 5 percent of the total.
NATIONAL TRENDS IN HOMELESS ASSISTANCE SYSTEM CAPACITY AND USAGE
HOMELESS ASSISTANCE SYSTEM BED INVENTORY AND CAPACITY FROM 2007 TO 2014
Figure 3.1 shows the capacity of the homeless assistance system over time. From 2007 to 2014, the number
of emergency shelter (ES) and permanent supportive housing (PSH) beds increased by 18 percent and 59
percent, respectively. In this same time period, the number of transitional housing (TH) beds decreased by
17 percent. From 2013 to 2014, the number of rapid re-housing (RRH) beds increased by 90 percent.
People living in permanent supportive housing and rapid re-housing are not considered homeless during
the point-in-time counts. Only persons in emergency shelter and transitional housing are counted as home-
less. Figure 3.2 compares the number of beds available in emergency shelter and transitional housing to the
size of the total homeless population. Nationally, the system capacity could assist 73 percent of the total
homeless population on a single night in January 2014; however, geographic and population mismatches
may prevent every bed from being filled.
THE STATE OF HOMELESSNESS IN AMERICA CHAPTER THREE
10 Throughout this chapter, Safe Haven beds are included in transitional housing totals.

56
FIGURE 3.1 H O U S I N G I N V E N T O RY, 2 0 0 7 -2 0 1 4
3 5 0,0 0 0
3 0 0,0 0 0
2 5 0,0 0 0
2 0 0,0 0 0
1 5 0,0 0 0
1 0 0,0 0 0
5 0,0 0 0
2 1 1 , 2 0 5
2 1 1 ,4 5 1
1 8 8 ,6 3 6
1 9,8473 7,7 8 3
195,7 2 4
2 1 9, 3 8 1
2 2 1 ,6 1 0 2 6 7,1 0 62 74 ,7 8 6
2 8 4 , 2 9 8
3 0 0, 2 8 2
2 1 1 , 2 2 2
2 1 4 ,4 2 5 2 3 6,7 9 8
2 2 5,8 4 0 2 2 9, 2 0 62 3 8,7 0 8
2 4 9,4 9 7
2 0 7,0 9 6
2 0 9,6 1 7 2 0 2 , 8 2 2 2 0 3 ,9 9 51 9 9, 3 2 1
1 8 7, 5 2 31 7 5 , 3 8 3
1 ,0 0 0
2007 2008 2009 2010 2011 2012 2013 2014
EMERGENCY SHELTER (18.0% NET CHANGE)
TRANSITIONAL HOUSING(-17.0% NET CHANGE)
PERMANENT SUPPORTIVE HOUSING(59.2% NET CHANGE)
RAPID RE-HOUSING(90.4% NET CHANGE)
CHAPTER THREE THE STATE OF HOMELESSNESS IN AMERICA

57
FIGURE 3.2 H O U S I N G S Y S T E M C A PA C I T Y, 2 0 0 7 -2 0 1 4
7 0 0,0 0 0
6 0 0,0 0 0
5 0 0,0 0 0
4 0 0,0 0 0
3 0 0,0 0 0
2 0 0,0 0 0
1 0 0,0 0 0
0
2007 2008 2009 2010 2011 2012 2013 2014
422
,656
418
,318
424
,04
2
424
,432
429
,835
428
,527
426
,231
424
,88
0
64
9,9
17
636
,017
633
,78
2
610
,04
2
578
,4246
71,8
88
66
4,4
14
64
3,0
67
249
,232
246
,09
6
219
,025
225,
48
5
206
,18
2
205,
255
183,
811
153,
544
ES AND TH BEDS
TOTAL HOMELESS POPULATION
BED SHORTFALL
THE STATE OF HOMELESSNESS IN AMERICA CHAPTER THREE

HOMELESS ASSISTANCE BED USAGE
Figure 3.3 compares the number of people in emergency shelter (ES) and transitional housing (TH) to the
total number of these beds. The homeless assistance system nears capacity each year, with utilization rates
between 91 and 95 percent, but rates for emergency shelter utilization and transitional housing utilization
differ significantly (see figures 3.4 and 3.5).
Figure 3.4 compares the number of people in emergency shelter to the total number of beds designated
for emergency shelter. Each year since 2007, utilization rates have ranged from 98 percent to 103 percent.
58
FIGURE 3.3 B E D U T I L I Z AT I O N T R E N D S , 2 0 0 7 -2 0 1 4
3 5 0,0 0 0
4 0 0,0 0 0
4 5 0,0 0 0
3 0 0,0 0 0
2 5 0,0 0 0
2 0 0,0 0 0
1 5 0,0 0 0
1 0 0,0 0 0
5 0,0 0
0
2007(92.6%)
2008(92.4%)
2009(95.1%)
2010(95.1%)
2011(91.3%)
2012(90.6%)
2013(92.6%)
2014(94.4%)
422
,656
391,
40
1
ES AND TH BEDS PEOPLE IN ES AND TH
418
,318
424
,04
2
424
,432
429
,835
428
,527
426
,231
424
,88
0
40
3,54
3
392,
316
388
,14
7
394
,69
8
40
1,0
51
386
,36
1
40
3,30
8
CHAPTER THREE THE STATE OF HOMELESSNESS IN AMERICA

59
FIGURE 3.4 E M E R G E N C Y S H E LT E R U T I L I Z AT I O N, 2 0 0 7 -2 0 1 4
3 0 0,0 0 0
2 5 0,0 0 0
2 0 0,0 0 0
1 5 0,0 0 0
1 0 0,0 0 0
5 0,0 0
0
2007(102.5%)
2008(101.9%)
2009(103.3%)
2010(100.0%)
2011(98.0%)
2012(98.0%)
2013(99.1%)
2014(101.9%)
211,
451
216
,659
ES BEDS PEOPLE IN ES
211,
222
214
,425
221,
610
225,
84
0
229
,20
6
238
,70
8
249
,49
7
221,
610
221,
422
224
,59
9
236
,658
254
,327
215,
276
221,
474
THE STATE OF HOMELESSNESS IN AMERICA CHAPTER THREE

HOMELESS ASSISTANCE BED UTILIZATION
Figure 3.5 compares the number of people in transitional housing to the total number of beds designated
for transitional housing. Since 2007, transitional housing utilization rates have tended to be lower than
emergency shelter utilization rates, ranging from 82 percent to 89 percent. These rates have not increased
substantially despite a decrease in the number of transitional housing beds.
60
FIGURE 3.5 T R A N S I T I O N A L H O U S I N G U T I L I Z AT I O N, 2 0 0 7 -2 0 1 4
3 0 0,0 0 0
2 5 0,0 0 0
2 0 0,0 0 0
1 5 0,0 0 0
1 0 0,0 0 0
5 0,0 0
0
2007(82.7%)
2008(82.6%)
2009(86.7%)
2010(89.3%)
2011(83.8%)
2012(82.1%)
2013(84.3%)
2014(83.7%)
211,
205
174
,74
2
TH BEDS PEOPLE IN TH
207,
09
6
209
,617
202,
822
203,
99
5
199
,321
187,
523
175,
383
181,
08
8
170
,89
4
163,
548
158
,04
0
146
,724
171,
08
5
181,
834
CHAPTER THREE THE STATE OF HOMELESSNESS IN AMERICA

61
THE STATE OF HOMELESSNESS IN AMERICA CHAPTER THREE

62
MAP 3.1
C H A N G E I N E M E R G E N C Y S H E LT E R B E D C A PA C I T Y, 2 0 1 3 - 1 0 1 4Map 3.1 shows the state-by-state trends in emergency shelter bed capacity between 2013 and 2014.
-1.2%
10.0%
-6.5%
7.1%
45.2%
-6.8%
-4.0%
-25.3%
-4.2%
7.4%-1.6%
19.0%
28.0%
17.8%
1.8%
3.3%
-1.4%
-1.1%
-3.8%
-11.4%
-3.6%
3.6%
9.8%
1.8%
-4.7% -4.8%
-8.8%
8.6%
-13.1% -5.4% 9.9%
3.7%
-3.7%
0.7%
-3.9%
6.2%
-3.9%
3.3%
8.1%
-38.8%
8.5%
8.1%
8.6%3.7%
-8.0%
0.0%
-1.3%6.7%
-1.2%
-1.1%
DC 33.7%
Less Than -10% -10% to 0%0% to 10%More Than 10%
STATE TRENDS IN HOMELESS ASSISTANCE BED CAPACITY AND UTILIZATION
EMERGENCY SHELTER
CHAPTER THREE THE STATE OF HOMELESSNESS IN AMERICA

63
MAP 3.2
E M E R G E N C Y S H E LT E R B E D U T I L I Z AT I O N, 2 0 1 4Map 3.2 illustrates emergency shelter utilization rates for each state in 2014.
93.5%
86.0%
93.7%
117.3%
101.7%
86.0%
63.1%
60.2%
114.8%
95.8%102.5%
106.6%
86.8%
45.8%
91.3%
78.8%
84.4%
81.9%
73.4%
69.6%
90.7%
82.5%
109.2%
90.5%
97.2% 88.9%
108.4%
114.7%
95.9% 100.7% 93.2%
99.7%
107.8%
93.7%
112.2%
105.8%
103.1%
96.0%
98.2%
157.9%
96.1%
149.2%
105.8%110.9%
169.3%
78.8%
131.4%87.2%
95.8%
77.9%
DC 111.6%
30% to 60% 60% to 90%90% to 120%More Than 120%
THE STATE OF HOMELESSNESS IN AMERICA CHAPTER THREE

64
TABLE 3.2
C H A N G E I N E M E R G E N C Y S H E LT E R B E D C A PA C I T Y A N D U T I L I Z AT I O N, 2 0 1 3 -2 0 1 4
ST2014 People
in ES2014 ES
Beds% ES Bed
Filled, 20142013 People
in ES2013 ES
Beds% ES Bed
Filled, 2013
2013-2014 Percentage Point Change in Usage
AK 1,139 1,189 95.8% 1,137 1,204 94.4% 1.4
AL 1,851 1,838 100.7% 1,555 1,943 80.0% 20.7
AR 1,021 1,466 69.6% 1,037 1,655 62.7% 7.0
AZ 4,291 4,481 95.8% 3,893 4,173 93.3% 2.5
CA 20,964 17,869 117.3% 21,928 16,680 131.5% -14.1
CO 4,002 3,753 106.6% 4,025 3,153 127.7% -21.0
CT 2,481 2,238 110.9% 2,390 2,158 110.8% 0.1
DC 5,754 5,157 111.6% 4,010 3,856 104.0% 7.6
DE 435 552 78.8% 516 552 93.5% -14.7
FL 10,250 10,286 99.7% 8,755 9,923 88.2% 11.4
GA 4,441 4,765 93.2% 4,824 4,336 111.3% -18.1
GU 57 102 55.9% 60 109 55.0% 0.8
HI 1,162 1,492 77.9% 1,226 1,508 81.3% -3.4
IA 1,387 1,681 82.5% 1,203 1,623 74.1% 8.4
ID 739 859 86.0% 745 922 80.8% 5.2
IL 5,031 5,174 97.2% 5,160 5,431 95.0% 2.2
IN 3,376 3,796 88.9% 3,087 3,989 77.4% 11.5
KS 1,460 1,852 78.8% 1,329 1,792 74.2% 4.7
KY 2,382 2,198 108.4% 2,439 2,410 101.2% 7.2
LA 1,451 1,976 73.4% 1,389 2,053 67.7% 5.8
MA 16,835 11,287 149.2% 13,962 10,439 133.7% 15.4
MD 3,703 2,818 131.4% 3,713 2,856 130.0% 1.4
ME 1,107 1,184 93.5% 1,090 1,198 91.0% 2.5
MI 5,513 5,348 103.1% 4,927 5,567 88.5% 14.6
MN 4,414 4,041 109.2% 4,158 3,680 113.0% -3.8
MO 3,521 3,882 90.7% 3,381 4,026 84.0% 6.7
MS 732 763 95.9% 501 878 57.1% 38.9
CHAPTER THREE THE STATE OF HOMELESSNESS IN AMERICA

65
ST2014 People
in ES2014 ES
Beds% ES Bed
Filled, 20142013 People
in ES2013 ES
Beds% ES Bed
Filled, 2013
2013-2014 Percentage Point Change in Usage
MT 471 746 63.1% 706 777 90.9% -27.7
NC 5,631 6,008 93.7% 5,281 5,964 88.5% 5.2
ND 639 736 86.8% 540 575 93.9% -7.1
NE 1,584 1,735 91.3% 1,532 1,705 89.9% 1.4
NH 710 739 96.1% 685 681 100.6% -4.5
NJ 7,692 4,543 169.3% 7,224 4,940 146.2% 23.1
NM 1,409 1,375 102.5% 1,495 1,397 107.0% -4.5
NV 3,582 3,523 101.7% 2,496 2,427 102.8% -1.2
NY 66,893 68,152 98.2% 61,742 63,065 97.9% 0.3
OH 7,043 6,660 105.8% 6,336 6,271 101.0% 4.7
OK 2,499 2,962 84.4% 2,301 3,003 76.6% 7.7
OR 2,767 2,952 93.7% 2,800 3,156 88.7% 5.0
PA 7,733 8,053 96.0% 6,943 7,793 89.1% 6.9
PR 406 589 68.9% 339 481 70.5% -1.5
RI 803 759 105.8% 850 699 121.6% -15.8
SC 1,782 1,653 107.8% 1,677 1,717 97.7% 10.1
SD 528 1,154 45.8% 433 980 44.2% 1.6
TN 4,160 3,628 114.7% 3,421 3,340 102.4% 12.2
TX 10,601 12,942 81.9% 9,935 13,088 75.9% 6.0
UT 1,762 1,535 114.8% 1,773 1,602 110.7% 4.1
VA 4,281 3,816 112.2% 4,285 3,972 107.9% 4.3
VI 51 84 60.7% 68 91 74.7% -14.0
VT 1,031 653 157.9% 959 1,067 89.9% 68.0
WA 6,202 7,209 86.0% 5,969 6,554 91.1% -5.0
WI 3,111 3,436 90.5% 3,036 3,375 90.0% 0.6
WV 1,189 1,363 87.2% 1,100 1,278 86.1% 1.2
WY 268 445 60.2% 292 596 49.0% 11.2
US 254,327 249,497 101.9% 236,658 238,708 99.1% 2.8
THE STATE OF HOMELESSNESS IN AMERICA CHAPTER THREE

66
TRANSITIONAL HOUSING
-24.4%
-5.9%
-5.9%
-7.2%
10.0%
8.2%
-12.4%
19.7%
-2.7%
-4.7%-6.5%
7.5%
29.9%
-2.5%
-6.3%
0.6%
-20.8%
3.6%
1.4%
-19.1%
-7.2%
-8.4%
-0.6%
-1.2%
2.5% -5.2%
-13.3%
-12.6%
-4.2% -11.4% 0.1%
-11.0%
-16.0%
-10.4%
-15.9%
-19.6%
-2.4%
0.6%
-18.5%
11.5%
1.1%
-9.4%
-3.3%-8.6%
1.9%
-12.4%
-1.1%-12.1%
-9.6%
9.2%
Less Than -10% -10% to 0% 0% to 10% More Than 10%
DC -24.5%
MAP 3.3
C H A N G E I N T R A N S I T I O N A L H O U S I N G B E D C A PA C I T Y, 2 0 1 3 -2 0 1 4Map 3.3 shows state-by-state trends in transitional housing bed capacity from 2013 to 2014.
CHAPTER THREE THE STATE OF HOMELESSNESS IN AMERICA

67
98.7%
82.6%
83.9%
82.4%
73.5%
80.2%
74.5%
79.7%
83.5%
82.8%95.7%
86.6%
77.5%
50.9%
77.9%
80.4%
82.8%
80.3%
79.0%
70.4%
82.0%
78.4%
96.1%
84.8%
85.0% 72.0%
90.9%
70.3%
79.7% 88.4% 84.0%
79.8%
80.6%
87.3%
83.4%
89.7%
86.2%
83.5%
92.7%
94.3%
80.9%
87.1%
78.8%89.5%
100.9%
69.2%
81.9%65.4%
80.0%
93.2%
DC 75.2%
30% to 60% 60% to 90%90% to 120%More Than 120%
Less Than 75% 75% to 80%80% to 85%More Than 85%
MAP 3.4
T R A N S I T I O N A L H O U S I N G B E D U T I L I Z AT I O N, 2 0 1 4Map 3.4 illustrates transitional housing utilization rates for each state in 2014.
THE STATE OF HOMELESSNESS IN AMERICA CHAPTER THREE

68
TABLE 3.3
C H A N G E I N T R A N S I T I O N A L H O U S I N G B E D C A PA C I T Y A N D U T I L I Z AT I O N, 2 0 1 3 -2 0 1 4
ST2014 People
in TH2014 TH
Beds% TH Beds filled, 2014
2013 People in TH
2013 TH Beds
% TH Beds Filled, 2013
2013-2014 Percentage
Point Change in Utilization
AK 500 625 80.0% 604 691 87.4% -7.4
AL 1,667 1,886 88.4% 1,691 2,129 79.4% 9.0
AR 482 685 70.4% 627 847 74.0% -3.7
AZ 3,635 4,392 82.8% 3,538 4,610 76.7% 6.0
CA 21,551 26,166 82.4% 23,626 28,184 83.8% -1.5
CO 4,081 4,713 86.6% 3,566 4,383 81.4% 5.2
CT 1,050 1,173 89.5% 1,139 1,284 88.7% 0.8
DC 1,598 2,124 75.2% 2,343 2,812 83.3% -8.1
DE 429 620 69.2% 420 708 59.3% 9.9
FL 9,601 12,030 79.8% 10,915 13,515 80.8% -1.0
GA 3,773 4,491 84.0% 3,686 4,487 82.1% 1.9
GU 69 84 82.1% 68 84 81.0% 1.2
HI 2,651 2,844 93.2% 2,519 2,604 96.7% -3.5
IA 1,539 1,962 78.4% 1,747 2,141 81.6% -3.2
ID 729 909 80.2% 659 840 78.5% 1.7
IL 6,378 7,502 85.0% 6,069 7,318 82.9% 2.1
IN 2,192 3,046 72.0% 2,309 3,212 71.9% 0.1
KS 1,074 1,336 80.4% 1,053 1,328 79.3% 1.1
KY 1,876 2,064 90.9% 2,052 2,381 86.2% 4.7
LA 2,052 2,598 79.0% 2,262 2,562 88.3% -9.3
MA 3,643 4,184 87.1% 4,217 4,616 91.4% -4.3
MD 2,564 3,132 81.9% 2,570 3,168 81.1% 0.7
ME 1,526 1,546 98.7% 1,864 2,045 91.1% 7.6
MI 4,562 5,295 86.2% 4,412 5,423 81.4% 4.8
MN 3,168 3,295 96.1% 3,141 3,316 94.7% 1.4
MO 2,788 3,402 82.0% 3,120 3,665 85.1% -3.2
MS 673 844 79.7% 582 881 66.1% 13.7
CHAPTER THREE THE STATE OF HOMELESSNESS IN AMERICA

69
ST2014 People
in TH2014 TH
Beds% TH Beds filled, 2014
2013 People in TH
2013 TH Beds
% TH Beds Filled, 2013
2013-2014 Percentage
Point Change in Utilization
MT 440 591 74.5% 388 675 57.5% 17.0
NC 3,243 3,716 87.3% 3,732 4,148 90.0% -2.7
ND 155 200 77.5% 134 154 87.0% -9.5
NE 1,333 1,711 77.9% 1,440 1,826 78.9% -1.0
NH 533 659 80.9% 560 652 85.9% -5.0
NJ 3,044 3,018 100.9% 3,379 2,962 114.1% -13.2
NM 909 950 95.7% 896 1,016 88.2% 7.5
NV 1,215 1,652 73.5% 1,202 1,502 80.0% -6.5
NY 9,594 10,354 92.7% 11,531 12,697 90.8% 1.8
OH 3,677 4,099 89.7% 4,651 5,097 91.2% -1.5
OK 760 918 82.8% 961 1,159 82.9% -0.1
OR 3,334 3,972 83.9% 3,632 4,223 86.0% -2.1
PA 6,568 7,869 83.5% 6,784 7,819 86.8% -3.3
PR 1,000 1,373 72.8% 1,063 1,483 71.7% 1.2
RI 367 466 78.8% 417 482 86.5% -7.8
SC 1,467 1,820 80.6% 1,734 2,167 80.0% 0.6
SD 302 593 50.9% 322 608 53.0% -2.0
TN 2,223 3,163 70.3% 2,900 3,620 80.1% -9.8
TX 7,627 9,501 80.3% 7,590 9,169 82.8% -2.5
UT 1,006 1,205 83.5% 1,086 1,238 87.7% -4.2
VA 2,049 2,458 83.4% 2,318 2,923 79.3% 4.1
VI 34 43 79.1% 51 60 85.0% -5.9
VT 365 387 94.3% 311 347 89.6% 4.7
WA 6,338 7,677 82.6% 6,738 8,162 82.6% 0.0
WI 2,601 3,068 84.8% 2,700 3,106 86.9% -2.2
WV 394 602 65.4% 512 685 74.7% -9.3
WY 295 370 79.7% 209 309 67.6% 12.1
US 146,724 175,383 83.7% 158,040 187,523 84.3% -0.6
THE STATE OF HOMELESSNESS IN AMERICA CHAPTER THREE

70
PERMANENT SUPPORTIVE HOUSING
11.8%0.0%
1.5%
9.5%
9.4%
7.3%
-9.6%
19.2%
11.3%
8.4%15.3%
3.2%
14.0%
-14.3%
-1.1%
15.8%
25.2%
7.2%-2.9%
-8.3%
8.0%
-2.7%
7.8%
-3.9%
6.6% 5.1%
1.7%
4.7%
3.7% 20.5% -1.8%
7.9%
-10.7%
4.3%
9.5%
10.5%
9.8%
-3.6%
7.5%
8.9%
9.1%
1.7%
-7.6%-1.9%
17.3%
8.3%
-1.1%1.1%
-9.7%
-11.7%
DC 3.1%
Less Than -10% -10% to 0%0% to 10%More Than 10%
MAP 3.5
C H A N G E I N P E R M A N E N T S U P P O RT I V E H O U S I N G B E D C A PA C I T Y, 2 0 1 3 -2 0 1 4Map 3.5 shows state-by-state trends in permanent supportive housing bed capacity from 2013 to 2014.
CHAPTER THREE THE STATE OF HOMELESSNESS IN AMERICA

71
TABLE 3.4
C H A N G E I N P E R M A N E N T S U P P O RT I V E H O U S I N G ( P S H ) C A PA C I T Y C H A N G E , 2 0 1 3 -2 0 1 4
ST PSH Beds 2014 PSH Beds 2013 % Change
AK 715 792 -9.7%
AL 2,891 2,400 20.5%
AR 923 1,006 -8.3%
AZ 7,358 6,785 8.4%
CA 45,580 41,633 9.5%
CO 3,091 2,996 3.2%
CT 5,705 5,817 -1.9%
DC 6,414 6,224 3.1%
DE 598 552 8.3%
FL 15,742 14,592 7.9%
GA 6,923 7,053 -1.8%
GU 102 144 -29.2
HI 1,220 1,382 -11.7%
IA 1,098 1,129 -2.7%
ID 835 778 7.3%
IL 12,317 11,554 6.6%
IN 2,947 2,804 5.1%
KS 1,408 1,216 15.8%
KY 3,077 3,025 1.7%
LA 4,596 4,732 -2.9%
MA 11,948 11,753 1.7%
MD 7,145 7,223 -1.1%
ME 2,464 2,204 11.8%
MI 8,644 7,872 9.8%
MN 10,921 10,135 7.8%
MO 5,659 5,239 8.0%
MS 530 511 3.7%
ST PSH Beds 2014 PSH Beds 2013 % Change
MT 564 624 -9.6%
NC 5,597 5,368 4.3%
ND 650 570 14.0%
NE 1,033 1,044 -1.1%
NH 1,083 993 9.1%
NJ 5,724 4,880 17.3%
NM 1,771 1,536 15.3%
NV 2,842 2,598 9.4%
NY 34,698 32,282 7.5%
OH 14,211 12,863 10.5%
OK 1,392 1,112 25.2%
OR 5,835 5,747 1.5%
PA 11,862 12,304 -3.6%
PR 1,988 1,740 14.3
RI 1,493 1,615 -7.6%
SC 1,748 1,958 -10.7%
SD 526 614 -14.3%
TN 4,563 4,358 4.7%
TX 12,209 11,392 7.2%
UT 2,264 2,035 11.3%
VA 3,582 3,272 9.5%
VI 22 59 -62.7
VT 598 549 8.9%
WA 9,046 9,046 0.0%
WI 2,675 2,784 -3.9%
WV 1,219 1,206 1.1%
WY 236 198 19.2%
US 300,282 284,298 5.6%
THE STATE OF HOMELESSNESS IN AMERICA CHAPTER THREE

72
RAPID RE-HOUSING
1.1%
11.8%
6.8%
3.9%
0.0%
7.8%
5.1%
6.0%
11.6%
3.3%3.7%
3.2%
2.6%
2.6%
2.7%
4.8%
0.6%
3.9%
5.2%
4.9%
4.6%
5.3%
8.6%
4.4%
2.4% 9.1%
2.4%
2.7%
2.8% 0.8% 3.1%
4.3%
6.3%
9.8%
17.3%
11.9%
2.9%
5.3%
0.8%
7.8%
6.9%
8.0%
0.0%2.6%
8.8%
6.8%
1.9%2.2%
5.9%
1.4%
DC 14.5%
0% to 3% 3% to 6%6% to 9%More Than 9%
MAP 3.6
R A P I D R E - H O U S I N G B E D C A PA C I T Y, 2 0 1 3 -2 0 1 4Map 3.6 shows the proportion of overall beds that were rapid re-housing in each state in January
2014.11 Virginia had the highest proportion (17.3 percent) and four states reported no rapid re-housing
beds in 2014.
CHAPTER THREE THE STATE OF HOMELESSNESS IN AMERICA
11 For the purposes of the Housing Inventory, a rapid re-housing bed is one for which rental assistance from any source is being provided on the night of the count.

73
TABLE 3.5
R A P I D R E - H O U S I N G C A PA C I T Y, 2 0 1 4
ST Total RRH BedsTotal Beds
(ES/RRH/TH/SH/PSH)
Percentage of Overall Beds That Are RRH
AK 158 2,687 5.9%
AL 53 6,668 0.8%
AR 157 3,231 4.9%
AZ 557 16,788 3.3%
CA 3,621 93,236 3.9%
CO 388 11,945 3.2%
CT 247 9,363 2.6%
DC 2,326 16,021 14.5%
DE 130 1,900 6.8%
FL 1,702 39,760 4.3%
GA 521 16,700 3.1%
GU 0 288 0.0%
HI 78 5,634 1.4%
IA 264 5,005 5.3%
ID 219 2,822 7.8%
IL 625 25,618 2.4%
IN 976 10,765 9.1%
KS 232 4,828 4.8%
KY 179 7,518 2.4%
LA 502 9,672 5.2%
MA 2,370 29,789 8.0%
MD 247 13,342 1.9%
ME 60 5,254 1.1%
MI 586 19,873 2.9%
MN 1,707 19,964 8.6%
MO 623 13,566 4.6%
MS 62 2,199 2.8%
ST Total RRH BedsTotal Beds
(ES/RRH/TH/SH/PSH)
Percentage of Overall Beds That Are RRH
MT 102 2,003 5.1%
NC 1,667 16,988 9.8%
ND 43 1,629 2.6%
NE 123 4,602 2.7%
NH 184 2,665 6.9%
NJ 1,274 14,559 8.8%
NM 159 4,255 3.7%
NV 0 8,017 0.0%
NY 966 114,170 0.8%
OH 3,366 28,336 11.9%
OK 32 5,304 0.6%
OR 931 13,690 6.8%
PA 1,544 29,328 5.3%
PR 43 3,993 1.1%
RI 0 2,718 0.0%
SC 353 5,574 6.3%
SD 60 2,333 2.6%
TN 320 11,674 2.7%
TX 1,404 36,056 3.9%
UT 657 5,661 11.6%
VA 2,062 11,918 17.3%
VI 0 149 0.0
VT 138 1,776 7.8%
WA 3,207 27,139 11.8%
WI 418 9,597 4.4%
WV 73 3,257 2.2%
WY 67 1,118 6.0%
US 37,783 762,945 5.0%
THE STATE OF HOMELESSNESS IN AMERICA CHAPTER THREE

STChange
in Number of ES Beds
Percentage Point Change in ES Bed
Utilization
Change in Number of TH Beds
Percentage Point Change in TH Bed
Utilization
Change in Number of PSH Beds
Number of RRH Beds
AK -1.2% 1.4 -9.6% -7.4 -9.7% 158
AL -5.4% 20.7 -11.4% 9.0 20.5% 53
AR -11.4% 7.0 -19.1% -3.7 -8.3% 157
AZ 7.4% 2.5 -4.7% 6.0 8.4% 557
CA 7.1% -14.1 -7.2% -1.5 9.5% 3,621
CO 19.0% -21.0 7.5% 5.2 3.2% 388
CT 3.7% 0.1 -8.6% 0.8 -1.9% 247
DC 33.7% 7.6 -24.5% -8.1 3.1% 2,326
DE 0.0% -14.7 -12.4% 9.9 8.3% 130
FL 3.7% 11.4 -11.0% -1.0 7.9% 1,702
GA 9.9% -18.1 0.1% 1.9 -1.8% 521
GU -6.4% 0.8 0.0% 1.2 -29.2% 0
HI -1.1% -3.4 9.2% -3.5 -11.7% 78
IA 3.6% 8.4 -8.4% -3.2 -2.7% 264
ID -6.8% 5.2 8.2% 1.7 7.3% 219
IL -4.7% 2.2 2.5% 2.1 6.6% 625
IN -4.8% 11.5 -5.2% 0.1 5.1% 976
KS 3.3% 4.7 0.6% 1.1 15.8% 232
KY -8.8% 7.2 -13.3% 4.7 1.7% 179
LA -3.8% 5.8 1.4% -9.3 -2.9% 502
MA 8.1% 15.4 -9.4% -4.3 1.7% 2,370
MD -1.3% 1.4 -1.1% 0.7 -1.1% 247
ME -1.2% 2.5 -24.4% 7.6 11.8% 60
MI -3.9% 14.6 -2.4% 4.8 9.8% 586
MN 9.8% -3.8 -0.6% 1.4 7.8% 1,707
MO -3.6% 6.7 -7.2% -3.2 8.0% 623
MS -13.1% 38.9 -4.2% 13.7 3.7% 62
CHAPTER THREE SUMMARY
Table 3.6 summarizes the capacity and utilization rates of the different types
of housing assistance provided by the homeless assistance system.
TABLE 3.6
C H A N G E S I N H O M E L E S S A S S I S TA N C E S Y S T E M BY S TAT E , 2 0 1 3 -2 0 1 4
74
CHAPTER THREE THE STATE OF HOMELESSNESS IN AMERICA

STChange
in Number of ES Beds
Percentage Point Change in ES Bed
Utilization
Change in Number of TH Beds
Percentage Point Change in TH Bed
Utilization
Change in Number of PSH Beds
Number of RRH Beds
MT -4.0% -27.7 -12.4% 17.0 -9.6% 102
NC 0.7% 5.2 -10.4% -2.7 4.3% 1,667
ND 28.0% -7.1 29.9% -9.5 14.0% 43
NE 1.8% 1.4 -6.3% -1.0 -1.1% 123
NH 8.5% -4.5 1.1% -5.0 9.1% 184
NJ -8.0% 23.1 1.9% -13.2 17.3% 1,274
NM -1.6% -4.5 -6.5% 7.5 15.3% 159
NV 45.2% -1.2 10.0% -6.5 9.4% 0
NY 8.1% 0.3 -18.5% 1.8 7.5% 966
OH 6.2% 4.7 -19.6% -1.5 10.5% 3,366
OK -1.4% 7.7 -20.8% -0.1 25.2% 32
OR -6.5% 5.0 -5.9% -2.1 1.5% 931
PA 3.3% 6.9 0.6% -3.3 -3.6% 1,544
PR 22.5% -1.5 -7.4% 1.2 14.3% 43
RI 8.6% -15.8 -3.3% -7.8 -7.6% 0
SC -3.7% 10.1 -16.0% 0.6 -10.7% 353
SD 17.8% 1.6 -2.5% -2.0 -14.3% 60
TN 8.6% 12.2 -12.6% -9.8 4.7% 320
TX -1.1% 6.0 3.6% -2.5 7.2% 1,404
UT -4.2% 4.1 -2.7% -4.2 11.3% 657
VA -3.9% 4.3 -15.9% 4.1 9.5% 2,062
VI -7.7% -14.0 -28.3% -5.9 -62.7% 0
VT -38.8% 68.0 11.5% 4.7 8.9% 138
WA 10.0% -5.0 -5.9% 0.0 0.0% 3,207
WI 1.8% 0.6 -1.2% -2.2 -3.9% 418
WV 6.7% 1.2 -12.1% -9.3 1.1% 73
WY -25.3% 11.2 19.7% 12.1 19.2% 67
US 4.5% 2.8 -6.5% -0.6 5.6% 37,783
* Column represents change in percentage point.
75
THE STATE OF HOMELESSNESS IN AMERICA CHAPTER THREE

APP
END
IX
APPENDIX
M E T H O D O L O GY

77
CHAPTER 1 HOMELESS POPULATIONS AND SUBPOPULATIONS
Data on overall homelessness and subpopulations are
based on annual point-in-time (PIT) counts of homeless
persons conducted by Continuums of Care (CoCs),
local or regional entities that coordinate services and
funding for homeless programs. In 2014, 414 CoCs
throughout the United States, including Guam, Puerto
Rico, and the U.S. Virgin Islands, submitted homeless
population data to HUD. This report used state and
CoC-level point-in-time data from 2007 through 2014
in electronic format from HUD Exchange.
• U.S. Department of Housing and Urban Development.
HUD Exchange. PIT Data since 2007. Retrieved from:
https://www.hudexchange.info/resource/3031/pit-
and-hic-data-since-2007/
CHAPTER 2 POPULATIONS AT RISK OF HOMELESSNESS
Populations at risk of homelessness—persons in
poverty, unemployed persons, poor renter households
with severe housing cost burden, and people in poor
households living doubled up—were identified based
on the fundamental assumption that constrained re-
sources, including low or poverty-level income, place
individuals and households at risk for homelessness.
POVERTY: NUMBER OF PERSONS AND RATE
Data on poverty comes from the U.S. Census Bureau’s
American Fact Finder. This data reports on the number
of people and families whose income in the previous
12 months was below the U.S. poverty level.
• U.S. Census Bureau. American Fact Finder. American
Community Survey 1-Year Estimates, 2012 and 2013.
Retrieved from: http://factfinder.census.gov/faces/
nav/jsf/pages/index.xhtml
UNEMPLOYMENT: NUMBER OF PERSONS AND RATE
Data on unemployment comes from the U.S. Bureau
of Labor Statistics. This report used statewide annual
averages for the civilian non-institutionalized popu-
lation.
• U.S. Bureau of Labor Statistics. Local Area Unemploy-
ment Statistics Program, Statewide Data, Annual Av-
erages Series, 2012 and 2013. Retrieved from: http://
www.bls.gov/lau/rdscnp16.htm
POOR RENTER HOUSEHOLDS WITHSEVERE HOUSING COST BURDEN
Data on poor renter households with severe housing
cost burden was calculated using variables from the
U.S. Census Bureau’s American Community Survey
and from the U.S. Census Bureau’s Poverty Thresh-
old Charts. These calculations included households
who met all of the following conditions: households
renting a housing unit, households whose total income
falls under the poverty threshold for the household
size (as specified by the Poverty Threshold Charts),
and households paying 50 percent or more of total
household income in housing rent.
• Household, renter, and housing cost burden variables:
U.S. Census Bureau. American Community Survey
1-Year Estimates, 2012 and 2013. Retrieved from: http://
www2.census.gov/
• Household poverty status variable: U.S. Census Bureau
Poverty Threshold Charts, 2012 and 2013. Retrieved
from: http://www.census.gov/hhes/www/poverty/data/
threshld/index.html
THE STATE OF HOMELESSNESS IN AMERICA APPENDIX

78
POOR PEOPLE LIVING DOUBLED UP
Data on poor people living doubled up was calcu-
lated using variables from the U.S. Census Bureau’s
American Community Survey. This report defined
poor people as persons living under 125 percent of
the poverty level.
Persons who were defined as poor and who also fell
into any of the following categories were included
in these calculations: persons aged 22 years or older
living with father and/or mother, persons living with
brother and/or sister, persons living with father-in-law
and/or mother-in-law, persons living with son-in-law
and/or daughter-in-law, persons living with any other
relative, persons living with any other non-relative.
Persons who met any of the following conditions were
not included in these calculations: institutionalized
persons, non-institutionalized persons living in group
quarters, persons under the age of 22 years, married
persons living with spouse, housemates/roommates,
and boarders/roomers.
• U.S. Census Bureau. American Community Survey
1-Year Estimates, 2012 and 2013. Retrieved from: http://
www2.census.gov/
CHAPTER 3 HOUSING INVENTORY
Housing Inventory Count (HIC) data is based on
annual point-in-time counts of beds conducted by
Continuums of Care (CoCs), local or regional entities
that coordinate services and funding for homeless
programs. In 2014, 414 CoCs throughout the United
States, including Guam, Puerto Rico, and the U.S.
Virgin Islands, submitted housing inventory data to
HUD. This report used state and CoC-level housing
inventory data from 2007 to 2014 in electronic format
from HUD Exchange.
• U.S. Department of Housing and Urban Development.
HUD Exchange. HIC Data since 2007. Retrieved from:
https://www.hudexchange.info/resource/3031/pit-
and-hic-data-since-2007/
The HIC data set for 2014 categorizes rapid re-housing
beds into Demonstration Projects and Non-Demon-
stration Projects. The data used for rapid re-housing
beds includes both Demonstration Projects and Non-
Demonstration Projects.
APPENDIX THE STATE OF HOMELESSNESS IN AMERICA

79
THE STATE OF HOMELESSNESS IN AMERICA

IMPROVING POLICY - BUILDING CAPACITY - EDUCATING OPINION LEADERS
1518 K STREET, NW, 2ND FLOOR
WASHINGTON, DC 20005
202-638-1526
ENDHOMELESSNESS.ORG