Embed Size (px)
Citation preview
1
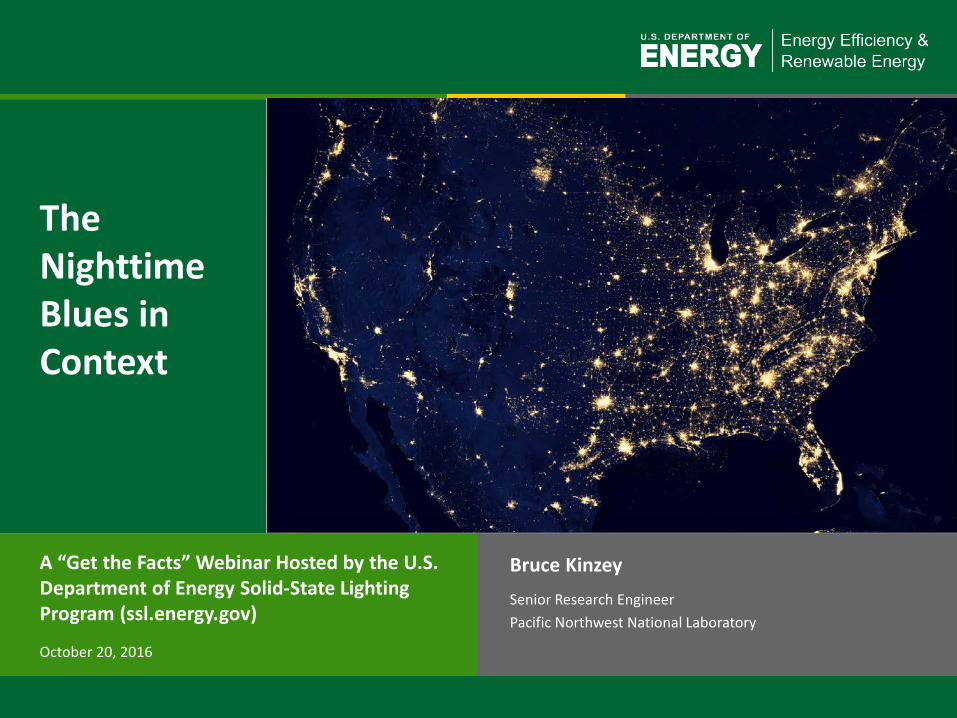
A “Get the Facts” Webinar Hosted by the U.S. Department of Energy Solid-State Lighting Program (ssl.energy.gov)
Bruce Kinzey Senior Research Engineer Pacific Northwest National Laboratory October 20, 2016
The Nighttime Blues in Context

2
Preface
• It is not this presentation’s intent to single out any individual or organization for criticism or culpability, but rather to pursue an objective exchange of ideas as prompted by recent events, based on their scientific merit.
• The discussion reflects the current state of knowledge and corresponding gaps in that knowledge at the time this presentation is being provided. Our understanding can be expected to evolve over time as the science progresses.
3
Introduction
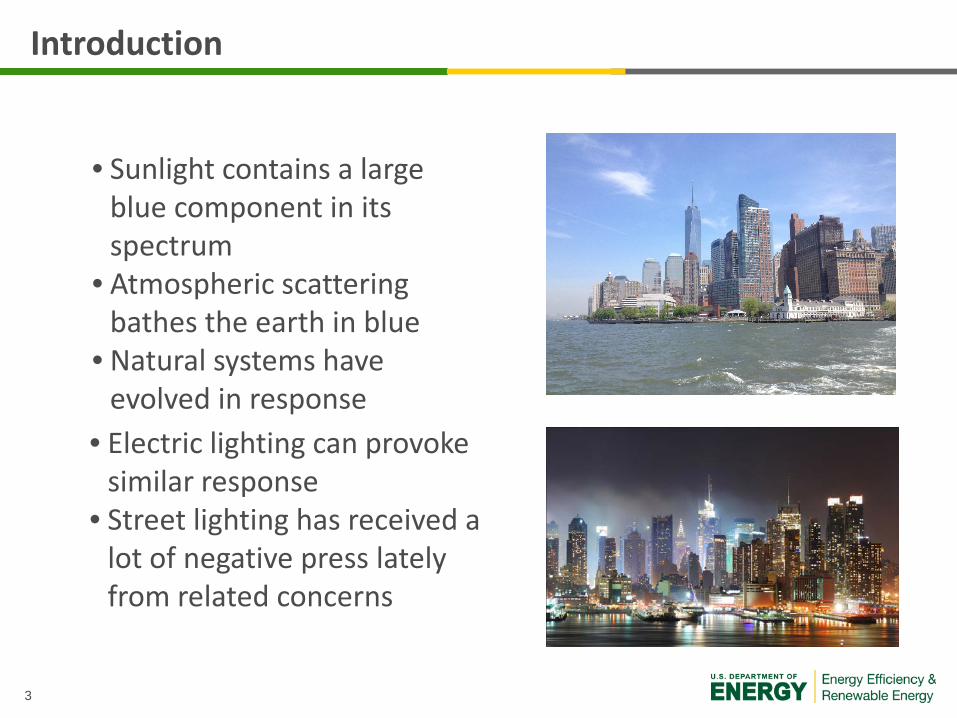
• Sunlight contains a large blue component in its spectrum
• Atmospheric scattering bathes the earth in blue
• Natural systems have evolved in response
• Electric lighting can provoke similar response
• Street lighting has received a lot of negative press lately from related concerns

4 Photo: PNNL
Introduction continued
• Concerns raised about LED conversions in particular − Emphasize blue wavelength content − Underlie both sky glow and health concerns
• These topics and their various aspects are complex and not yet completely understood even by the respective scientific communities working on them − E.g., some disagreement on various factors of influence among both
atmospheric modeling and medical research communities − Are the focus of much continuing research
• In the meantime, lack of clarity on these relationships forces reliance on projections and their underlying assumptions
− E.g., “All other things remaining equal, substituting a 6000 K LED SPD for a 2100 K HPS SPD will result in…”
Things are never equal!
5
Introduction continued
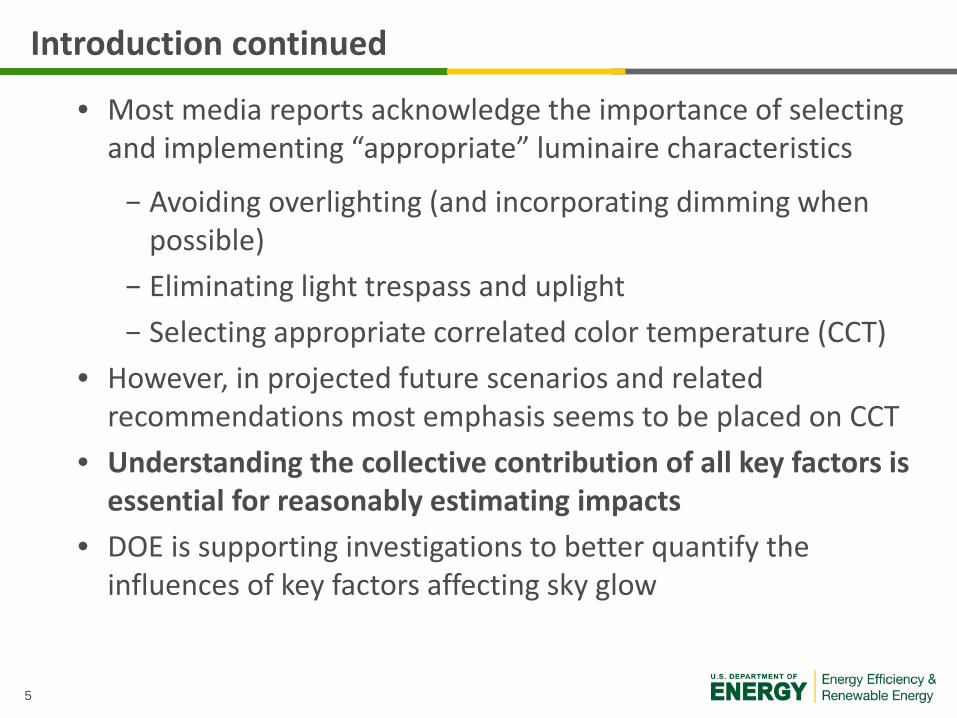
• Most media reports acknowledge the importance of selecting and implementing “appropriate” luminaire characteristics
− Avoiding overlighting (and incorporating dimming when possible)
− Eliminating light trespass and uplight − Selecting appropriate correlated color temperature (CCT)
• However, in projected future scenarios and related recommendations most emphasis seems to be placed on CCT
• Understanding the collective contribution of all key factors is essential for reasonably estimating impacts
• DOE is supporting investigations to better quantify the influences of key factors affecting sky glow

6
Sky Glow
• The original plan: select an established model; run scenarios using actual luminaire characteristics; take measurements at corresponding sites to calibrate
• The reality: − It took a full year to launch model runs − One model abandoned after several months of work, insufficient support
precluded use of a second − Abandoned the idea of taking our own measurements
• Ultimately, selected a model that is well accepted in the astronomical modeling community, carefully validated with other models and varied measurement techniques (e.g., street lights turned on and off) in Frýdek-Místek, CR (pop ~58,000). Source: Miroslav Kocifaj, “Night sky luminance under clear sky conditions: Theory vs. experiment,” 2013 Positions of measured sky
elements

7
SkyGlow Simulator: Miroslav Kocifaj, PhD
Geometric setup of model
Institute of Construction and Architecture, Slovak Academy of Sciences
Colors represent magnitude Isolines are drawn in logarithmic scale
zenith
Polar Plot of Sky Glow
Source: M. Kocifaj. Light-pollution model for cloudy and cloudless night skies with ground-based light sources. Applied Optics 2007; 46: 3013–3022.
Variables: − City (size, shape, location)
− Position of observer
− Fixtures (number, output, percent uplight/ground albedo, SPD)
− City emission function (intensity as a function of zenith angle)
− Atmospheric conditions (cloudless, cloudy, overcast; aerosol content/type)
− Obstacles (horizon shielding)
− Output quantity (unweighted or scotopic)
− Option to write input files
•

8
The Scenarios
• Each run of the model increments a single parameter to determine its individual influence with all other parameters fixed (i.e., results generated for every single combination of input parameters)
• Input parameters include: − 4 cities of varying population (3500 to 500,000) − 2 lumen output levels − 2 emission functions (Garstang or cosine) − 5 atmospheric conditions (4 clear with increased loading, 1 cloudy) − 11 SPDs − 3 uplight percentages (0%, 5%, 10%) − 2 observer locations − 2 output types (non-weighted irradiance or scotopic illuminance) − full SPD or 80 individual spectral increments (5 nm each) => ~430,000 runs, requiring several weeks on a standard desktop
9
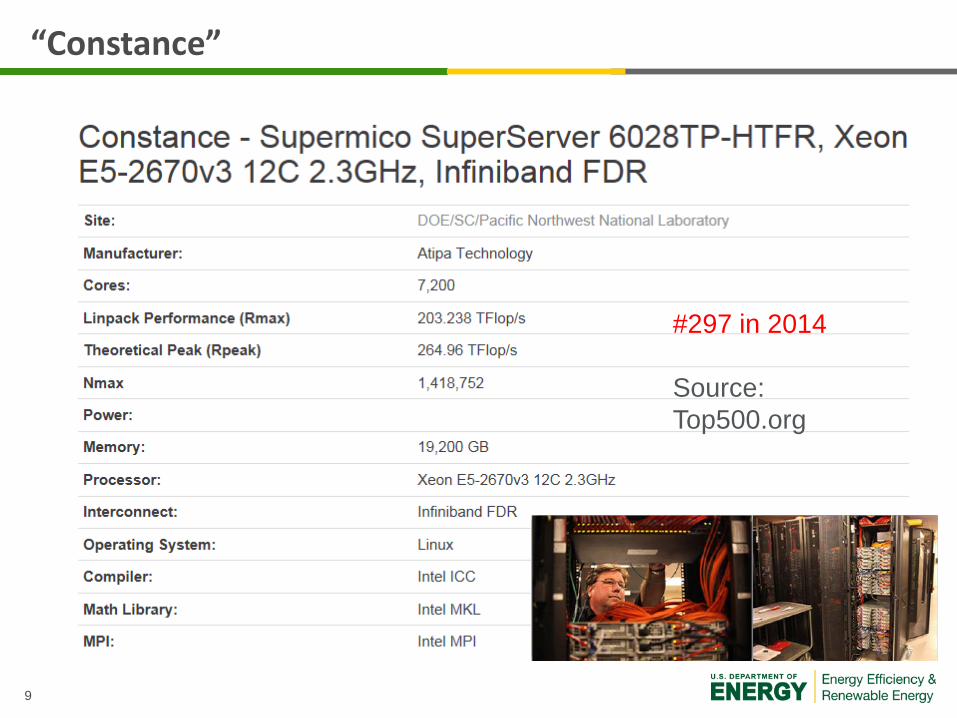
“Constance”
#297 in 2014 Source: Top500.org

10
Sample Result – Direct Uplight Is Significant
Replacing this with this
Number of underlying data runs: 176 Unweighted, Cloudless Conditions Held Constant: emission function, lumen output per fixture, observer location, full SPD
5% 0%
5% uplight 0% uplight
0.87x (13%) 0.48x (52%)
0.72x (28%)
Yields reductions in sky glow in one subset of runs of:

11
Real-World Example (before)
Photo Courtesy: LABSL

12
Real-World Example (after)
Photo Courtesy: LABSL
13
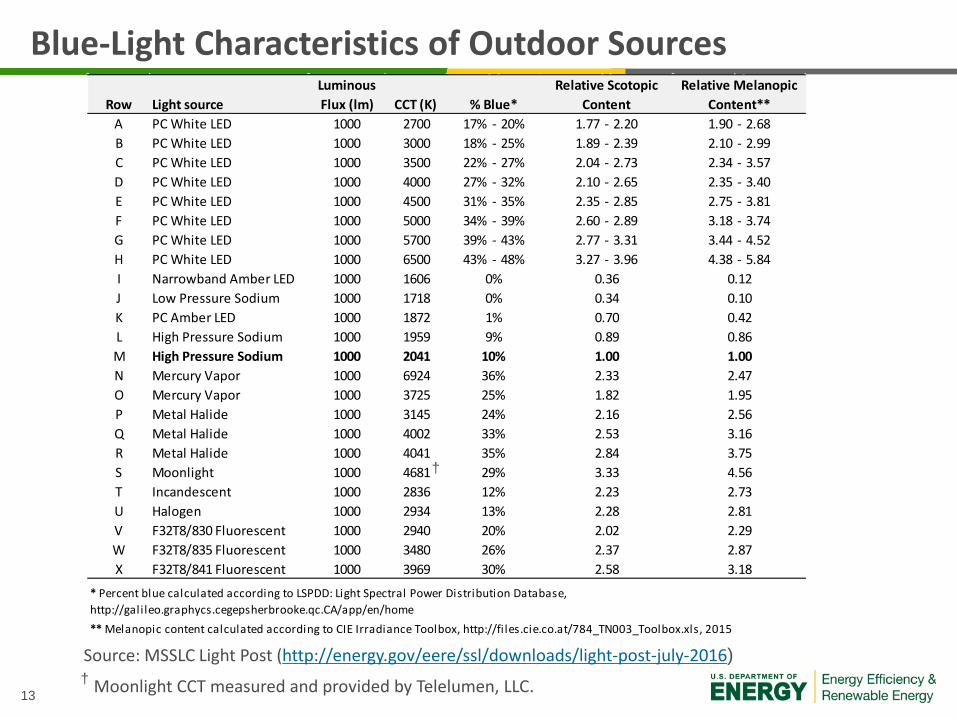
Blue-Light Characteristics of Outdoor Sources
Source: MSSLC Light Post (http://energy.gov/eere/ssl/downloads/light-post-july-2016) † Moonlight CCT measured and provided by Telelumen, LLC.
Row Light sourceLuminous Flux (lm) CCT (K)
A PC White LED 1000 2700 17% - 20% 1.77 - 2.20 1.90 - 2.68B PC White LED 1000 3000 18% - 25% 1.89 - 2.39 2.10 - 2.99C PC White LED 1000 3500 22% - 27% 2.04 - 2.73 2.34 - 3.57D PC White LED 1000 4000 27% - 32% 2.10 - 2.65 2.35 - 3.40E PC White LED 1000 4500 31% - 35% 2.35 - 2.85 2.75 - 3.81F PC White LED 1000 5000 34% - 39% 2.60 - 2.89 3.18 - 3.74G PC White LED 1000 5700 39% - 43% 2.77 - 3.31 3.44 - 4.52H PC White LED 1000 6500 43% - 48% 3.27 - 3.96 4.38 - 5.84I Narrowband Amber LED 1000 1606J Low Pressure Sodium 1000 1718K PC Amber LED 1000 1872L High Pressure Sodium 1000 1959M High Pressure Sodium 1000 2041N Mercury Vapor 1000 6924O Mercury Vapor 1000 3725P Metal Halide 1000 3145Q Metal Halide 1000 4002R Metal Halide 1000 4041S Moonlight 1000 4681T Incandescent 1000 2836U Halogen 1000 2934V F32T8/830 Fluorescent 1000 2940W F32T8/835 Fluorescent 1000 3480X F32T8/841 Fluorescent 1000 3969
* Percent blue calculated according to LSPDD: Light Spectral Power Distribution Database, http://gali leo.graphycs.cegepsherbrooke.qc.CA/app/en/home** Melanopic content calculated according to CIE Irradiance Toolbox, http://fi les.cie.co.at/784_TN003_Toolbox.xls, 2015
24%
26%30%
33%35% 2.84
2.533.75
2.56
2.873.18
3.162.16
2.372.58
13%
0.360.340.700.891.00
2.232.28
0%0%1%9%
10%
29% 3.33
% Blue* Relative Scotopic
Content Relative Melanopic
Content**
2.812.29
0.120.100.420.861.00
2.73
20% 2.02
12%
36% 2.33
4.56
2.4725% 1.82 1.95
†
14
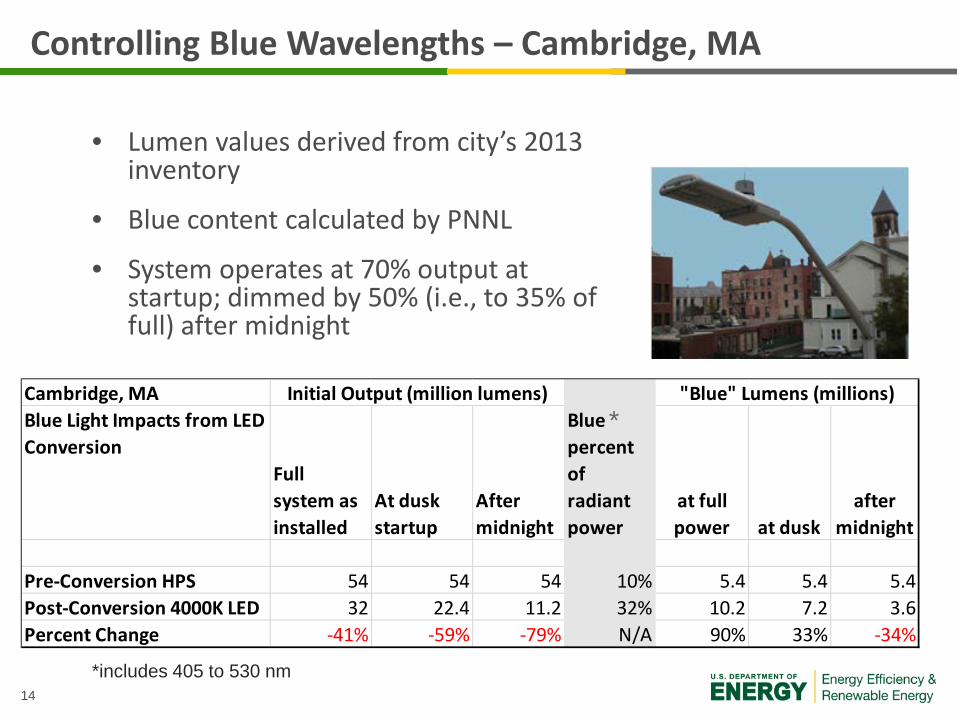
Controlling Blue Wavelengths – Cambridge, MA
• Lumen values derived from city’s 2013 inventory
• Blue content calculated by PNNL
• System operates at 70% output at startup; dimmed by 50% (i.e., to 35% of full) after midnight
*includes 405 to 530 nm
Cambridge, MABlue Light Impacts from LED Conversion
Full system as installed
At dusk startup
After midnight
Blue percent of radiant power
at full power at dusk
after midnight
Pre-Conversion HPS 54 54 54 10% 5.4 5.4 5.4Post-Conversion 4000K LED 32 22.4 11.2 32% 10.2 7.2 3.6Percent Change -41% -59% -79% N/A 90% 33% -34%
Initial Output (million lumens) "Blue" Lumens (millions)*
15
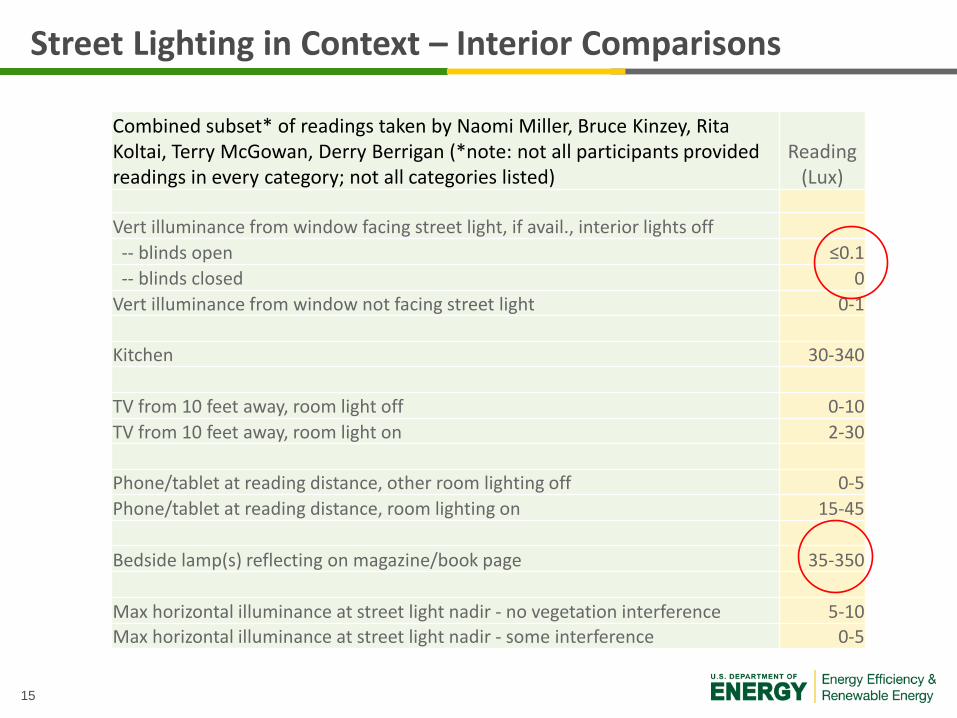
Street Lighting in Context – Interior Comparisons
Combined subset* of readings taken by Naomi Miller, Bruce Kinzey, Rita Koltai, Terry McGowan, Derry Berrigan (*note: not all participants provided readings in every category; not all categories listed)
Reading (Lux)
Vert illuminance from window facing street light, if avail., interior lights off -- blinds open ≤0.1 -- blinds closed 0 Vert illuminance from window not facing street light 0-1
Kitchen 30-340
TV from 10 feet away, room light off 0-10 TV from 10 feet away, room light on 2-30
Phone/tablet at reading distance, other room lighting off 0-5 Phone/tablet at reading distance, room lighting on 15-45
Bedside lamp(s) reflecting on magazine/book page 35-350
Max horizontal illuminance at street light nadir - no vegetation interference 5-10 Max horizontal illuminance at street light nadir - some interference 0-5
16
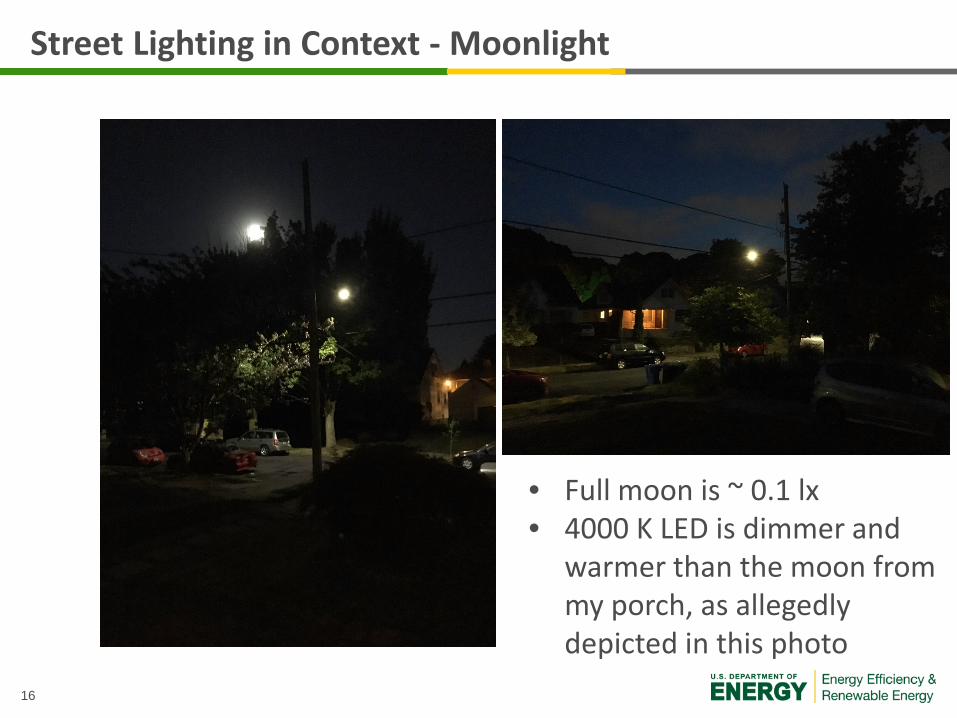
Street Lighting in Context - Moonlight
• Full moon is ~ 0.1 lx • 4000 K LED is dimmer and
warmer than the moon from my porch, as allegedly depicted in this photo
17
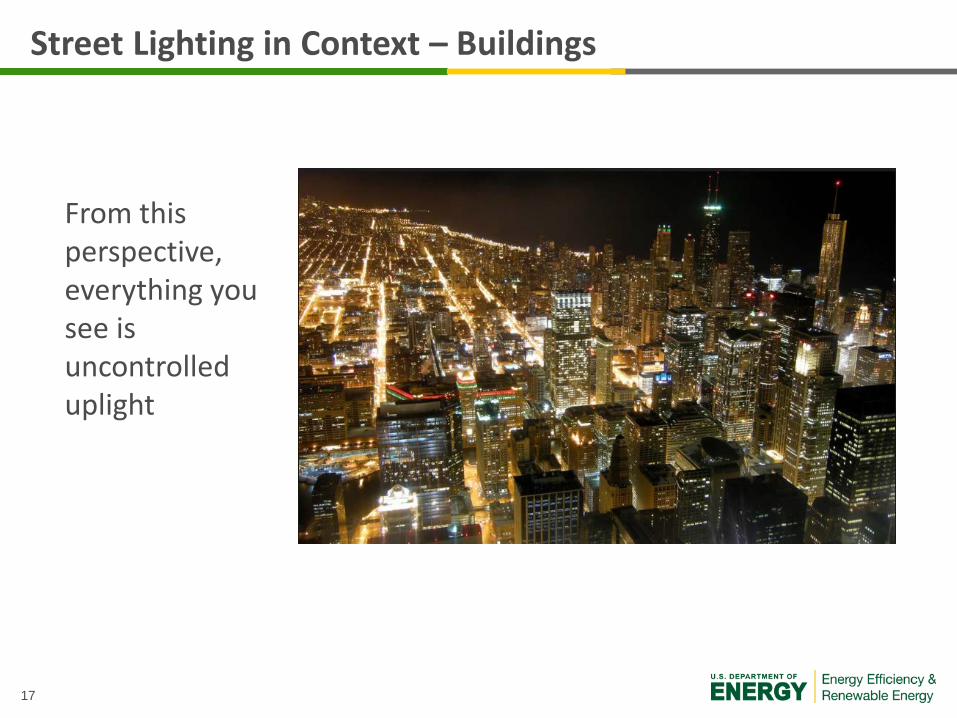
Street Lighting in Context – Buildings
From this perspective, everything you see is uncontrolled uplight
18
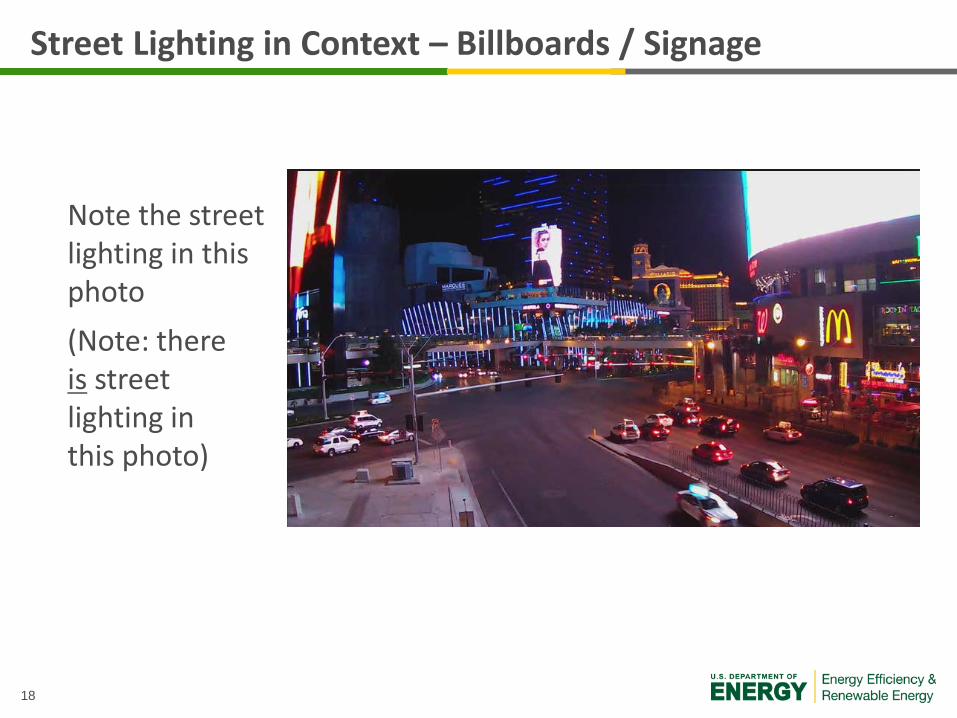
Street Lighting in Context – Billboards / Signage
Note the street lighting in this photo (Note: there is street lighting in this photo)
19
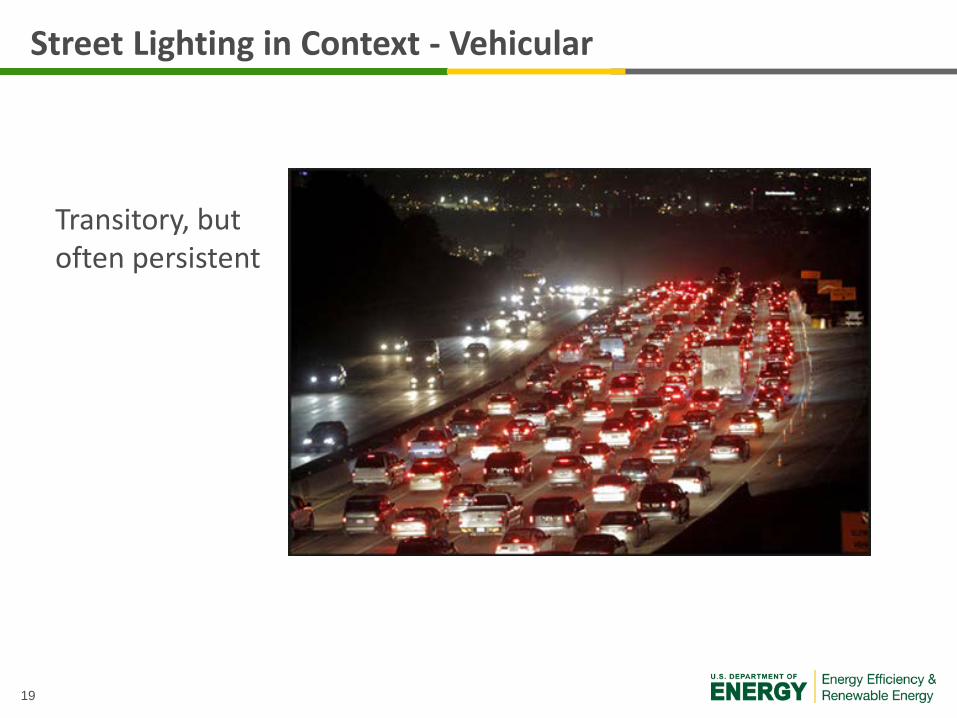
Street Lighting in Context - Vehicular
Transitory, but often persistent

20
What Do We Do With this Information?
• Provide to lighting owners concerned about potential adverse impacts of their planned or completed conversions, improving decision-making ability
• Provide related tools to the lighting community to help refine designs • Increase effectiveness of efforts undertaken to address the concerns • Reduce the association in the public mind that these issues are unique
characteristics of LED technology • Hopefully, identify larger areas of common ground between stakeholder
and public guardian groups

21
Related DOE Resources
• “SSL Posting” issued in response to the AMA release • Municipal Solid-State Lighting Consortium response to the AMA release • “SSL Posting” on LED Outdoor Area Lighting • “True Colors” Fact Sheet • GATEWAY Demonstration Outdoor Projects • LightingFacts® Database
22
Bruce Kinzey Tess Perrin
Michael Royer Pacific Northwest National Laboratory
Q&A