Embed Size (px)
Citation preview
The Economic and Social Research Foundation (ESRF)
THDR 2014: Background Paper No. 4ESRF Discussion Paper 58
THE NExuS BETwEEN HumaN DEvEloPmENT
aND gRowTH
By Dr. Amarakoon Bandara, Prof. Rajeev Dehejia andMr. Shaheen Lavie-Rouse
2014 www.esrftz.org


THDR 2014: Background Paper No. 4, ESRF Discussion Paper 58 | i
THE NExuS BETwEENHumaN DEvEloPmENT
aND gRowTH
ByDr. Amarakoon Bandara, Prof. Rajeev Dehejia and Mr. Shaheen Lavie-Rouse
THDR 2014: Background Paper No. 4ESRF Discussion Paper 58
ISBN: 978-9987-610-93-8@ 2014 Economic and Social Research Foundation
Email: [email protected] • Website: www.esrftz.org
Published by:
ii | THDR 2014: Background Paper No. 4, ESRF Discussion Paper 58
ackNowlEDgEmENT .......................................................................................................... iiiaBSTRacT .............................................................................................................................. iv
1. Introduction ................................................................................................................... 1
2. literature Review .......................................................................................................... 3 2.1 Impact of education on growth ........................................................................................................................3 2.2 The criticality of quality of education.............................................................................................................4 2.3 Impact of health on growth.................................................................................................................................4 2.4 The bi-directionality of the relationships .....................................................................................................5
3. The model ...................................................................................................................... 7 3.1 From human development to economic growth .................................................................................7 3.2 From economic growth to human development .................................................................................8
4. Empirical methods and Data ........................................................................................ 9 4.1 Empirical methods .....................................................................................................................................................9 4.2 Data sets ........................................................................................................................................................................ 10 4.3 Human Development Outcome Measures ............................................................................................. 10 4.4 Economic Activity Outcome Measures ...................................................................................................... 11 4.5 Controls and Interactions ................................................................................................................................... 11 4.6 Summary Statistics ................................................................................................................................................. 11
5. The Study Findings ...................................................................................................... 13 5.1 From economic growth to human development .............................................................................. 13 5.2 From human development to economic growth .............................................................................. 15
6. Policy implications ...................................................................................................... 16
7. Summary and conclusion ........................................................................................... 18
REFERENcES ......................................................................................................................... 19
Table of Contents

THDR 2014: Background Paper No. 4, ESRF Discussion Paper 58 | iii
This paper is published as part of the background papers for Tanzania Human Development Report (THDR) 2014: Economic Transformation for Human Development in Tanzaniacoordinated by the Economic and Social Research Foundation (ESRF). The authors would like to extend sincere gratitude
to the Executive Director of ESRF, Dr. Hoseana B. Lunogelo for giving the opportunity to carry out the work. Special thanks are due to Dr. Tausi Kida, the Director of Programmes at ESRF and Project Manager for THDR for technical and coordination support provided throughout the process of preparation of the report. We would like to record our gratitude to members of THDR core team in charge of preparation of THDR 2014 for invaluable comments and guidance; these are: Prof. Marc Wuyts (ISS), Mr. Rodgers Dhliwayo (UNDP), Mr. Amon Manyama (UNDP), Dr. Jehovaness Aikaeli (DoE UDSM), Dr. Kenneth Mdadila (DoE UDSM), Mr. Ahmed Markbel (NBS). Mr. Sango Simba (NBS), Mr. Deogratias Mutalemwa (ESRF) and Ms. Monica Githaiga (UNESCO). We appreciate comments received from members of THDR Working Group and from different workshops held as part of the peer review process of the background papers of the THDR 2014 THDR. In particular, we thank Dr. Donald Mmari and Dr. Oswald Mashindano for reviewing earlier versions of this paper. Last but not least, the authors would like to specially recognize the support extended by Mr. Danford Sango and Mr. Yasser Manu of ESRF at their capacity as members of THDR secretariat.
Finally, ESRF would like to thank UNDP for financial support provided for executing the project.
Acknowledgement
iv | THDR 2014: Background Paper No. 4, ESRF Discussion Paper 58
We use five rounds of two large-scale surveys conducted in Tanzania to explore the two-way relationship between growth and human development. Several proxy indicators for growth have been used in the exercise. We find systematic evidence of a relationship
in both directions, with growth enhancing human development and human development feeding into growth. While the overall results do substantiate the idea of a virtuous circle between economic growth and human development, the magnitude of the effects of key growth variables such as income per capita and expenditure per capita on human development outcomes is sobering. However, we see larger effects of growth proxies such as having a bank account, durable assets and wealth on human development outcomes. While economic growth, in general, is likely to be the primary driver of progress in human development indicators in Tanzania, results seem to suggest its limitations and potential in future human development gains. We also find strong positive effects of human development aspects such as literacy, schooling and food security on economic growth proxies.
JEL Classification: F43, J24, I31Keywords: Growth, Human development, human capital, transitionCorresponding author’s email address: [email protected]
Abstract
THDR 2014: Background Paper No. 4, ESRF Discussion Paper 58 | 1
Tanzania has done rather well in the human development front in the past decade or so. For example, since 2000, Human Development Index (HDI) grew by an average of 2.36 per cent annually. Its record during 2007-2012 is even better, jumping 15 places up in HDI, the
highest by any country during that period. As indicated in Table 1, the success is mainly coming from growth in per capita income and schooling. Both per capita income (PPP$) and mean years of schooling increased by over 6 per cent annually. This is a significant achievement. Yet, life expectancy grew very slowly owing to diseases such as Malaria and HIV/AIDS, among other factors. While it had a dampening effect on Tanzania’s success in human development, one cannot expect life expectancy to jump over a short time horizon.
While the numbers give a rosy picture, they do not reveal all. Per capita income increased by almost 150% since 1990, but poverty fell only marginally, less than 14 per cent during that period. Economic growth does not seem to be inclusive or broad based. Productivity in agriculture, the key sector that provides livelihoods for the majority, remains low indicating limited economic transformation in Tanzania over the years. On the other hand, high growth areas such as mining remain enclaves with limited employment generation and revenue spillover effects on the rest of the economy. The mean years of schooling also increased by over 150% during this period but the issue of quality of education is well known and debated. A significant increase in the mean years of schooling does not make any sense if the children getting out of school cannot read or write properly. A broader measure of poverty, the multidimensional poverty index (MPI) indicates that 65 per cent of Tanzanians are multidimensional poor. The poor are particularly deprived of access to safe drinking water, sanitation electricity and housing.
The basic objective of HDI, often refined to mirror ground realities, is to measure human wellbeing with some proxy variables such as life expectancy, gross national income (GNI) and schooling. The assumption made here is that these variables will reflect a picture of the majority. For example if a country’s per capita income is growing fast, we expect the majority to benefit from that growth. When we send children to school we expect, by the time they leave school, to be able to read and write.
The link between economic growth and human development is not automatic, but the links make economic growth and human development mutually reinforcing (HDR, 1996). When these links are strong, they contribute to each other. When the links are weak or broken, they become mutually stifling. The absence of one undermines the other. On the other hand unbalanced links are the result of rapid human development with little growth in which case human development may not be sustainable, or of fast growth with slow human development which is also not desirable. Conversely, there is a link back in the form of investment in education, health and nutrition that enhance human capital that can result in increased productivity. With a young population (see Table 2b) this could potentially be a crucial link in Tanzania’s progress in growth and human development. Other elements of human development, such as political freedom, cultural heritage and environmental sustainability can also have an influence on productivity, hence growth. In other words, the links between human development and economic growth can make them mutually
1. Introduction
2 | THDR 2014: Background Paper No. 4, ESRF Discussion Paper 58
reinforcing. In general weak links can be strengthened or broken links can be restored through sensible government policies and programmes.
Although Tanzania has made some gains in human development in recent years, its human development stock is very low, ranking only 152nd out of 187 countries in 2013. On the other hand, with two-thirds of the Tanzanian population below the Multidimensional Poverty Index (MPI), a broader measure of human development, Tanzania seems to fall into the category of countries with weak links between economic growth and human development. Understanding the nature of such links is crucial for policy making in developing countries including Tanzania. This is particularly important when there is a visible push for growth, yet uncertainties remain on the broader human development outcomes. The envisaged economic transformation through new policy instruments such as the Five Year Development Plan (FYDP) and approaches such as the Big Results Now (BRN) will enhance broader human development if the underlying reasons for weak links between growth and human development are known and properly addressed.
As such the objective of the paper is to investigate the links between growth and human development, analyze the underlying factors that lead to such weak or strong relationships and propose policy options for making the links stronger. The remainder of the paper is structured as follows. Section II provides a brief review of literature on the links between growth and human development. This section also looks at the relationship between growth and those that relates to human development. An endogenous growth model that links growth with human development is developed and empirically tested in Section III. Data and estimation methodology are briefly explained in Section IV. The results are analyzed in Section V while policy implications are presented in Section VI. A summary and conclusion is provided in Section VII.
THDR 2014: Background Paper No. 4, ESRF Discussion Paper 58 | 3
The Human Development Report 1996 provided an early review of the links between growth and human development. It argues that economic growth expands the material base for the fulfillment of human needs. The fact that income growth is a main contributor to increasing
capabilities is reiterated by Sen (2000) and Ranis (2004). Yet, the extent to which these needs are met depends on how the resources are allocated among people and sectors and the distribution of income and opportunities. Similar levels of human development can be achieved with markedly different levels of income depending on the level of efficiency in transforming income into human development. Higher levels of economic growth and expenditure per capita on basic services are also critical in achieving a higher level of human development. For example, in 1960 Botswana and Kenya had virtually the same Gross Domestic Product (GDP) per capita. Both countries spent on average 9 per cent of GDP on health and education. But because Botswana’s GDP growth was 6.5 per cent compared to Kenya’s 1.6 per cent by 1992 Botswana was spending five times as much per person on health and education as Kenya. In 2012 Botswana was ranked 119 in the HDI ranking whereas Kenya was only 145 (UNDP 2013).
Investments in health and education are considered key to promoting human development as they are fundamental to making the labor force more productive. For example, the overall contribution of a healthy population to economic growth was evident even in early years. A 10 per cent increase in life expectancy was estimated to raise economic growth rate by one percentage point a year. Increasing public expenditure alone may not bring in the desired human development results. Effectiveness of public expenditure is conditional on the quality of governance, with government accountability playing an important role (Rajkumar and Swaroop (2002). A country is unlikely to undergo a structural transformation of the economy without raising basic education levels. This is particularly so in a more integrated world economy. Without a labor force with basic skills a country cannot adapt to changing market conditions. The basic thrust of the argument here is that the causality could be bi-directional, the strength of the link depending on many factors.
2.1 Impact of education on growth
Most of the literature deals with specific components of human development such as health and education and their relationship with economic growth. Education has long been considered as a key determinant of economic well-being, including the distribution of income. While education enhances the human capital inherent in the labor force, increasing labor productivity and thus a higher level of output (Mankiw 1992), it also increases the innovative capacity of the economy, enabling generation of new technology and further promoting growth. The latter is essentially linked to endogenous growth theory (Lucas 1988, Romer 1990). Moreover, education enables adaptation to new technologies (Nelson and Phelps 1966).
More recent empirical findings also support these arguments. Primary education is the most robust factor influencing economic growth, particularly in developing countries (Sala-i-Martin et al. 2004). A positive relationship between education spending and economic growth is also found by Baladacci et al. (2008). Similar results were established by Lawal and Whab (2011) for Nigeria
2. Literature Review
4 | THDR 2014: Background Paper No. 4, ESRF Discussion Paper 58
and by Tsamadias and Prontzas (2012) for Greece. According to Hanushek and Kimko (2000) countries with high school enrolment have a faster per capita income growth leading to a rapid improvement in productivity. Education is important both as an investment in human capital and in facilitating research and development and diffusion of technologies. Foster and Rosenzweig (1995) found education to be associated with faster technology adoption in Green Revolution in India. According to Deraniyagala (1995), higher education levels are associated with an increasing level of innovation and technical change in Sri Lankan entrepreneurs. As indicated earlier higher education is more important for innovation while initial phases of education are utilized more for imitation (Vandenbussche et al. 2006). The latter is emphasized by Krueger and Lindahl (2001) as well. On the other hand, Islam (2010) using a panel data set for 87 countries found that the effect of skilled human capital on growth increases as the distance to the technology frontier narrows in high and medium income countries but not in low income countries. Several studies also find education to have an effect on economic growth in the long run but not in the short run (Reza and Valeecha 2012).
2.2 The criticality of quality of education
Many studies point to the fact that it is the quality of education that influences growth. A quality labor force enables innovation and technological adaptation. Lee and Barro (2001) showed that school resources, in particular small class sizes, average years of schooling and teacher salaries enhance educational outcome. On the other hand, Hanushek et al. (2008) found that labor force quality, based on international mathematics and science scores, could have a greater impact on economic growth. Similar results are found in Hanushek and Woessmann (2008 and 2010) as well. After controlling for initial GDP per capita and for years of schooling, they found international test scores to significantly affect economic growth in OECD countries. According to findings by OECD (2012), more than half of the GDP growth in OECD countries over the past decade is related to labor income growth among tertiary educated individuals indicating the effect of quality education on growth. Coulombe and Tremblay (2006) and Jamison et al. (2007) also found similar results. These evidences suggest that it is the quality of education, measured by the knowledge that students gain that enhances cognitive skills that are more relevant to economic growth than the mere quantity of schooling. This is a highly debated issue in Tanzania. A low pass rate, limited time spent on learning at school, quality of teachers, large class sizes, limited education budget and limited availability of learning material indicate signs of low quality of education. This could also mean weak linkages between education and growth in the Tanzanian context.
Jamison et al. (2007) point to the relevance of economic conditions for education to have an impact on growth. For example, they found a stronger impact of education quality and of years of schooling in open than closed economies. The importance of complementary institutions for strengthening the education-growth relationship is highlighted in several other studies as well including Easterly (2001) and Pritchett (2006). These indicate that education alone cannot transform an economy even if education is of high quality. Institutions that facilitate the efficient use of such quality human capital for productive purposes are equally important.
2.3 Impact of health on growth
In addition to its inherent desirability as an end in itself, health also has a significant positive effect on growth through its impact on human capital. The burden of disease also has a substantial impact on poverty, strongly affecting development and economic growth. Early studies have
THDR 2014: Background Paper No. 4, ESRF Discussion Paper 58 | 5
observed a range of labor productivity gains due to good health. For example, higher calorie or micro nutrient intake among sugar cane workers in Guatemala (Immink and Viterri 1981), road construction workers in Kenya (Wolgemuth et al. 1982), farmers in Sierra Leone (Strauss 1986) and poor countries (Cornia and Stewart 1995) are found to have increased labor productivity. Recent studies also point to this positive relationship. Thomas et al. (2004) showed that adult nutrition has a strong positive effect on labor input and wages. Using average height, adult survival rate and life expectancy as health indicators, Weil (2007) established that health is an important determinant of income variations in different countries. On the other hand, Weil (2007) also found that eliminating health differences among countries would reduce the variance of log GDP per worker by almost 10 per cent and reduce the ratio of GDP per worker at the 90th percentile to GDP per worker at the 10th percentile from 20.5 to 17.9 improving income disparities. Weak health status could also have adverse effects on labor productivity that could explain the existence of underdevelopment in many developing countries (Cole and Neumayer2006).
Just as education, health, while having immediate gains, also seem to have long run development effects. For example, 25-30 year long term effects of life expectancy on economic growth are found by Mayer-Foulkes (2001a) for Mexican states and by Mayer-Foulkes (2001b) for Latin American countries. Jamison et al. (2005) found improved health to account for 10-15 per cent of economic growth in the later decades of the 20th century. Examining the long run relationship between health care and income using a panel of 20 OECD countries, Baltagi and Moscone (2010) suggested that health care is a necessity rather than a luxury, with elasticity smaller than that estimated in previous studies. Akram et al. (2008), in an Error Correction Model for Pakistan, reveal that health indicator does not have a significant effect on economic growth in the short run.
2.4 The bi-directionality of the relationships
The relationship between health and growth also seem to be bi-directional. Employing Granger causality tests within a multivariate and error-correction model for Malaysia, Tang (2011) found a unidirectional Granger causality running from relative price to health care spending while relative prices and health care spending to have a bi-directional Granger causality in the short run. However, in the long run, health care spending and income exhibited bi-directional Granger causality. Similar relationships are also established by Amiria and Gerdtham (2013). In their study they found 58 per cent of the sample countries (105 out of 180) to have a bi-directional relationship between under-five mortality and economic growth while 40 per cent of the sample countries (68 out of 170) to have bi-directional relationship between maternal mortality and economic growth. On the other hand, in a study of 20 developing countries Elmi and Sadeghi (2012) reveal short run causality from GDP to health care spending while they could not establish a short run relationship running from health spending to growth. The magnitude of the effect of GDP on maternal and child health outcomes seems larger in low and middle income countries than high income and upper middle income countries indicating the implications of resources on health outcomes in developing countries. In a study of African countries, Oketch (2006) also found two-way links between human resource development produced by formal schooling and economic growth. They concluded that human capital development is one of the key sources of labor productivity growth in Africa in the medium term.
A key concern for developing countries, such as Tanzania, is if growth leads to improved human development outcomes. In particular does growth spur gains in human development? If so, is this automatic? Theoretically, rising per capita incomes due to economic growth could lead to
6 | THDR 2014: Background Paper No. 4, ESRF Discussion Paper 58
better nutrition which could improve health (Fogel 1997). On the other hand, economic growth is driven by technical progress, which could also imply improvements in the medical sciences in the country. The latter could have a direct effect on health outcomes. Early empirical evidence for several African, Asian and Latin American countries indicates a positive effect of family income change on child schooling (Alderman et al. 1995 and 1996).
THDR 2014: Background Paper No. 4, ESRF Discussion Paper 58 | 7
3.1 From human development to economic growth
Human development is a process of enlarging people’s choices. The most critical ones are to lead a long and healthy life, to be educated, and to enjoy a decent standard of living (Ranis et al. 2007). While there could be additional choices such as political freedom, guaranteed
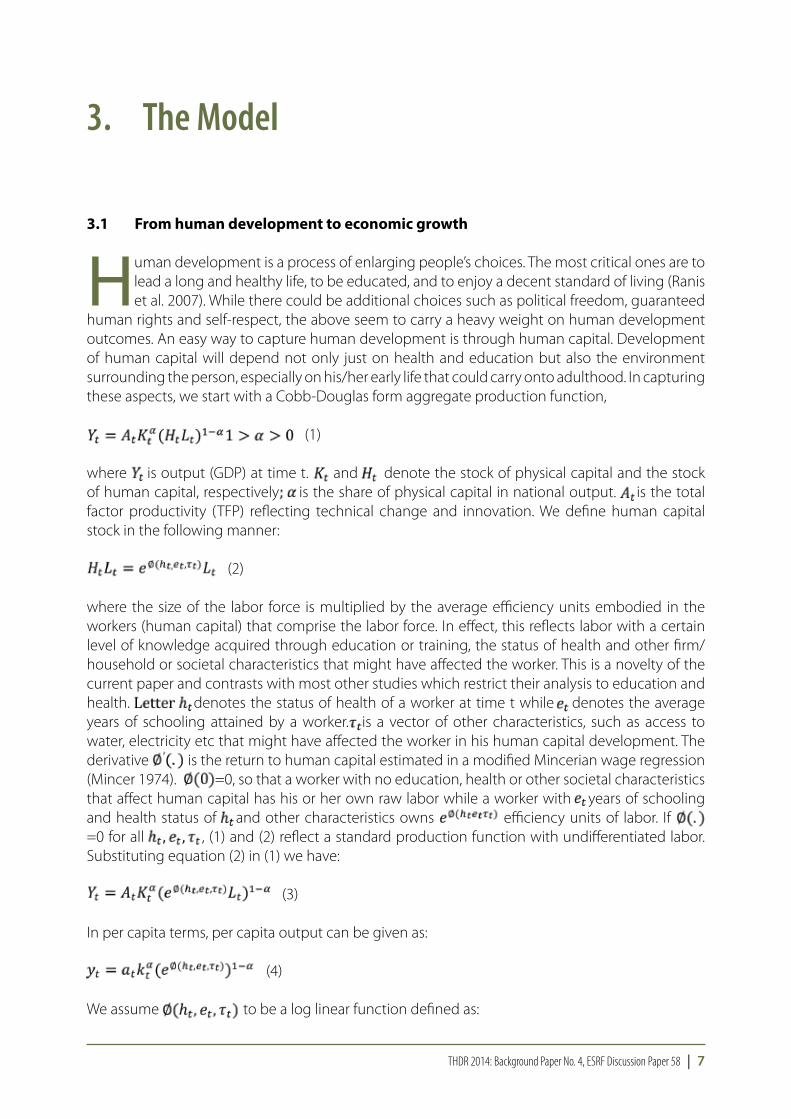
human rights and self-respect, the above seem to carry a heavy weight on human development outcomes. An easy way to capture human development is through human capital. Development of human capital will depend not only just on health and education but also the environment surrounding the person, especially on his/her early life that could carry onto adulthood. In capturing these aspects, we start with a Cobb-Douglas form aggregate production function,
(1)
where is output (GDP) at time t. and denote the stock of physical capital and the stock of human capital, respectively . is the share of physical capital in national output. is the total factor productivity (TFP) reflecting technical change and innovation. We define human capital stock in the following manner:
(2)
where the size of the labor force is multiplied by the average efficiency units embodied in the workers (human capital) that comprise the labor force. In effect, this reflects labor with a certain level of knowledge acquired through education or training, the status of health and other firm/household or societal characteristics that might have affected the worker. This is a novelty of the current paper and contrasts with most other studies which restrict their analysis to education and health. denotes the status of health of a worker at time t while denotes the average years of schooling attained by a worker. is a vector of other characteristics, such as access to water, electricity etc that might have affected the worker in his human capital development. The derivative is the return to human capital estimated in a modified Mincerian wage regression (Mincer 1974). =0, so that a worker with no education, health or other societal characteristics that affect human capital has his or her own raw labor while a worker with years of schooling and health status of and other characteristics owns efficiency units of labor. If =0 for all , (1) and (2) reflect a standard production function with undifferentiated labor. Substituting equation (2) in (1) we have:
(3)
In per capita terms, per capita output can be given as:
(4)
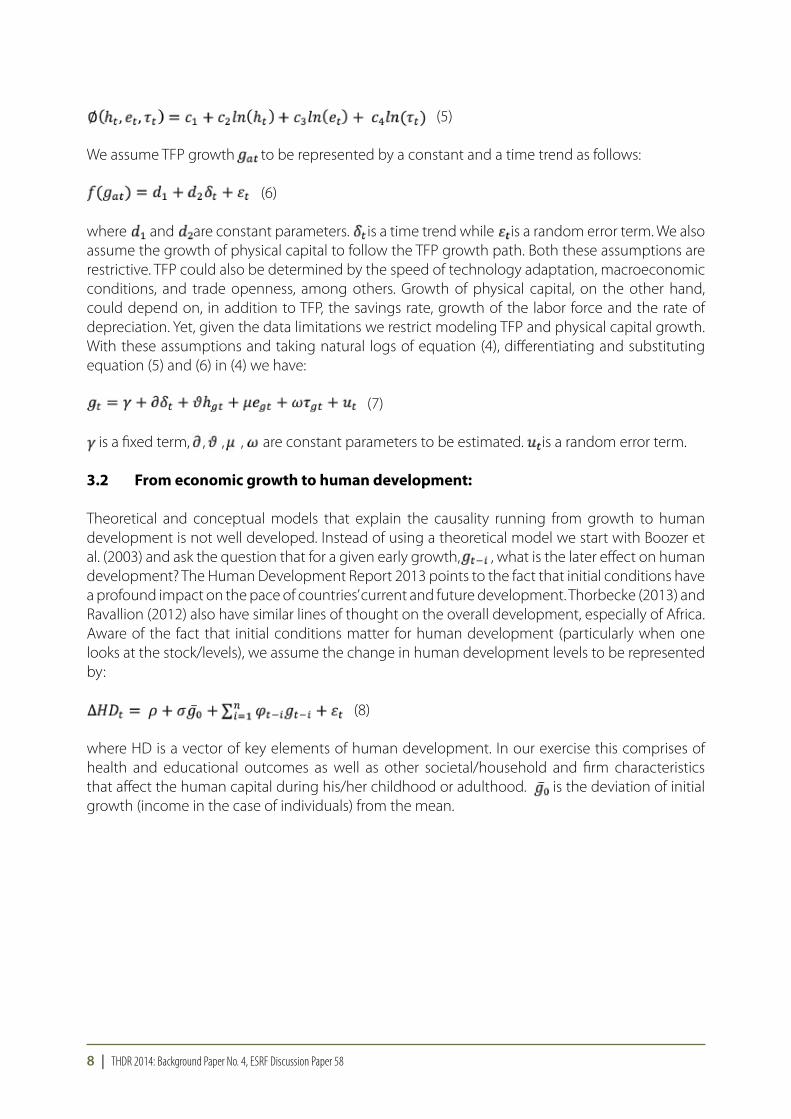
We assume to be a log linear function defined as:
3. The Model
8 | THDR 2014: Background Paper No. 4, ESRF Discussion Paper 58
(5)
We assume TFP growth to be represented by a constant and a time trend as follows:
(6)
where and are constant parameters. is a time trend while is a random error term. We also assume the growth of physical capital to follow the TFP growth path. Both these assumptions are restrictive. TFP could also be determined by the speed of technology adaptation, macroeconomic conditions, and trade openness, among others. Growth of physical capital, on the other hand, could depend on, in addition to TFP, the savings rate, growth of the labor force and the rate of depreciation. Yet, given the data limitations we restrict modeling TFP and physical capital growth. With these assumptions and taking natural logs of equation (4), differentiating and substituting equation (5) and (6) in (4) we have:
(7)
is a fixed term, , , , are constant parameters to be estimated. is a random error term.
3.2 From economic growth to human development:
Theoretical and conceptual models that explain the causality running from growth to human development is not well developed. Instead of using a theoretical model we start with Boozer et al. (2003) and ask the question that for a given early growth, , what is the later effect on human development? The Human Development Report 2013 points to the fact that initial conditions have a profound impact on the pace of countries’ current and future development. Thorbecke (2013) and Ravallion (2012) also have similar lines of thought on the overall development, especially of Africa. Aware of the fact that initial conditions matter for human development (particularly when one looks at the stock/levels), we assume the change in human development levels to be represented by:
(8)
where HD is a vector of key elements of human development. In our exercise this comprises of health and educational outcomes as well as other societal/household and firm characteristics that affect the human capital during his/her childhood or adulthood. is the deviation of initial growth (income in the case of individuals) from the mean.
THDR 2014: Background Paper No. 4, ESRF Discussion Paper 58 | 9
4.1 Empirical methods
We discuss in detail our strategy for estimating the relationship of growth on human development. Our approach for estimating the relationship of human development on economic growth is analogous. There are two key challenges in identifying the effect of
economic growth on human development. First, economic growth is by nature a macroeconomic phenomenon, affecting the entire country and not allowing for a natural comparison group to contrast against those subject to fluctuations in growth. Second, economic growth is identified by changes over time; as such, there is a range of time-varying confounders (e.g., other macro shocks) that are difficult to disentangle.
Our strategy for dealing with the first issue is to construct our own region-level proxies of economic growth, l
rt, and to include region fixed effects in our empirical specification. For our region-level
growth proxies, we aggregate repeated cross-sectional individual or household measures of economic activity (l
irt, e.g., does anyone in the household have a bank account?) up to the region
level by survey round, lrt. We discuss our region-level proxies in greater detail in the next section.
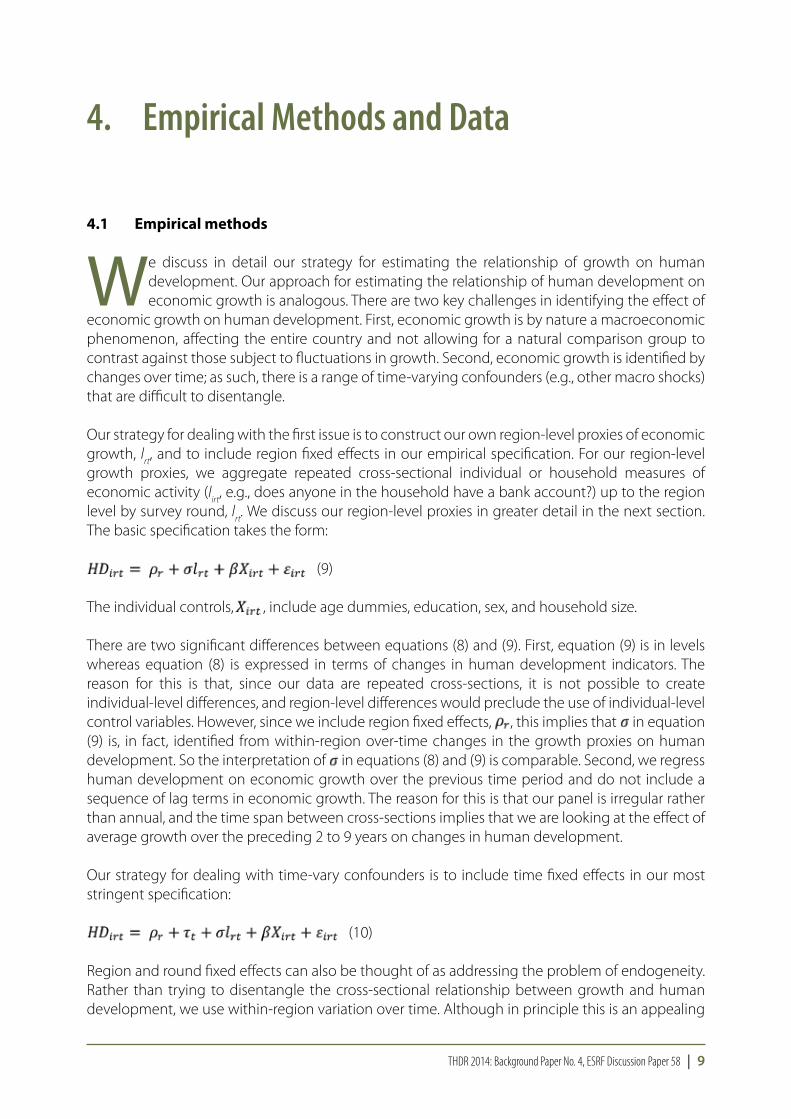
The basic specification takes the form:
(9)
The individual controls, , include age dummies, education, sex, and household size.
There are two significant differences between equations (8) and (9). First, equation (9) is in levels whereas equation (8) is expressed in terms of changes in human development indicators. The reason for this is that, since our data are repeated cross-sections, it is not possible to create individual-level differences, and region-level differences would preclude the use of individual-level control variables. However, since we include region fixed effects, , this implies that in equation (9) is, in fact, identified from within-region over-time changes in the growth proxies on human development. So the interpretation of in equations (8) and (9) is comparable. Second, we regress human development on economic growth over the previous time period and do not include a sequence of lag terms in economic growth. The reason for this is that our panel is irregular rather than annual, and the time span between cross-sections implies that we are looking at the effect of average growth over the preceding 2 to 9 years on changes in human development.
Our strategy for dealing with time-vary confounders is to include time fixed effects in our most stringent specification:
(10)
Region and round fixed effects can also be thought of as addressing the problem of endogeneity. Rather than trying to disentangle the cross-sectional relationship between growth and human development, we use within-region variation over time. Although in principle this is an appealing
4. Empirical Methods and Data

10 | THDR 2014: Background Paper No. 4, ESRF Discussion Paper 58
specification, the inclusion of time fixed effects is very demanding on the data: it requires sufficient between-region variation in the growth proxies to identify the effect within year. Thus, we will present estimates of both equations (9) and (10).
4.2 Data sets
We utilize our estimation method on two distinct datasets from three different surveys. The first dataset consists of data gathered from over 211,673 individuals for the time frame 1991-2011. This data draws from five rounds of two large-scale surveys conducted in Tanzania. The first survey is the Tanzania Household Budget Survey (HBS), in rounds 1991, 2000, and 2007. The second survey is the Tanzania National Panel Survey (TZNPS), in rounds 2009 and 2011. The Tanzania National Bureau of Statistics (NBS) implemented both surveys. Although the TZNPS uses the recall method to collect data and the HBS used diaries, there is substantial overlap in subject matter and specific questions between these surveys.1 Both surveys consistently cover 20 districts of Mainland Tanzania.2The second dataset consists of data gathered from over 169,901 individualindividual-level survey responses for the time frame 1991-2010. This data draws from five rounds of the Tanzania Demographic and Health Survey (TDHS). This survey is also implemented by the NBS, and is available through the worldwide MEASURE DHS program sponsored by USAID. The survey rounds were conducted in 1991, 1996, 1999, 2004 and 2010. All rounds consistently cover 20 districts of Mainland Tanzania. This survey is more focused on health outcomes.
For both datasets (HBS-TZNPS, and DHS) we stack each cross-section to form a region-by-round pseudo-panel. Thus, while we don’t observe individuals across rounds, we do observe regions across rounds, allowing us to identify the average relationship between human development and growth within regions using between-round variation.
4.3 Human Development outcome measures
While different surveys and different survey rounds consistently solicit human development information, there is a limited selection of identical human development questions within each dataset. We focus on proxy measures for human development in three spheres: health, food security, and education. We only include questions asked identically over 2 survey rounds or more for each of the HBS-TZNPS dataset and the TDHS dataset. When a question is missing in a round, that round is excluded from the analysis.
For health, we use biometrics as outcomes from the DHS. In the analysis of the HBS-TZNPS dataset, we additionally use an indicator for individuals who consulted a health provider in the past 4 weeks. For food security, from the HBS-TZNPS, we use an indicator for a household whose members have had to eat fewer meals than usual over the past year and the number of meals per day. For education, from the HBS-TZNPS, we use an indicator for school enrollment for a sample of children of school age. One important qualification to the use of enrollment as a measure for human development is that it does not capture variation in school quality. As a result, from the HBS, we also use literacy as a less informative but more reliable measure of human capital.
An overall caveat to these measures is that they only imperfectly capture qualitative dimensions of 1 We rely on time fixed effects to control for between-round differences due to the method of data gathering.2 In Mainland Tanzania, the HBS rounds include 181,093 individual-level survey responses. The NPS rounds include 30,580
individual-level survey responses. We disregard 8,122 individual-level survey responses in regions that are not consistently covered, for example Zanzibar.
THDR 2014: Background Paper No. 4, ESRF Discussion Paper 58 | 11
human development. As noted, this includes education but it could also be taken to include health and nutrition. To the extent that variation in quality is correlated with region or trends over time, our empirical strategy (region and time fixed effects) will control for this. However, beyond this, given the nationally representative data sets we use, there is little else we can do directly to address this concern. Nonetheless, literacy partially captures the quality aspects of education, which could also be reflected in a positive relationship between education and growth.
4.4 Economic activity outcome measures
Similarly, only a few economic activity indicators are available consistently across rounds and surveys. We use economic activity indicators that are available over at least 3 rounds each. When an indicator is missing in a round, that round is excluded from the analysis. In the analysis of both the HBS-TZNPS and TDHS datasets, we use an indicator for access to a bank account. In the analysis of the HBS-TZNPS, additional indicators included are real income per capita, real expenditures per capita, and number of durable goods owned. In the analysis of the HBS-TZNPS, additional indicators include the DHS-produced within-round Wealth Index Quintile and Wealth Index factor score, the count of household access to seven resources (electricity, radio, television, refrigerator, bicycle, motorcycle and car), and the cross-round principal component analysis (PCA) index of the access to these resources. As expected, the PCA index up-weights access to rare resources such as the television, and down-weights access to common resources such as a bicycle.
While access to a bank account does not directly increase household purchasing power, financial access is associated directly with the ability to save, self-insure, and smooth consumption expenditure, in addition to perhaps offering a source of credit, all of which plausibly feed into human development.
4.5 controls and Interactions
We use a parsimonious set of control variables. Over the 20-year time horizon of study, during which Tanzania has seen significant growth in both GDP and human development, few of the variables consistently available across all rounds could be viewed as exogenous to Tanzania’s development. For example, household wealth would typically be a useful control for unobservables at the household level, but in our analysis must be viewed as potentially endogenous. At the individual level, we control for gender, age, and highest level of education. At the household level, we control for household size and urban or rural household. We include region fixed effects in all specifications. In some specifications we additionally include round fixed effects. These controls do not vary by analysis. In additional specifications, we allow our effects of interest to vary by gender and an indicator for above-median income (HBS-TZNPS) or the asset type index (TDHS).
4.6 Summary Statistics
Summary statistics are presented in Tables 2a and 2b. In the HBS-TZNPS, the average age of the sample is 22.5 years, with a roughly even male-female split. The typical household is large (more than seven persons) and rural (0.34 urban). The average level of educational attainment is 7 years, with literacy for children almost 67 percent. The time period spanned by our data recorded positive growth for most of our proxies: income per capita grew at 1.5 per cent per year. Perhaps the most impressive proxy of growth is financial access: the proportion of households with a bank account grew about 5 percentage points between rounds. The number of durables grew slowly by about

12 | THDR 2014: Background Paper No. 4, ESRF Discussion Paper 58
0.02, relative to a mean of 10.6 durables. Finally, land owned grew slightly by 0.012 acres relative to a mean of 0.55 acres. In Table 2b, we see that the profile of the sample is similar: average age of 22.2, a roughly even male-female split, 22 percent urban, and an average household size of 7.1.
In Figures 1 and 2, we chart our economic activity proxies, from the HBS-TZNPS and TDHS respectively, on the national level and compare them to officially published GDP and GNI per capita over the years studied. Most of our proxies move in tandem with GDP and GNI over most years.

THDR 2014: Background Paper No. 4, ESRF Discussion Paper 58 | 13
5.1 From economic growth to human development
In Table 3 we present results for the effect of growth on whether or not an individual has visited a healthcare provider in the last four weeks. Each pair of columns examines the effect of a different growth proxy (an indicator for having a bank account, household income per capita,
household expenditure per capita, the number of durables, and land ownership), with the first column controlling for region fixed effects and the second column also controlling for round fixed effects. Subsequent tables will be set up in a similar format. This and subsequent tables present two possible scalings of the coefficients in the notes below each column: the impact of a one standard deviation increase in the right-hand-side growth variable (i.e., the estimated coefficient x one standard deviation of the proxy) as a percentage of the standard deviation of the left-hand-side variable and the impact at the mean of the right-hand-size growth proxy (i.e., the estimated coefficient x the mean of the proxy) as a percentage of the mean of the left-hand-side variable. For visits to a healthcare provider, we find a positive and statistically significant relationship between access to a bank account and household expenditure per capita and health. A one standard deviation increase in the incidence of bank accounts leads to 7 percent of a standard deviation increase in visits to healthcare providers, and at the means access to a bank account accounts for 18 percent of consultations with healthcare providers. The magnitudes are somewhat larger for expenditure per capita: nine percent for a standard deviation increase in expenditure and 34 percent at the mean.
The interpretation of the effect of growth on visits to healthcare providers is ambiguous. For a given level of health, visits to healthcare providers are investments in heath. At the same time, an alternative interpretation is that growth might be leading to worse health and hence increasing visits to healthcare providers. In the Tanzanian context where the majority of the population earns a relatively low income, the former interpretation (i.e. growth influencing visits to healthcare providers) is a more plausible outcome.
Tables 4 and 5 examine the effect of growth on two measures of nutrition: number of meals per day and an indicator for whether the household did not have enough food during the last year. In Table 4, using data from the HBS, we find a robust positive association between proxies of growth and meals consumed per day. For all five growth proxies – the number of assets, the index of assets, the wealth index, the wealth factor, and having a bank account – the relationship is significant even when time fixed effects are included. The magnitude is considerable: a one standard deviation increase in the growth proxy leads to between a 0.16 and 0.33 standard deviation increase in meals per day. At the mean, the biggest impacts come from assets (20 percent) and wealth (27 percent).
In Table 5, we find statistically significant reductions in the incidence of insufficient food with access to a bank account and household assets. The effects are meaningful in magnitude, with one standard deviation increases in bank accounts and the number of durables leading to a 0.37 and 0.26 standard deviation reduction in hunger. It must, however, be noted that these effects cease to
5. The Study Findings
14 | THDR 2014: Background Paper No. 4, ESRF Discussion Paper 58
be statistically significant with the inclusion of time fixed effects in columns (2) and (8) respectively.In Tables 6 and 7 we examine human capital related outcomes: an indicator for literacy and for currently attending school. Given the time horizon of human capital acquisition for these results we focus on the sample of children age 18 or younger. In Table 6, we find that household income per capita is positively and significantly associated with an increase in literacy. The magnitude of this effect is modest, with a one standard deviation increase in each growth proxy leading approximately to a 0.09 standard deviation increase in literacy. Although there are some negative coefficients, these are either not statistically significant at standard levels or fail to remain significant with the inclusion of time fixed effects. In Table 7 there are three positive and significant relationships, with access to a bank account, with income per capita, and with durables associated with increases in school attendance. However, these effects are not statistically significant at standard levels when round fixed effects are included.
In Tables 8, 9, and 10 we examine the impact of growth on biometrics. Given the non-linear physical relationship between and Body Mass Index (BMI), height, and weight, in these specifications we control for a full set of age dummies. For weight, we also control linearly and quadratically for height. In Table 8, we find robust evidence for increases in BMI with growth. For four of five growth proxies, we find a positive and statistically significant relationship, even when round fixed effects are included. The magnitudes range from a one standard deviation increase in the wealth proxy leading to 11 percent to 22 percent of a standard deviation increase in BMI. In Table 9, all five growth proxies are positively and significantly associated with increase in height, although the magnitudes are modest, ranging from 0.06 to 0.16 of a standard deviation increase in height for a one standard deviation increase in the growth proxy. In Table 10, for four of our five growth proxies we find a positive and statistically significant relationship with weight. As with height, the effect is modest in magnitude.
In Table 11 we allow the impact of income growth to vary by whether or not the individual’s household is above median income. We find significant evidence that the relationship between growth and human development is different for the wealthy, as five out of the eight interaction terms tested are statistically significant at the 1% p-value. In these five regressions, effects of interest were even more significant statistically than in the regressions without the interaction terms. Growth drives human development more vigorously for the wealthy for biometrics outcomes and the likelihood of a food shortage. Median and below-median households enjoy regional income growth more for literacy and meals per day outcomes.
In tables 12a and 12b we allow the impact of growth on human development to vary by gender, inspecting all HBS growth proxies in table 12a, and the wealth and asset indices in the TDHS in table 12b. Similarly, we find asymmetries in the translation of regional economic growth to human development growth.
In table 12a, we test the effects of four economic activity proxies on four human development outcomes, with gender interaction terms. Eight out of the sixteen interaction terms tested are statistically significant, concentrated in three outcomes. The impact of growth on food shortages does not seem to vary by gender. In access to healthcare, where half of interaction terms are significant, and in literacy, where all interaction terms are significant, regional growth drives female human development more than male’s. In school attendance, half of the interaction terms are significant. In these regressions, growth only significantly increases attendance for males.
THDR 2014: Background Paper No. 4, ESRF Discussion Paper 58 | 15
In table 12b, we similarly find that growth increases female meals per day. While the gender interactions are statistically significant, they are not large in magnitude. We do not find significant gender interaction effects on biometrics.
5.2 From human development to economic growth
In Tables 13 to 15 we examine the effect of human development indicators on three most robustly significant indicators of economic growth: the incidence of bank accounts, income per capita, and expenditure per capita.
In Table 13a and 13b, we examine the effect of HDI measures on the growth of access to a bank account within the household in the HBS and DHS respectively. In Table 13a, from the HBS, we find a positive association between consulting with a healthcare provider and growth in bank accounts. The effect is significant both with region and round fixed effects. The other human development measures considered in Table 13a are not statistically significant when round fixed effects are included. In Table 13b, from the DHS, we find a statistically significant association between BMI and access to a bank account. The magnitudes are meaningfully large: a one standard deviation increase in BMI is associated with 0.20-0.30 of a standard deviation increase in access to bank accounts. Similarly, a one standard deviation increase in meals per day is associated with a 0.17 of a standard deviation increase in access to bank accounts.
Table 14 examines the effect of human development proxies on expenditure per capita.3 Not enough food is, as expected, negatively associated with expenditure per capita, and meals per day and literacy are both associated with significant increases in expenditure. The magnitudes of these effects are such that a one standard deviation change in these variables leads to between 0.04 and 0.28 standard deviation changes in expenditure per capita.
Finally Table 15 examines the effect of human development indicators on the household wealth index in the DHS data. When statistically significant, the results go in the expected direction, with increased human development associated with higher levels of wealth (hence positive for height, BMI, and currently in school). The magnitudes range from 0.11 of a standard deviation in household wealth from a one standard deviation increase in height percentile to a 0.19 magnitude for BMI.
3 Given missing data on income in some rounds, we are unable to examine the analogous relationship for income.

16 | THDR 2014: Background Paper No. 4, ESRF Discussion Paper 58
The results of the study point to two key conclusions. The first is, there is systematic evidence of a relationship in both directions, with growth enhancing human development and human development feeding into growth. Secondly, while economic growth, in general, is more likely
to be the primary driver of progress in human development indicators in Tanzania, the magnitude of effects of key growth proxies such as per capita income and per capita expenditure on human development outcomes is sobering. The latter points to the limitations of economic growth in having a greater impact on human development outcomes in the current development scenario in Tanzania. Most notable are the limited impact of growth on literacy and access to health care and the inability of incomes and expenditures to have a significant impact on reducing hunger and schooling. The weak link between growth and educational outcomes such as schooling and literacy may be due to limited investments in the sector. Another underlying factor is the weak link between growth and employment generation (as seen by high levels of unemployment and poverty) in the Tanzanian context which limit household level investments in key human development aspects such as health and education.
As discussed earlier, quality of education has been compromised in Tanzania with adverse implications on labor productivity and future growth. The implication is that unless a pragmatic and direct approach to the promotion of human development is adopted, little can be expected from a growth drive in terms of sharing the benefits by all. Ranis et al. (2000) suggests that good economic growth outcomes not accompanied by better human development outcomes may prove to be unsustainable in the long run. Equitable allocation of resources and provision of opportunities for all could also help achieve better human development outcomes.4 Our results also point to the role played by assets, wealth and having a bank account on most critical human development outcomes. All these proxies relate to household savings. Given the majority of Tanzania’s population earn a relatively low income, this might indicate not only that the current rate of economic growth has to be further increased but also made more pro-poor to have agreater impact on human development outcomes.
Our results also indicate relatively modest but significant effects of human development outcomes on growth. Notable human development variables that have significant effects on economic growth are hunger, BMI, having a meal a day and literacy. This also re-affirms that food security and quality of education play key roles in higher economic growth. The very fact that some aspects of human development such as literacy, schooling and food security have significant positive effects on economic growth provide a policy direction in strengthening the bi-directional relationship between growth and human development. For example, in the Tanzanian context, literacy and schooling by themselves are not good enough to push for sustained high growth. The economic transformation that Tanzania is looking forward to requires skilled labor force.
A fundamental requirement for a skilled labor force is quality education that also builds up skills in the school to labor force transition. Seven years of average schooling also imply that transition from primary to secondary levels are also weak further complicating the quality of labor 4 This could be supplemented by institutional efficiency and good governance measures to maximize the returns on limited
resources .
6. Policy implications
THDR 2014: Background Paper No. 4, ESRF Discussion Paper 58 | 17
entering the labor force. This could be addressed by increasing investments in human capital development including improving the quality of education at the primary and secondary levels to begin with. Improved teacher training, curricula development and provision of equipment and teaching materials are among the key areas that need attention. This could be supplemented by skills development through vocational training. As discussed earlier, more open economies and complementary institutions, among other factors, are key to strengthen the link between education and growth. While Tanzania’s economy is open, potential benefits of an open economy policy is not fully realized due to impediments to private sector businesses, a key driver of growth.
A robust private sector could generate strong demand for quality labor. This would generate higher demand for better educational outcomes and hence push for quality education in the long run. The market itself will react to these demands if proper institutional arrangements are in place. These considerations need to be exploited if Tanzania’s socio-economic transformation is to be a meaningful one. Krueger (2000) points out that a country that improves its educational polices is more likely to improve other economic policies as well, that enhances economic growth. On the other hand, food security ensures an energetic labor force, a key consideration for higher labor productivity. Strengthening the linkages between human development variables such as health, education and food security and growth should be a priority in the implementation of the Five Year Development Plan through strategic investments in these areas. The BRN provides a great window of opportunity in this respect.
One important aspect to be noted however, is that even when such critical human development aspects are targeted, the desired outcomes may not be automatic. The literature points to the need for favorable policy environment for positive outcomes in these areas themselves but also in strengthening the relationship. Well-functioning civil institutions, including those that guarantee transparency and accountability, property rights, quality basic services are key considerations for strengthening such links just as the quantity and quality of investments and the choice of technology.
18 | THDR 2014: Background Paper No. 4, ESRF Discussion Paper 58
In this study we made an attempt to explore the relationship between economic growth and human development. The study used data gathered from over 220,717 individuals through five rounds of two large-scale surveys conducted in Tanzania for the time frame 1991-2011.There are
a number of significant relationships that emerge from this exploration of the two-way relationship between growth and human development. We find systematic evidence of a relationship in both directions, with growth enhancing human development and human development feeding into growth.
At the same time, while the overall results do substantiate the idea of a virtuous circle between economic growth and human development, the magnitude of the effects of key growth variables such as per capita income and per capita expenditure is sobering. While economic growth, in general, is more likely to be the primary driver of progress in human development indicators, Tanzania’s economic growth seems to have its own limitations as well as potential in having greater human development outcomes.
The results are not unexpected. While Tanzania’s economy has managed to grow at a fairly high rate, especially during the past 13 years, its impact on broader human development in areas such as poverty and access to basic services is limited. Economic growth in Tanzania does not guarantee advances in broader human development. From a policy perspective, the results points to the need for a pragmatic approach to promote human development while also stimulating growth. The new policy instruments such as the Five Year Development Plan (FYDP) and approaches such as the Big Results Now (BRN) could and should be geared to not only advancing growth but also promoting human development which could strengthen the growth effects of policies as well as help sustain high growth.
7. Summary and Conclusion
THDR 2014: Background Paper No. 4, ESRF Discussion Paper 58 | 19
Akram, N., I. U. H. Padda and M. Khan (2008). “The Long Term Impact of Health on Economic Growth in Pakistan”, The Pakistan Development Review, 47 (4), 487-500.
Amiria, A., and U. Gerdtham (2013). “Impact of Maternal and Child Health on Economic Growth: New Evidence Based on Granger Causality and DEA Analysis”, Study Commissioned by the Partnership for Maternal, Newborn and Child Health (PMNCH).
Ashraf, Q. H., A. Lester and D. N. Weil (2008). “When Does Improving Health Raise GDP?”, in D. Acemoglu, K. Rogoff and M. Woodford (eds), NBER Macroeconomics Annual 2008, Vol 23. Chicago, IL: University of Chicago Press, 157-204.
Ashraf, Q. H., D. N. Weil and J. Wilde (2012). “The Effects of Fertility Reduction on Economic Growth. Mimeo.
Baldacci, E., B. Clements, S. Gupta and Q. Cui (2008). “Social Spending, Human Capital, and Growth in Developing Countries,” World Development, 36, 1317-1341.
Baltagi, B.H. and F. Moscone (2010). “Health Care Expenditure and Income in the OECD Reconsidered: Evidence from Panel Data. Economic Modelling, 27:804-811.
Cole, M.A., and E. Neumayer (2006). “The Impact of Poor Health on Total Factor Productivity”, Journal of Development Studies, 42:918-938.
Coulombe, S., and J. F. Tremblay (2006). “Literacy and Growth. Topics in Macroeconomics.6(2).Deraniyagala, S. (1995).“Technical Change and Effieincy in Sri Lanka’s Manufacturing Industry”, Ph.D Dissertation, University of Oxford, UK.
Easterly, W. (2001). “The Elusive Quest for Growth”, Cambridge, MA: The MIT Press 2001.
Eliot, A. D.T. Jamison and A Hanushek (2006). “The Effects of Education Quality on Income Growth and Mortality Decline”, Memio.
Elmi, Z. M., and S. Sadeghi (2012). “Health Care Expenditure and Economic Growth in Developing Countries: Panel Co-integration and Causality”, Middle-East Journal of Scientific Research, 12(1):88-91.
Fogel, R.W. (1997). “New Findings on Secular Trends in Nutrition and Mortality: Some Implications for Population Theory”, in The Handbook of Population and Family Economics, M. Rosenzweig and O. Stark (eds) Vol 1A, North Holland, Amsterdam, 433-481.
Hanushek, E. and D. Kimko (2000). “Schooling, Labor Force Quality and the Growth of Nations”, American Economic Review, 90, 1184-1208.
References

20 | THDR 2014: Background Paper No. 4, ESRF Discussion Paper 58
Hanushek, E.A. and L. Wößmann (2010). “Education and Economic Growth”, in P. Peterson, E Baker and B. McGaw (eds), International Encyclopedia of Education, 2: 245-252. Oxford: Elsevier.
Hanushek, E. and L. Wößmann (2008). “The Role of Cognitive Skills in Economic Development”, Journal of Economic Literature, 46, 607-668.
Immink, M., and F. Viterri (1981). “Energy Intake and Productivity of Guatemalan Sugar Cane Cutters: An Empirical Test of the Efficiency Wage Hypothesis”, Journal of Development Economics, 9.
Islam, M.R. (2010). “Human Capital Composition, Proximity to Technology Frontier and Productivity Growth”, Working paper No 23-10, Monash University, Victoria.
Jamison, E. A., D. T. Jamison, and E.A. Hanushek (2007). “The Effects of Education Quality on Mortality Decline and Income Growth”, Journal of Economic Literature, 46(3):607-668.
Jamison, D.T., L. J. Lau and J. Wang (2005). “Health’s Contribution to Economic Growth in an Environment of Partially Endogenous Technical Progress”, in G. Lopez-Casasnovas, B. Rivera and L. Currais (eds), Health and Economic Growth: Findings and Policy Implications, Cambridge, MA: MIT Press 2005, 67-91.
Krueger, A. and M. Lindahl (2001). “Education and Growth: Why and for Whom?”,Journal of Economic Literature, 39, 1101-1136.
Lawal, N.A. and T.I. Wahab (2011). “Education and Economic Growth: The Nigerian Experience”, Journal of Emerging Trends in Economics and Management Sciences, 2(3):225-231.
Lee, J. and R. Barro (2001). “Schooling Quality in a Cross Section of Countries”, Economica, 68, 465-488.
Lucas, R.E. (1988). “On the Mechanics of Economic Development”, Journal of Monetary Economics, 22.
Mankiw, N. G., D. Romer and D. N. Weil (1992). “a Contribution to the Empirics of Economic Growth”, Quarterly Journal of Economics, CVII:407-437.
Mayer-Foulkes, D. (2001a). “The Long-Term Impact of Health on Economic Growth in Mexico, 1950-1995”, Journal of International Development, 13(1), pp. 123-126.
----------- (2001b). “The Long-Term Impact of Health on Economic Growth in Latin America”, World Development, 29(6), pp. 1025-1033.
Nelson, R. and E. Phelps (1996). “Investments in Humans, Technological Diffusion and Economic Growth”.American Economic Review, 56(1) pp. 69-75.
OECD. (2012). “How does Education affect the Economy?”, in Education at a Glance 2012: Highlights, OECD Publishing.
Oketch, M.O. (2006). “Determinants of Human Capital Formation and Economic Growth of African

THDR 2014: Background Paper No. 4, ESRF Discussion Paper 58 | 21
Countries”, Economics of Education Review, 25(5), 554-564.
Pritchett, L. (2006). “Does Learning to Add Up Add Up? The Returns to Schooling in Aggregate Data”, in Handbook of Economics of Education-Vol 1, E.A. Hanushek and F. Welch (eds), Amsterdam: Elsevier.
Rajkumar, A.S., and V. Swaroop (2002). “Public Spending and Outcomes: Does Governance Matter?, World Bank Working paper No 2840.
Ranis, G., and F Stewart (2007). “Dynamic Links Between the Economy and Human Development”, in Policy Matters: Economic and Social Policies to Sustain Equitable Development, J.A. Ocampo, J.K. Sunderam and S. Khan (eds), United Nations 2007, New York.
Ranis, G., F. Stewart and E. Samman (2008). “Country Patterns of Behavior on Broader Dimensions of Human Development”, in Arguments for a Better World: Essays in Honor of Amartya Sen, Vol II, Society, Institutions, and Development, R. Kanbur and B. Kaushik (eds), Oxford University Press, 2008. 119-138.
------------------ (2006). “Human Development: Beyond the Human Development Index”, Journal of Human Development, 7(3): 323-358.
Ravallion, M. (2012). “Why Don’t We See Poverty Convergence?”,American Economic Review, 102(1):504-523.
Reza, A., and S. Valeecha (2012). “Impact of Education on Economic Growth of Pakistan-Econometric Analysis”, IOSR Journal of Business and Management, 5(4): 20-27.Romer, P. (1990).“Endogenous Technological Change”.Journal of Political Economy, 98(5), pp. 129-50.
Sen, A. (2000). “A Decade of Human Development”, Journal of Human Development, 1(1).Strauss, J. (1986). “Does Better Nutrition Raise Farm Productivity?”, The Journal of Political Economy, 94(2):297-320.
Strauss, J., and D. Thomas (1998). “Nutrition and Economic Development”, Journal of Economic Literature, 36(2):766-817.
Tang, C.F. (2011). “Multivariate Granger Causality and the Dynamic Relationship between Health Care Spending, Income and Related Price of Health Care in Malaysia”, Hitotsubashi Journal of Economics, 52:199-214.
Thorbecke, E. (2013). “The Interrelationship Linking Growth, Inequality and Poverty in Sub-Saharan Africa, Journal of African Economies, 22(suppl 1):15-48.
Tsamadias, C., and P. Prontzas (2012). “The Effects of Education on Economic Growth in Greece over the 1960-2000 Period”, Education Economics, 20(5):522-537.
UNDP.(2013). Human Development Report 2013, United Nations Development Programme, New York.

22 | THDR 2014: Background Paper No. 4, ESRF Discussion Paper 58
---------(1996). Human Development Report 1996, United Nations Development Programme, New York.
Vandenbussche, J., P. Aghion and C. Meghir (2006). “Growth, distance to frontier and composition of human capital”, Journal of Economic Growth 11(2), 97-127.
Well, D.N. (2007). “Accounting for the Effects of Health on Economic Growth”, The Quarterly Journal of Economics, 12(3):1265-1306.

THDR 2014: Background Paper No. 4, ESRF Discussion Paper 58 | 23

24 | THDR 2014: Background Paper No. 4, ESRF Discussion Paper 58