Embed Size (px)
Citation preview

THE NEW ZEALAND
WHEAT AND FLOUR INDUSTRY:
MARKET STRUCTURE AND POLICY IMPLICATIONS
B. W. Bor rell
A. C. Zwart
Research Report No. 124
Agric ultural Economic s Re search Unit Lincoln College
April 1982
ISSN 0069-3790

THE AGRICULTURAL ECONOMICS RESEARCH UNIT Lincoln College, Canterbury, N.Z.
The Agricultural Economics Research Unit (AERU) was established in 1962 at Lincoln College, University of Canterbury. The aims of the Unit are to assist by way of economic research those groups involved in the many aspects of New Zealand primary production
and product processing, distribution and marketing. Major sources of funding have been annual grants from the Department of Scientific
and Industrial Research and the College. However, a substantial proportion of the Unit's budget is derived from specific project research under contract to government
departments, producer boards, farmer organisations and to commercial and industrial groups.
The Unit is involved in a wide spectrum of agricultural economics and management research, with some concentration on production economics, natural resource economics,
marketing, processing and transportation. The results of research projects are published as Research Reports or Discussion Papers. (For further information
regarding the Unit's publications see the inside back cover). The Unit also sponsors periodic conferences and seminars on topics of regional and national interest, often in
conjunction with other organisations. The AERU, the Department of Agricultural Economics and Marketing, and the
Department of Farm Management and Rural Valuation maintain a close working relationship on research and associated matters. The Unit is situated on the 3rd floor of
the Burns Wing at the College.
UNIT POLICY COMMITTEE: 1982
P.D. Chudleigh, B.Sc. (Hons), Ph.D. Professor J.B. Dent, B.Sc., M.Agr.Sc., Ph.D.
(Farm Management and Rural Valuation) Professor B.J. Ross, M.Agr.Sc.
(Agricultural Economics and Marketing)
UNIT RESEARCH STAFF: 1982
Director P.D. Chudleigh, B.Sc. (Hons), Ph.D.
Research Fellow in Agricultural Policy J.G. Pryde, O.B.E., M.A., F.N.Z.I.M.
Senior Research Economists
K.L. Leathers, B.S., M.S., Ph.D. RD. Lough, B.Agr.Sc.
Research Economists
A.C. Beck, B.Sc.Agr., M.Ec. J.D. Gough, B.Sc., M.Com.
RG. Moffitt, B.Hort.Sc., N.D.H. M.M. Rich, Dip. V.F.M., B.Agr.Com., M.Ec.
R L. Sheppard, B.Agr.Sc. (Hons), B.B.S.
Assistant Research Economists J. M. Biggs, B.Com.
G. Greer, B.Agr.Sc. (Hons) M. T. Laing B.Com. (Ag.) P.J. McCartin, B.Agr.Com. C. R. McLeod, B.Agr.Sc.
Post Graduate Fellows N. Blyth, B.Se. (Hons)
C.K.G. Darkey, B.Sc., M.Sc. M. Kagatsume, B.Sc., M.Sc.
Secretary
J.A. Rennie Dip.I.P.(U.N.E.)
CONTENTS
PREFACE
ACKNOWLEDGEMENTS
SUMMARY AND CONCLUSIONS
CHAPTER 1 INTRODUCTION
CHAPTER 2 OUTLINE OF THE INDUSTR Y
2.1 Introduction
2.2 Basic Functions
2.3 The Basic Problem
2.4 Structure of the Industry
2.5 Conduct of the Industry
2.5.1 Polic y Objective s in the New Zealand Wheat and Flour Industry
2.5.2 PolicyInstruments The Wheat Price
Page
(i i i)
1
5
7
7
7
8
9
11
11 13 13
Flour Milling Allocations 14 Transportation 16
2.6 Summary
CHAPTER 3 METHODOLOGY - THE TRANSHIPMENT MODEL
3.1 Introduction
3.2 Selection of the Type of Model
3.2.1 Algebraic Stateme nt of the Problem
3.3 The Transhipment Problem
3.4 Iterative Solution Procedures and Heuristic Search Techniques
3.5 Summary and ConclusLons
18
21
21
21
23
29
36
38

CHAPTER 4 THE MODEL - THE PROGRAMMING MATRIX,DATA AND ASSUMPTIONS
4. I Introduction
4.2 Regional Demarcations
4.3 Data
Page
39
39
39
40
4.3.1 Regional Supplie s 40 4.3.2 Regional Final Demands 41 4.3.3 MLlling and Shipping Capacitie s 42 4.3.4 Marketing Costs 42
(i) Transport Costs 43 (ii) Milling Costs 50
(iii) Port Storage and Handling Costs 56
(iv) Shipping Costs 59
4.4 Summary and Conclusions
CHAPTER 5 EMPIRICAL RESULTS
5.1 Introduction
5.2 First Results - the Capacitated Problem
61
63
63
63
5.2.1 Validation - Wheat Flows 65 5.2.2 Validation and Marketing Costs 68 5.2.3 Consumer Welfare Implications 70 5.2.4 Producer Welfare Implications 73 5.2.5 Opportunity Costs of Existing
Market Constraints 76
5.3 Inc reased Bulk Shipping Capacity 78
5.3.1 Solution Numbe r Two 79 5.3.2 Regional Wheat Price
Diffe rential s 82 5.3.3 Opportunity Cost of Import
Controls 83 5.3.4 Opportunity Cost of Milling
Quotas 85
5.4 Rationalisation and Milling Capacities -Solution Number Three 87
5.4.1 Regional Flour Price D iHe re ntial s
5.4.2 Regional Wheat Price Diffe rential s
90
92

Page
5.5 Rationalisation and Scale Economies of Milling 94
5.5.1 Number of Mills in Each Region 95 5. 5.2 Solution Number Four 96 5.5.3 Regional Flour Price
Diffe re ntial s 99 5.5.4 Solution Number Five -
Auckland Milling Forced Out 101 5.5.5 Solution Number Six - Mount
Mau!1ganui Milling Forced Out 104 5.5.6 Solution Number Seven -
Increased Milling at Wellington 106 5.5.7 Solution Number Eight -
Inve rcar gill Mill Forced Out 107
5.6 Summary and Conclusions 108
CHAPTER 6 LIMITATIONS, IMPLICATIONS AND EXTENSIONS OF THE MODEL 113
113
113
REFERENCES
APPENDIX 1
APPENDIX 2
APPENDIX 3
6.1 Introduction
6.2 Limitations of the Model
6.2.1 Assumptions About Wheat Supply 113 6.2.2 As sumptions About Final Demand 114 6.2.3 Importation of Aust ralian Flour 115 6.2.4 Coastal Shipments of Flour 116 6.2.5 The Dynamic s of Shipping and
Storage 116 6.2.6 Uncertainties of the Data 117
6.3 Implications of Model Re sults 118
121
127
129
131


LIST OF TABLES
Table Page
3.1 Programming Tableall Mlllti - staged Transhipment Problem of the Wheat and FlOllr Indllstry 31
4.1 Cost Matri:ces of the Programming Tableall 44
4.2 Ave rage Transport Cost from Farms to South Island Mills Used in Matrix A of Table 4.1 46
4.3 Average Transport Costs from Farms to SOllth Island Ports Used in Matrix B of Table 4.1 47<
4.4 Railage from South Island Farms to North Island Mi.lls Used in MatrLx C of Table 4.1 48
4.5 Costs of Transporting Wheat to North Island by Container Ship Used in Matrix E of Table 4.1 48
4.6 North Island Port to Mlll Transport Costs Used in Matrix G of Table 4.1 51
4.7 Transport Costs from South Island Mills to Final Demand Regions U sed in Matrix H of Table 4.1 51
4.8 North Island Mill to Final Demand Transport Costs Used in Matrix I of Table 4.1 52
5.1 Solution to the Capacitated Problem 66
5.2 Regional Flour Price Differentials and Consumer Cross-Subsidisation 71
5.3 Regional Wheat Price Differentials and Producer Cross-Subsidisation 74
5.4 Marginal Opportunity Costs of Constraints 76
5.5 Solution Number Two 80
5.6 Volumes of Wheat Handled at Discharge and Receival Ports 81
5.7 Regional Wheat Price Diffe rentials (2) 82
5.8 Regional Wheat Price Differentials Relative to Sydney 83
5.9 Relative Opportuni:ty Costs of Mi:.lling Quotas (2) 86
5.10 Solution Number Three 89
5.11 Regional Flour Price Differentials 91

Table
5. 12
5. 13
5.14
5. 1 5
5. 16
S. 17
5. 18
5.19
Regional V/heat Price Differ·:!nti.a1s
Solution Numbe r Four
Tonnes of Wheat Handled at Ports
Regional Flour Pr:ce Differentials (4)
Marketing Cost Comparison - Solution Fc)i1r / Solution Five
Regional Flour Price Differentials
Marketing Cost Compari: so 11. - Soluti.on Five / Solution Six
Regional Flour Price Differentials (6)
Page
93
97
98
100
102
103
105
105

Figure
3. 1
4.1
5. 1
LIST OF FIGURES
Diagrammatic Representation of Transhipment Model
Shape of Representative Scale for Milling
Maximum Size of Mill According to Shape of LRAC Curve
Page
22
55
96


PREFACE
This report is an abridged version of a masterate thesis
undertaken by Mr B. Borrell under the supervision of Dr A. Zwart
wi thin the Department of Agricultural Economic s and Marketing
at Lincoln College.
The subject of physical distribution of wheat and flour within
New Zealand addressed by the authors of this report should be of
considerable interest to wheatgrowers, participants in the market
ing chain, and New Zealand flour consumers. In that cost reductions
seem likely by a relaxation of controls on the distribution system,
it is hoped that this report will attract feedback to enable further
constructive and more meaningful use of the model that has been
evolved.
(i)
P. D. Chudleigh Dire ctor


ACKNOWLED GEMENTS
The author s would like to thank the Re searc h Di vi sio n of
the Ministry of Transport for financial as sistance in car rying out
the study.
(i ii)


SUMMAR Y AND CONCLUSIONS
The basic aim of thi s study has been to seek a more ration
alised market structure for the New Zealand wheat and flour industry.
Cur rent polic y constraints are seen to insulate the market from its
underlying economic forces. These forces include the economies
of scale present in the milling and transport sectors of the market
and inte r- regional competition. The polic y constraints relate to
the polic y instruments of Government, namel y milling quotas,
standardised wheat and flour pricing, import controls, and fixed
inter - regional trade flows.
The fact that polic y constraints have been insulating the mar
ket from its true economic forces for a long period has prevented
structural adjustments within the market. Not surprisingly the
industryfs problem is seen as one of structural realignment. The
task of the study has been to seek the location, number and size of
mills, the inte r- regional trade flow s for wheat and flour including
the selection of appropri.ate modes of transport, and regional price
differentials that more accurately acknowledge and align the market f s
structure with the economic forces of the market. The results of
the model used to analyse this problem indicate that substantial
improvements in the marketfs performance could be achieved.
In chapter two the market structure of the existing industry
was depicted as di.spersed and fragmented. A market structure
resembling that of the existing industry was represented using a
capacitated transhipment model. In this model quantity constraints
were used to represent milling quotas and other quantitative restric
tions of the existing industry. The solution of this model provided
estimate s of the opportunity costs imposed by these constraints.
This information indicated that the value of short term marginal
changes that could be achieved by allowing extra bulk shipments
1 •
to the North Island, and by all owi.ng greater milling at North Island
mills would be significant.
To measure the values of possible long term structural changes
it was necessary to remove constrai.nts from the model and take
account of potential economies of scale. When transportation con
straints were dropped and the economies of scale of shipping and
port handling we re acknowledged, the model showed that $1.87 :r:n. could be saved. This represents a saving of 10 per cent over cur
rent costs of the industry and resulted from transporting all wheat
to the North Island by bulk ship. This contrasts with the existing
industry where four modes of transport are used to transport wheat
to the North Island.
When milling constraints were dropped, further centralisation
of the shipping operation became apparent. The solution to this
problem showed that no flour should be transported from the South
to the North Island, but instead that extra wheat should be trans
ported to the North Island by bulk ship and subsequently be milled
to flour at current mill locations of the North Island. This was
shown to result in a further cost reduction of $2.26 m. which is
a further 12 per cent saving over marketing costs of the current
industry.
When the scale economies of milling were represented in the
model, it was shown that further centralising the milling operations
of the industry would lead to even greater cost reductions. The
best solution to this problem showed it was only necessary to have
five mills in New Zealand compared to the current number of 21.
These were shown to be located at Mount Maunganui, Wellington,
Christchurch, Dunedin and Invercargill. This resulted in an
additional cost reduction of $1.84 m., an extra 9 per cent saving
over marketing costs of the current industry.

3.
The total savings resulting from rationalising and centralising
the transport, processing and handling operations of the industry
represented, in full, a 31 per cent saving over current marketing
costs. It was further shown that additional savings might be achieved
if full rationalisation of the sources of supply for North Island wheat
could be made. Examples of these savings were shown by allowing
imports of Australian wheat. Such savings would result in a market
where competitive spatial equilibrium prices and quantities applied.
However, as production costs and therefore realistic supply functions
were not included in the model, the fu,ll impact resulting from spatial
equilibrium prices could not be determined. For example, it was not
possible to estimate what savings in transfer costs might arise from
rationalisi.ng the quantities of wheat grown within different regions of
New Zealand. In theoretical terms this would further decrease costs
by also centralising wheat production in New Zealand.
The increased performance shown to result from the removal
of policy constraints of the model does not necessarily imply creat
ing a free market wheat and flour industry. The results establish
market structure norms for the industry; and they do not imply any
specific conduct for the industry. They do, however, raise some
important questions concerning what market conduct might be required
to achieve the norms suggested by the model. It is in this realm that
the re sults rai se implications fo r polic y maker sconce rned with New
Zealand I s wheat and flour marketing policy. In an industry where
there is a single authority responsible for marketing, the potential
for directing the industry towards a particular structure exists as
the central authority has the power to implement and co-ordinate the
findings of the market model.


CHAPTER 1
INTRODUCTION
Often the markets of an economy fail to achieve the objectives
of economic policy. As a result, Government policy makers may
become involved in the resource allocation decisions of certain
industries. The expedience of policy makers is to use a variety of
intervention devices or policy control instruments in an attempt to
better achieve economic polic y objective s. However, the economic
implications of such controls on the organisation of an industry can
be complex, as can be the economic choice between the many feasible
alternative ways of organising an industry.
The New Zealand wheat and flour industry is one industry which
has attracted considerable statutory intervention. Government involve
ment in the industry is aimed at reducing the inter-year variability of
wheat supplied to the market and to ensure "orderly" marketing of
the industry's product.
Many of the controls used by Government in the wheat and flour
industry have been in effect since before the inception of the New
Zealand Wheat Board in 1965. Es sentially, the se control shave
imposed rigidities on the industry. Although the wheat and flour
industry is dependent on other markets of the economy which have
unde rgone enormous technological and economic change, the rigidi
ties of policy have only permitted relatively small changes in the
structure and conduct of the wheat and flour industry. For this
reason, long run organisation changes necessary to maintain the
marketing efficiency of the industry may not have been able to occur.
In recent year s, marketing co sts as sociated with as sembly,
storage, milling and distribution of wheat and flour (the primary
5.

6.
areas of Government involvement) have been significant, totalling
approximately $20 m. in the year ended 31 January 1979. Because
of the significance of these costs and because of the effects of the
current policy controls, a study of the industry's marketing efficiency
is considered a worthwhile area of study. Accordi.ngly, the primary
objective of this study is to examine the efficiency of the market
organisation in the New Zealand wheat and flour industry.
To achieve this objective a market model is used firstly to
desc ribe the existing industry and, secondly, to study the effects
of reducing some of the policy controls. As the current Government
controls largely effect the spatial organisation of the industry, the
market model used in the study is designed to examine problems
concerning transportation, inter-regional trade and facility (process
ing plant) locations. The model uses the transportation algorithm
and heuristic procedures discussed in other reports published by
the Agricultural Economic s Re search Unit (Higham et aI, 1972 and
Mc earthy et aI, 1972).
The study includes an examination of the wheat and flour industry
in New Zealand as it extends from farm gate to baker or retailer.
In the following chapter the basic functions and problems of the
industry are discussed. In chapters 3 and 4 a description of the
model used to represent the industry's problems is detailed. The
results of this model are in chapter 5. This is followed with a final
chapter discussing the limitations and policy implications arising
from the re sults.
CHAPTER 2
OUTLINE OF THE INDUSTRY
201 Introduction
The purpose of this chapter is to describe the basic functions
and problems of the industry. This requires a brief examination of
the basic structure and conduct of the New Zealand wheat and flour I
market.
2.2 Basic Functions
The primary function of the industry is to meet New Zealander s I
inelastic demand for approximately 220,000 tonnes of flour per annum
(Borrell, 1980, p. 8-9). This demand is regionalised in accordance
with population density, and is therefore predominantly in the North
Island with a large proportion of that demand in the Auckland and
Hamilton regions. This pattern of demand must be satisfied from
dispersed South Island supply regions or from imported ALlstralian
wheat. Conside ring the bulky nature of the products, wheat and flour,
the logistical problem of the industry is a large one. Voluminous
products must be transported considerable distances to the market
place. En route these products may require transhipment several
time s; all wheat must be transhipped in the proce s s of milling wheat
to flour; transhipment may also be required when different modes of
transport must be used over long journeys, and other transhipment
is necessary when either wheat or flour must be stored to bridge the
gap between harvest time and the period when flour is required by
consumers up to 10 months later.
I For a more detailed examination see Borrell (980) chapters 2 and 3.
70

8.
A secondary function of the wheat and flour industry is to
supply inputs to the stockfood industry. This industry provides a
market for wheat of inferior quality that is graded as unsuitable for
milling. It also provides a market for the by-products of flour mill
ing, namely bran and pollard. In this way the stockfood industry
absorbs most surplus wheat products. Only rarely has New Zealand
expo rted any wheat.
The basic problem involved in carrying out the functions of the
industry is an economic 0 ne of satisfying the demand for flour at
least cost.
2.3 The Basic Problem
On farm costs, storage costs, transport costs, processing
costs, and product prices are all market signals which can be used
to guide the agricultural industry in decisions concerning industrial
organisation. In theory, only where these guides lack distortions
and are readily available and understood by entrepreneurs, will they
relay correct demands to producers within the wheat and flour
industry, as well as transmitting supply conditions to consumers.
Under these circumstances the market mechanism will operate to
co-ordinate internally the allocation of resources. This is a com
peti ti ve market situation whe re the conduc t of the industry will be
determined by the forces of supply and demand; prices and profits
will be at their optimum and output levels and distributional patterns
will be tho se which enable the market to achieve a Pareto optimum.
Unfortunately market imperfections are common characteristics
of agricultural markets and may require some form of external inter
vention to be corrected. It is perhaps for this reason that the New
Zealand Government has developed a specific policy of intervention
in the wheat and flour industry.

9.
Although the demand for flour is inelastic and relatively con
stant from year to year, the supply of New Zealand milling grade
wheat is variable between years. Accordingly the trade flows also
vary from year to year and in year s of dome stic shortfall Australian
wheat must be importt::d. It is perhaps the volatile nature of the
wheat and flour market that is seen by Government to c reate market
imperfections, and the subsequent intervention has directly and
indirectly altered the structure and conduct of the industry from that
of a competitive market industry.
204 The Structure of the Industry
A unique and influential part of the industry I s market structure
is the presence of a quasi-government marketing authority, the New
Zealand Wheat Board (NZWB). This authority has complete control
of the purchase and sale of wheat and flour, including the quantitative
control of all imports of product under industry control. The Board
also has complete responsibility for transportation and storage, most
of which is carried out by farmers, brokers, transport operators and
the Railways Department under contract to the Wheat Board. Under
the instructions of the NZWB, brokers organise the movement of
wheat from Ilon ll or 110££11 farm storage by trucks or trains to either
local flour mill s, temporary po rt storage facili tie s or to grain
consolidators.
From temporary storage facilities 5000 tonne bulk cargo ships
are used to transport wheat from Blu££ to Timaru to Auckland or
Mount Maunganui. Cur rently these ships are operated by one ship
ping company operating under a one year tender contract with the
NZWB.
The trade flow s by bulk ship are the predominant movements
of South Island wheat to the North Island. In years when New Zealand

10.
is self- sufficient in wheat production bulk shipments account fo r
approximately half the traffic of wheat (either as wheat or as flour
measured in wheat equivalents) to satisfy North Island demand for
flour. This amounts to approximately 100, 000 wheat equivalent
(w.e.) tonnes. The remaining 100,000 (woeo) tonnes are transferred
by train or by container shipping under contract with transport oper
ators, grain consolidators who prepare the grain for transportation,
and the Railways Department.
Approximately half of this remaining 100, 000 (w.e.) tonnes
destined for the North Island is in the form of flour. This occurs
because milling quotas allocated to South Island mills by the NZWB
allow for surplus production in the South Island. There is a total
of fourteen mill s in the South Island, all of which are located in
Canterbury or South Canterbury.
In the North Island there are a total of seven mills. These
are located at Auckland, Mount Maunganui, Wellington and Palmerston
North and are larger than most mills in the South Island (see Borrell,
1980, p. 22). Throughout the country as a whole, mill sizes range
from those milling less than 4, 000 tonnes of flour per anN-urn to one
in Auckland milling 70, 000 tonnes per annum. The seven larger
North Island mill s have a combined annual milling capaci ty of approx
imately 165, 000 tonnes of wheat compared to 130, 000 tonnes for the
fourteen South Island mills.
The allocation of quotas among mills does not vary greatly
from year to year. It is perhaps for this reason that in y~ars when
the production of wheat is below a level of self-sufficiency it has
been the South-North trading in wheat rathel:' than flour that has been
cut. Bulk ships have been used to servi~e the trading of wheat from
Australia to the North Islam rather than on the South-North route.
In the two years (ending 31 January) 1975 and 1976 more than 135, 000

11.
tonnes were imported in each year and therefore transported from
Australia. In 1977 only 10, 000 tonnes was imported from Australia.
Fe r a full stati stical hi story of New Zealand imports of wheat see
Borrell (1980, p.2S).
In summary, the structure of the industry can be described as
one whe re the marketing operations of transpo rtation, storage and
milling are each carried out by diverse means. The industry is
notably decentralised and whilst the Wheat Board is a sole marketing
and deci sion making authority de signed to integrate and co -ordinate
the market, still many pri vate and independent or gani sations are
involved, including farmers, brokers, port authorities, shippers
and other transport operators, millers and bakers. To this extent
the structure of the wheat and flour industry is dispersed and frag
mented. By contrast the conduct of the industry is notably centralised.
2.5 Conduct of the Industry
Pricing behaviour of the industry, the geographical and distribu
tion decisions, the degree of competitiveness or co-operation practised,
and the adjustments of quality and quantity of the industry's products
are all aspects of conduct which are determined largely by the Govern
me nt wheat and flour marketing polic y. In thi s way the conduct of the
industry is centralised, and is quite different than that which would
be expected in a competitive market.
2.5.1 Policy Obiectives in the New Zealand Wheat and Flour Industry
Without being able to determine all the obiectives or measure
all the separate effects of policy on all groups in society, it is unlikely
that policy can ever seek socially optimal solutions. However, if
policy makers can ensure that the measurable benefits arising from
an industry exceed its measurable costs, this will at least anow

12.
policy makers to presume that the set of policies chosen will lead
to an Lmprovement rather than a deterioration of natio::lal welfare.
The obvious and measurable primary benefit arising from the
wheat and flour industry is the supply of flour for New Zealand con
sumers. The obvious and measurable costs of the industry are the
financi.al costs relating to wheat growing, transportation, handling
and processing. If New Zealand consumers' dBmands for the end
products can be assumed to be completely inelastic and the prospects
of exporting unlikely, it is reasonable to assume that the ultimate or
primary polic y objectives of Government for this industry should
simpl y be to provide the fixed amou::lt of flour requi red by 0Jew
Zealanders each year at minimum costs. This however, does not
appear to be the objective actually pursued under the wheat and
flour marketing policy.
The precise policy objeetive Government has for the wheat
and flour industry is not clear. The Wheat Board Act 1965 specifies
"Self-Sufficiency" as the major objective for the industry. Chudleigh
et al (978) suggest otherwise. Their study concludes that stable
prices would appear to have been the policy objective pursued.
These objectives are only important if they ensure the supply of
flour at minimum cost, and should be, therefore, at most, inter
mediate or secondary objectives.
If primary and secondary objectives have become confused it
is likely that the minimum cost imperative which is necessary to
maintain efficiency in the industry has not received the priority it
deserves. The effect of this on the conduct of the industry might
best be seen by analysing the effectiveness of the actual policy
mechanisms which are currently in use in the industry.

13.
2.5.2 Policy Instruments
The Wheat Price
A mo st important instrument of the wheat and flour marketing
policy has been the Gove rnment' s fixing of the wheat price.
The theory of price equilibrium in spatially separated markets
indicates that prices in different localities should differ by less than
the transfer cost if the total transfer cost is to be kept to a minimum.
Trade flow s should then onl y occ ur inte rnationally, inte r- regionally
or intra-regionally if the cost of transport and hand~ing the product
does not exceed the price differences that exist in the absence of
trade.
Price equilibrium in this sense is not able to occur in the
New Zealand wheat industry under the existing pricing arrangements.
Wheat g rowe r s have not received market signals dete rmined by the
forces of supply and demand of the New Zealand wheat and flour
industry. Instead, Government have fixed the price to be paid to
farmers. The Department of Trade and Industry, in collaboration
with other groups of the wheat and flour industry, have determined
this price for Government. Even under the new wheat pricing policy,
whereby the price of wheat is set according to a three year moving
average of Australian f. o. b. wheat price s, the New Zealand price
is standardised to all producers, payable at the farmer's nearest
railway station. The transport costs from this location to either
the flour mill of destination or from there to a point 35 miles from
the bakers of final destination, whichever is the greater, are paid
by the Wheat Board.
Effectivel y, unde r thi s cur rent pricing ar rangement, individual
producers in the industry are insulated from the effects of differing
transport costs. This means North Island farmers in close proximity

14.
to mills are confronted by exactly the same set of prices as a
South Island farmer whose wheat is shipped to the North Island at
an average cost of $45 per tonne (NZWB, 1978). Similarly at an
intra-regional level, wheat farme rs growing their product close
to the Dunedin market receive the same price s as farmers $2 0.00
per tonne further away at Cromwell in Central Otago. On other
ag ric ultural commodities, produce rs in mo re remote locations
incur highe r transport costs in transfer ring their products to market.
Where farmers are insulated from transport costs, a form of
cross subsidisation among wheat growers will occur. Farms at
spatially less favourable locations can grow and sell more wheat
without incurring additional transport costs. However, this deprives
those farmers at true spatial advantage from the otherwise higher
prices required to induce them to produce the wheat those farmers
in remote locations would not produce, if confronted by spatially
discounted prices. As a result of this, an opportunity cost, or
producer tax, is imposed on proximate fanners to provide more
remote farmers with higher prices or a producer subsidy. The
consumer bears the burden of the increased total cost of transport
which arises under such a scheme.
Another sector of the industry where spatial price equilibrium
is not allowed to occur is in the flour milling sector.
Flour Milling Allocations
Miller s are a£fo rded complete insulation from the co st of
transport inputs. This, however, would not increase total costs
for the reasons described above, but it does lead to the substitution
of more expensive transport inputs of a certain product form (namely
flour) for the cheaper transport inputs of an alternative product
form (namely wheat) which would cause costs to be greater. Although

15.
flour is only equivalent to 78 per cent the weight of wheat, more
specialised, more hygienic and therefore, more expensive transporta
tion is required in transferrLng this product. This would suggest
that in general wheat should be miIled at the point of final demand.
Economies of scale experienced in the milling of wheat to flour
should also be significant factors influencing optimal mill location.
Both labour, plant (capital) and throughput economies are experienced 2
in the flour milling operation in New Zealand. Therefore total costs
of transport and milling may be minimised by balancing increasing
per unit delivery costs of flour, against the cheaper per unit costs
of assembling wheat and the decreasing costs of centralisation in the
milling operation. This will minimise the aggregate transfer and
processing costs and will also determine the quantity any mill in one
locality should produce. Site factors relating to availability of labour,
the markets for bran and pollard and external economies may also
have a bearing on the location of mills if price equilibrium were
allowed to occ ur.
The current pricing conduct prevents transport, site or
agglomeration factors from influencing the structure of the milling
sector in New Zealand. Instead, Wheat Board allocated flour quotas
dete rmine the location, number and size of mills. The price spaid
to mill s are de signed mainl y to keep ex! sting mills solve nt, rather
than encouraging a more suitable industrial structure. The prices
are calculated on a cost plus basis by the Department of Trade and
Industry and, since January 1978, individual prices have been set
to take account of the varying cost structures of the different sized
mills operating at thirteen localities in New Zealand. Because
quotas are used to structure the milling sector, pricing conduct is
only a secondary variable influencing the industry's market
2 Personal communication with flour millers and data from NZFMA confirms this fact.

16.
organisation. However, this is based largely on historical grounds
and therefore also ignores the essential economic factors discussed
above. The results of this are best summarised in the comment by
Judge (1979);
"Flour milling itself is another example of regulation distorting the free enterprise system and ending up costing the consume r and the country dearly. Unde r the quota system for wheat one mill in the South Island was closed for health reasons as its plant and buildings were no longer suitable for milling. The mill sold at a goodwillfigure in excess of half a million dollars. The consumer in the end has to pay for this and many other similar windfall profits. The profit arising from what are effectively goodwill payments comes only from an antiquated licencing system. Many modern and efficient mills today are receiving massive subsidies because they are not allowed the throughput to keep them fully operative. II
Al so from the statement:
'During the whole of the 1976 year, Northern Roller Milling Co. Ltd catered for the com:Jined trade of its mill and Aulsebrooks Allied Mills Ltd (thought to have a capacity in excess of 10,000 tonnes per annum) because of the delay in completion of the latter Company's new mill. II (11 th NZWB Annual Report, p. 23),
it is evident that surplus capacity is present in the indlJ.stry and, it
might be concluded, the allocation of milling capacity requires
greater rationalisation.
There is also evidence to suggest greater industrial rational-
isation could be achieved in the allocation of the industry's prOdi..lcts
between the various modes of transport.
Transportation
There are potential economies of scale in both storage and bulk
shipping that rna y hold implications for what is an efficient transport
17.
policy for the industry. Freebairn (1967) and Dickie (1972) both
report that significant economies of scale can be exploited in storing
wheat. Sharp and McDonald (1971) and Chudleigh (1978) di.scuss the
significance of economies of scale in bulk shipping; these can be
considerable. Finding the optimal size of ship and the optimal size,
number and location of large centralised storage facilities are com
plex problems (see Borrell, 1980), only solvable by analysing the
trad·e -oifs between many inte r - related co sts of many spatial and
temporal factors. Improvements in the industry's transport policy
may be possible if these economies of scale were more fully exploited.
The Wheat Board's current annual contract shipping arrange
ment results in ships of approximately 5,000 tonnes servicing the
inter-island and trans-Tasman shipment of a guaranteed 100,000
tonnes per annum. Al though there are three ships each operating
thi s route part-time, unde r the pre sent loading and unloading rate s,
this given tonnage could be enough to approximately occupy one ship
full-time. 1£ current loading, and particularly unloading rates from
bulk ships could be increased, a single 5,000 tonne ship could trans
port substantially more wheat cargo. As the economies of bulk
shipping involve a large fixed cost component (the capital cost) and
only mi.nor vari.able costs, extra volume throughput of cargo would
substantially reduce the cost per tonne of wheat shipped.
It is apparent that the main facto r cur rentl y reta rding unload
Lng rates from bulk ships Ln Auckland and Mou!lt Maunganui is that
ships must discharge directly to trucks. This can take up to four
days and even longer if bad weather lnterrupts the operation. In
many ports of other countries discharge of grain from ships is con
veyed directly to port storage facilities allowing quick turn round
of ships.

I 8.
The cur rent North Island demand for flour require s approxi
mately 220, 000 wheat equivalent tonnes to be transferred to the
North Island annually. Although the bulk ocean shipping of wheat is
probably the cheapest mode of transport available for transferring
wheat equivalents to the North Island, it has been Wheat Board policy
to also send wheat and flour by other more expensive modes of trans
port. This has been considered to give the Wheat Board a flexible,
multi-mode routing strategy to secure the logistics of the industry.
Because there are only short-term buffer storage facilities
in the North Island, flexibility is considered crucial to secure the
steady flow of wheat and flour to the North Island. Flexibility allows
the Wheat Board to cover the contingencies introduced by transport
strikes and hold-up sometimes experienced with current bulk ship
ping. However, if adequate buffer storage facilities were available
in the North Island, such contingencies could be les s important as
large buffer storage could ensure an uninterrupted flow of wheat to
North Island millso Moreover, without the need for a multi-mode
routing strategy, the full tonnage of wheat equivalents could be trans
ported by bulk ship to the North Island, thus enabling the economies
of shipping to be exploited. This might enable total industry costs
to be reduced if the savings in transport costs from substituting
existing transport inputs with the increasingly less costly alternative
inputs, outweighed the extra but decreasing per unit cost of port
bu££e r sto rage.
2.6 Summary
Because of the nature of Government policy influence in the
New Zealand wheat and flour industry, the normal workings of the
market mechanism do not guide the condl.1ct of operators in this
industry. Whilst Government involvement may be necessary in an

19.
industry where the market mechanism fails to achieve economic
policy objectives, still the underlying economic and market forces
must not be ignored in designing policy control instruments.
It has been suggested in this chapter that the current policy
determined conduct of the industry may be insulating operators
from several very important, innate economic and market forces.
The influence of this on the organisation of the industry, it has
been purported, may have created an inte raction of market conduct
and structure that has produced a market performance to which sig
nificant improvem2nts could be made.
The next chapter seeks to construct a mathematical model that
incorporates the important economic forces of the wheat and flour
market. It is intended that thi s model will then be used to anal yse
which aspects of market structure and conduct might help improve
the performance of this industry. The model wHl seek to show the
potential performance of a perfect market. In this model costs are
minimised in supplying flour to New Zealand consumers. In an indus
try where there is a single authority responsible for marketing, the
potential for directing the industry towards such a perfect market
exists as the central authority has the power to implement and
co-ordinate the findings of the market model.


CHAPTER 3
METHODOLOGY - THE TRANSHIPMENT MODEL
3.1 Introduction
This chapter seeks to embody the theoretical concepts raised
in Chapter 2 in a mathematical model of the industry. It is intended
that thi s model be used to dete rmine the industrial 0 rganisation that
might improve market performance of the wheat and flour industry
in New Zealand.
3.2 Selection of Type of Model
The natlJ.re of the problem discussed in chapter 2 suggests
that many aspects of Government policy have insulated the wheat
and flour industry from the economic forces that underlie its markets.
It is hypothesised that the rigidities of policy have prevented necessary
structural adjustments occuring in the industry and that the lack of
structural change may be a factor restricting the market performance
of this industry. For this reason, a primary feature of the proposed
model is that it be able to show the long term structural responses
which might occur i.f the economic forces of the market were able
to influence the industry. To effectively model and analyse such
economic forces, an essential feature of the methodology is that it
must take simultaneous account of the multi - staged product flow s
involved in the industry. These include the flows of grain and flour
from farms through to mills and, through storage facilities, via the
different modes of transport to the eventual delivery points where
flour is required in New Zealand. Specifically, the methodology
must be able to analyse the structural changes necessary to deter
mine the location, number, and size of marketing facilitLes, as well
as the quantity flows of the industry's products that will minimise
21.

22.
the sum cost of purchase, assembly, storage, processing and dis-
tri:bution of wheat and flour.
Because of the aggregate nature of the problem, the determina
tion of appropriate locations for marketing facilities will be a problem
of selecting among general regions rather than precise localities.
For example, the problem may be to determine whether milling
should occ ur at Ashburton; no attempt will be made to dete rmi ne
where in Ashburton milling should occur. In this way, space can
be treated as di sc rete regions rathe r than a continuum of fnfi nitel y
small potential site s.
By delimiting space to a set of potential locations whe re wheat
might be produced, milled and finally demanded as flour, it is poss
ible to represent the basic problem diagrammatically (Fi.gure 3.1).
FIGURE 3.1
Diagrammatic Repre sentatio n of a
Tranship'ment Model
Known Source Regions
SO)
S(2 )
S(M)
Wheat Flow From Sources
To Mills
Assembly Costs
Pote ntial Mill Facilitie s
F(1)
F(2)
Processing Costs
F(T)
Known Final Demand Regions
Flour Flow From Mills to De stinations
Delivery Or Distribution
Costs
DO)
D(2 )
D(N)
Figure 3.1 show s that the fundamential problem is to minimise
the total assembly, processing and distribution costs of the industry

23.
by selecting the rrlost appropriate trade flows of wheat and flour
between initial source regions and final derrland regions via the rrlost
appropriate potential rrlill facilitie s. Any cOrrlhination of product
flows between S(I), F(J) and D(K) are feasible (where 1=1,2, ••• M;
J=1 , 2, ••• T; K=l, 2, ••• N). Fo r eX;:1rrlple, S(2) could suppl y rrlill
F(5) with wheat, F(5) in turn could supply DO) and possibly D(4) as
well. All feasible cOrrlbinations could be represented by arrows in
a rrlore cOrrlplex flow diagrarrl; different rrlodes of transport could be
represented in a cOrrlplex diagrarrl, as could t~1.e transhiprrlent of
wheat via port storage facHitie s. Rathe r than atterrlpting such a
cOrrlplex diagrarrl, a convenient way of sU1TIrrlarising all the detalls
of the problerrl in a forrrlalised and consistent rrlanner is to present
an alge braic staterrlent of the problerrl.
3.2.1 Algebraic Statement of the Problem
The problem can be broken into two rrlaior components, the
objective function and the constraints.
(1) The Objective FU::1ction
Minimise TC = II T X + [; Z T X + Z Z T X ij ij ik ik in in
k n
+ I P X + Z P X + Z P X j
j ij k
k ik n in n
+ Z Z T Z + SY ..L Z Z T Z I
d jd jd s
d nd nd
J n
+ L: L: T Y + Z P Y k
kn kn n kn n n
+ Z P Y + Z L: T Y + Z P Y m Srrl
m rrl n n rrln mn n mn
(1)
24.
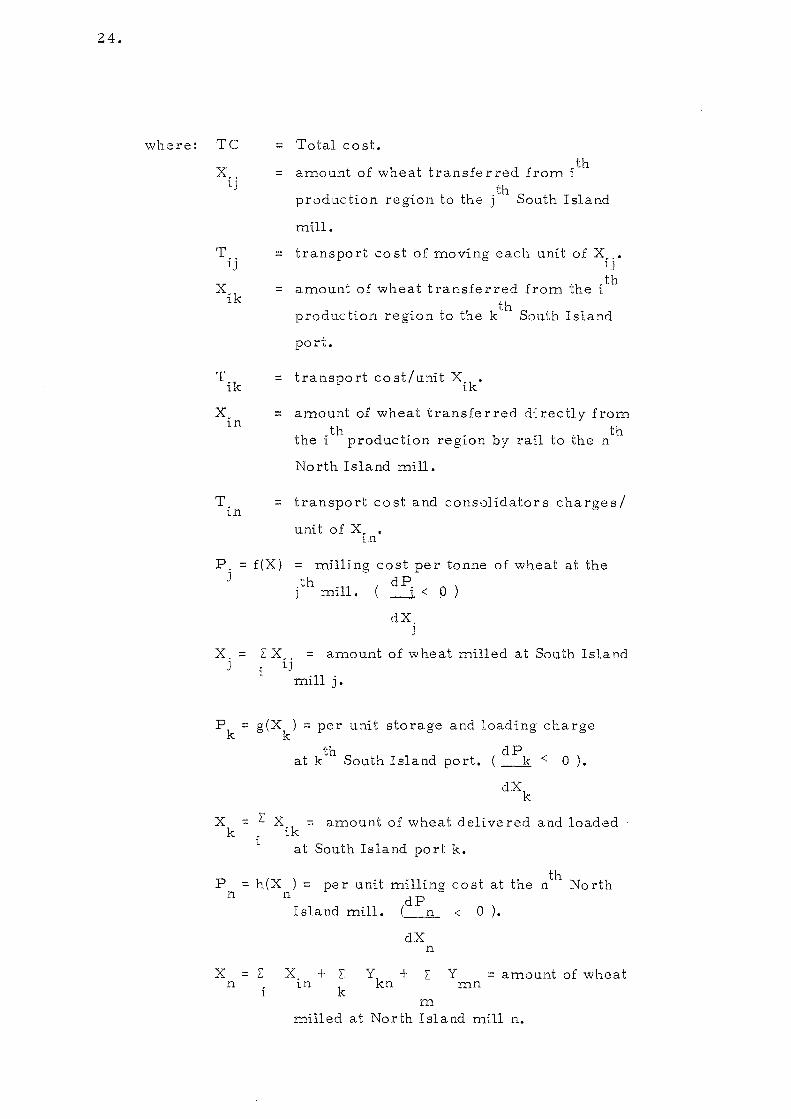
where: TC
X .. 1J
T ij
X ik
= Total cost. th = amount of wheat transfe r red from i
=
=
th production region to the j South Island
mill.
transport cost of moving each unit of X ..• IJ
.th amount of wheat transferred from the 1
th production region to the k South Island
port.
Tik = transport cost!U:1it Xiko
X in
T in
= amount of wheat transferred directly from . th. . th
the 1 productton region by ra1l to the n
North Island mill.
= transport cost and consolidators charges!
unit of X .• l.a
p. = f(X) = milling cost pe r tonne of wheat at the J th dP
j mill. -i < )) )
dX. J
X. = Z X = amount of wheat milled at South Island J i ij
mill j.
P k = g(Xk
) = per unit storage and loading charge
at k th South Island port. (dP k < 0).
dXk
Xk
= l: Xik
= i
amount of wheat delive red and loaded
at South Island port k.
th P = h(X ) = pe r unit milling co st at the n No rth
n n dP
X = l: n
i
Island mill. (_11- < 0).
X + Z in
k
dX
y + kn
n
m
y = amount of wheat mn
milled at North Island mill n.

T jd
= transport cost/unit Zid'
25.
Y s
= L: X k = amount of wheat transported by bulk k
ship.
S = q(Y ) = per unit shipping cost of bulk shipping. s (dS < 0) dYs
Y kn
T kh
Y sm
= amount of flour in wheat in wheat equivalents th
transferred from the n North Island mill th
to the d final demand region.
= transport cost/unit of Znd'
= amount of wheat transfe r red by co ntaine r th
ship from the k South Island port to the
nth No rth Island mill.
= transport cost/unit of Ykn
•
th = amount of wheat received at the m
North Island port.
P = r(Y ) = per unit storage and unloading cost at m sm th (dPm
Y mn
T mn
In gene ral te rms:
x
Y
Z
the m North Island port. d Y sm < 0) •
th = amount of wheat transported from the m
. th North Island po rt sllo to the n No rth
Island mill.
= transport co st/ unit of Y . mn
refers to wheat from farms.
refe rs to wheat that is transhipped.
refers to flour shipments.
f, g, h, q, r are cost functions.
26.
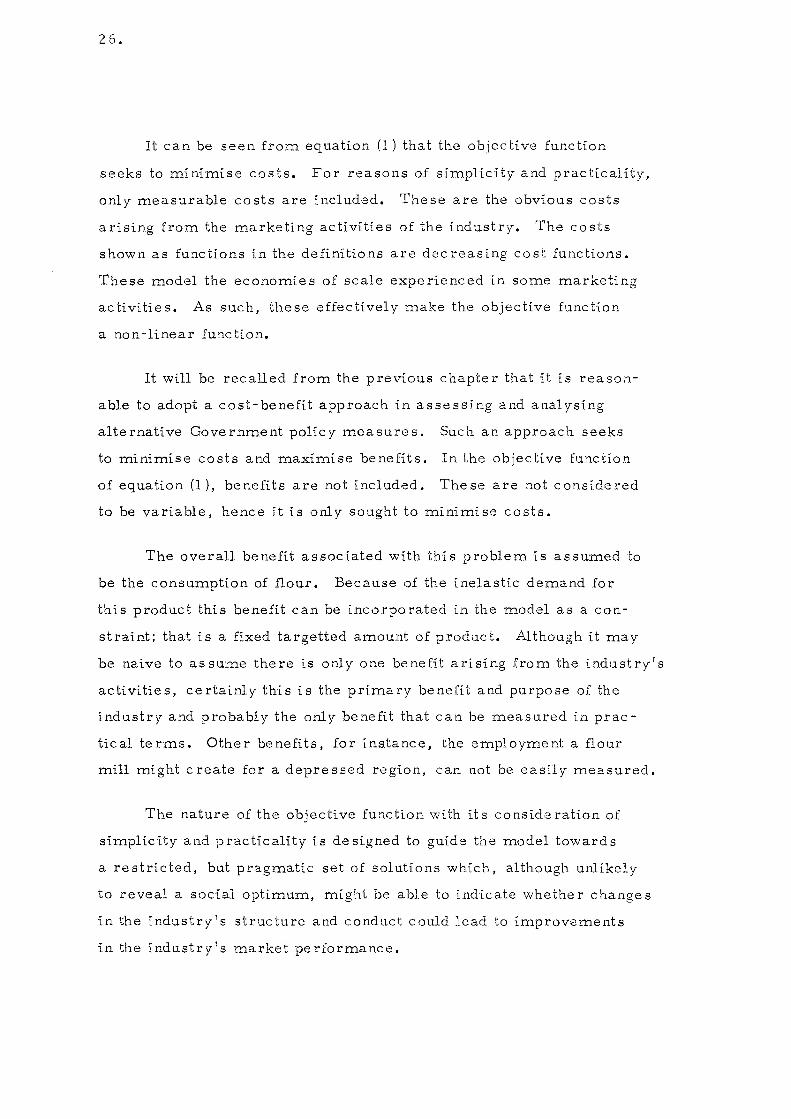
It can be seen from equation (1) that the objective function
seeks to minimise costs. For reasons of simplicity and practicality,
only measurable costs are included. These are the obvious costs
arising from the marketing activities of the industry. The costs
shown as functions in the definitions are decreasing cost functions.
These model the economies of scale experienced in some marketing
activities. As such, these effectively make the objective function
a non-linear lunction.
It will be recalled from the previous chapter that it is reason
able to adopt a cost-benefit approach in assessing and analysing
alte rnative Gove rnment polic y measures. Such an approach seeks
to minimise costs and maximise benefits. In the objective fu.nction
of equation (I), benefits are not included. These are not consi.dered
to be variable, hence it is only sought to minimise costs.
The overall benefit associated with this problem is assumed to
be the consumption of flour. Because of the inelastic demand for
this product this benefit can be incorporated in the model as a con
straint; that is a fixed targetted amount of product. Although it may
be naive to assume there is only one benefit arising from the industry's
activities, certainly this is the primary benefit and purpose of the
industry and probably the only benefit that can be measured in prac
tical terms. Other benefits, for ins.tance, the employment a flour
mill might c reate for a depressed region, can not be easily measured.
The nature of the objective function with its consideration of
simplicity and practicality is de signed to guide the model towards
a restricted, but pragmatic set of solutions which, although unlikely
to reveal a social optimum, might be able to indicate whether changes
in the industry's struc ture and conduct could lead to improvements
in the industr y' s market pe rformance.

27.
(ii) The Set of Constraints Minimisation of the objective will
be undertaken subject to the followi.ng five basLc constraints:
(a) E
j
Z + E jd
n
where:
= FDd for all d (2 )
= final demand for flour (measured in w.e. tonnes) th
in the d region.
The social objective of supplying consumers with flour can be repre
sented as a constraint in the problem. Unless solutions to the prob
lem meet the targetted regional demands for flour they are infeasible
solutions. The model must ensure that the combined flour transferred
from South and North Island mills to any demand region must be equal
to the final demand in that region.
(b) E X + E X + E X = F S fo r all i (3 ) ij
k ik in 1_
n
where: F S 1
= wheat production in region i.
For solutions to be feasible it is also necessary to reconcile other
product flows. This constraint ensures that the supply of W;1eat
received at South Island mills, South Island ports, and that trans
ferred directly to the North Island from South Island regions, does
not exceed the quantity of wheat produced in that region. Without
the upper constraint F S. the model might demand more wheat than L
is available from favoured regions. No lower limit is required since
it is realistic that the demands for milling grade wheat are less than
the total amount of wheat produced or available from sources includ
ing Sydney.
(c) E F S. i
1 :) E
d
FD d
= l: X.. + 1J
l: X in
n
for all i, m, k
+ l: Y + E y mn kn
n n
(4 )
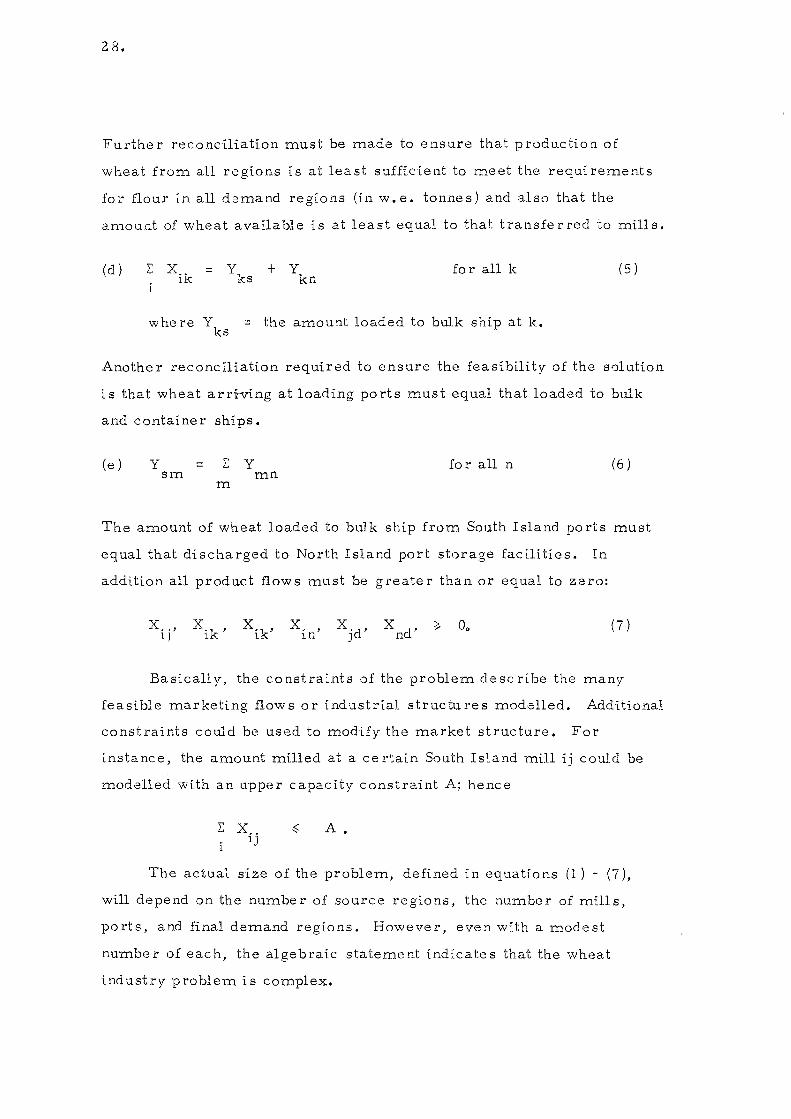
28.
Further reconciliation must be made to ensure that production of
wheat from all regions is at least sufficient to meet the requirements
for flour tn all demand regions (in w.e. tonnes) and also that the
amount of wheat available is at least equal to that transferred to mills.
(d) y ks
+ y kn
for all k
where Y = the amou::1t loaded to bulk ship at k. ks
(5 )
Anothe r reconciliation required to ensure the feasibility of the s0lution
i.s that wheat ardving at loading ports must equal that loaded to bulk
and container ships.
(e) y = L: Y for all n (6 ) sm mn
m
The amount of wheat loaded to bulk ship from South Island po rts must
equal that discharged to North Island port storage facilities. In
addition all product £low s must be greate r than or equal to ze ro:
X X X X X Xnd' >.. 0 ij' ik' ik' in' jd' - 0
(7 )
Basically, the constraints of the problem describe the many
feasible marketing £lows or industrial structures modelled. Additional
constraints could be used to modHy the market structure. For
instance, the amount milled at a ce rtain South Island mill ij could be
modelled with an upper capacity constraint A; hence
L: X .. 1J
A.
The actua~, size of the problem, defined in equations (1) - (7),
will depend on the number of source regions, the number of mills,
ports, and final demand regions. However, even with a modest
number of each, the algebraic statement ind':cates that the wheat
industry problem is complex.

29.
Because of the non-linearitie s of the objective function, standard
linear programming (L.P.) techniques are not suitable to solve the
problem defined above. The assumption of assumed linear functions
which is associated with linear programming is valid to study short
term marginal changes in costs, but is not valid in the longer term
where long run average costs and economies of scale are to be con
sidered. Furthermore, the size of the current problem would be
computationally burdensome if it were formulated as a standard L.P.
problem.
One method that does meet the requirements of the wheat industry
problem is the facility location model. This involves the use of itera
tive solution procedures in conjunction with heuri.stic rules for solving
the transhipment prog ramming model. Thi s provide s a methodology
suitable for analysing long-term structural changes in a system of
complex marketing flows. Accordingly, this methodology allows the
complex mul ti - staged product flow s of the industry to be modelled,
while the iterative solution procedure and heuristic rules allow the
effects of non-linear costs to be analysed.
3.3 The Transhipment Problem
The transhipment model is a modified version of the transpor
tation model (Higham et aI, 1972; McCarthy et aI, 1972 and Borrell,
1980). By allowing transhipment points or intermediate destinations
of a multi-stage distribution problem to be modelled first as demand
points (destinations) and secondly as supply points (sources) it is
possible to view a transhipment problem as a set of simultaneous
transportatio'J. problems. In this form the transhipment model can 3
be solved using a transportation algorithm. This determines the
optimal flow s of a homoge nous product from a numbe r of suppl y
3 Elshafei (1973) reviews four algorithms fo r the solution to the transportation problem.
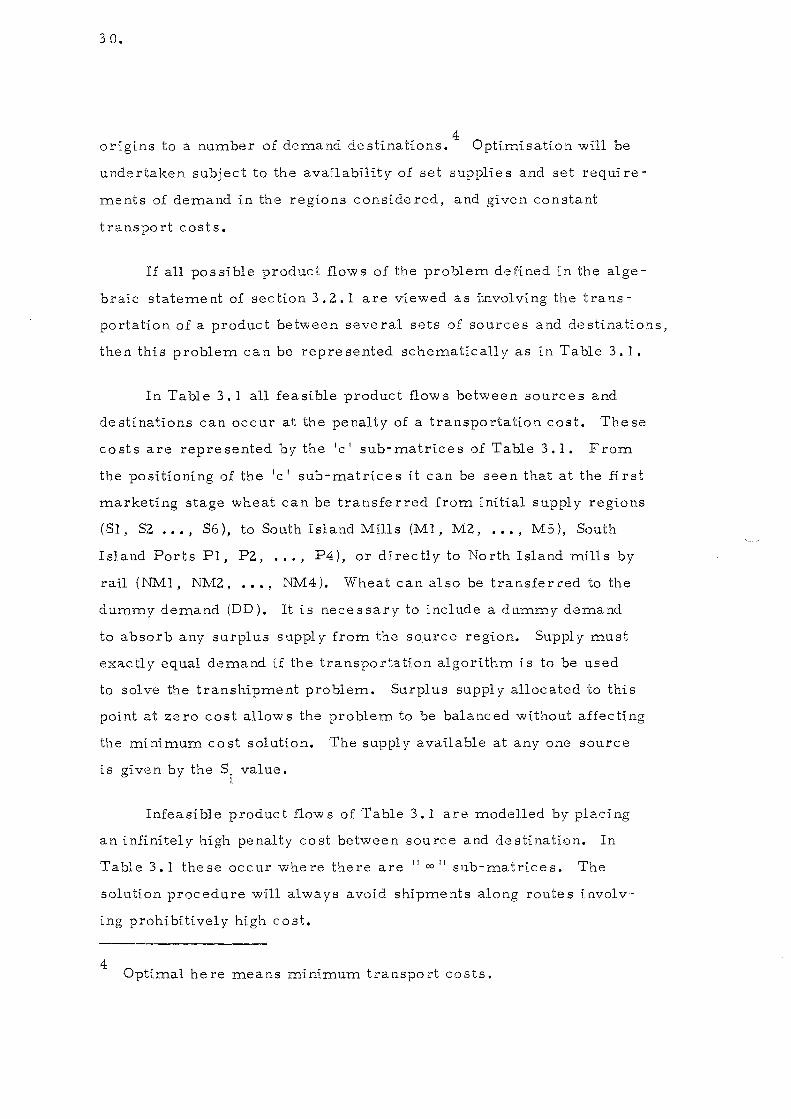
3 O.
4 origins to a number of demand de stinatlons. Optimisation will be
undertaken subject to the availability of set supplies and set require
ments of demand in the regions considered, and given constant
transport costs.
1£ all possible product flows of the problem defined in the alge
braic statement of section 3 .Z.1 are viewed as i~nvolving the tra'1.S
portation of a product between several sets of sources and destinations,
then thi s problem can be repre sented schematicall y as tn Table 3. 1.
In Table 3. 1 all feasible product flow s between source sand
destinations can occur at the penalty of a transportation cost. These
co sts are repre sented by the IC I sub- matrice s of Table 3.1. From
the positioning of the IC I sub-matrices it can be seen that at the first
marketing stage wheat can be transfe rred from initial supply regions
(Sl, SZ "" S6), to South Island Mills (Ml, MZ, "', MS), South
Island Ports PI, PZ, "', P4), or directly to North Island mills by
rail (NMI, NMZ, ... , NM4). Wheat can al so be transfe r red to the
dummy demand (DD). It is necessary to include a dummy demand
to absorb any surplus supply from the so.urce region. Supply must
exactly equal demand if the transpor':3.tion algorithm is to be used
to solve the transhipment problem. Surplus supply allocated to this
point at ze ro cost allow s the problem to be balanced without affecting
the minimum cost solution. The supply available at anyone source
is given by the Si value.
Infeasible product flow s of Table 3. I are modelled by placing
an infinitely high penalty cost between source and destination. In
Table 3.1 these occur where there are II co II sub-matrices. The
solution procedure will always avoid shipme'1.ts along routes involv
ing prohibitively high cost.
4 Optimal here means minimum transport costs.

South Island Mills Destinations
MI Sources
MZ .. .. . . MJ
Sl SZ
Wheat C
Supply
SJ MI
South MZ 00
Island Mills Flour 00
Sllpply
MJ PI
South PZ
I sl and 00
Ports Wheat PK ----
5 00
North NPI Island Ports NPZ co ~(,1pp'jt NPN
North NMI
Island NMZ
Mills 00 . Flour :"Il?pl y NMN
TOTAL DEMAND A A •• ,,1 •• .. ..
TABLE 3.1
Programmi ng Tableau Multi -Staged Transhipment Probl ern
of th e Wh eal __ a,nd Flour Ind UEltr-y
South Island Ports North Island Rnts North Island Mills Final Demands for Flour (All Re!lions)
I
PI PZ .. .. PK S NPI NPZ NPM NMI NMZ .. NMN ~DI FDZ .. .. .. . .. ... .. . . . . . ..
c co 00 C 00
00 00 00 co C
~. 00 c 00 .,
co -~ co ~ 00 00
c
co 00 ~ C 00
00 00 00 ~ c
.. .. .. .. .. .. . . .. . . .. .. A fd1 fdZ .. .. . . . . . . . . .. .. ..
...., ::>
~
FDD DD if . . "0 "E. '<;
51 Sz
0
· · · S· A A
· 00
· · I
· · · .,
00 ---;--
:
00
· 00 · ·
A
fdd dd
w

32.
The wheat allocated to primary demand ~')oints can be traced
through the remaining feasible product flow s of Table 3.1 and be
seen to eventuall y and up at the final demand regions. The wheat
transferred to South Island mills is further transferred, after mill
ing, as flour (measured :n wheat equivalents) to final d:=mand regions
(FDl, FD2, "', FD13). The amounts demanded by these individual
regions are given by the fd. value s whic hare the known cons umption 1
level in each region. Again transport costs will be incurred as the
product is transferred to final demands. No cost is incurred if
South Island mills supply themselves; this allows the mill to be
modelled with surplus capacity.
The diagonal line s of Table 3.1 indicate whe re transhipme nt
points can supply to themselves at zero cost. Hence it can be seen
that the Ml South Island mill can supply to itself as a destination.
The infinitely high costs \:n the off diagonals prevent transfers to
othe r mill s.
In effect by allowing a mill to s '.:rpply to itself at zero cost a
second form of dummy demand is created. With a dllmmy demand
to absorb surplus milling capacity (without affecting the total cost
of the minimum cost solution) it is possible to model South Island
mills as having an unrestricted supply of milling capacity. This is
given by the arbLtrary large value A. In this way the cost minimis
ing solution procedure is unrestricted in the amount it allocates to
any mill. Hence it is possible to determine the optimal amount of
wheat to be milled at anyone mill location.
Of the remaining flow s in Table 3.1, South Island ports can
supply either bulk ship, or North Island mills by container; bulk
ships can supply North Island ports, North Island ports can in turn
supply North Island mills, and these in b.rn can supply final d,emand
regions. It is not difficult to see that imports of Australian wheat

33.
could also be allowed for in the model. Taese could be included by
specifying sa y, Sydney a s a port supplying to bulk ship. This would
require another port, P6, to supply to bulk ship, S. The amount
loaded a t Sydney could then be constrained at any level between zero
and A and any surplus Sydney wheat could supply to the dummy demand,
DD, at zero cost.
Al though Table 3.1 repre sents all feasible transport flow s of
the wheat and flour industry, it does not represent the full tranship
ment problem of the industry. A solution to the current model would
assume transport flows to be independent of the efficiency of process
ing or handling wheat at various transhipment points. Clearly this
would be :naive.
It is possible to include processing and handling costs at tranship
ment points in the model. This modification makes it possible to study
the effects of processing and handling costs on the location of processing
fa c ili ti e s •
Processing and handling costs are included in the transhipment
model simply by adding these costs to the transport costs of sub
matrice s of type IC I in Table 3.1 For example, to include the cost
of South Island milling, MC, it is simply a matter of addi.ng the per
unit milling cost mc, (in the algebraic statement defined as f.) to J )
the transport cost c,' (in the algebraic statement defined as t,,) in 1J 1J
the north-west sub-matrix of Table 3.1 It should be noticed that
mc, is a constant (linear) cost rather than a non-linear function J
depicting the decreasing costs associated with economies of scale
in milling. The transhipment model itself Can not take account of
non-linear costs. The implication arising from this will be examined
later when it will be shown how the affects of non-linear costs can
be analysed using iterative solution procedures and heuristLc search
techniques (see Section 3.4).

34.
Other features of the transhipment model make it possLble to
examine a number of spatial problems which may be associated with
an industry. For Lnstance, it should be noted that capacitated prob
lems can be formuJ.ated in the transhipment framework (Hurt and
Tramel, 1965). That is, it is possible to place any desired upper
demand or supply constraint on processing or transhipment facilities
of the model. In the wheat industry problem this would make it poss
ible to represent mi11i:ng quotas. Similarly, it would be possible to
restrict bulk shipping to at least its current 100, 000 tonne volume.
Leath and Martin (1966) show how it is also possible to place lower
bound capacity constrai nts on p roce s sing 0 r transhipme nt facilitie s.
Using upper and lower bound constraints, the existing political
constraints of the market can be represented and, in fact, the entire
market structure of the existing industry can be simulated. It would
then be possible to compare the solutions of the capacitated model to
those arising when constraints are absent, that is, in the uncapa'citated
case.
The solution to the transhipment model showing optimal product
flows through facilities and between regions is known as the primal
solution. Associated with every linear programming problem there
is also a dual solution. In solving the primal L.P. problem, the
dual L. P. formulation is automatically solved. The optimal values
of dual variables show how the objective function would change with
a unit change in constraints of the problem. Hence, as CaSSidy
(1968, p. 57) points out, the dual solution allows the marginal value
of additional capacity for constrained activities to be estimated. For
example, it would be possible to estimate the value of increasing the
milling quota at a Wellington mill by one tonne of wheat. This may
be useful information to gauge the marginal opportunity cost which
current political constraints impose on the industry. Furthermore,
35.
from the dual solution of the problem it would be pos sible to e stima te
the price differentials between regions. This may be helpful infor
mation for it would show the amount by which wheat and flour prices
should vary between regions, that is, it would determine the relative
marginal values of wheat and flour grown in, or delivered to different
regions. It will be recalled from chapter 3 that in the current market
standardi sed whea t and flour price s are paid throughput New Zealand,
and therefore regional price differentials are totally unknown.
Provided product homogeneity is assumed, transhipment formu
lations are flexible enough to handle a wide range of problems. These
include multi-region, multi-plant, multi-stages and even multi-period
(Leath and Martin, 1967) programming problems. It should be noted
that the homogeneity assumption does not prevent multi-product
problems from being formulated in this framework as different products
can be expressed in equivalent terms. For the current problem, flour
is expressed in whea t equivalents. Since one tonne of wheat produces
.78 tonnes of flour, a wheat equivalent tonne of flour is accordingly,
.78 of a tonne.
In summary, it can be seen that the solution to the transhipment
problem can be used to yield a grea t deal of information useful in
polic y analysis. Primarily, the solution will determine optimal product
flows among regions. From such a solution it wilrbe possible to'
determine the efficient pattern of mill and port usage. Regional
price differentials 'can· also be obtained and, in the capacitated
case, the opportunity cost of milling quotas and transport constraints
could be determined. However, the product flows will only be opti
mal in a restricted sense, that is assuming all costs are linear.
Clearly, with economies of scale in milling, shipping and ship load
ing and unloading, this is unrealistic. Iterative solution procedures
used in conjunction with heuri.stic search rules allow this problem
to be overcome.

36.
3.4 He rative Sol utio n Procedure s and Heuristic Search Technique s
The effect of non-linear costs can be analysed in the linear
transhipment model by repeatedly solving the linear problem. This
can be done by updating the per unit processing costs to reflect the
economy of scale that would be achieved given the prescribed through
puts of facilities in the previous solution. Combined with the heuristic
procedures of Logan and King (1964), Stammer (1971) or Higham et al
(1972) which either encourage, discourage or force processing facili
ties into or, out of, the model, the solution procedure iterates towards
an eventual stable solution.
The solution will indicate the location, number and size of pro
cessing (transhipment) facilities which exploit the economies of scale
in processing, as well as determining an efficient pattern of transpor
tation for the industry's products. Because the heuristic rules do
not provi.de optimising criteria for selecting among potential facilities,
the method does not ensure a global optimum solution. It can only 5
ensure a local optimum solution. U suall y many local optima may
exist, several of which may be of interest to the policy maker.
The heuristic rules of Logan and King (1964) and Stammer (971)
provid,::; a fixed criteria that can be used to derive a certain local
optimum. The Logan and King method eliminate s potential facilitie s
if they appear in any solution with zero throughput. These are dropped
from further consideration by placing artificially high costs on the use
of the facilities. By contrast the Stammer method allows previously
excluded facilities to remain at their previous costs so they will not
be excluded from further re-evaluations. However, if only allocated
a small quantity as a result of re-evaluation, the per unit cost will
5 A local optimum solution is one that has a lower total cost than would ari se from alte rnative market structure s created by making only small changes to the solution. With large changes, economies of scale may be achieved at other facilities. This could result in other local optima solutions. A solution is a global optimum if no alternative solution has a lower total cost.

37.
usually rise in successive iterations as the full scale effects wouJ.d
llOt be realised. This is likely to eliminate the facility from further
consideration. Both these methods passively seek out one local
optimum according t<;> predetermined beuristic rules. Only the forc
ing procedure of Higham et al gives the researcher the option to
actively encourage locations into, or force locations out of, the solution.
This can be done by either adjusting the unit processing cost or by
adjusting the capacity constraints on facilities. In this way the
researcher is equipped to actively explore the solution space of the
problem. The forcing procedlue enables the researcher to seek
out alte rnative local optimum solutions. This allow s the re searche r
to apply other heuristic criteria such as that suggested by Rogers
0978, p. 16-27):
"if there are two locations present in a stable solution which are 'geographically close', one of them is a good candidate for 'forcing out'."
It also enables the researcher the abllity to seek solutions possess
ing particular qualitative attribtltes that may be of interest for policy
purpose s. The pos sibility of being able to locate seve ral low co st
solutions may be particularly helpful.
Although iterative solution procedures and heuristic search
techniques help overcome the problems introduced by non-linear
costs, a further difficulty is presented. Because of the presence of
non-linear costs, and therefore the possibility of several local optima,
it is possible that the marginal values given by the d'.lal solution may
be difficult to interpret as there will not be a unique set of d'.lal costs.
Where all intermediate d'emand and supply points are uncapacitated,
their marginal values will be zero in the dual solution regardless
of whether non-linear costs are tnc1uded in the objective function.
However, when non-linear costs are included, an alternative optimum
may indicate that inc reasing throughput at a certain mill would result

38.
in substantial reductions in total costs. Therefore, while a marginal
change would not crea te cos t savings, large change s may do. In thi s
way, dual costs can not be used to gauge how further changes in mar
ket structure may lead to cost savings.
The relative marginal values of wheat and flour at initial supply
and final demand regions will be available from the dual solution
attained from problems with non-linear costs. These values, however,
will not be unique. An alterna tive local optimum solution and there
fore alterna tive market structure with a similar total cost could produce
quite different sets of regional price differentials. This may have
important implications if the model was used to suggest what might
be fair relative prices for different regions.
3.5 Summary and Co nc1usions
It has been shown in this chapter how the transhipment model
can be used to study multi-region, multi-staged marketing problems.
Further, it has been shown how the use of Hera tive solution technique s
which embody heuristic search procedures could be used in conjunc
tion with the transhipment model to study the effects of economies of
scale on multi-region, multi-staged marketing problems. It is
precisely these types of problems that exist in the wheat and flour
industry.
In the next chapter a prac tical sta tic model of the industry
is set up. In chapter 5 results arising from using this model with
heuristic search procedures are reported.

CHAPTER 4
THE MODEL -
THE PROGRAMMING MATRIX, DATA AND ASSUMPTIONS
4. I Introduction
This chapter sets up the program.m.ing m.atrix d:scussed in the
previous chapter. This requires defining the regions of the m.odel
and specifying relevant regional dem.ands and supplies, and m.illing
and shipping capacities. In addition, transport charges for wheat
and flour shipm.ents and proces sing and handling co sts m.ust be
specified.
4.2 Regional Dem.arcations
New Zealand was partiti.oned i.nto various regions for the study.
Regional boundaries were established according to the areas distin
guished by the existing transportation patterns, however, subjective
considerations and the availability of data also had a bearing of
where these were fixed.
For initial wheat supply from. farm.s, the South Island regions
presented in the North-West corner of Table 4.1 were used to define
the six production regions for the m.odel. Countie s we re aggregated
into these six general regions partly for statistical convenience, but
m.ostly because of their distances from. initial destinations to which
wheat is transported.
The location of flour m.i.lls in the m.odel were assum.ed to be
the general regions in which m.ills are currently located; dispatch
ports were defined by existing ports and receival ports by their
proxim.ity to North Island m.ills. Final dem.and regions were
39.

40.
considered to corre spond to the regional popula tion densities, and,
a s such conveniently corre sponded with the sta tis tical area s used by
the New Zealand Department of Sta tistic s (1973). However, because
within the Wellington, Canterbury and Otago regions there are more
than one supply region, aggregation of these as final demand regions
would conceal certain possible trade flows in the model. Accordingly, •
Wellington WaS di saggrega ted into Palmer s ton North and Wellington;
Canterbury was disaggregated according to the flour demands around
Timaru, Ashburton and Christchurch; and Otago was separated into
Oamaru and remaining Otago. Further, it was considered appropria te
to aggregate North Auckland and Auckland, East Coast and Hawkes
Bay, Nelson and Marlborough, and Christchurch and Westland, since
it was expected that the combined regions would be supplied from the
same sources. Hence, in all there are thirteen demand regions.
These can be seen as final demand regions ·presented in the North
West corne r of Table 4.1
4.3 QsJ;a
Four ·general types of data were required for the model;
(i) regional supplies of whea t,
(ii) regional demands for flour,
(iii) milling and shipping capacities (for the capacitated
problem), and
(iv) regional and inter-regional transport, processing
and handling costs.
4.3.1. Regional Supplies
All regional supplies were as sumed inela stic • The amounts
a.ssigned were considered to be fairly representative of a year of
self-sufficiency. and were estimated as follows:

41.
tonne s
1. Southland 76,000
2. Otago (excluding North Otago) 23,000
3. North Otago 16,000
4. South Canterbury 50,000
5. Mid Canterbur y 75,000
6. Remaining Canterbur y 50,000
It was assumed that the regional supply quantities are of mill
ing quali ty whea t.
4.3.2 Regional Final Demands
Like the regional supplies, regional demands were assumed to be
inelastic. Estimates of final demands were calculated fl-um-the
national average flour consumption of 70 kilograms per head (N. Z.
Department of Statistics, 1979a). Assuming £lour use to be evenly
dispersed among the population, the population multiplied by this
average WaS considered to give a reasonable approximation of demand
in each area. These final demands for £lour were converted to wheat
equivalents; these are as follows:
Auckland/North Auckland
South Ba y of Plenty
Ea st Coast/Hawkes Ba y
Taranaki
Palmer ston North
Wellington
Nel son/Marlborough
Christchurch and Districts/Westland
Mid Cante rbur y
South Canterbury
tonne s
85,000
45,000
17,000
4,000
4,000
55,000
10,000
34,000
2,700
4,400

42.
North Otago
Otago (South and Central)
Southland
4.3.3 Milling and Shipping Capacities
to!1.ne s
3,000
14,000
9,000
287,100
Milling capaci tie s used for the fir st run of the model we re those
corre sponding to exi sting regional quota capacitie s. Borrell (1980,
Table 2 - 5) e stima te s the se as follow s:
Invercar gill
Dunedin
Oamaru
Timaru to Temuka
Ashburton
Christchurch and Rangiora
Wellington
Palmers ton North
Mount Ma unganui
Auckland
tonnes of wheat
9,000
24,000
14,000
21,,000.
7,000
53,000
20,000
14,000
30,000
100, 000
The shipping capacity constraint corresponded to the current restric
tions which limit bulk shipping to 100,000 tonnes per annum from the
South Island to the North, but the se were required in capacita ted
versions of the model only.
4.3.4 Marketing Cos ts
Although estimates of costs for the model were drawn from a
variety of sources and time periods, appropriate adjustments were
made to standardise costs to those applicable as at May 1979. These
costs fall into general categories as outlined overleaf.

43.
(i) TransDort Costs The constant per unit transport costs
between sources and destinations can be seen in Table 4.1. The sub-
matrices of the parent matrix designated with a letter A, B, C, etc)
define where feasible product flows of the model can occur.
Table 4.1 is similar to Table 3.1 of the previous chapter. The
distinguishing fea ture between these two table s is simpl y tha t in the
latter, actual, rather than theoretical regions have been specified,
and the list of source regions have been re-ordered.
The costs applicable to matrice s A and B of Table 4.1 are the
Ministry of Transport Area Road Schedule Charges (1979), and the
New Zealand Government Railways Class E Rail Rates (1979). Where
the inter-regional transfer s in ma trice s A and B involve dis tance s
in excess of 150 kilometres, rail rates have been calculated. This
has been under-taken to represent Government's 150 kilometre road
transport limit. In addi tio n to the rail co s t, a consolida tor's fee ha s
been included for the service involved in loading rail wagons.
To calculate intra-regional transfer costs of matrices A and B
it would have been necessary to calculate an average distance between
sources and destinations of each area. Since the New Zealand Wheat
Board must calculate this distance to determine the receipts of growers
from the Ministry of Transport area road schedules and Class E rail
rate s, it was pos sible to compute a weighted ave rage cost from a ,-
sampling of the Wheat Board's source documents which detailed this
information. Tables 4.2 and 4.3 show respectively- matri.ces A and
B. The co sts in Table s 4.2 and 4.3 are conside red to be the be st
available estimates of the costs of the transport activities represented
in these tables. The same data sources have been used to derive
representative transfer costs involved in railing wheat to North
Island mills from South Island supply regions. These costs comprise
mainly Class E rail rates, but also include £ann to rail transport

TABLE 4.2
Ayerage Transport Cost from Farms to South Island Mills
Used in Matrix A of Table 4.1
($/tonne whea t)
~ Timaru
Southland Dunedin Oamaru and Ashburton Farms Temuka
Southland 5 18 25 29 32
Otago 18 10 20 24 27
North Otago 25 15 2 6 15
South Canterbury 29 19 6 4 5
Mid Canterbury 32 22 15 5 2
Remaining Canterbury 26 24 19 15 13
Christchurch and
Rangiora
36
31
19
15
13
3
------
t-i'> (1\

TABLE 4.3
Ayerage Transport Costs from Farms to South Island Ports
Used jn Matrix B of Table 4.1
($/tonne whea t)
~ Bluff Dunedin Timaru Lyttelton
Farms Bulkship Container Bulk Bulk
Southland 10 20 29 38
Otago 20 13 24 33
North Otago 27 17 6 21 .
South Ca nterbury 31 21 3 1 7
Mid Canterbur y 34 24 5 14
Remaining Canterbury 38 28 15 5
~
Lyttelton Container
38
33
21
1 7
14
5
.f:>. --J

48.
TABLE 4.4
Railage from South Island Farms to North Island Mills
Used in Matrix C of Table 4.1
($/tonne wheat)
~rtb S th Island Wellington
Palmerston Mount
~~land ~~ North Maunganui
Farms
Southland 62 70 88
Otago 55 64 81
North Otago 50 59 76
South Canterbury 46 55 72
Mid Canterbury 43 52 69
Remaining Canterbury 39 48 66
TABLE 4.5
Costs of Transporting Whea t to North Island bv
Co ntainer Ship a
U sed in Ma trix E of Ta ble 4.1
($/tonne whea t)
~ I
I South Island Palmerston Mount Island ills Wellington
North Maunganui Ports
Dunedin Ro/Ro 50 60 75
Lyttelton Ro/Ro 29 39 61
I I I.
Auckland
88
81
76
72
69
66
Auckland
78
64
a It was considered infeasible for other South Island ports to supply directly to North Island ports by container ship.

49.
the apportioning of fLxed costs. The fuel cost associated with ship
ping along any of the nine routes can be treated as a linear cost.
These can be [ncluded tn matrLx F of Table 4.1.
Estimate s showed that pe r unit fuel cost along any of the nine
routes did not differ by more than one dollar. These costs were
ve ry low and are equal to approx£mately $1.00 per tonne of wheat.
The se we re included in the model through matrix F of Table 4.1.
Matrix G of Table 4.1 compr£ses area road schedule or Class E
rail rates for permissable transport flows from North Island ports
to North Island mills. Table 4.6 reports these costs.
The transport cost matrices A - G represent the costs of
as sembling wheat to mill s. The remaining two matrice s of Table
4.1 repre sent the delive r y costs of flour from mill s.
Rail costs are also applicable for the transport of flour from
South Island mills to North Isla'1d and also outpost South Island final
demand areas. Flour moving in bulk containe rs is railed at 1.25
time s Clas s E rail rate s. In compa ri. so n, bagged flour railed by
freight forwarders under contract is railed at rates slightly less
than Class E rates. However, extra costs are included in deliver
ing bagged flour since flour often must be bulked to facilitate
delivery. For this reason, it is reasonable to use the 1.25 times
Class E rates to estimate all flour railage costs. Although con
solidato rs I fee s for loading and unloading we re not obtained for the
study, an arbitrary 7 per cent of the Class E rate (5 per cent for
loading, 2 per cent unloading) was included to at least take account
of this cost. Therefore 1.32 times Class E rates were used to
estimate flour railage plus handling costs. Howeve r, because flour
is expressed as wheat equivalents in the model, the true quantity
of flour required by any final d,3stination will be 078 that of the

50.
solution. Therefore, it is necessary to calculate a 22 per cent dis
count on the appropriate rate, whLch equals 1.03 Umes Class E rates.
Table 4.7 shows the costs used in matrix H of Table 4.1.
The zero costs of Table 4.7 correspond 'so intra- regional delivery
costs of flour. No attempt was made to quantify these. Similarly,
no intra - region flour d,::live ry cost is levi-=d on inte r- regional flour
transfers, only a cost for the inter-regional leg of the journey is
charged.
The remaining matrlx of Table 4.1 is matrix I which repre sents
the delivery costs of flour from North Island mills to final demand
regions. In this matrix, 1.03 times Class E rail rates or area
road schedule rates have been used to estimate transport costs to
North Island final demand areas. Transfers from North Island mills
to South Island final demand regions in matrix J were assumed 'Co be
feasible.
Other marketing costs are also required for the model. These
relate to the cost functions associated with processing or hand~ing
at transhipme nt points.
(if) Milling Costs Stati stical (econometric) anal ysi s of accou:1t
ing data was made to establish the nature of the economies of scale
experienced ~n New Zealand milling. Although it can be expected
that many factors such as location, age of plant, specialisation and
;?roduct differentiation, depreciation and other accounting procedares
distort the obse rved scale effects in milling, it is possible to fit a
representative function that will show the general relationship
between cost of milling and mill size. This could be estimated from
accounting data measuring the actual cost of milling for a variety of
diffe rent sized mills. Howeve r, econometric estimation would sugge st
careful consideration must also be given to any a priori expectations

~ en"lands Southla nd Otago
Mills
Invercargill 0 19
Dunedin 19 0
Oamaru 26 12
Tiluaru and Temuka 30 16
Ashburton 33 19
Christchurch and Rangiora 37 23
~ Norm Island Island fills
Ports
Wellington
Mount Maunganui
Auckland
TABLE 4.6
North Island Port to Mill 'I'.ra.rulport Costs
.!1~d in Matrjx G of Thble 4.1 ($/tonne of wheat equivalent)
-
Palmerston Mount Wellington
North Maunganui
2 12 35
35 20 1
35 30 10
TABLE 4.7
~ort Costs fmm SQuthl§lapd Mills to Final Demand Re~iQn~
Used in Matrix H of Table-Ll
($/wheat equivalent tonne flour)
North South Mid Remaining Other
Otago Canterbury Canterbury Canterbury South
Wellington Palmers ton
Island North
26 30 33 37 50 63 72
12 16 19 23 39 56 66
0 6 1 5 20 34 51 61
6 0 5 15 30 47 57
15 5 0 13 27 44 53
20 15 13 0 23 40 50 .. =c=-_
Auckland
35
10
2
-
East
Taranaki Coast
Hawkes Bay
80 90
73 83
68 78
64 74
62 72
59 69 ~-
. -
South Bay of Plenty
85
78
73
69
67
64
_ .. -
Auckla
90
83
78
74
71
64
nd
UI I-'

~---~-- ---_ .. _-
North Island Final
TABLE 4.8
North Island Mill to Final Demand Tr..a..nsport Costs
Used in Matrix I of Table 4.1
($/whea t equivalent tonne flour)
---- -
East
Nort Palmerston Coast Demand Wellington Taranaki
Islan North Hawkes
Mills egions Bay
Wellington 0 12 17 27
Palmerston North 12 0 20 1 7
Mount Maunganui 35 30 18 20
Auckland 28 30 16 28
South Bay of Penty
35
30
8
11
-------
Auckland
35
30
11
0
---~--
Ul N

53.
which may have been established about the production process, and
the curve fitted to the data should be consistent with these expectations.
For instance, French (1977) notes that milling operations wbich
involve large capital inputs relative to labour inputs are likely to
show greate r economie s of scale; this is the case with flour milling.
Other a priori expectations relevant to flour milling may be estab-
lis ned from similar stud£e s undertaken elsewhe re. Leath and Blakel y
(1972, p. 23) report that some flour mills Cn the United State shave
an annual output of 600, 000 tonnes of flour. This is equivalent to
three time s the req uireme nts of the New Zealand population. Thi s
might suggest there is no upper limit or internal d:seconomy of
scale applicable to the New Zealand milling operation, although the
combined cost of milling and other activities certainly may create
net di seconomie s.
A common functional fonn used to represent decreasing cost
functions which do not have an upper limit, is:
where
(3 Y = a X
Y = processing cost per
a = positive constant
(3 = negative powe r
U'1.it
X = quantity of product processed.
(1)
The function form above was used. to estimate the milling cost
curve in this study. From point estimates obtained:n discussion
with flour millers and using the average marketing margin paid for
flour at I February 1978 (adjusted to 1979 prices) established by
the Department of Trade and Industries (1978) (see Append~x I)
a set of synthetic data was derived. This was used to obtain a
crude estimate of a representative long run average cost curve
(scale curve) for milling. This is reported in equation (2).

54.
M C = 275 X - • 2 5497
where MC = milling cost per tonne of wheat
X = quantity of wheat mi1led.
Equation (2) was estimated in logarithmic form using ordinary
least squares. Because synthetic data were used, the usual statist
ical tests are not valid.
Although the estimation of this function lacked the statistical
rigour required in econometric estimation, at the time, the limita-
tions of the data meant it was the best estimate that could ";)e made.
Equation (2) was used to represent milling costs in the model.
Subsequent to completing the analysis of the project, data were
received from the New Zealand Flour Millers As sociation (1979).
However, the time avai1able did not make it possible to test how
sensitive solutions were to the new function estimated using these 6
data.
The nature of pe r unit milling co sts repre sented by eql~ation (2)
can be seen in Figure 4.1.
6 Using these data a similar equation to (2) was estimated:
MC = 145X-·18578
-2 R =.89
Both parameters CJ. = 145, and S = -.18578 were highly significant. This relationship provided an estimate of milling cost which was approximately 3 pe r cent higher than of equation (2), at a milling capacity of 15,000 tonnes.
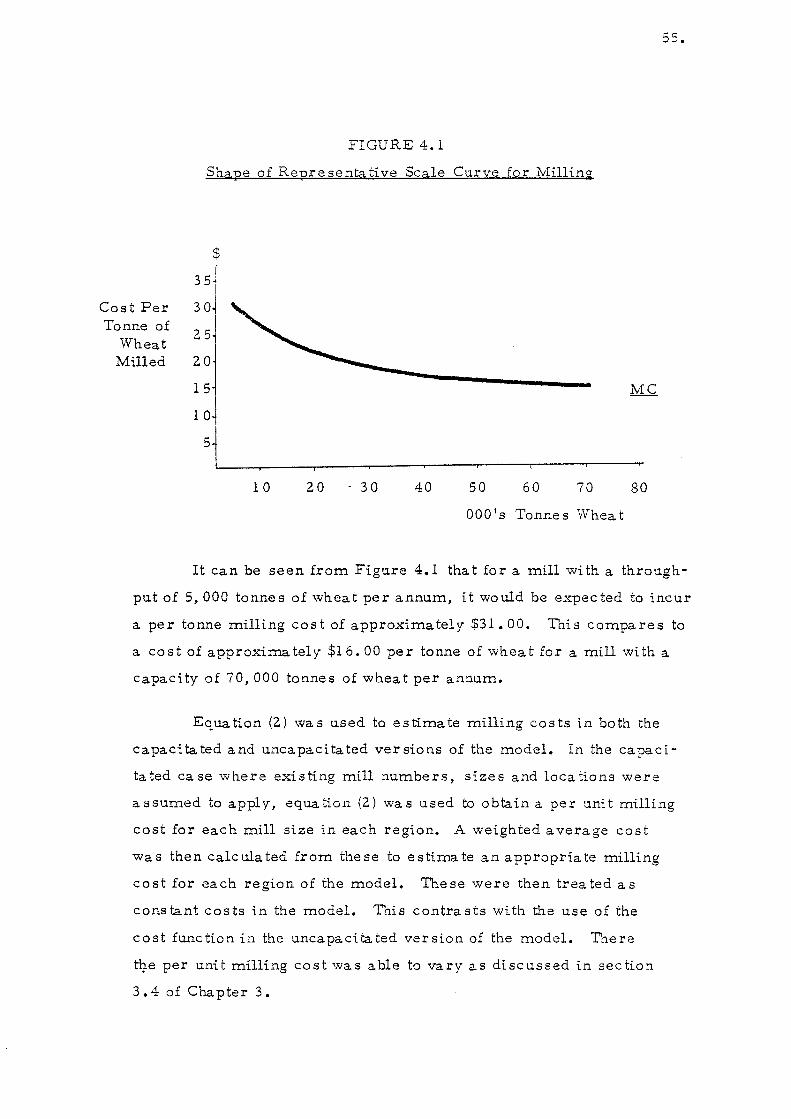
55.
FIGURE 4.1
Shape of Reure senta tive Scale Cllrve for Milling
$
351 I
Cost Per 3 O~ Tonne of 2,.1
Wheat 2 ~l Milled
15 MC
10
5
10 20 - 30 40 50 60 70 80
OOOIS Tonnes Wheat
It can be seen from Figure 4.1 that for a mill with a throllgh
pllt of 5,000 tonne s of wheat per annllm, it wo uld be expec ted to incur
a per tonne milling cost of approximately $31.00. This compares to
a co s t of approxima tel y $16.00 pe r tonne of whea t for a mill wi th a
capacity of 70,000 tonnes of wheat per annum.
Equation (2) was used to estimate milling costs in both the
capacitated and uncapacitated versions of the model. In the capaci
tated ca se where existing mill numbers, sizes and loca tions were
assumed to apply, equation (2) WaS llsed to obtain a per unit milling
cost for each mill size in each region. A weighted average cost
WaS then calculated from these to estimate an appropriate milling
co st for each region of the model. The se were then trea ted as
constant costs in the model. This contrasts with the use of the
cost function in the uncapacitated version of the model. There
tl).e per unit milling cost was able to vary as discussed in section
3.4 of Chapter 3.
56.
The major limitation to using detaiJed obse rvations from exi st
ing lnills to obtain a representative cost function, is the danger of
generalising from such a curve. For instance, the political restric
tions constraining pos si:.ble rationalisation of the New Zealand flour
milling industry may have prevented1.ew, more productive milling
equLpment from being adopted in this cou;1.try. Therefore, to extra
polate costs for a future rationalised industry based on what has
occurred in the past may be invalLd. Nevertheless, despite this
limitation and de spite the limitatio;1. introduced by the c rude data
used, equation (2) at least allow s the model to acknowledge the
presence of economies of scale in milling and their effects on the
market structure of the industry. If these are significant, it will
indicate the value of establishing a more accurate milling cost curve.
(iii) Port Storage a;1.d Handling Costs To estimate port storage
and handling costs a combination of enginee ring and accounting data
we re used. The :1977 amo rti sed construction co sts of the Timaru
port silos combined with current wharfage and handling costs for
South Island ports provided the base from which a non-linear function
of the fo rm:
where
PtC = 2.. +.Q / Y was calculated,
= constant wharfage, segregation and
cleaning costs,
.Q = fixed cost of amortised inflation
ad iusted capital, inte re st and fixed
annual operating cost, including rent,
Y = throughput of wheat,
PtC = port costs per tonne of wheat hand:':.ed.
($ /tonne).
Source: Pri_vate Transpo rt Company, 197 9b)
57.
The same 2:. and .Q coefficients we re used to compute the costs
for each South Island port and the coefficients were calculated aSSUln
ing 6,000 tonnes of storage at each locality. The estimated coefficients
are:
a = 4,
and b = 140, 000.
For Timaru, which has a current annual throughput of 36, 000 tonnes,
the equation would sugge st port co sts equivalent to approximatel y
eight dollars per tonne would be incurred. This appears a good
approximation of the costs of wharfage, handling, and other small
incidental charges applying for 1979 at Timaru.
The 2:. and .Q coefficients used to represent costs of unloading
and handling through a facility with 6,000 tonnes storage capacity at
Mount Maunganui made allowance for highe r amortised capital costs
in the.Q cost component of the equation, but allowed a lower 2:. cost
component tha n fo r South Island ports. Higher amo rti sed capital
co sts we re as sumed due to the need for unloading gea r. Thi s was
conside red to be mo re expensive than loading gear of South Island
",?orts. The lower 2:. cost represented cheaper wharfage rates as
i.ndicated in the New Zealand Stevedoring Statistics and also no cost
of segregation or cleaning was anticipated. In this situation the
coefficients used were:
a = 1
b = 200, 000.
Because there is currently no facility at Mount Maunganui, this equa
tion could not be validated, but must be assulned to be representative
of such a facility.
Cost of port storage facilities at Auckland and Wellington were
also required in the model. Here engineering data were used.

58.
The. informa tion wa s a ttained from an Auckland company which
had contracted engineers to research the possibility of establishing
a silo complex a t one of Auckland r s wharve s (Private Transport
Company, 1979b). This information revealed that construction costs
would be expensive due to piling problems a s socia ted with the proposed
site. In addition, the demand for port sites in Auckland made rental
costs expensive, suggesting more expensive vertical rather than
horizontal type silos would be required. From this information, it
was calculated that a fixed annual cost of approximately one million
dollars would be incurred in opera ting a receival port storage at
Auckland. In addition, a constant stevedoring charge of one dollar
per tonne was assumed. Although alternative sites were considered,
the Auckland study concluded these would have been located bo far
from the existing flour mills, and therefore, more expensive road
transport would be involved. The model used here doe s not contain
specific mill locations within each generallocalityr •. Because the
Auckland study abandoned the possibility of alternative sites within
Auckland itself, the potential savings of such sites cannot have been
grea t if they would not more than compensa te for additional transport
charges from more remote sites. Therefore, it might be concluded
that siting a port storage and unloading facility at Auckland might be
expensive regardless of its specific site.
No information is available on the potential costs of storage
at Wellington. Therefore, it WaS assumed a fixed cost somewhere
between the costs at Mount Maunganui and that at Auckland would
be appropriate. Since the expensive piling costs were a problem
peculiar to Auckland, it Was assumed these would not be applicable
at Wellington. However, as a main shipping centre, it WaS con
sidered that demand for port sites would crea te higher rental and
Harbour Board leases than at Mount Maunganui. In light of these
considerations, it was anticipated that a fixed annual cost of approx
ima tely half a million dollar s would be .repre sentatLve nr the costs

59.
incurred in the receival port storage facility at Wellington. It was
eXDected that wha rfao-e of one dollar pe r tonne would al so be inc ur red. t ~
All per unit port storage and handling costs have been cal
culated assuming a fixed sized facility of 6,000 tonnes storage
capacity. Although the throughput is allowed to vary, the fact that
the facilityls capacity is not, means the port cost functions are not
strictly long run average cost curves. They are, however, scale
curves that experience decreasing per unit costs as throughput
increases. Further, the 6,000 tonne storage capacity is assumed
not to constrain this throughput. This assumption is considered
reasonable, for even if anyone port was shown in the solution to
handle 150,000 tonnes of wheat per annum, this would mean the
6,000 tonne storage facility would need to turnover its whea t stocks
each fortnight (i.e. 150,000/6,000 = 25, and 25 x 2 weeks:: 1 year).
With efficient shipping, loading and unloading operations as allowed
for in the model, thi s would seem to be practical.
The greatest limitation of the port storage and handling cost
equations relate to the adequacy of the data. It has been necessary
to estimate port storage and handling costs by making several
ra ther arbi trary as sumptions. The se could very likely be incorrect
and the costs, especially at Mount Maunganui and Wellington, could
be quite different to those used here.
(iv) Shipping Cos ts Large fixed co sts and only minor va ri
able costs characterise the economies of bulk shipping. Engineering
da ta. obtained from the Shipping Corpora tion of New Zeala nd, the
Ministry of Transport and two priva te transport companies all con
firmed this fact. It was these data. that was used to establish the
annual fixed costs of operating a bulk vessel capable of shipping all
the North Island requirements of wheat from either the South Island

60.
or Australia. Tnis was assumed to be a completely New Zealand
operation using a specialised ship not designed for competition for
other bulk car goe s on the world marke t, or in New Zealand. Tne se
costs are presented in Appendix 2. Fuel costs of shipping are
incorporated in the model through matrix H. Tnerefore, the cost
curve for shipping is formulated as:
where
SC = 0./ Z
a. = fixed cos t,
Z = quantity of wheat shipped, (tonnes)
SC = per tonne shipping cos t. ($/ tonne)
For a 6,000 tonne bulk ship the annual fixed cost was assumed
equal to three million dollar s, that is a. = $3 m (see Appendix 2).
Based on the current volume of wheat transported by bulk ship, the
shipping cost would equal $30.00 per ton:1.e. Combined with wharf-
age and handling costs, this is a reasonable estimate of e'xisting (:osts.
As with the calcula tions made for port storage and handling
costs, the computed shipping cost equation assumes a fixed capacity
of 6,000 tonnes. However, because the marginal cost of building
larger bulk carriers is only small, it is unlikely tha t if a different
sized ship was required that this would substantially affect per unit
shipping costs. Only if a larger ship with spare capacity could be
used to transport alternative cargoes could the per unit average
cost of shipping be lowered. In Appendix 2 it Can be seen that even
if a 6,000 tonne bulk ship was required to ship 200,000 tonnes of
whea t to the North Island from Sydney each yea r, there would still
be spare days a vaila ble (i. e. when the ship would not be used).
Hence it would appear that a 6,000 tonne vessel places no upper
level of the economtes of scale in shipping.

61.
4.4 Smumary and Concllg;ions
In this chapter the programming matrix of the model has been
defined, the data required for the model presented, and some prob
lems of the model and its assumptions were discussed. Attention
must be drawn to the limitations of some of the data used; in par
ticular' the crude estimate required to be made for the milling
cost curve and the arbitrary assumptions made to calculate scale
curves for two North Island ports. Nevertheless, these estimates
allow the theoretical problems identified in chapter two to be
embodied in a practical model. Although better estimates for some
scale curves would engender greater confidence in the model, the
actual estimates made in this chapter do, at least, allow a complete,
if not refined, model to be built. The be nefit of a complete model
is that it allows a representation of the economic forces of the wheat
and flour industry, and the effects of the se fa rce s on the market
structure of the industry can be studied and analysed in a simultaneous
and consistent manner. The results of the model simulations which
are presented in the next chapter provi:de an indi:cation of the changes
which would take place in a mo re competitive rna rket situation.


CHAPTER 5
EL\1PIRICAL RESULTS
S.l Introduction
This chapter presents and discusses the results obtained from
experiments conducted using the model developed in the previous
chapter. Tne se re sul ts were obtained from seve ral succe s sive
runs of the model in which current policy restrictions were relaxed
until the model remained constrained only by final demand and ini tial
supply. Heuristic search procedures were applied to investigate
the solution space in an effort to discover several low cost uncon
strained solutions.
5.2 First Re sults - The Capacita. ted Problem
As the starting point of the analysis, the model was run assum
ing that the existing set of milling quotas were constraining the
activities of mills; that the current 100,000 tonne ocean shipment
of bulk whea t h.pplied; that the current throughputs a t ports were
applicable; that imports of Australian wheat were excluded; and
that final demand and initial supply (representative of a year of
self-sufficiency) were completely inelastic. Appropriately, repre
sentative costs of milling, shipping, and port handling charges
were calcula ted and included a s cons tant cos ts along with other
constant transport costs described in the previous chapter. Tne
aim of constraining the model in this fashion Was to create a mar
ket scenario that resembled the existing market in as many respects
as possible.
Not surprisingly, the solution of the capacita ted model depicted
a market structure similar to that described i.n Chapter two. While
63.

640
this is an aid in validating this version of the model, a complete
validation is not possible as some specific wheat flows cannot be
identified with existing statistics. In the solution of the capacitated
model these flows can be thought of as the expected, rather than
ac tual flow s.
By quantifying expected current flows the solution to the capaci
tated problem is at least able to give a full and consistent representa
tion of a market structure which is capable of satisfying the demands
of the market, given the existing constraints on the industry. This is
especially helpful as it allows meaningful dual cost variables to be
de rived.
It will be recalled from section 3.3 that the optimal value s of
dual variables show how the objective function would change with a
U:1.it change in constraints of the model. For the supply and demand
constraints of the model it is possible· to impute a relative marginal
value of wheat and flour at each source or destination of the model.
If it were assumed that a competitive market applied, then these
relative marginal values could be assumed to represent competitive
regional price differentials," because the forces of arbitrage would
ensure minimum transfer costs between regions in the model. Infor
mation on the competitive regional price differentials is currently
unavailable as standardised prices for wheat and flour are paid
throughout New Zealand.
The dual variables for other constraints of the model show the
amount by which the total cost would change for changes in milling
and shipping constraints. Hence, it is possible to gain an indi:cation
of the opportu:1.ity cost imposed by current polic y constraints and to
show how short te rm change s in the indust ry' s structure might lead
to lnarginal improveme nts in the market's perfo nnance.

6 S.
To show that the model is reasonably representative of the
existing industry it is necessary to validate the model by comparing
total marketing costs and trade flows of the model with known
marketing costs and trade flows.
5.2.1 Validation - Wheat Flows
Table 5.1 shows the solution obtained from the capacitated
problem. This includes the volumes of wheat and flour moving from
certain sources to particular destinations and the total supplies
from, or receivals a t, various regional loca tions. It can be seen
that producing areas supply their local mills. For example, the
Southland region supplies the Invercargill mill with 9, 000 tonne s
of wheat per annum. Two supply regions are also shown to supply
South Island ports with wheat for bulk shipping; Southland supplies
Bluff with 64, 000 tonnes, and South Canterbury supplies Timaru
with 36, 000- tonnes. All remaining wheat from South Island supply
regions moves to North Island mills by rail. For instance, 13, 000
tonne s of whea t is railed from Ashburton to Mount Maunganui mill.
On the extreme right hand side of Table 5.1 the totals supplied fro~
each production region are tabula ted. For example, Southland r s
total supply is 73,100 tonnes.
Initial destinations in Table 5.1 become secondary, or inter
media te supply origins for other marke ting stage s of the model.
For example, South Island mills are seen to supply local final demands
wi. th flour; any surplus flour from these mills is seen to be transported
mainly to Wellington, but also to other parts of the North Island and
northern South Island. The whea t supplied to Bluff and Timaru in
the first stage of Table 5.1 can be seen to be transferred to bulk
ship in a secondary stage. At a tertiary stage this wheat is trans
ferred to Mount Maunganui and Auckland ports. From there it can

Destinations
~
TABLE 5.1
Solutionto the Cap-acitated Problem
aDO's tonnes
South Island Mills I South Island Ports ---4----r---l--r---r---
~~:th:~an~:ort~~~s~~;~_~~~T F~~~~~~~B fo~~~;I __ R~;e __ g_iO_'_~~s_) __ ~~ __ ~ l ;,0 ;:: [f [f ;,0 ~ -' II 3 g ~ ~ S 't ~ q ~ ~ : z ~ 9.9 ~ ~ ::Z:M Yl ~~:::: ;; I
i::: a " ;!. s &1
Sources Q ., n ., 01 °1>3
:.> a.., til ::0;;' ;:r ., ~ tJ
:n" a :>
ttl <!!::.of < v. ~ !:J 0 n » 00"1 IUZ -- co. ~~ ~ 7-, -< ~ I ~ .... c: ~ ~ ~OPl>cn~::!. ~ (fj 5:;';:'...~;;; 0" ~~~ ..-t->C::; 'l,.
to-3 '<; ~ rc ~ ~ ~ I-O:J P ~ g n ;T C; ::r ~o () Will := :J ru 2 :::r c iOI ::; :::
Wh~at
Supply
Svuth Island Por-ts
Wheat
~ IU CII..,
;s 3 3" 0.. ;:.I c .... ;' 2 ~ S.
.. ,!:,
0" " n ~'.'l_ ;r IIJl 111' 0 "1 -o .... () s::: :l jlI:r ::::
-- ~ :0 ~:;:c:: ::: ;:J 0 ::: ~ :J I) g. I'D 0 0 .... tJ Ul ""':r '"'I 0 ..... Z I"f ~ 0 "'O:;:l ... , ~ ?: -- I ~ e. 0 ~ ~ ~ ~ ~ (~o" ~ r:: ~ g.:: :: ~ ~ ~ ~ t: ~: ~ 0 ~ -::: ;; ~ ::::- > .u I ... n- .................... "" IU _'i:J ...... .., ...... , .... <"t-su ... .., ............. ~ ~ ....... (t;:J :l:;llz-'iO~o_ 0 E tJ OM'~!::J~..,O'Q(J'Q" O~;Jr;~:JO...,. ?''"' ........ '''::s::,...:: ~ O::;:J O;J ~ ;J ..... p.. !::J ~ .... ·o...o._o 0 -...:; ;J o..P-;:t"::;""c...;J '::;" _··~ ...... ·-<;~=-;:..I.J ~
--" ",e, a "
Southland" 64 73 : i ::---::;-~" '31'- --f-- -- -- --- -- -- --- . i :-;0 ;t!luta go - ;! 3 ?" -- -- - -- r-- 2.1.----1 s"uth - ~ , ,--~- -- ---:-- -- r--,J,L---j Cankrbltry 14 36 ;0 I :-=-:'7-:...o:;::.:.J'--+-+-+""""f-' - - -- - --,-As'>burton -1.1 7 _ __ __ _ ~ 3. 43 J...7 7= I ReB",!nin" -- --- f-=' r--~ S",,:h Island 50 I ;0 I
~ 64 __ __ __ _ ~ ~', ,--, B>,," - f---' 0";',,"0 ru; !
Ro. ,,,' = . L\·tl.:lton ,"nu,,, fr- "'. I Ln","o" ,
,Ro/Ro I 17 I" . Bu!k Ship I I I ""hl.."at Sll,'pl y
,,"" Wol"",,"o , Island I 83 ""heat l\{.it:. ..... ~.lnH1.
17 17
81 Po rts M ,n.t - L~9-l_-i~--~--+---j----I--~I~ '"'''' ""M."" , ,. ~_--l-'-j---+ __ '~""w,." IO.q I J Du"edi"_~__ 4. --:31'4" I '1- I - 1 o~:~_~__ l.7 r:'1) I
3 ~- 3. , :
South 151" !rl Uills Flollr Su?ply
~
-,
:'\o=th Isl .. .,d M,lh
T.m "",ruI " ,'I , Ter: .... '..l!,a ~::t;~,~n ~h;-;-~t'-~hui~h· a~J R.ln~;(\r ..
~
\\-~ili~"~ __ 1 1 1 go Pal n1C r stO:l ~ ~~rt~l 14 ," .,
~ 1--+---1--1 +-+--jll--t-I -+---+--+--1 30 ~(;
AJ,·~la.n,:
TO TAL [l t:~,! A '\ ,) 9 123113.] I 21 ~":7~~50~~6':4":;_-':~L...J_..-J~.1-__ L..!..:~L!!~L:~_'2::!...~~~:t.:..2.::U2.-!....:!.:.~~:"""'.ll_'-1Jl-'-:u.....-:!--..:...:L-f-/..L-.J.-'U'--"-".J....L-___ _
0\ 0',

67.
be seen to move to respective mills in these regions. There it is
milled to flour along with other South Island wheat received by ran
before eventually being d,3livered to satisfy North Island dema'1.d
re gions.
The flow s of the current solution that could hot be validated
relate mainly to the rail transfers of wheat from the South Isla!1d
to North Island mills (20,000,13,900,13,000, 17,000tonnes from
Ashburton to, respectively, Wellington, Palmerston North, Mount
Maunganui, and Auckland, plus 100 tonnes frOIn Southland to Palmerston
No rth). The se transfe r s are unknow n because Wheat Board data onl y
recod.s the aggregate of inter-i.sland wheat flows by container sh.ip
(roll on-roll off) and by rail ferry. Therefore the proportion of
wheat railed compared to that shipped :n containers is u:lknown.
Also intra South Island wheat transfers are not reported by the
Wheat Board and cannot be verified. For these reasons, it is not
possible to determine how closely the flows of the current solution
resem"?le the actual flows that the Wheat Board would arrange i.n a
year of self-sufficiency, although, it is known for i.nstance, that
some containe r shipping and some rail transfer to North Island mills
from Otago does actually occur. It is also known that container
shipments via Lyttelton to North Island mills occur, but the current
cost minimising model does not include sucb. flows which suggests
that they are uneconOlnical. The model can, however, be validated
in terms of the aggregate flows using these two modes of transport.
The inter-island ran transfers of wheat shown in Table 5.1 were
consistent with the aggregate figure s reported by the Wheat Board
i. n year s of self- sufficienc y.
Other differences between trade flows of Table 5.1 and
known actual flows, relate to intra North Isla!1d and i.nter-island
flour flows. The total inter-island flour trade of the model is for

58.
46, 000 (w. e.) tonne s to be transported from the South to the North
Island each year. This is close to the actual flow of approximately
50, 000 w. e. to!lnes. However, the quantities of £lour received at
North Island de s tina tiO!lS from South Island flour mills in the model
are a t variance with actual receivals of South Island flour reported
by the Whea t Board (Annual Report 1979).
From actual receivals of South Island flour a t North Island
destinations reported by the Wheat Board (various editions of its
Annual Report) it is known tha t South Island flour is delivered through
out the North Island. In contrast, the model indicates this flour
should be used to meet the deficit mainly in the Wellington area and
that intra-North Island £lour flows satisfy other North Island deficit
regions. For instance, 14, 000 w.e. tonnes from Palmerston North
should go to the East Coast/Hawkes Bay region and 15, 000 w.e.
tonnes from Auckland to Mount Maunganui.
Despite these discrepancies and uncertainties, the total market
ing costs of the solution are close to those of the existing industry.
Possi.bly this is because rail transfer and container shipping costs
are not too di.£ferent (Tables 4.4 and 4.5), and that there LS little
scope for reducing transport costs by re-organising the flour trade
£lows in the North Island.
5.2.2 Valida tion and Ma rketing Co sts
The total marketing cost estimated for the solution WaS $19.56 m.
This comprised $13.0 m freight and handling costs, and $6.56 m.
milling costs. This is a close estimate of the total freight and mill
ing costs of the existing industry.
For the year ended 31 January 1979 the Wheat Board paid a
total of $12.96 m. for freight. This includes freight on bran aCld

69,.
pollard and al so $1. 3 m. freight on 27,250 tonne s of imported whea t.
These costs are not included as freight on equivalent New Zealand
wheat. Hence, the actual comparable transport cost may be slightly
Ie ss than $12.96 m. and therefore furthe r from the e s tima ted co s t
of the model at $13. a m. Nevertheless, this divergence is not
thought to be significant.
The actual cost of mi11ing is not as readily available as freight
costs. The latest available Industry Production Statistics (Department
of Statistics, 1977) show the value added by the grain milling industry
in the 1975-76 year to be $7.4 m. However, this aggregate includes
the value added on bran, pollard and breakfast cereals, and therefore
it is not possible to disaggregate the exact cost of flour milling from
this statistic. Appendix 1 shows the Department of Trade and Industry
calcula tions for the marketing mar gin paid to flour mills per tonne of
wheat mi11ed from 1 February 1978. Although no longer applicable,
this margin would have been equivalent to $24.67 atMay 1979.
Multiplied by the volume of wheat handled at mi11s of 287, 000 tonnes
per annum, a figure of $7 m. would be the derived cost of mi11ing.
Again, this is close to the estimated cost of the model at $6.56 m.
The fact that the estimated and actual costs are similar serves
to provide a valuable reference point ($19.6 m.) to gauge the change s
in market performance which could occur as the structure of the
industry is changed in the model. Also, if the marketing costs of
the model are a reasonable indica tion of the true social costs, the
solution to the capacita ted problem may help identify one of the
effects arising from the Government's standardised flour pricing
policy.
In chapter two it wa s show n how the high tra nsport co sts of
remo te localitie s rela tive to proxima te locali tie s represented an

7 O.
economic disadvantage to the remote region. Also, it Was suggested
that if a standardised price was paid in each locality regardless of
transport or other regional disadvantages, it would lead to a cross
subsidisation from localised to remote regions. Informa tion arising
from the solution to the capacitated problem can be used to estimate
the current relative levels of cross-subsidisation among flour con
sumers of different regions and among South Island wheat farmers
of different regions. This may be useful information for policy
makers.
5.2.3 Consumer Welfare Implications
Although the absolute spatial equilibrium prices for wheat and 7
flour can not be estimated from the existing model, regional price
differentials are produced. Regional flour price differentials for
the capacitated model are presented in Table 5.2. These show the
rela tive loca tional advantage of various final demand regions in
proc urring an additional wheat equivalent tonne of flour. The se
are the relative marginal values of flour in different regions based
on extra transfer, handling and proce ssing cos ts, but excluding
production costs of growing whea t. In as suming a competitive mar
ket where the forces of arbitrage operate, these values can be
assumed to repre sent regional flour price differentials.
The regional price differentials of Table 5.2 show the relative
marginal values of flour at various final demand regions. These are
relative to the lowest price region, Otago. For example, the relative
marginal value of flour in Southland is $19.00 more than in Otago.
This differential represents the relative disadvantage of Southland
in procurring an additional wheat equivalent tonne of flour compared
to Otago.
7 These could not be determined on account of the fact that initial production costs (supply responses) for wheat were not included in the model, nor were estimates of demand functions - these were assumed to be completely inelastic also.

TABLE 5.2
Regional Flour Price Differentials
-and Consumer Cross-Subsidisation
$/W. E. Tonne
Regional Consumer
Price a Differentials
Tax
Regions
Southland 19 32.97
Otago (South and Central) 0 51.97
North Otago 5 46.97
South Canterbury 9 42.97
Mid Canterbury 12 39.97
Christchurch (Districts and Westland 16 35.97
Nelson/Marlborough 39 12.97
Wellington (Excluding Palmerston North 56 - 4.03
Palmerston North 65 -13.03
Taranaki 73 -21.03
East Coast/Hawkes Bay 83 - 31 • 03
South Bay of Plenty 74 -22.03
Auckland/North Auckland 63 -11.03 !
Weighted Average of Consumer Price Di££erential = $51.97.
a . Negahve consumer tax = a consumer subsidy.
n.
$/ Tonne Flour
Flour Price
228.72
204.40
210.80
21 5. 92
219.72
224.88
254.32
276.08
287.60
297.84
310.64
299.12
285.04

72.
Tne area with the greatest relative disadvantage is the East
Coa st/Ha wke s Bay region. There, the marginal value of £lour is
$ 83.00 grea ter than Otago. It Can be seen from Table 5.2 tha t the
regional price differentials do not simply increase with transport
distance from the least price region. This is partly a result of the
different costs of alternative modes of transport that are used by
the Wheat Board along certain routes, and also it is a result of the
regional differences of other processing and handling costs.
The existing standardised £lour pricing scheme of Government
does not re£lect the relative regional values of £lour. The implica
tions arising from this can be observed by comparing the weighted
average of all regional price differentials, $51.97, to the respective
price differentials of Table 5.2
The $51.97 value can be used to represent the New Zealand
wide cost of distributing the £lour. This can be considered to be
the standardised price relative to price differentials. 8 It can be
seen from Table 5.2 that if thi s s tanda rdised price applied in Otago
the price of £lour would be $51.97 higher in Otago than under a
differential pricing scheme. This implies that under a standardised
pricing scheme, Otago consumer s pa y a tax which i.s used to subsi
dise other regions such as Auckland, where the differential price
is $63.00 above that of Otago and $11 • 03 above the standardised
price.
Under a standardised pricing scheme, all regions where the
£lour price differential is below the weighted average would pay
more than the marginal value of £lour in those regions,.l:Jy the amount
of the consumer taxes shown in Table 5.2. Conversel~r, those regions
8 This standardised price is such that the sum of the consun:er tax is equivalent to the sum of the subsidy paid to consumers of other regions.
73.
where the marginal value of flour is greater than the weighted
average would pay less than the marginal value of flour in those
regions, and would enjoy a negative consumer tax or subsidy.
Regardless of the actual level of the standardised flour price
relative to the differentials of Table 5.2, the current flour prLcLng
polic y of Gove rnment insulate s the market from the economic fo rce s
that the locational disadvantages or price differentials represent.
By ignoring these differentials, the standardised flour pricing
scheme of Gove rnment ope rate s as a di sc riminato r y taxation scheme
indirectly affecting the distribution of income. The estimates of
taxes and subsidies provided here show the relative (but not neces
sarily the absolute) level of discrimination caused by ignori.ng
differentials. This may be useful information for policy makers
wishing to evaluate the equity of Government1s standardised Gour
pricing p.")licy.
In the current industry it would appear that the standardised
flour price is close to the average per unit financial costs of the
industry (see Appendix 3). The price for flour effective from
I February 1979 was $270.00. Table 5.2 presents a list of flour
prices which show the marginal values of flour in respective regions
if the current standardised flour price were to be modified to reflect
regional price differentials.
5.2.4 Producer Welfare Implications
Regional wheat price differentials for the capacitated model
are pre sented in Table 5.3. These show the relative locational
advantage of various production regions in supplying an additional
tonne of wheat. These are based on extra transfer, handling and
processing costs and exclude production costs of growing wheat.

74.
TABLE 5.3
Regional Wheat Price Differentials
and Producer Cross-Subsidisation
($ /tonne of whea t)
Regional Price Differential
Producer Tax
Regions
Southland
Otago
North Otago
South Cante rbury
Ashburton
Remaining Canterbury
o 8
17
19
18
28
-14.48
- 6.48
2.52
4.52
3 0 52
13. 52
Weighted average of regional price differentials = 14.48
The regional price differentials of Table 5.3 sh.ow that the
marginal value of wheat is $28.00 per tonne more in North
Canterbury than in Southland. By implication, it is worth paying
farmers an extra $28.00 per tonne of wheat in North Canterbury
than farmers in Southland. However, under the Government's
standardised wheat price scheme, a fixed price is pai.d to farmers
regardless of their proxi.mity. If this standardised price can be
represented by the weighted average of price differentials, then
estimates of the relative producer tax of farmers in vari.ous
regions can be calculated. 9 These are also shown in Table 5.3.
9 This representative standardised pri.ce is such that the sum of the producer tax (i.e. tax times quantit;,r) is equivalent to the total of the subsidy paid to farmers in other regions.

The producer taxes of Table 5.3 imply that under a standardised
pricing scheme North Canterbury farmers are paying a per unit
tax of $13.52 to subsidi se othe r regions such as Southland, where
the marginal value is $28.00 below that of North Canterbury and
$14.48 below the standardised price. Other subsidies Can be seen
to be paid to Otago farmer s and other taxe s by farmer s in North
Otago and northwards.
Again it has been shown how the standardised pricing scheme
of Government operates as a discriminatory taxation scheme when
price differentials are ignored. This information may be of interest
to policy makers concerned with the equity of Government's standar
di sed whea t pricing scheme. However, the se figures should be
interpreted wi th caution.
It should be noted that the regional price differentials of
Table 5.3 are not competitive equilibrium prices. First of all,
production responses to price differentials of Table 5.3 are
absent because wheat supplies are assumed to be completely
inelastic; this may be unrealistic. If production responses, and
therefore supply elasticities, could be included in the model it
is likely that these would alter the levels of production in different
regions. This could lead to an alternative set of regional price
diffe rentials.
Secondly, the price differentials of Table 5.3 and of Table
5.2 are not competitive equilibrium prices because of the many
protective Government constraints and controls operating to pre
vent competition occurring in the industry. For instance,) the
fact tha t the throughput of bulk shipping is limi ted to 100,000
tonnes and that Bluff is restricted to supply 64, 000 tonnes of
this, may expalin why extra wheat in Southland has less value
than wheat in Mid Canterbury. Des-l?ite the fact that bulk shipping
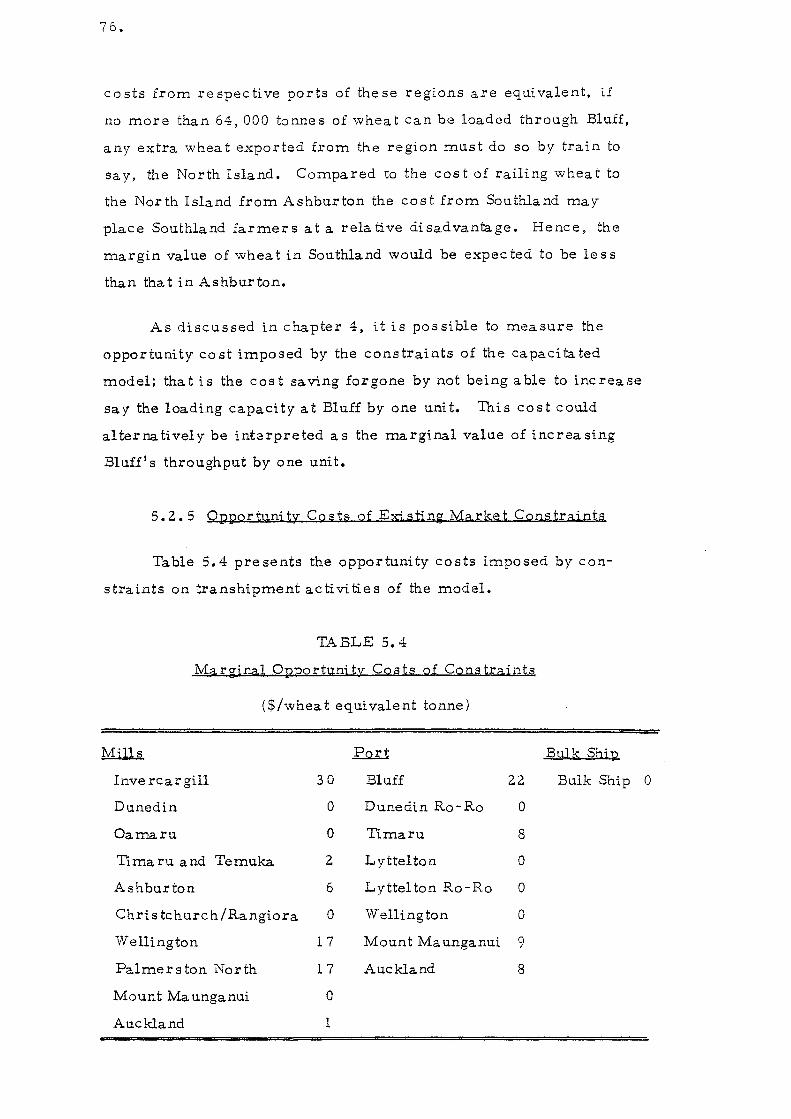
76.
costs from respective ports of these regions are equivalent, if
no more than 64,000 tonnes of wheat can be loaded through Bluff,
any extra whea t exported from the region must do so by train to
say, the North Island. Compared to the cost of railing wheat to
the North Island from Ashburton the cost from Southland may
place Southland farmers at a relative disadvantage. Hence, the
margin value of whea t in Southland would be expec ted to be Ie s s
than tha t in Ashburton.
As discussed in chapter 4, it is possible to meaSure the
opportunity cost imposed by the constraints of the capacitated
model; that is the cost saving forgone by not being able to increase
say the loading capacity at Bluff by one unit. This cost could
alternatively be interpreted as the marginal value of increasing
Bluff's throughput by one unit.
5.2.5 Opportunity Costs of Existing Market Constraints
Table 5.4 pre sents the opportunity costs imposed by con
straints on transhipment acti vi tie s of the model.
TABLE 5.4
Marginal Opportunity Costs of Constraints
($/wheat equivalent tonne)
Mills J:.Q..tl Bulk Ship
Inve rcar gill 30 Bluff 22 Bulk Ship
Dunedin 0 Dunedin Ro-Ro 0
Oamaru 0 Timaru 8
Timaru and Temuka 2 Lyttelton 0
Ashburton 6 Lyttelton Ro-Ro 0
Chris tchure h/Rangiora 0 Wellington 0
Wellington 1 7 Mount Maunganui 9
Palmerston North 17 Auckland 8
Mount Ma unganui 0
Auckland 1
0
77.
The figures of Table 5.4 serve as an indication of the marginal
value of removing current constraints (or alternatively the marginal
opportunity cost currently imposed by these constraints). These
values suggest that increased bulk shipping with extra loadi_ng at
Bluff and Timaru, and unloading at Auckland and Mou:-lt Maunganui
may lead to cost savings. Also, increased milling in the lower
North Island might lead to cost savings, as might the increased
milling in Ashburton, and to a less extent, Timaru/Temuka.
Inc rea sed milling at Timaru/Temuka might re sult in a co st
saving because flour from these regions supplied to Wellington
might save transporting flour from the more remote Dunedin mill
to Wellington. However, as with all these marginal values, the
ceteris paribus assumption upon which they are based means their
relevance will only hold for very small changes. If Wellington
milling capacity was increased enough, flour from Timaru and
Temuka may no longe r be required which could cause the extra
output of these mills to have zero marginal value. Alternatively,
dropping shipping constraints may dec rease the value of wheat
at Mount Maunganul mills. Then the marginal value of additional
milling capacity might be high compared to its present zero value.
The mar ginal value of $3 O. 00 at Inve rca rgill mill onl y applie s
in a downward direction. That is, a decrease in milling capacity
of one tonne at Invercargill would increase costs by $30.00. An
increase in milling capacity there would not lead to a cost saving.
This is caused by limitations imposed from other constraints.
Despite the uncertainties of interpreting the figures of Table
5.4, the fact the constraints are shown to cause opportunity costs
to the existing industry demonstrates that it may be worthwhile to
examine the effects of removing constraints in the model.
78.
Further, the fact the economies of scale in milling and shipping are
possible, complicates the interpretation of the marginal values of
Table 5.4. This occurs because, for ~nstance, each addCtional unit
of milling allows a mill to experi.ence decreasing per unit costs.
Only the solutLon without the current constraints, and where scale
effects are represented, can determine exactly which regions and
activities of the industry should increase or decrease in the long
term. By identifying where short- run costs occur and by studying
long-run solutions of an unconstrained industry, it is possible for
polic y make r s to see how to move from the sho rt - rU::1 to the mo st
efficient long- run situation.
5.3 Inc rea sed Bulk Shipping Capacity
In allowing an unrestricted flow of wheat to be transferred to
the North Island by bulk ship, it was also necessary to allow an
unrestricted amount of wheat to move through port storage facilities,
including the proposed receival port faciJities at Auckland, Mou::1t
l\Ilaunganui and Wellington. 1 0 Accordingly, capacity constraints
were lifted and the shipping and port activities of the model were
allowed to handle any quantity of wheat at the cost dictated by thei.r
respective long-run ave rage cost curves. The Stammer heuristic
search technique was used to analyse the effects of economies of
scale in these activities. At this stage no attempt was made to use
the force routine of Higham, et. al. (op cit). All other activities
of the model were assumed to be constrained as in the first run.
10 As discussed in the previous chapter, additional storage was considered necessary to hasten u:lloadt.ng and to provide security of codinued supply of wheat to North Island mills.

79.
5.3.1 S?lutiQn Numbe r Two
The best solution obtained using the Stammer method, produced
a total cost to the industry of $17.7 m.; a saving of $1.87 m. over
the solution 0 btained in the comple tely capaci tated problem. Thi s
solution is shown in Table S. S.
The saving of $1.87 m. arose from the increased economy
a ttained in the transport of an extra 64, 000 tonne s of whea t to the
North Island by bulk ship. PreviouslY1 this had been transported
by (fail which is a more expensive. means of transport.
The extra volume of bulk shipping enabled economies of
scale to be exploited in this shipping operation, lowering the cost
per tonne from over $3 5.00 (on 100,000 tonne s of whea t) to $18. 00
per tonne (on 164,000 tonnes of wheat). However, part of this
.benefit was eroded by the additional cost of establishing and running
extra unloading and storage facili tie s at receival ports. The total
costs at loadi.ng ports did not change significantly, although their
relative cost was altered owing to the change in relative volumes
handled a t each port.
The volumes of wheat handled at ports in the solutions of
Table 5.1 and 5.5 are summarised in Table 5.6
It can be seen from Table 5.6 that the increased tonnage of
whea t transferred to the North Island by bulk ship is loaded mainly
at Timaru. This increased by 61,000 tonnes over the volume in
the solution to the capacitated problem. Bluff increased its load
ing by 3,000 tonnes. The volumes of wheat received at North
Island ports increased in accordance with that necessary to fulfill
the milling quotas in each region, and replaced the receivals of
whea t tha t had previously arri ved by rail.

Desti nations
Sources '\.
Southland P;~g0
Whoat . :orth Otag'> Supp!)' South
Cante rlHlry Ashb!lrt'J:l Remaining S')uth Island el'J:f
~;~:" South I sla ~d Tlmaru Ports L;tt{:lt-~ Wheat L-.-:telton
IR~/Ro Bu!k Ship
V;h'!at SIl??} Y ~~-Qri~~
lslac.cl ',l:elHn:::;ton
Y0 rtf.; 1.1 ...... ~1 '. t V: .... eat ~1a·; -.r:.!. nUl Su?ply A~l"'.;'-l~;~
In" .. ': r( a.r~jll
S""th ~i.j;;~.:T;-;;----
lsl"".l Oa':;;;~l---
~~i1l5 11\;;:;'~-"nd-F] 0'..1 r T~!!1_u.!_~ __ ~ __ So?pl y A5hbl1:-t'1~
(~;::~ btc-h-~-r~h
a;:;~l Ra:1:7:o:-a
'Sorth. I:::'~lli n~'0:: ____ l.Iand Palmerst0:1
M'.Il. ~:o!"th
Fl?ur !~10U:-,t
S-.1?):Y , ~1;-ill.,;?an\.l1
, Au("~lar.d
TOT AL DEMA)lD
;'
I ~ " .. ... '" --
9
South Island Mill. -{- South Is]an'] Ports ~ I I I ,-r --r-rT-r-
~ ()
>-j ~ ".. - ., o-J~
)-~ ;;. r '" t'"
0 0 :r " ~ 0 o-J '<
" " " ... cr " n :U" ii ~ ;:; 3 3 " " .,., :r
o " :u~
c ., -. " !2l --" o " "- .. " '" 0 o ... :ue-
.. ::; ---., )<,,, ., n §: ... 0 :uo " " ., "- " I\> :r o " " " o " ----
67
0.1 14 2
50
19 7 2 47 1---
50
TABLE 5.5
Solut.ion Number Two
000 I S tonne s
I Norlh Island Ports iNorth Island Mills -T--'- --- -- --
'TJ B:: B:: ., 0 g- o
" " ~ " " ... ~
IJ:l ~ ~ c:::
"" ~
"" " ., )- " 0 ., )-t'" - - " " " :><: - " " - " " " n Z (JQ i:!: {Jl t' .. c: " 0 ., :J: ... .,
" "" ., "
., IiJ 0 t'
is. 0 g: 9. t'
" 9. " "---I- -
. -...,--i-i_ e--
.- - - ---
67 I--- .. - i-,- -
97 ....:..-.,,--
34 30 100
.. 2L 14
30r
100
(Jl <>
" g. ;; " "-
9
--.. -
-
9 hlL]41~J 7 52 67 1~~L I __ 164f~ 30 1100 \ 30 114i30! lod, 9
Final Demands for Flour (All Regions) .------r--
if (Jl 'd () e.
" " g: 3 ;r on B:: " ., z ~. :r ... :::M g> " 0 n 0> ... ., z ::E co ., .. "- ., ., :.- ~ -.
... " 0 'Ii '" " ~ .. ~~. ~ g:~ " ..., g:
S' :r " .. x-~ ()
" c' " n n ... " () :g'::ol " 0 g ., "
.. ~ :r ci " " Z .. .. 0
t' ... cr :! ... " " "" 0 g 1J:l~ " .. ... ., " " p;"~ ... " .. 0 ... ,,'<
""" GO .. 0 5. " 0 ~5. g: x- I\> ... ... 0 e.o 0 '< " o.:r " ~-
'< -- '" ....
14 _1. '---1 :,li _ --3 '+ __ 4 -
4.4 16~ -- -- ---- --2.7 .,. ..
--34 10 81
I 20
14
30
15
14 4,4 12.7 34 10 I 55 -1 I 4 17 45
z 0 ., )-
~" :r " >C: " .. " :J ~.::... .. .. " " a.;::..
85
83
;:)
c::: -' 3::: ci ;;: -,
-< > , ::: ~":
i -> Z ~
:::; -< 76
')(1.1
10
~t1
I---
-~ i---
6- I ~ I ~
<) ..... I
-------' I I
lt4J I
~ ,~ I ~ -,-
, , I !("·L
1 • t
! I
I ~
o~ j --~
1 ..
30
iO;:
00 o

81..
Dropping the shipping and port constraints also caused change s
in some intra - South Island whea t and flour trade flow s, and inter
island flour trade flows. By comparing Table 5.1 with 5.5 it can
be seen, however, that these changes were not great.
TABLE 5.6
Volumes of Wheat Handled a t Discharge
and Rec eiyal Po rts
(tonnes of wheat)
Unconstrained
Loading Ports
Bluff 67,000
Timaru 97,000
164, 000
Unloading Ports
Wellington 34,000
Mount Maunganui 30,000
Auckland 100,000
164,000
Co ns trained
64,000
36,000
100,000
17,000
83, 000
100, 000
The overs.ll realloc:ations of whea t and flour shipments did not
alter the regional flour price differentials. These did not change
because flour is delivered to final demand regions from ba sicall y
the Same mills as previously, and the opportunity costs of deliver
ing from alternative regions are also much the same despite changes
in the regional wheat price differentials.
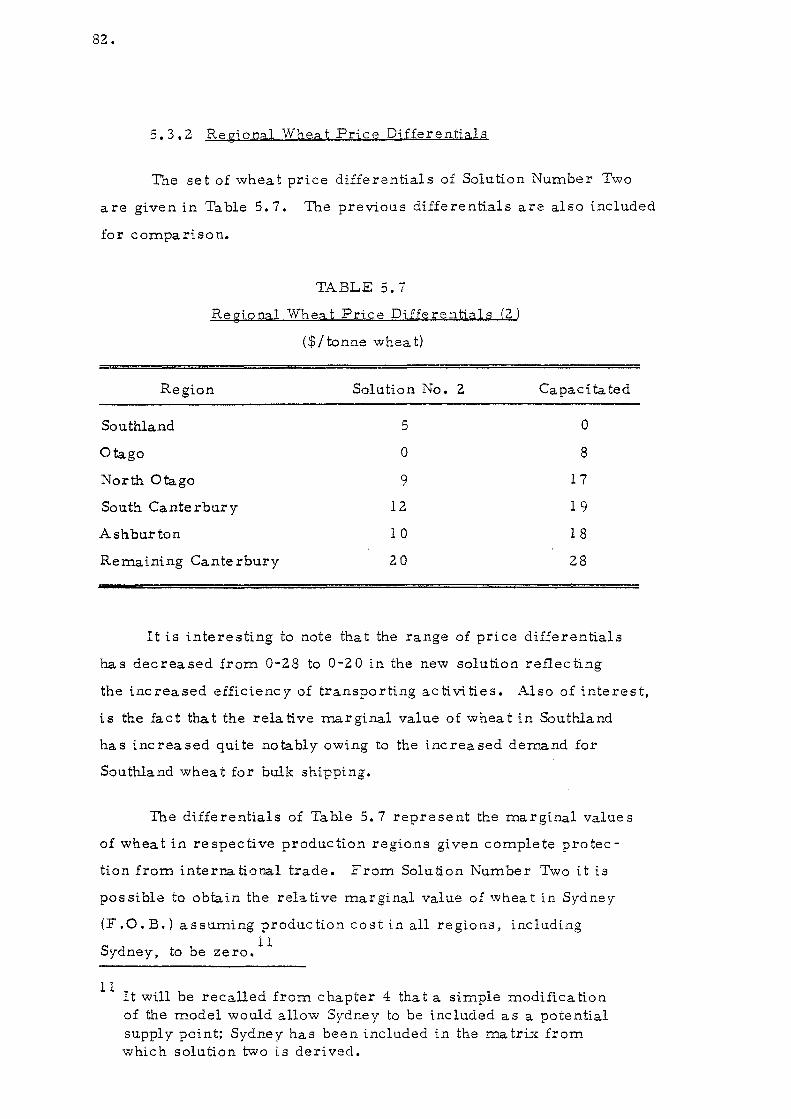
82.
5.3.2 Re gional Whea t Pric e Di fferentials
The set of wheat price differentials of Solution Number Two
are given in Table 5.7. The previous differentials are also included
for comparison.
TABLE 5.7
Regional Whea t Price Differentials (2)
($ / tonne whea t)
Region Solution No. 2
Southland 5
Otago 0
North Otago 9
South Canterbury 12
Ashburton 10
Remaining Canterbury 20
Capaci ta ted
o 8
17
19
18
28
It is interesting to note that the range of price differentials
has decreased from 0-28 to 0-20 in the new solution reflecting
the increased efficiency of transporting activities. Also of interest,
is the fact tha t the rela tive mar ginal value of whea t in Southland
has increased quite notably owing to the increased demand for
Southland wheat for bulk shipping.
The differentials of Table 5.7 represent the marginal values
of wheat in respective production regions given complete protec
tion from interna tional trade. From Solu tion Number Two it is
pos sible to obtain the rela ti ve mar ginal value of whea t in Sydne y
(F.O. B.) assuming production cost in all regions, including
Sydney, to be ze ro. 11
11 It will be recalled from chapter 4 tha t a simple modifica tion of the model would allow Sydney to be included a s a potential supply point; Sydney has been included in the rna trix from whic h solution two is derived.

83.
5.3.3 Opportunity Cost of Import Controls
The relative value of wheat supplied from Sydne y is $2 O. 00
and therefore it is $20.00 above the margLnal value of wheat in
Otago. A major reason why this value LS high relative to the South
Island regions LS that the wheat is assumed to be purchased F.O.B.
The cost of shipping from Sydney to New Zealand therefore does
not include farm to port or loading cost in Australia. This implies
that if quantitative controls on imports of Syd~1.ey wheat were redllced
by one unit, a $20.00 saving in marketing costs could result from
importing one tonne of wheat. It should be noted that the marginal
value of wheat in Sydney would be expected to decline if extra units
we re imported.
The $20.00 marginal value of wheat in Sydney (F .0. B.) holds
important implications for the relative wheat price in different
regions of New .?:ealand. The i.mplied price differentials of South
Island regions set relative to Sydney are presented [n Table 5.8.
TABLE 5.8
Regional Wheat Price Differentials
Relatiye to Sydney
Region
Southland
Otago
($/tonne wheat)
North Otago
South Canterbury
Ashburton
Remaining Cante rbur y
Sydney
-15
-20
-11
- 8
-10
o
o

84.
The relative pri.ce dLfferentials of Table 5.8 are the amounts
by which the price in South Island regions would ~eed to be below
the Sydney F .0. B. price to prevent wheat imports entering New
Zealand at lower cost. This is assuming an unrestricted entry of
Australian wheat and assuming a completely elastic wheat supply in
Sydney. The differentials show that Sydney is a highly competitive
supply point. For this reason, an experiment was conducted where
the model was ru~1. in the absence of the quantitative import control.
The results of this run showed that if the full 164,000 tonnes of wheat
shipped to the North Island in Solution Two were instead procured
from Sydney, total industry costs could be reduced to $15.8 m.
Compared to Solution Two, this represents an additional saving of
$1. 9 m.
All wheat delivered to the North Island in the modified model
came from Sydney because prices of wheat at Sydney F .0. B. and 12
at South Island regions F.O.R. were assumed equal and fixed.
If such a change were to actually occur, however, the price of wheat
in South Island regions would decline as farmers sought to compete
against Sydney's supply advantage. This would lower the relative
marginal value of wheat in Sydney (or perhaps more und,erstandably,
lower the relative opportunity cost of not importing wheat from
Sydney). At the lower South Island prices, South Island farmers
would still be prepared to supply wheat, but probably at reduced
quantities. The South Island price and quantity of wheat would
continue to decline until the Sydney (F.O.B.) price plus marketing
costs to say Auckland was equivalent to the discounted South Island
price plus respective marketing costs to Auckland. Under these
circumstances Auckland could be supplied from both Sydney and
12 This LS a reasonable assurnptLon based on a ministerial comparison of New Zealand F. O. R. price s and the price spaid fo r Imported Australian wheat.

85.
South Island regions. Savings in marketing costs would result from
the importing of additional wheat from Sydney, while savings in the
form of reduced costs of purchasing discounted wheat would result
from purchases of New Zealand wheat. In this internationally com
petitive situation all New Zealand prices would respond to changes
in the international wheat price (F .0. B. Australia).
It is not possible to determine full spatial equilibrium prices
and quantities from the existing model because respective supply
functions of the production regions are not included in the model.
Also, because there are non-linear shipping and port costs and,
therefore, the possibility of several alternative local optima, it
is unlikely that there would be an unique set of spatial equilibrium
prices and quantities. Nevertheless, information of the type
reported in Table 5.6 may be of interest to policy makers concerned
with setting the New Zealand wheat price. This information may
be useful for it shows that the total industry costs could be reduced
if New Zealand regional (F. O. R. ) wheat price s we re set according
to the marginal value of wheat in these regions relative to the
marginal value of wheat F.O.B. in Sydney and therefore made
competitive.
Additional competitive forces that co uld be included in the
model are those relating to milling. Currently, milling quotas set
by the Wheat Board prevent competition among mille r s. The
marginal opportunity costs of milling quotas given unrestricted
transport patterns are available from Solution Two.
5.3.4 Opportunity Cost of Milling Quotas - Shippil.JZ..
Constraints Absent
Table 5.9 presents the marginal opportu!lity costs of milling
quotas for Solution Number Two.

86.
TABLE 5.9
Relatiye Opt'ortunity Costs
of Milling Quota~ (2)
Regions $ /Whea t Equi valent Tonne
Invercar gill
Dunedin
Oamaru
Tima ru and Temuka
Ashburton
C hri s tc hur c h / Rangiora
Wellington
Palmers ton North
N10 un t Ma unga nui
Auckland
17
o o
2
6
o 13
12
31
18
The marginal opportunity costs of quotas on North Island
mills in Table 509 suggest that at least small increases in North
Island milling capacities would lead to significant reductions in
costs. The potential savi.ngs are explai.ned by two factors. Firstly,
milling is cheaper in the North Island than in the South Island
because of the larger mills currently operating in the North Island.
Secondly, gi. ven that there are no re strictions on transporta tion in
the model, increased milling in the North Island would allow bulk
shipments of wheat to be substituted for currently more expensive
rail transfers of flour from South Island mills to North Island
final demand areas.
A third set of forces not accounted for in the opportunity
costs of Table 5.9 are the potential economies of scale in ship-
ping and milling. The se repre sent longer tenl1 economic re sponse s.

87.
Marginal measurements 0 nl y measure small short term change s.
As a res.ult, it is possible that the long term value of increasing
the Palmers ton North milling quota for example, may be nega tive,
while the short term marginal value is $12.00. If the Wellington
milling capacity alone was increased instead of both Wellington 13
and Palmerston North, total milling costs for the combined out-
put of both may be less. Therefore increasing milling in Palmerston
North rna y in the longer term prevent Wellington reali sing its full
economy of scale and thus expanding Palmerston North milling would
ha ve an opportuni ty co st in the longer term.
Only by running the model in the absence of milling quotas
and allowing milling alloca tions to adjust according to the e stima ted
long-run average cost curve of this processing operation would it
be possible to estimate the importance of these factors.
5.4 Ra tionali sation and Milling Ca pa citie s - Solution Number Three
In the version of the model first used to analyse the rational
i sa tion of milling capaci tie s there were no constraints on milling,
shipping, loading or unloading. However, to simplify the analysis
imports of Sydne y whea t were fir st re stricted to zero and scale
effects in milling were assumed absent. This was achieved by
retaining milling costs at their previous fixed levels.
Table 5.10 summarises the results of the third solution.
From the results to the ini tial ver sion of this virtually uncapaci
ta ted problem it became a ppa rent tha t substantial co st reductions
could be made by further centrali sing the transport opera tion
of the industry. Thi s re sul ted from shipping whea t for milling
instead of flour to the North Island.
13 Wellington and Palmers ton North are "geographically close ".

88.-
The minimum cost solution obtained using the Stammer
method gave a total cost of $15.44 m. representing a saving of
$2.26 m. over Solution Number Two.
The saving of $2.26 m. arose from transporting an additional
46, 000 tonnes of wheat to North Island mills by bulk ship. Previously
the equivalent flour had been transported to the North Island by rail
from South Island mills.
The inc rea sed bulk shipping of Solution Three allowed greater
economies of scale to be achieved in bulk shipping and at unloading
ports. Bulk shipping increased from 164, 000 tonnes in Solution Two
to 2 04, 000 tonne s in Solution Three. Thi s reduced per unit shipping
costs from $18.00 to $15.00. Per unit unloading costs at Wellington
reduced from $16. 00 on 34, 000 tonnes to $10. 00 on 53, 000 tonnes,
and at Mount Maunganui costs reduced from $8. 00 on 30, 000 tonnes
to $2. 00 on 151, 000 tannes.
The unloading of Auckland r s milling whea tat Mount Maunganui
accounts for the higher volume handled at tha t recei val port. As
di scussed in the previous chapter a port storage and unloading
facility at Auckland could be expensive compared to a similar
facility at Mount Maunganui. Solution Three indicates that because
of the greater economy of scale achieved by unloading the full
151, 000 tonnes of wheat at the cheaper facility, the extra cost of
transporting wheat to Auckland from Mount Maunganui is prefer
able to the cost of unloadi.ng 85, 000 tonnes of wheat at Auckland 0
Other cost savings resulting from Solution Three involve
milling costs. Regardless of the potential economies of scale,
current North Island per unit milling costs are estimated to be
less than South Island costs because of the la~ger average
size of mill. If it is as sumed tha t current North Island mills could

South Island Mill. South Island Ports
Destinatioas -- ---'----'-"-r-~ >-l
TABLE 5.10
Solution Nurnbe r Th ree
OOO's tonnes
NorthIsland Portsrorth Island Mills/ Final Demands (or Flour (All Region.) --~-----T -----T--r--.---~~_;__-r__._---__,____y___r___. ~I-----.c_·--_r----~
I:: o
'" ~ ;,0 I:: ~ 0
3 '"
(Jl o
~ (f) o ~ or
'"d ~ 3 D ., .. :t~
" "
z o c: 3:: 3':: -<
-1
~ > :-
Sources " .. °IO[.J .. ()
" ;T ).0. o..~.
"' "'"' ;T .. ~ t"' gjiU I:: <[~ ~ ~~' ~f";z
tJ >-ll~ '< ~ 2. su ).. ~? IU > ~ p.. ::t ~ ~ !; -,. ~~. ~ 2l J t ~ 3' [ g; ~ ~ ;: ~ ~ ~ ~ ~ ~ ~ ~ 0 ~ ~ ;;: ~ ~ ~ g- ~ ~
0" ..., ~ ~ g> \1 ~ c :r "': :T > c: ~
~ ~ ct '1 c:r " n '" ",;T
" ~ ~ () " .. ~ :J ~
?::
y,uthJana
g 3 3 '" P.. ~ c j:.i _. "1 ;:;:J :J C su p..
>-s ...... ~ ~ 0 '1 o .. n ;J ;a::r
~ ~p.. III ...,. -..~::r: (JQ ~ aq 0 p.I ~ - ~- _ 0'" ~ ..,.tD" d;l :J
----.------~-;t___l-t_t 1 ~ 0;' 2 g 5' g ~ g s. ~ g ~ s. i i ~ ~ ~ ~ [~~ ~ ~ ~, i I __ __ _ !..... ... a.. c..;;r ;::r c..' ::J
67 '
(l .. .. " :::
~ '1 ;r
" • 0 :J Ill" ~ ~ ~ .... "< .......
:!i;.:' <>-< ~o
-< ...
C:::. .. " " " Co a.
> Z :::J
2 -<
Wheat Su;>ply
South 'Island Ports Wheat
~:)' a go ~;orfF~tago
SQuth <;:ante rbtlry AshburtQ!l f{em<l: ni ng
South Island
9 14
3
6.1 \3
50
4.412.7 67.
44
--t-- 7" ZO.1
- -:--f---/--t- :" 30
6
f ---+--+--I--l --- t---f2W
50 I Biu;f fIT: 1 I Fl I I A73.1-UUr.r.!'ll n ."-- "- --
P..c)/Fo . _----.1
~ ~ ~'~o' Tlm~:...u___ ~ . L~·tt(:~tO:1 .....-- .
ILytteit":1 6 j
Rol Ro 2 4 --.;
" ' r I 04 I Bulk -'''p 53 151 i '.·;}-.~at S'l?;,l Y .-----l
~;orth ~- 53 ~ I I 'la r1 -.·:~!11-i.n~t0n f- .. -------l
Porfs M')u-;t---- 1 1661 85 l:;l : .... I;r,eat Su??1 y
So>th 151a~,d
}'Hlls FlruT Supply
;';orth ! 8' Ci ~,d
M'lI.
},:!<1'l'1ganui A'.]c;':-j;-;'1---
In·.'r:rC:3.rg~ll
5;-;~ '-n-----6;rr;a:--u--
Timaru and.-
Tem:Jk~J. --- -------P. ", ... , h'l r to') n
Ch~i~tcr~~.l-;"ch a:d Pant'" ora 1·I~llir.gtr);)
lPalrr,r;Tst.on I ~:orth
Flo 11 r I ~ .. 10U:1t ~:!?;)!y },.~::u-::ra.nu1.
Aucidand
9 --. r-
14 I
~ _I
Q
I~
----\ ~----j-- -i-- --f---+-I --t--t--+--t-----j---+ ~--l---j ---+-~-
2. •
34 1 10
55
4
-I
-1.-1
441 -'2-j { I
~-1I-+-t--t--i 17 43 <-0
lOT AL D E~ A '>0 2..'; 44 73.! 6 :<'.~Oj1_~5~3-.L1...!.1':5:'1 .J..._.l..~'-I..i.~~J!1i.:lL.!.!.L~~~~-!L--'~-'-~'-.2.:~.L~W~~.L.:!..:!..~~-1.._-'-_--.J
co '.\)
9 o.
expand or contract according to the throughput levels of Table
5.10 without altering their production costs, 46,000 tonnes of
wheat could be milled in the North Island more cheaply than in
the south.
From Table 5.10 it can be seen that the expansion of the
Wellington milling quota to 55,000 tonnes per annum and of the
MOI~nt Mau::1ganui quota to 66, 000 tonne s has re sulted in both
islands being self-sufficient in the milling of flour. Many regions
are also self- sufficient in flour production. In the South Island
the only intra-island regional transfer of flour is for 10,000 tonnes
to be transported to the Nelson/Marlborough district. In the North
Island intra-island regional transfe rs from Mount Maunganui occ ur.
All othe r regions of the model are self- suffic ient in flour production.
The new market structure of Table 5.10 would cause changes
in both the regional flour and wheat price differentials.
5.4.1 Regional Flour Price Differentials
The final demand regional flour price differentials of Solution
Three are presented in Table 5.11. The previous differentials have
been included fo r comparison.
From Table 5.11 it can be seen that the relative marginal
values of flour have declined in most final demand regions in mov
ing from Solution Two to Solution Three. The ove rall range of
values can be seen to have declined from $0-$83.00 per wheat
equivalent tonne down to $0-$51.00 (East Coast/Hawkes Bay). The
only regions whe re the relative marginal value s of flour would
increase are in North Otago and South Canterbury. These increases
can be explained by a complex chain of changing demands for wheat

Regions
Southland
Dunedin and Di stric ts
North Otago
South Canterbury
Mid Canterbury
Chri ste hurch/Di stric ts and Westland)
Nelson/Marlborough
TABLE 5.11
Regional FIQur Price Djfferentials
(Solution 1bree)
($/whea t equi valent tonne)
Solution No.
Regions 3 2
7 19 Wellington (Excluding
0 0 Palmerston North
10 5 Palmerston North
12 9 Taranaki
11 12 East Cost/Hawkes Bay
South Ba y of Plenty
13 16 Auckland/North Auckland
36 39
3
Solution No.
39
50
49
51
39
36
2
56
65
73
83
74
63
'.!) .......
92.
and flour but are also a result of an increased demand for wheat
required for bulk shipping from these regions. It might be con
cluded that milling quotas, by lowering the demand for wheat in
these regions in Solution Two, served to give these regions an
artificially lower relative disadvantage in procurring their extra 14
tonne of flour (compared to Otago). In contrast, all other regions,
except for Otago, experienced artificially high locational disad
vantages in Solution Two (relative to Otago) due to milling quotas.
Table 5.1 I shows that the quotas caused marginal values of
flour production to be most distorted in the North Island. In the
South Bay of Plenty region the locational disadvantage can be seen
to decline from $74.00 per tonne with quotas down to $39.00 with
out quotas. The range of South Island regional wheat price differ-
entials also narrowed.
5.4.2 Regional Wheat Price Differentials
Table 5.12 shows the new set of regional wheat price differ
entials for Solution Number Three. The previous differentials are
included for comparison.
The relative marginal values of South Island regions increase
in Table 5.12 as a result of increased demand for wheat at the ports
to which these regions supply. The increased demand is a result
of the additional 46, 000 tonne s transported by bulkship.
14 It must be remembered these regional advantages and disadvantages are concealed by the standardised flour price in the current market.

93 .•
TABLE 5.12
Regional Wheat Price Differentials
($/ tonne whea t)
Solution No. Region
3 2
Southland 10 5
Otago 0 0
North Otago 14 9
South Canterbury 17 12
Ashburton 15 10
Remaining Canterbury 17 20
Sydney 22 20
The decline in the relative marginal value of wheat in Mid
and North Canterbury is a result of the relatively high cost of
transpo rting 6, 000 tonne s of surplus wheat from this region.
Previously the milling quota of this region had created artificially
high local demands for wheat which meant that 2,000 tonnes of
wheat were actually imported into the region.
The inc rea sed marginal value s of whea t in South Island
regions supplying to either Timaru or Bluff are the Cause of the
increase in the marginal value of whea t in Sydney. These increased
values of whea t in South Island regions represent an additional
cost of not importing wheat from Sydney. By dropping the import
constraint to estimate the net cost saving of forcing New Zealand
pri.ces to be competitive with Sydney prices, total industry costs
were reduced to $12.7 m. This represents an additional cost

94.
saving of $2.7 m. over Solution Three. As discussed previously,
although dropping this constraint is valid for calculating this
specific piece of informa tion on co sts, the model Can not determine
what might be a rational market structure because the model does
not embody production costs of growing wheat in different regions.
Consequently, it is not possible to calculate the long run proportions
of Sydney and South Island whea t tha t should be supplied to the North
Island. For the Same reason it is not possible to calculate useful
dual informa tion from such a model.
5.5 Rationalisation and Scale Economies of Milling
Because of the limi ted informa tion tha t Can be attained when
the import constraint of the model is dropped, this was reintroduced
to the model to study the effects of non-linear milling costs.
The introduction of non-linear milling costs to the model
meant that several, if not many, local optima solutions might
exist. Although previously non-linear shipping and port handling
costs were introduced these did not create any apparent alterna
tive optima problems. 15 To take account of the problems intro
duced by non-linear milling costs, the Stammer method was used
in conjunction with the forcing technique of Higham, et. al. This
made it possible to examine several low cost solutions.
From the several low cost solutions generated using this
version of the model, it became apparent tha t furthe r cos t
reductions could be obtained by centrali sing the milliItg opera tions
of the industry. This highlights the dispersed and fragmented
struc hire of the current industry.
15 ' One exception was the possibility of loading enough Ashburton whea t through Lyttelton to aC hieve sufficient economie s of scale in bulk loading there. Tnis may have allowed 6, 000 tonnes of wheat otherwise shipped in containers to be shipped by more economical bulk ship. This Was not tested, but nor wa s 6, 000 tonne s of whea t conside red significant.

93.
5. 5. 1 N urn be r 0 f Mill sin E a c h Re gi 0 :1
Onl y if the long- run ave rage co st curve of an activity has a
minimum, indicating a maximum size beyon.d which internal prodac
tion diseconomies of scale occur, will the duplication of facUities
in any locality lead to a saving in total costs. Such a diseconomy
can be seen to occur at point A on the "u" shaped LRAC curve of
Figure 5.1 but as discussed previously, it is assumed in this study
that internal diseconomies do not occur in milling. Inst~ad a con
tinuously decreasing LRAC curve is assumed. This is shown in
Figure 5.1 as the "decreasing milling cost curve ". Because of the
nature of this curve, milling costs can always be reduced in a region
by milling in the largest possible mill, rather than in several mills
al1 with higher per unit mil1ing costs. Accordingly, the current
version of the model assumed only one mill should be present in
any regi.on.
The inter-regional Case is not so simple. The addition
of transport and handling co sts crea te external di seconomie s for
a mill. The "u" shaped LRAC curve of Figure 5.1 show s tha t
diseconomies will occur once increasing per unit transport costs
are greater than decreasing per unit milling costs past point A.
Transport cost will increase for instance when extra flour pro
duced to achieve milling economies must be delivered to points
further from the place of milling. For this reason, the rational
number, size, and location of mills in New Zealand as a whole,
can only be determined by carefully analysing the trade-off
between lower milling costs and increasing assembly and distri
bution transport cos ts whic h re sult from centralisa tiona

96.
Cost per Tonne of Milling
and Transport
FIGURE S.l
Maximum Size of Mill According to
Shape of LRAC Curve
IIU II shaped long- run average cost curve (Also combined transport and milling cost curve)
Inc rea sing Transport Cost Curve
Decreasing Milling Costs
A Quantity (tonnes)
5.5.2 Solution Number Four
The best solution obtained using the Stammer method produces
a total cost of $13.8 m. This represents a saving of $1. 64 m. over I
Solution Number Three. Solution Number Four is presented in
Table 5.13.
Solution Four suggests there should only be a total of six
mills i.n New Zealand. These should be located close to the major
pockets of human popula tion. In Auckland and in Inve rcargi.1l the se
mills should only fulfill the flour demand in their respective regions.

TABLE 5.13
Solution Numb;; r FouJ;:
OOOIS tonnes
" ---r,--.-----Nor~~ort·b~la~ ~i1l1 Fina\~:~~~~:!,egiO!lSr.)--.._-_l
Destinations
" <
South Island Mills -.---
!:! .. ()
" ""
South Island Ports
~ ;J' E:: " - 0
81 " g: .. Z :> 0
15' " ff on
~. "" 1::
~ g .. .. :l!M .. .. ~ ::r 0::::
o
.-:;
-i o ...., ).
Sout'ces " .. °IOI-i~ ;.. a.;!. t'"
~~~ tJ~,<; t" '<:
:u~
o 1>
c:: ~ E:: ., ~ t'" !!. .. ;.. :;; ~ ;;: ~ ~ 5 ~ ~g~ tJ:I~ 1:'. ~ 5 ;.. Ul p.. ..
" g n ff
n .. :>
» ~~. ~ ~:1. ~ 0" (D ~ n
"z :;; ;:!. ~ (1l IT.. ~
0' ~~ ~ ~
~ I;; g> I ~;:- 2 S' > c: ::J '.I'.
Wheat Supply
s..,uth Isla!ld Ports \'.-heat
n .. .. J<l
:::
t:: ~ t':l.,
~ 3 3" 0.. III ~ fi.I _. .... X"::J ~ Co ~ Q..
g- .~ g. 6' 5 3" ~ ., o· ~ ~ ....... g" Pol ..... O.,n~ ::o ... .,s :l I»;:r :::: O::J ~ !:I
~~ ~ c: ;'Z~ ::;; 0' g .. ":'. ~ ~
_j--J..1-, " ~. 5. 0 ~ " _,__ _ ::J ::r ..... ..... -:Ue o "
n ff ~ 0 0 ~ ~ ::; ......... ~ b ~ ~ ~ 0.. 0.. ...... 0 0
--J-J-.---j--~uthland 19
\ H=t'-'tB~'-l-'-~a~" IB.I ---t--i 2 I~" rth Otago 16
1> .. g-.,
'<:
,:; m to :r ., ~ c ..,.. JI.I ~ ., o !l:S n ;J 0.. 0..::T
o 0 ~ ~I::J ::s c ", ".. ~ "':> 0 ;T p.. "
:>
z o ., ff
., "n
.. .. 0 ~ Gl ~ ?r" r; ~ _. "< -....
'U:;J -., "' ... "< :> ~o
'<: -
c '" ~~ " " g.~
~
~ > "U
S ~
-:
7i.
I------t 2 fJ. 1 ; J'f-,- '
I:,uth 50 :; 0 ~anterbury 1_ ._- -. ,-- '- -,,- --I--' Ashbllrto" 75 f--- 73 1 Ren1.J.ining 50 1 South Island 50 -l
IPlufi 69 ~i Dunedi n I--- 1- - - I R~",!R,'\
ll:'rmaru tr4r ~ ,.,--;--'---- f- ~ L\·ttt~ltO!'l -----J L\"th-"lton--- r- I R~/Ro I
Bulk Ship , 210 Wheat SC1?pl y
:-':Orlh Island IW"lIington Ports " ~UJU:'1t
}"LH1-.ganl1i Au,'kla~---
\';heat SUP?!\"
South Isla",;]
Mills Flour Sup?ly
;";orth
Island. Mdls Flour Su?::,l\"
I:,:'\"~~ r, lIIrdll D-;~:~i~n~-6~~---
l\maru :;andTenHls.,\ Ashburr:;-;-Christ...:!-:;-~r~·h -3.!1':! Ra!'":t:!;ora
W ~'~li :"l.~t0n p~tO!l :-;"nh
1l\\.)U'lt . l}.!.l.U -1~.'\ ':1U~
59 151
59
I J :~ i 661 85
9 1 14 I 3 11.11 1 I I J E.l :
~_L,-+-- I --1-+-+-1 --+--f----l---i---l
3.312. 34 10 50
55 4 5'1
4 17 45 E.~
Au .. ;;,]a "d
- T01;~"'L l'E~!'-\~:) 9 had . 50 69; 11411 ~I~ 59 I 151 59 166\ 8519114 1 314.412.~ 34 10 155: 4 !-;-i 17 1451 :: I I "5 I
~ --J

98.
Other mills should supply flour to regions without mills. Dunedin
should supply its own region, North Otago, and part of South
Canterbury's demand; Christchurch should supply all remaining 16
South Island demands including 3,300 tonne s to South Canterbury.
In the North Island it can be seen that Wellington should supply
itself and Palmerston North, and Mount Maunganui should supply
the remaining North Island regions apart from Aucklando
Other structural changes occurring as a result of centralised
milling are for different volumes to be handled at ports. Table 5.14
shows the respective volumes handled in Solutions Three and Four.
TABLE 5.14
Tonnes of Whea t Handled at Ports
(000' s tonne s of whea t)
Solution Number
Port 4 3
Bluff 69 73.1
Timaru 141 13 0.9
Lyttelton Ro-Ro 0 6.0
Wellington 59 53.0
Mount Ma unganui 151 151.0
The opportunity to load an additional 10,000 tonnes of wheat
at TImaru would arise because of the lack of mills between Dunedin
and Christchurch. 'The wheat milled to flour for these regions
would come from wheat in North Canterbury and Otago. This would
16 . Chnstchurch does not supply the full 4,400 tonnes of flour required in South Canterbury, because to do so would require importing wheat to Christchurch from other regions.

99.
eliminate North Canterburyls previous 6, 000 tonne surplus and
Wellington would receive an addi tional 6, 000 tonne s by bulk ship
instead of by Ro-Ro container shipments from Lyttelton. Hence,
bulk shipping would increase to 6, 000 tonnes which is too small a
change to effect the economy of scale of bulk shipping.
The effects of these small changes in demand for wheat in
South Island regions were not enough to affec t the rela ti ve marginal
values of wheat in respective production regions. However, the
rela tive marginal values of flour in respective final demand regions
did change.
5.5.3 Regional Flour Price Differentials
Table 5.15 shows the new set of regional flour price differen
tials for Solution Four. Those of the previous solution have been
included for purpose s of compari son.
The increases in the relative marginal values of flour in
some South Island regions, namely Southland, North Otago and
South Canterbury, are explained by the lower milling costs achieved
in Dunedin and Christchurch, and the transport costs from these
mills to other South Island regions. Attention should be drawn to
the fact tha t these value s Sa y nothing -a.bout the absolute value of
flour. They simply show the locational disadvantage of final
demand regions in procurring their extra tonnes offlour relative
to Otago. Therefore, if the marginal value of Otago flour drops,
the relative disadvantage of some regions may increase.
The regions whose relative disadvantage decreases most as
a result of milling scale economies are Christchurch and Nelson/
Marlborough. By centralising milling in Christchurch, this allows
this region to exploit its fulilocational·advantage. This advantage

1 00.
lies in its proximity to a large pocket of demand and allows this
milling location to substantially reduce its milling costs. Tnis
rela tive advantage can be seen to spill over into the Christchurch
and Nelson/Marlborough final demand regions.
TABLE 5.15
Regional Flour Price Differentials (4)
($/whea t equivalent tonne)
Solution No. Regions
Southland
Dunedin and Districts
North Otago
South Canterbury
Ashburton
Christchurch (Districts and Westland)
Nelson/Marlborough
Wellington (Excluding Palmerston North)
Palmerston North
Taranaki
East Coast/HaWkes Bay
South Bay of Plenty
Auckland / No rthland
4
9
0
12
16
14
1
24
35
A.-~ {
44
46
34
34
3
7
0
10
12
·11
13
36
39
50
49
51
39
36
The reduction in milling costs in the North Island are not as
great. Hence the spillover advantages are also not as marked and
therefore the decline in the rela tive disadvantage s of North Island
final demand regions are not as great as that in Christchurch.

101.
The regional flour price differentials of Table S.l 5 are those
resulting from one local optimum solution to the current problem.
Alterna tive local optima rna y ha ve different se ts of regional fl::)Ur
price differentials. It is possible that an alternative market
structure could produce a solution with similar or reduced total
costs. It may be recalled from discussion in chapter three that
a knowledge of marginal opportunity costs or marginal value
products is not sufficient to determine which possible changes in
market structure might lead to solutions of reduced costs, but that
instead some other rules might be useful to identify possible areas
of improvement in the model's solution. One such rule is:
if there are two locations present in a stable solution,
which are "geographically close ", one of them is a
good candida te for "forcing out".
In Solution Four. Auckland and Mount Maunganui could be
considered to be two loca tions which are "geographically close ".
For this reason it was decided to force Auckland from the solution
and generate an alterna tive local optimum solution.
5. S. 4 Solution Number Fiye - Auckland Milling Forced Out
Solution Five differs from Solution Four in that the entire
northern North Island flour is milled at, and supplied from, Mount
Maunganui instead of both Mount Maunganui and Auckland. This
gives a solution with only two mills in the North Island and three
in the South. This change results in a reduction of total marketing
costs by $0.2 m.
While centralisation of the milling operation at Mount
Maunganui resulted in higher tran,sport costs of a more specialised
product, flour, instead of wheat from Mount Maunganui to Auckland,

1 02.
the extra economies of scale resultingfrom increased milling at
Mount Maunganui more than compensa ted for the increased trans
port costs. Table 5.16 show's the magnitude of these costs for
Solution Four and Five; the difference between the costs of these
solutions is also shown.
Solution No .. 4
Solution No.5
Change
TABLE 5.16
Marketing Cost Comparison -
Solution Four/Solution Fiye
($m. )
Total North Total NorthIsland Total North Island Milling Port to Mill Island Flour
Costs Transport Costs Delivery Costs
3.334
2.966
- .368
1.034
.296
- .765
.82
1.755
+ .935
Totalsl7
5.188
4.99
- .198
In Table 5.16 it can be seen that .flour delivery costs increase
by $.17 m more than the wheat assembly costs decrease (i.e. $.935 m. -
$.765 m. = $.17 m.), however, the centrali sation of milling at Mount
Maunganui ra ther than a t Mount Maunganui and Auckland more than
compensa te s for thi s increa se where the greater economy of scale
in milling reduces costs by $.368 m. Hence the $.198 m. reduction
in co sts (rounded = $.2 m. ).
The effect that the overall reductions have on the regional
flour price differentials are shown in Table 5.17.
17 Total North Island unloading, milling and transport costs included costs associated with Wellington, which remain constant.

TABLE 5.17 18
Regional Flour Price Differentials
($/wheat equivalent tonne)
Solution No. Regions
5
Taranaki 41
East Coast/Hawkes Bay 43
South Ba y of Plenty 31
Auc kla nd / No rthla nd 34
103.
4
44
46
34
34
It is interesting to note that closing down all milling in Auckland
would be of no advantage to Auckland consumers as there would be
no change in the margi.nal value of flour in that region. It is thought
that the additional cost of transporting.flour rather thaJ? wheat to
Auckland is just compensated for by decreased milling costs. The
other three North Island regions of Table 5.17 benefit by decreased
milling costs without incurring increased transportation costs.
The dec rea sed cost resulting from centralising a t Mount
Maunganui, rather than at hnth Mount Maunganui and Auckland,
does not mean centralisation at Auckland could not also provide
a good solution.
Although previously it wa s shown to be uneconomical to
unload 85,000 tonnes at Auckland when this could instrad by unloaded
at Mount Maunganui and transported to Auckland at a lesser cost,
if 150,000 tonnes were unloaded at Auckland the additional economies
of scale involved with unloading may make this a favourable loca tion
for centralised milling. The increased economy of scale in unloading
18 Price differentials in all other regi.ons did not change, and all differentials are set relative to Otago.

1 04.-
would not result in lower unloading costs than at Mount Maunganui,
however, there would be a decrea se in the total transport bill whic h
may off-set this cost. Tne cost of transporting 85,000 tonnes of
flour (W. E.) from Mount Maunganui to Auckland would be a voided
and whilst an extra cost of delivering flour from Auckland to the
South Bay of Plenty region would be incurred, this would not be
exce s si ve since the a verage co s t of delivering flour from :Nlount
Maunganui to the South Bay of Plenty region is only $3. 00 less
than from Auckland. The average cost of flour deliveries to the
East Coast/Hawkes Bay area is $8. 00 greater from Auckland than
Mount Maunganui in the model, and to Taranaki $4. 00 cheaper.
Accordingly, Mount Maunganui was forced from the solution
to analyse the effects of a centralised milling operation a t Auckland.
5.5.5 Solution Number Six - Mount Maunganui Milling Forced Out
Solution Si.x diffe rs from Solu non Five in tha t the entire
norther n North Island flour is milled a t and supplied from Auckland
instead of Mount Maunganui. Also, all wheat is assumed to be
unloaded at Auckland instead of Mount Maunganui. Thi s solution
re sults in the increase of total marketing co s ts by $.385 m.
The magnitudes of the various marketing costs of Solutions
Five and Si.x, and the difference between these are shown in Table
5.18. It can be seen that the saving in total flour delivery costs
arising from Solution Six compared to those costs of Solution Five
are not enough to compensate for the increased total unloading and
wharf to mill transport costs.
While the overall increase in costs of $.385 m. is not a
large increase it is interesting to note that the new set of market-
ing costs results in considerably different relative price differentials.
These are shown in Table 5.19.

TABLE 5.18
Marketing Cost Comparison,
Solution Five /Solutio n Six19
($m)
Total North Total North Total North
105.
North Island Isla nd Flo ur To tal
Port to Mill Island Island
Unloading Costs
Solution No.5 1.043
Solution No.6 1.949
Change + .906
Milling Costs
2.966
2.966
o
Costs
.269
.42
+.151
TABLE 5.19
Delivery Costs
1.755
1.083
- .672
Regi.gnal Flour Price Differentials (6)20
($/whea t equi valent tonne)
Solution No. Regions
6
Taranaki 46
East Coast/Hawkes Bay 58
South Ba y of Plenty 41
Auc kland / Northland 30
-19 See note of Table 5.16.
20 See notes of Table 5.17.
5
41
43
31
34
Costs
6.033
6.418
+ .385

1 06~
The comparative figures in Table 5.19 demonstrate that the
relative disadvantages of final demand regions in procurring their
extra flour supplies Can be sensitive to relatively small changes in
the total marketing costs between different low cost solutions. This
may hold important implications for those policy makers concerned
wi th the equity of Government I s flour pricing polic y. The high
sensiti vi ty of the se regional price differentials raise s important
questions as to wha t might be "fair" regional flour price differentials
to reflect the relative disadvantages of regions.
The relatively small differences in the total costs of Solutions
Four, Five, and Six suggest that the question of mill location in the
northern North Island may be highly sensitive. In light of the uncer
tainties surrounding some of the data used in this analysis, a closer,
more rigorous study on the comparative costs of these regions
might need to be undertaken before concluding which was the most
fa voured site.
The problem of mill size in the southern North Island is
another problem that bears sensitive solutions. This Can be seen
from Solution Number Seven.
5.5.6 Solution Number Seven - Increased Milling at Wellington
Among the several solutions genera ted from the itera tive
solution procedure involved in deriving Solution Six, it was noticed
that a second solution with a total cost of $14. 0425 m. had arisen.
This cost is only $50, 000 greater than Solution Six. Solution Seven
differ s from Solution Six by the amounts milled a t the two North
Island mills.
In Solution Seven the [inal demand requirements of the Ea st
Coast/Hawke s Bay region are supplied from Wellington ins tead of

107.
Auckland as is the case in Solution Six. This resulted in Wellington
milling 76,000 tonnes (an increase of17,000 tonnes} and Auckland
134, 000 tonnes (a decrease of 17,000 tonnes). This gives an indi
ca tion Qf how sensitive the size of mill in the northern North Island
and in Wellington is to relatively small changes in total costs.
That is, for a .4 per cent change in total costs, there is an 11.26
per cent change in the milling capacity needed in Auckland and a
28.8 per cent change in that of Wellington.
5.5.7 Solution Number Eig-ht - Invercargill Mill Forced Out
Only one test was undertaken to measure the sensitivity of
mill size in South Island regions. This involved forcing Invercargill
mill from the solution.
Solution Eight was similar to Solution Five. However, in
Solution Eight the Dunedin mill supplied its own re~ion and that
of Southland. This decreased the total demand for wheat in Southland
and increased demand in Otago exhausting supplies in that region.
As a result it became feasible to mill flour in Oamaru to supply
North Otago and part of the South Canterbury demand. This change,
however, increased total costs by" $.092 m.
It is pos sible that other alterna tive low cost solutions could
be found which would provide further information for policy" pur-
po se s by increasing the range of optional solutions to the industry's
problem. With a range of solutions, policy makers could use other
criteria to evaluate what might be the best rational market structure.
For instance, it may be a secondary objective of policy makers to
promote industry in a particular loca tion for regional development
reasons. This may make the decision of mill location and size in
the northern North Island more clear cut. However, rather than
simpl y genera ting a range of solutions, it rna y be more worthwhile

1 08. ,
using the model to genera te specific solutions to solve specific
problems of policy makers.
It should be remembered the model is only a simplistic
representation of the industry and market. Once general principles
of industry rationalisation have been identified from the simplistic
analysis, policy makers may wish to examine the implications of
these general principles when considering other Inore complex
issues and problems of the industry.
In light of the general principle s identified by the model,
policy makers may wish to determine the extra total cost of perhaps
moving a certain amount of milling capacity to the North Island
from the South, subject to retaining some milling in each locality
currently milling wheat to flour. This may be done to initiate the
closing down of older and smaller units.
Specific problems of the type sugge sted above could be solved
using the model. However, without a knowledge of the specific,
secondary objectives of policy makers, it is not known what other
alternative solutions it would be useful to generate to study further
is sue s of mill loca tion, number and size.
5.6 Summary and Conclusions
In this chapter it: has been shown how the market performance
of the New Zealand wheat and flour industry might change in response
to different market structures. More specifically, this involved
examining the market performance of the existing industry compared
to an indus try unre strained by current protective and insula ting
cons tra ints.
By examining the performance of the existing industry it
Was possible to estimate the regional price differentials for wheat

109.
and flour. Under the Government's current wheat and flour pricing
policy this information is not available from the market place as
prices are standardised throughout New Zealand. Further, standar
dised pricing re sults in cross - subsidisa tion among flour consumer s
of different re gions and also among farmer s of different regions.
From respective price differentials, estimates of the relative levels
of such subsidisationwere calculated. These suggested that the
current pricing policie s of Government re sulted in significa nt income
transfers from South Island flour consumers to North Island flour
consumers and from South Island wheat farmers north of Oamaru
to South Island wheat farmers south of Oamaru.
It was also possible from the model of the existing industry
to gain an indication of the opportunity- costs imposed by current
shipping and milling constraints. These were shown to be high
and, as such, were seen to be evidence that substantial savings
might arise from lifting these constraints. Accordingly, shipping
constraints and milling quotas were relaxed. Also, transport and
processing costs were adjusted to take account of the potential
economies of scale possible in an uncapacitated industry.
From the several low cost solutions generated with the less
constrained versions of the model, it became apparent that sub
stantial cost reductions could be made by centralising both the
transport and milling operations of the industry. This contrasts
markedly with the fragmented and dispe rsed mark,=t structure of
the exlsting industry.
The results of the modified models would suggest that there should
be no inter-island trade in flour and that an additlonal 46,000 w.e. tonnes
of flour should be milled in the No rth Island with an equivale nt reduction to

11 o.
be made in the South Island. Under this situation, 210, 000 tonnes
of wheat would be required in the North Island per year. The results
showed that substantial saving could be made by transporting this
full tonnage by bulk ship. It waS shown that this would eliminate
alternative expensive modes of transport, namely rail ferry and
Ro -Ro container shipments of whea t and flour, and allow grea ter
economies of scale in bulk shipping. The results also showed that
potential economies of scale could be exploited i.n the milling
operation.
To take full opportunity of scale economies it Was shown that
at most only one mill per region was required. In allowing central
isation of milling between regions it was further shown that as few
a s five mills would be all tha t were required in a ra tionali sed industry.
This would require one mill of between 135, 000 and 150, 000 tonnes
in the northern North Island, preferably at Mount Maunganui, one
of between 55, 000 and 75, 000 tonnes in Wellington, another of 50, 000
tonnes in Christchurch, 18, 000 in Dunedin, and 9, 000 in Invercargill.
As a result of the location of mills in the North Island appropriate
amounts of whea t would need to be unloaded from bulk ship a t Mount
Maunganui and Wellington. In the South Island, results showed tha t
in a year of self-sufficiency, 70, 000 tonnes of wheat should be loaded
to bulk ship at Bluff and 140, 000 tonnes at Timaru. (To facilitate
loading and unloading, and to provide additional buffer stock storage
at the four ports involved, it had been assumed that 6, 000 tonne
port storage facilities were available.)
From the modified models it was also possible to measure
the marginal value of wheat in Sydney relative to wheat at farms
in South Island regions. This value was shown to be high and
suggested that if F .O.R. prices for wheat in the South Island were
to compete with the Sydne y F .0. B. price, further substantial

111.
reductions in total costs could be made. However, because supply
functions of respective regions were not included in the model it
was not possible to give any indication what proportions of wheat
should be supplied from respective sources under a free-trade
situa tion wi th Aust ralia.
The model used to genera te the re sul ts presented in this
chapter is only a simplistic repre sentation of the struc tural prob
lems in the wheat and flour industry. For this reason the results
can only be interpreted as showing the general principles of industry
ra tionali sa tion.


CHAPTER 6
LIMITATIONS, IMPLICATICUNS AND EXTENSIONS
OF THE MODEL
6.1 Introduction,
The results presented in the previous chapter have shown
that the model developed i.n this stud y has c onsi.de rable potential
to aid in the analysis of problems in the wheat and flour industry.
It is important however, to realise that there are limitations to
the model and the extent to which it can be used for policy analysis.
This chapte r de sc ribe s the majo r limitations to the model and the
implications of the current results.
6.2 Limitations of the Model
6.2.1 Assumptions About Wheat Supply
In the model the long- run wheat suppl y functions fo r the South
Island produ ctlon regions we re assumed to be of constant quality,
completely inelastic and representative of a year of self-sufficiency.
Although this is clearly an unrealistic representation of supply,
this does not severely limit the interpretation of results.
Because in the low cost solutions all wheat arriving in the
North Island is received from bulk ship, the structure of the model
is such that once wheat is loaded aboard ship, per unit marketing
costs thereafter are independent of the source of the wheat. There
fore, the rationalised structure of milling in the No rth Island is
independent of the sources from which its milling grade wheat is
derived. The implication of this is that the market structure of
the industry in the North Island shown in the low co st colutions,
would be unaffected by changes in supply, assuming both islands
113.

114.
remain sel£- sufficient in the production of flour. This is impo rtant
for it suggests that in years of domestic shortfall, the need to
import Australian wheat would not affect what might be a rational
market and industrial structure tn the North Island.
In the South Island it is possible that a mill in one or more
of the regions between Dunedin and Christchurch may be viable
if the uncertainties of supply were acknowledged in the model.
McCarthy et. al. (1971) outline how it wOl.lld be possible to test the
stability of plant locations to changes in regional production. Also
Higham et. al. show that heuristic search procedures could be
used for this purpose. Although this would be a logical extension
of the study, it is unlikely that South Island milling allocations
would alter significantly if the model had been tested with the actual
levels of regional production achieved in the recent years. The
only major Lmplication arising from the simplistic assumptions
about the wheat supply would appear to be that spatial equilibrium
prices and quantities can not be determined directly from the
model. However, if estimates of long-run regional supply functions
were available the re are ite rative - reactive programming technique s
which could allow the incorporation of supply functions in the model.
This would be a worthwhile extension of the model and would pro
vide valuable information for policy makers concerned with New
Zealand wheat pricing.
6.2.2 Assumptions About Final Demand
De spite the wide disparitie s between the regional flour price
differentials of the South and North Islands, the assumed, com
pletely inelastic, demand for flour is not seen as a serious limita
tion of the modeL Even if regional price differentials were reflected
in the flour price, the significant decline in the South Isla'1d price
could not be expected to create a significant change in the local

11 5.
consumption of £lour. A more serious limitation may have arisen
from assuming that the industry produces only one product, a single
quality £lour.
As Bor rell (1980, Figure 2.1) show s, wheat is used to produce
a range of products. The demands for these products require mills
to produce several lines of flour and also bran a.!:1d pollard to stock
foods. Ignoring the fact that there are different flours may be to
ignore an essential economic force of the market. It may involve
considerable expense to shut down the rollers at a mill to cl ea.Cl
machinery and change over to a different line of flour. Larger
production runs l'nay be cheaper, emphasisLng the need for either
flour storage facilities or for specialised mills. Large mills could
produce flour for bread baking while smaller mills could produce
flours for biscuits, cakes and household uses. No attempt has
been made in this study to take account of the implications the pro
duction of alte rnative type s of flour might have upon the location,
numbe r or size of mill s. DiHe rent qualitie s of wheat available in
different supply regions may be more suitable as supply posts for
a mill that might specialise in, say, household £lours. This may
hold implications as where best to locate such a mill.
The demand for braCl and ;Jollard by stockfood manufacture rs
similarly may hold implications for the location, number and size
of mills. No attempt has been made to identify any such implication.
6.2.3 Importation of Australian Flour
Another factor which may hold implications for rationalising
mills is the possibility of importing flour from Australia.
A pape r from the Flour Mille rs 1 Council of Aust ralia dated
8 May 1979 suggests that if substantial orders were placed,
Australian flour could be purchased for $206.00 per tonne net,

1 16.
free alongside ship, packed -:'n 50 kllo jutes. This could mean
Australian flour might be competitive with No rth Island milled
flour, although quality diffe rential s and the co st of shipping would
':lave to be considered to evaluate the econoluic via~ility of this
alternative. No consideration has been given to this factor in the
study. If this alternative was viable it is possible that Sydney could
supply North Island final demand areas rather than North Island
flour mill s.
6.2.4 Coastal Shipments of Flour
The fact that it was as sumed feasible to use a speci.alised
bulk ship for wheat raises two important questions.
(i) Would it be feasible to use a specialised ship
to transport the equivalent flour and what
implications might thi s create, and
(ii) would it be feasible to backload flour from
No rth Island mill s aboard the specialised
bulk ship and what implications might this
hold?
Solutions to these problems are not given in this stUdy. How
ever, if estimates of the costs of such proposals were available
these could be easily incorporated i.n the model.
6.2.5 The Dynamics of Ship12Lng and Storag&..
Bor rell (1980, Chapte r 3) discusse s the trade -off between
lower per unit costs of bulk shipping bJlarger vessels on occasional 21
voyages and the increased per U:1.it capital cost of build:'ng larger
21 Assuming it was possible to charter large bulk ships currently serving the Australian .=xport trade. These could "be chartered on a monthly basis.

117.
and perha;?s more numerous storage facilities necessary to facili
tate intermittent shipping. The static model does not allow the
size of ship or the size of storage facilities to vary. There are
assumed to be fixed ~n actual size, although their throughputs are
able to vary.
It is po s sible that the static model could be used to determine
annual trade flows which could then be used as inputs to a dynamic
model. The dynamic model could then be used to show how annual
trade flow s should be scheduled throughout the year, what size of
ship or ships would need to be charte red, and what might be the
maximum size of storage facility required at anyone location.
The exclusion of dynamic effects in the model of this studf
is seen more as an opportunity to extend the problem rather than
a limitation of the model, although it is possible that economies
of scale associated with the 'dfnamic problem may have implications
for the degree of centralisation of milling in the North Island and
for the centralisation of port loading a'1d unloadi:ng facilities.
6.2.6 Uncertainties of the Dat~
In presenti.ng the data of the model in cb,a;?ter four, attention
was drawn to the limitation of some of that data. In particular, the
crude estimate required for the milling cost curve and the arbitrary
assUlnptions made to calculate scale cost curves for two North
Island ports. The implications arising from the uncertain 'data
are that the specific characteristics of a.'1y low cost solution must
be treated with cautLon, and that only general principles concern
ing is sues of market structure can be identified.
For a more rigorous a.'1alysis, more accurate data would -:)e
needed. It is likel y that the Wheat Board would have muc h of the
data needed for these purposes and the model could easily be
re -e stimated using new data.

118.
Anothe r me thod tha t could be used to ove rcome the uncertain
tie s of the da ta used would be to conduct sensitivity te sting. This
could be conducted by changing the parameters of the various cost
curves of the transport costs in a systema tic fashion in successive'
runs of the model. Hence it would be possible to identify how the
solution might change over a range and combination of alternative
transport and cost curves. Although this might reduce the U.:1cer
tainties as to what might be a suitable market structure, one
limitation would be the many possible combinations of curves that
could be tested.
6.3 Implications of Model Results
The results of the model show how changes in market struc
ture could lead to a lowering of total industry co sts. They do llQ..i;..
show how market conduct should or would change given the type
of structural changes required. However, some interesting impli
ca tions regarding market conduct do arise from the solutions of
the model.
In the model it is assumed that the market conduct is that
of a perfectly competitive industry. Hence the objective function
of the model seeks to minimise total costs. However, the market
structure suggested by the low cost solutions of the model is not
necessarily consistent with a perfectly competitive industry. For
instance, each mill of the solution has a potential spatial monopoly.
For this reason, the removal of those constraints representing
Government controls in the model does not necessarily imply that
the abolition of controls in the industry will lead to a rationalised
market struc ture where costs are minimised.
When a competitive structure does not apply, the findings
of the type of market model used in this study only established a

119.
rna rket struc ture norm that e stima te s the near maximum economic
surplus (gain or saving) that could be obtained, but says nothing of
the market conduct required to achi.eve this economic surplus.
Cassidy and Kilminster (1975) give an example of how a similar
market model to that used in this study has been incorrectly inter
preted and the polic y recommenda tion arising from the solutions
of that model are partly invalid. The problem arose because it
was assumed that competitive conduct would prevail despite the
fact tha t an imperfec Uy competitive market structure wa s sugge s ted
by the model. To overcome such problems it is necessary to
interpret re sults in light of the economic theory rela ting to impe r
fect competition. The implication arises: how does the theory of
market conduct and imperfect competition rela te to the normative
market struc ture derived by the model of this study.
The low cost solutions of the study suggest a !leed for inte
gration, co-ordination and for bargaining power. These all arise
from the fact that the market structure of the solutions i.ndicates
the need for centralisation. A consequence of this would ~e that
monopoly powers could emerge in the milling a!ld transport sectors.
While these centralised orga!lisations might be capable of integrat
ing and co-ordinating the market, the theory of countervailing
power, however, might suggest that because of the atomistic farm
structure at the beginning of the marketing chain, and also that
of bakeries and consumers at the other e:ld, the interest of farmers
a!ld bake rie s 1na:r onl y- be protected by- the pre sence of 0 ne i ndepe:1-
de!lt orga!lisation with strong bargaining power. An alternative would
be to have three separate groups forming countervailing forces
against the monopolie s.
An obvious extension of this studl would be to attempt to
consider this problem but it must be kept in mind that the model

120.
only provides s'olutions showing the results of long term structural
change s. The refore in a~swe ring the que stions above, conside ration
must be given as to what conduct would ;:)e necessary to bring about
restructuring in the transition phase a~d how best to achieve such
conduct.
The second half of the Governme::1t wheat and flour marketing
polic y discus sed in chapte r two tnvol ved the Gove rnment fixed wheat
and flour prices and the margins paid to millers. Even though com
petitive spatial equilibrium prices were used in the modd to identify
where other cost savings might be made in the industry, it does not
necessarily imply that price setting conduct should be that of a free
market. It is pos sible that if the market could be structured with
appropriately cou'1.te rvailing groups, the pricing conduct of the industry
could perhaps be left to free market forces to detennine spatial
equilibrium price s. Howeve r, complications introduced by fluctuating
world commodity prices and equity considerations may mean prices
are best set by Government. In this case the results of the model
showing regional price differentials can be thought of as useful
supplementary information that policy makers consider in making
their deci sions. An obvious extension of the model might be to try
and tie up spatial aspects of pricing to the other pricing problems
of the industry.
In conclusion, it must be stated that the results of this study
only establish a market norm; they only show what could be poss
ible, they do not specify what policy measures are -required to
achieve such a norm. In this way the results provide a~ indication
of the direction fo r the industry and, the refore implications for the
Gove rnment 1 s wheat and Hour marketing polic y.

REFERENCES
BORRELL, B. W. (1980) The New Zealand Whea t and Flour Industry Market Performance and Polic y Implica tions, The si s, M. Agr. Com., Lincoln College, New Zealand.
CA S SID Y, P. A. (1 96 8 ) Optimum Loca tion, Number and Size of Beef Sla ughter Plants in Eastern Central Queensland, Thesis, NLAgr. Sc., Univer sity of Queensland, Aus tralia.
CASSID Y, P.A., KILMINSTER, J. C. (1974) Spatial Equilibrium Analysis, Social Welfare and Rural Policy: The Case of the Wool Marketing Innovations and Reforms, Review of Marketing and Agricultural Economics, Vol. 42, No.3 Sept. 1974, pp. 185-201.
CHUDLEIGH, P. D. (1978) Shipping New Zealand 1 s Agricultural Exports: Background and Issues, A.E.R. U. Research Report No. 85, January 1978.
CHUDLEIGH, P.D., DAVEY, L.E., ZWART, A.C. (1978) Sources of Variation in Aggregate New Zealand Wheat Production: Analysis and Implications, New Zealand Agricultural Science, May 1978.
DICKIE, A.J. (1972) The Economic s of Centralised Grain Storage, The Journal of the FarlnManagementAssociation, Vol. 2, No.3, Autumn 1 972, pp. 122 -1 3 O.
ELSHAFEI, A. N. (1973) Optimal Location of Facilities, Thesis, Ph.D., University of Birmingham.
FLOUR MILLERS 1 COUNCIL OF AUSTRALIA (1979) Personal Communication.
FREEBAIRN J. w. (1967) Wheat Storage Costs in New South Wales, Review of Marketing and Agricultural Economics, Vo. 35, No.1 March 1967, pp. 9-42.
F RE N CH, B. C. (1 977 ) The Anal ysis of Productive Efficienc y in Agricultural Marketing: Models, Methods, and Progress, pp. 93-206 in Martin, L.R., A Survey of Agricultural Economics Literature Vol. 1, Traditional Fields of Agricultural Economics 1940ls to 1970 1s, 1977, University of Minnesota Press.
121.
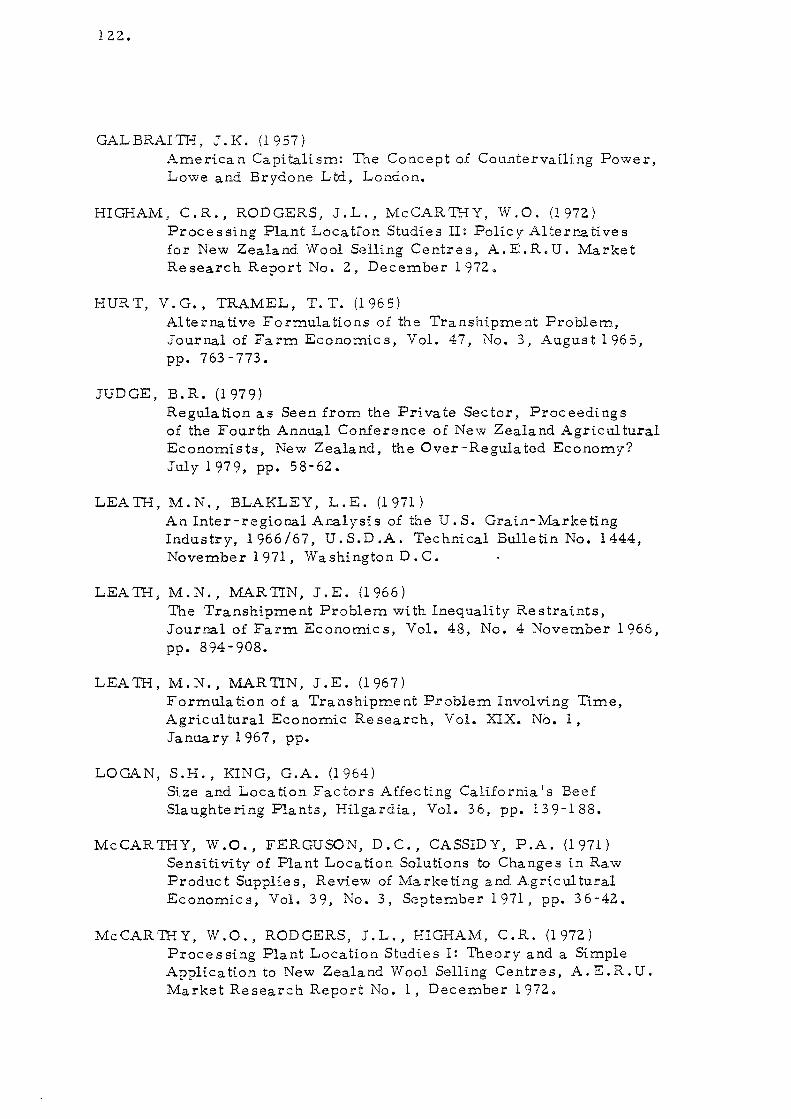
122.
GALBRAI TH, J. K. (1 957 ) American Capitalism: The Concept of Countervailing Power, Lowe and Brydone Ltd, London.
HIGHAM, C.R., RODGERS, J.L., McCARTHY, W.O. (1972) Processing Plant Location Studies II: Policy Alternatives for New Zealand Wool Selling Centres, A.E.R.U. Market Research Report No.2, December 1972.
HURT, V.G., TRAMEL, T.T. (1965) Alterna tive Formulations of the Transhipment Problem, Journal of Farm EconomiCS, Vol. 47, No.3, August 1965, pp. 763-773.
JUDGE, B.R. (1979) Regulation as Seen from the Private Sector, Proceedings of the Fourth Annual Conference of New Zealand Agricultural Economists, New Zealand, the Over-Regulated Economy? July 1979, pp. 58-62.
LEA TH, M. N., BLAKLEY, L. E. (1971) An Inter-regional Analysis of the U. S. Grain-Marketing Industry, 1966/67, U.S.D.A. Technical Bulletin No. 1444, November 1971, Washington D. C.
LEATH, M.N., 11.A.RTIN, J.E. (1966) The Transhipment Problem with Inequality Restraints, Journal of Farm EconomiCS, Vol. 48, No.4 November 1966, pp. 894-908.
LEA TH, M. N., MARTIN, J. E. (1 967) Formulation of a Transhipment Problem Involving Time, Agricultural Economic Research, Vol. XIX. No.1, January 1967, pp.
LOGAN, S.H., KING, G.A. (1964) Size and Loca tion Factors Affecting California I s Beef Slaughtering Plants, Hilgardia, Vol. 36, pp. 139-188.
McCARTHY, W.O., FERGUSON, D.C., CASSIDY, P.A. (1971) Sensitivity of Plant Location Solutions to Changes in Raw Product Supplies, Review of Marketing and Agricultural Economics, Vol. 39, No.3, September 1971, pp. 36-42.
McCAR'THY, W.O., RODGERS, J .L., HIGHAM, C.R. (1972) Processing Plant Location Studies I: Theory and a Simple Application to New Zealand Wool Selling Centres, A.E.R.U. Market Research Report No.1, December 1972.

123.
NEW ZEALAND DEPAR TMENT OF STA nSTICS (1974) New Zealand Industrial Production 1975-76, Government Printer, Wellington.
NEW ZEALAND DEPAR ThIENT OF STA nSTICS (1973) New Zealand Census of Population and Dwellings 1971, New Zealand Summary, Govern:ment Printer, Wellington.
NEW ZEALAND DEPAR ThIENT OF STA nSTICS, (1979a) 1978 Production of Flour, Monthly Abstracts of Statistics (March, Government Printer, Wellington.
NEW ZEALAND FLOUR MILLERS ASSOCIATION, (1979) Unpublished Da tao
NEW ZEALAND GOVERNMENT RAILWA YS, (1979) Monthly Rates Circular 1979/55 (Part 1), Commercial Manager's Office, Wellington.
NEW ZEALAND MINISTR Y OF TRANSPOR T, (1979) Transport Act 1972 (All Regions), February 1979.
NEW ZEALAND SHIPPING CORPORA nON, (1979) Unpublished data.
NORTON, W.E., (1973) Some Principles of Economic Policies, Reserve Bank of Australia Occasional Paper No.6.
PRIV ATE TRANSPORT COMPANY, (1979) Unpubli shed da tao
PRIVA TE TRANSPOR T COMPANY, (l979a) Per sonal Communica tion.
PRIVATE TRANSPORT COMPANY, (1979b) Personal Communication.
RAE, A.N. (1979) Statutory Marketing Boards, Proceedings of the Fourth Annual Conference of New Zealand Agricultural Economists, New Zealand, the Over-Regulated Economy? July 1979, pp. 159-176.
RODGERS, J.L., (1972) AIFLS - An Inter-active Fac ility Loca tion Stud y, Unpubli shed manual.

124.
ROD GERS, J. L ., (1 978) Heuristic Problem Solving, Chapter 16 in Daellenbach, H. G., George, J. E., 1978, Introduction to Opera tions Re search Techniques, Allyn and Bacon, Inc., Boston.
SHARP, J.W., McDONALD, H.J., (1971) The Impact of Vessel Size on an Optimal System of U.S. Grain Export Facilities, Research Bulletin Ohio Agricultural Research Development Centre, Wooster, Ohio, No.1 048.
STAMMER, R. W., (1971) A Mathematical Programming Model for Determining the Optimum Spatial Organisation ofa Multi Plant Industry, Thesis, Ph.D., University of Connecticut.
THE WHEA.. T BOARD ACT, (1965) New Zealand Statutues 1965, Vol. 2, Government Printer, W elli ngton.
TOFT, H.I., CASSIDY, P.A. McCARTHY, W.O., (1970) Sensiti vi ty Te sting and the Plant Loca tion Problem, American Journal of Agricultural Economic s, Vol. 52, pp. 403 -410, August 1970.
WHEA T BOARD ANNUAL REPOR TS, (various issues)

APPENDICES


APPENDIX 1
Ayerage Flour Price Paid to Millers from 1 February 1978
Calc ula ted by Department of Trade and Indus try
(Source: New Zealand Flour Millers I As socia tion, 1979).
Wheat Cost, 135 x 1.287
Conversion Cost, i.e. 780/0 extraction
Standard Profit Margin
$ tonne
1 73 • 75
22.40
5.06
201 .21
Revenue from the sale of Bran and Pollard by-produced
is thought to pay for the commission and discount made to the
Wheat Board for the sale of flour.
The milling margin is therefore: $ tonne
22.40
5.06
27.46
In wheat equivalents, this is 27.46/1.28 = $21.45 per tonne.
Allowing for 15 per cent inflation between February 1978 and May 1979,
$21. 45 x 1. 1 5 = $24. 67.
Although it is not known whether the Department of Trade
and Industry used the average size of mill to calculate this average
margin, it is useful to note that the average size of mill handles
approximately 14,000 tonnes of wheat per annum.
121.


APPENDIX 2
Fixed Annual Charges for 6,000 Tonne Bulk Ship
Capital $10 m. /15 years
Interest 12 per cent
Opera ting Co s t
Annual Operating Cost
Salaries and Wages
Master
3 Dec k 0 f£i c e r s
2 Engineers
7 Seamen
Medic
Cook and Steward
Supe rannua tion
$m
.03
.075
.075
.140
.02
.04
.37
.04
.41
Crew Support (travel, medical, compo)
Victualling
Deck Stores
Engine Stores
Repairs and Maintenance
Insurance ($10 m. x .01 )
Management
Port Expense s (30 x 3, 000)
$m
. 7
1.2
1.1
3.0
$m
.41
• 07
.035
.015
.020
.3
.1
• 1
.09
1.14
(Source: Two Priva te Transport Companie s and Ministry of Transport).
129.

130.
To charter a similar vessel on the World spot market
for one year would cost $1.9 m. - this excludes fuel and port
charges. (New Zealand Shipping Corporation Figures, 1979).
Opera ting Days Using 6,000 Tonne Bulk Ship
Routes Sea Miles Days @ 14 m. It. h.
Bluff - Wellington
Timaru -
Sydney -
Mount Maunganui
Auckland
Wellington
Mount Maunganui
Auckland
Wellington
Mount Maunganui
Auckland
455
865
950
260
672
756
1,300
1,325
1,264
Assuming the most time demanding possibility
200, 000 tonnes Sydney - Mount Mallnganui
200, 000/6, 000 = 33 trips
Da ys for re tur n journey to North Island - 8
Day-s for loading/unloading 2
10
33 trips@ 10days = 330days
1.3
2.6
2.8
• 8
2.0
2.3
3.9
4.0
3.8
A larger ship could be purchased to allow a greater nllmber of free
days. The extra capital cost would not be great.
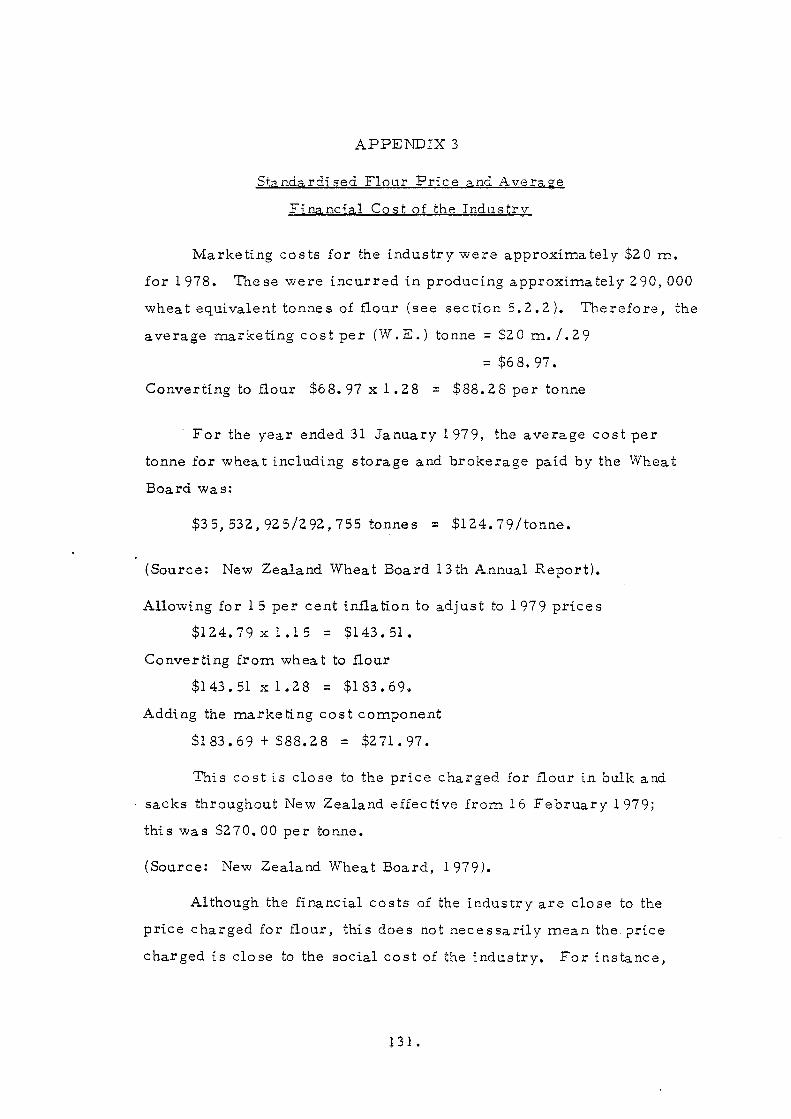
APPENDIX 3
Standardised Flour Price and Average
Financial Co s t of the Industrv
Marketing costs for the industry were approxima tel 'I $20 m.
for 1978. These were incurred in producing approximately 290, 000
wheat equivalent tonnes of flour (see section 5.2.2). Therefore, the
average marketing costper (W.E.) tonne = $20 m./.29
= $68.97.
Converting to flour $68.97 x 1.28 = $88.28 per tonne
For the year ended 31 January 1979, the average cost per
tonne for whea t including storage and brokerage paid by the Wheat
Board was:
$35,532,925/292,755 tonnes = $124.79/tonne.
(Source: New Zealand Wheat Board 13th Annual Report).
Allowing for 15 per cent inflation to adjust to 1979 prices
$124.79 xl. 1 5 = $143. 51 •
Converting from whea t to flour
$143.51 x 1.28 = $183.69.
Adding the marketing cost component
$183.69 + $88.28 = $271.97.
This cost is close to the price charged for flour in bulk and
sacks throughout New Zealand effective from 16 February 1979;
this was $270.00 per tonne.
(Source: New Zealand Wheat Board, 1979).
Although the financial costs of the industry are close to the
price charged for flour, this does not necessarily mean the. ~Jrice
charged is close to the social cost of the industry. For instance,
131.

132.
by preventing imports of Australian wheat and flour, this may
impose an opportunity cost on consumers; that is, it might result
i.n flour being more expensive than it otherwise could be. This
would represent an additional social cost of the industry.

RECENT PUBLICATIONS
RESEARCH REPORTS
90. A Transport Survey of South Island Farmers, S.L. Young, T.r. Ambler, S.]. Filan, 1979.
91. Bread: A ConSllmel' Survey of Christchurch Househvlds, R]. Brodie and M.]. Mellon, 1978.
92. An Econvmic Survey of New Zealand Wheatgrowers. Survey No.2 1977-78, L.E. Davey, RD. Lough, S.A. Lines, RM. Maclean, RG. Moffitt, 1978.
93. An Economic Survey of New Zealand Town Milk Prvducers, 1976-77, L.E. Davey, RG. Moffitt, M. Pangborn, 1978.
94. Marketing Costs fvr New Zealand Meat Expvrts, 7970/71 to 1975/76, P.D. Chudleigh, M. Clemes, L.D. Woods, 1978.
95. Interfibre Relationships and Texttle Marketing in Japan, G. W. Kitson, 1978.
96. Survey of New Zealand Farmer Intentivns, Expectations, and Opinivns,June-August 1978, ].G. Pryde, 1978.
97. Peak Wool Flows through the Marketing System, S.K. Martin, 1979.
98. An Economic Survey of New Zealand Tvwn Milk Producen; 1977-78, RG. Moffitt, 1979.
99. The Regivnal Impacts of Irrigativn Development in the Lower Waitakt; L.]. Hubbard, W.A.N. Brown, 1979.
100. Recent Trends in the Argentinian Wool Industry, S.K. Martin, 1979.
101. An Economic Survey of New Zealand Wheatgrowers; Enterprise Analysis, Survey No.3, 1978-79, RD. Lough, RM. MacLean, P.J. McCartin, M.M. Rich, 1979.
102. Cheese: A Consumer Survey of Christchurch Hvusehvlds, R]. Brodie, M.J, Mellon, 1979.
103. A Study of Excess Livestock Transport Cvsts in the South Island of New Zealand, RD. Inness, A.C. Zwart, 1979.
104. An Econvmic Survey vf New Zealand Wheatgrowers: ]<,'nancial Analysis, 1977-78, RD. Lough, RM. MacLean, P.]. McCartin, M.M. Rich, 1979.
105. Potatoes: A Consumer Survey of Christchurch and Auckland H vmeholds, M.M. Rich, M.]. Mellon, 1980.
106. Survey vf New Zealand Farmer Intentions and Opinions, JulySeptember, 1979, ].G. Pryde, 1980.
107. A Survey of Pests and Pesticide Use in Canterbury and Southland, ].D. Mumford, 1980.
108. An Economic Survey of New Zealand Town Milk Producers, 1978-79, RG. Moffitt, 1980.
109. Changes in United Kingdom Meat Demand, RL. Sheppard, 1980.
110. Jjrucellosis Eradication: a descrIption of a planning model, A. C. Beck, 1980.
111. Fish: A Consumer Survey of Christchurch Households, R]. Brodie, 1980.
112. An Allalysis of Alternotive Wheat Pricing Schemes, M.M. Rich, L.]. Foulds, 1980.
113. An Economic Survey of New Zealand Wheatgrowers; Enterprise AnalYSis, Survey No.4 1979-80, RD. Lough, RM. MacLean, P.]. McCartin, M. M. Rich, 1980.
114. A Review of the Rural Credit System in New Zealanrl, 1964 to 1979, ].G. Pryde, S.K. Martin, 1980.
115. A Socio- Economic Study of Farm Workers and Farm Managers, G.T. Harris, 1980.
116. An Economic Survey of New Zealand Wheatgrowers: Financial Analysis, 1978-79, RD. Lough, RM. MacLean, P.]. McCartin, M.M. Rich, 1980.
117 Multtpliers frvm Regional Non-Survey Input- Output Tables for New Zealan{l, L.]. Hubbard, W.A.N. Brown, 1981.
118 Survey of the Health of New Zealand Farmers: October- November 1980, ].G. Pryde, 1981.
119 Horticulture in Akarva County, RL. Sheppard, 1981.
120. All Ecvnomic Survey of New Zealand Town Milk Prodlicen; 1979-80, RG. Moffitt, 1981.
121. An Economic Survey of New Zealand Wheatgrowers: Enterprise Analysis, Survey No. 51980-81, RD. Lough, P.]. McCartin, M.M. Rich, 1981.
122. An Econvmic Survey vf New Zealand Wheatgrvwers: Financial Analysis 1979-80, RD. Lough, P.J, McCartin, M.M. Rich, 1981.
123. Seasvnality in the New Zealand Meat Prvcessing Industry, RL. Sheppard, 1982.
124. The New Zealand Wheat and Flvur Industry: Market Stmctureand Pvlicy Implicativns, B.W. Borrell, A.C. Zwart, 1982.
125. The Ecvmvmics vf Svil CvtlServativn and Water Management Policies itl the Otago High COlitlfly, G.T. Harris, 1982.
126. Survey of New Zealand Farmer Intelltivm alld Opillivns, SePtembel~ Novembel; 1981, ].G. Pryde, 1982.
DISCUSSION PAPERS
40. New Zealalld Agriculture alld Oil Price Ilicreases, P.D. Chudleigh, S. L. Young, W.A.N. Brown, 1979.
41. ProceedillgJ of a Semillar 1211 The Development of Rational Pvlicies for Agricultural Trade betweell New Zealalld a1ld Japan, A.C. Zwart, L.]. Wilson (eds), 1979.
42. A Review of the New Zealalld Goat Ilidustry, RL. Sheppard, D.K. O'Donnell, 1979.
43. Gvats: A Biblivgraphy, D.K. O'Donnell, RL. Sheppard, 1979.
44. ProceedillgJ of a Semillar/Workshvp 011 the New Zealand Goat Industry, R]. Brodie, RL. Sheppard, P.D. Chudleigh (eds), 1979.
45. All Evaluatioll vf the Southland Flood Relief TempvrmJ' Emplvyment Programme, G. T. Harris, T. W. Stevenson, 1979.
? 46. Ecollvmic Factvrs Affecting Wheat Areas j'(ftfhin New Zealalld, M.M. Rich, A.c. Zwart, 1979.
47. Japallese Fvod Policy and Self Sufficiellcy-AII Allalysis with Referellce to Meat, RL. Sheppard, N.]. Beun, 1979.
48. Corporate Stl'llcture of a Beet-Ethallvl Illdustly, W.A.N. Brown, I.B. Dent, 1980.
49. 'The Cost vf Overseas ShzPPillg: Who Pays? P.D. Chudleigh, 1980.
50 Market Evaluatioll: a Systematic Approach - Frozen Greell Sproutillg Broccoli; RL. Sheppard, 1980.
51 The E. E. C Sheepm('at Regime: Arrallgemellts allt} [mplications, N. Blyth, 1980.
52 Proceedillgs of a Semillar VII "Future DirectiollJ for New Zealalld Lamb Marketillg". edited by RL. Sheppard, R]. Brodie, 1980.
53ThI' Evaluatioll of Job CreativlI Programme.r wztb Particular Reference to the Farm Employmellt Programme, G. T. Harris, • 1981.
54. The New Zealalld Pastoral Livestock Sector: a prelimil2(lIY eCOllometric mode/, M. T. Laing, A. C. Zwart, 1981.
55. The Schedule Price System alld the New Zealalld Lamb Producer, N. M. Shadbolt, 1981.
56. Tbe Further Processillg ofiVleat, K.M. Silcock, RL. Sheppard, 1981.
57. JapalleJe Agricultural Policy Developmellt: Implicatiolls for New Zea/all(1, A. C. Zwart, 1981.
58. IlItereJt Rates: Facts al/d Fallacies, K.B. Woodford, 1981.
59. The EEC Sheepmeat Regime: Olle Year 011, N. Blyth, 1981.
60. A Review vf the World Sheep7lleat Market: Vol. 1 - Overview of Intertlatiollal Trade, Vol. 2 - AlIStralia, New Zealalld & Argentilla, Vvl. 3 - The EEC (10), Vol.4 - Nortb America, Japall & The Middle East, Vvl. 5 - Eastern Bloc, Us. S.R. & MOllgvlia, N. Blyth, 1981.
61. An Evalltatioll of Farm Ownership Savillgs Accounts, K.B. Woodford, 1981.
Additional copies of Research Reports, apart from complimentary copies, are available at $6.00 each. DiscussiOl: Papers are usually $4.00 but copies of Conference Proceedings (which are usually published as Discussion Papers) are $6.00. Discussion Paper No. 60 is available at $4.00 per volume ($20 for the set). Remittance should accompany orders addressed to: Bookshop, Lincoln College, Canterbury, New Zealand. Please add $0.90 per copy to cover postage.