Embed Size (px)
Citation preview

The New Science Policy: Linking Research to Societal Outcomes
Michael CrowChair, Center for Science, Policy, and Outcomes, and Professor, School of International and Public Affairs, and Executive Vice Provost, Columbia University
May 1, 2001

Foundations of Science Policy
Republic of Science
Market Failure Model
Unpredictability
Democratic Science
Sociotechnical Outcomes Model
Prediction with Uncertainty
Current Enhanced

Inputs Processes Products Outcomes
Current (Linear) Approach to Science Policy
Input-driven process assumes: All societal outcomes will be positive Linear model of innovation and societal benefit

Linking Scientific Research and Science Policy to Societal Outcomes
Genetically-Modified Organisms (GMOs)

Science is a Principal Driver of Change
Social change
Internet
Environmental change
Climate
National security change
Weapons of mass
destruction
Health and Medicalchange
BiotechnologyScience-based
economy

A New Science Policy Framework: Outcome-Driven
IntegratedInformedSelf-correctingRecognizes and responds to the
inextricable links between science and technology and societal evolution
Perspectives
Daniel Sarewitz: How does the science that we do affect the social choices we make?
Barry Bozeman: How do the S&T programs we implement affect the distribution and equity of outcomes?

Global Climate Change and Societal Outcomes
Daniel SarewitzSenior Research ScholarCenter for Science, Policy, and OutcomesColumbia UniversityMay 1, 2001
How does the science that we do affect the social choices we make?

Geophysical SystemsResearch
Social SystemsResearch
BiologicalSystemsResearch
Technological SystemsResearch
Components of Environmental Science

“Ourspecial report explores the hard scientific evidence of thegreenhouse effect and the White House stand against a treatyintended to keep things cool.”Time MagazineApril 9, 2001

Fundamental Research
Predictive Models
Policy Decisions
Societal Benefits
Standard (Linear) Model of Science for Decision Making

Radiative Forcing
0.00
1.00
2.00
3.00
4.00
5.00
6.00
7.00
1990 2010 2030 2050 2070 2090
Year
Climate change scenarios:
We cannot dictate global socioeconomic paths
Source: S. Smith, PNL/Battelle
(Warming)

Local land use affects climate at every scale
Source: C. Ziegler, NOAA


Major Disasters
1900 1920 1940 1960 1980 2000
60
40
20
0
> 100 killed > 1% of population affected >1% nat’l GDP
Source: OFDA/CRED International Disaster Data Base

Source: R. Pielke Jr.

Hurricane Mitch, October 22 - November 5, 1998
Human Impacts
Deaths >10,000People affected 1.7 million
Source: NOAA/OGP
Economic Impacts
Country Losses % of GDP
Nicaragua US$2 billion 50%Honduras US$4 billion 100%
Source: The Economist 11/14/98; slide courtesy of R. Pielke Jr.

Name Date Country Estimated
deaths in year of hurricane
Projected deaths in 1998
UNNAMED 1-6 Sep 1930 Dom. Rep. 4,700 23,000
UNNAMED 4-8 Jun 1934 El Salvador Honduras
2,250 9,500
FLORA 30 Sep–8 Oct 1963 Haiti Cuba
7,400 11,000
FIFI 14-19 Sep 1974 Honduras 6,200 15,000
MITCH
27-29 Oct 1998
Honduras Nicaragua El Salvador Guatemala
10,000
Notes: Average of losses reported in Rappaport et al. 1995. (Sources: IFRCRCS 1999; Rappaport et al. 1995; NCC 1975, 1979, 1980)
Source: Pielke, Rubiera, Landsea, and Klein 2000
1998 Estimated Deaths from Historical Central American and Caribbean Hurricanes

Major Disasters
1900 1920 1940 1960 1980 2000
60
40
20
0
> 100 killed > 1% of population affected >1% nat’l GDP
Source: OFDA/CRED International Disaster Data Base
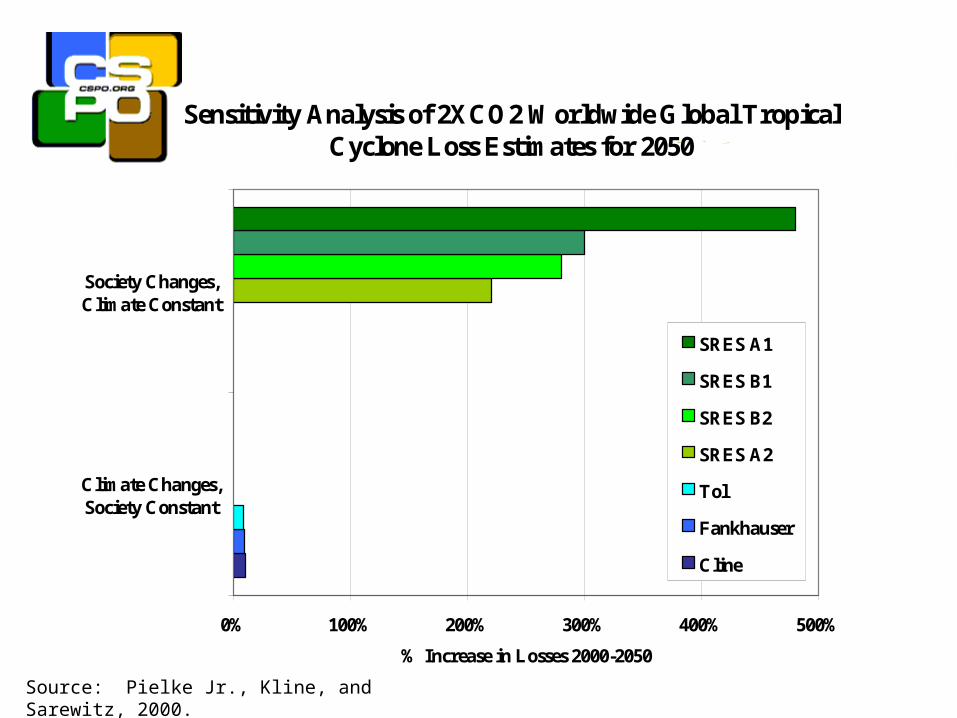
Sensitivity Analysis of 2XCO2 Worldwide Global Tropical Cyclone Loss Estimates for 2050
0% 100% 200% 300% 400% 500%
Climate Changes,Society Constant
Society Changes,Climate Constant
% Increase in Losses 2000-2050
SRES A1
SRES B1
SRES B2
SRES A2
Tol
Fankhauser
Cline
Source: Pielke Jr., Kline, and Sarewitz, 2000.

Life and Death in the Promised Land, July 2000 (Manila, Philippines)

Not Control But Navigation
Because the pathway to sustainability cannot be charted in advance, it will have to be navigated through trial and error and conscious experimentation.
National Research Council, 2000 Our Common Journey

How does the science that we do affect the social choices we make?

Science and Technology Policy in the States: Economic Development for Whom?
Barry BozemanRegents Professor, School of Public Policy, Georgia Tech and Distinguished Scholar, Center for Science, Policy, and Outcomes, Columbia University
May 1, 2001

How do the S&T programs we implement affect the distribution and equity of outcomes?

New “Laboratories of Democracy”
University-Industry “Centers of Excellence”
Research ParksBusiness IncubatorsTechnology Development CentersManufacturing Assistance Programs

Stimulate science and technology
Build new businesses
Create wealth in the state
Societal Benefits
The Linear Theory of Innovation: State Government Version
Income transfer from middle income taxpayer to the wealthy

Why are problems of employment and distribution of income S&T Issues?
S&T and social issues critically interdependent
Technology strategy drives government spending and its social outcomes
Linear thinking in technology policy is linear thinking in social outcomes

A Case Study: Georgia
Top five in spending for S&T ProgramsFY2000: $51 millionUniversities highly effective
technology transfer sites Strong Hi-Tech base in Metro Atlanta But…Booming and Busting at the
Same Time
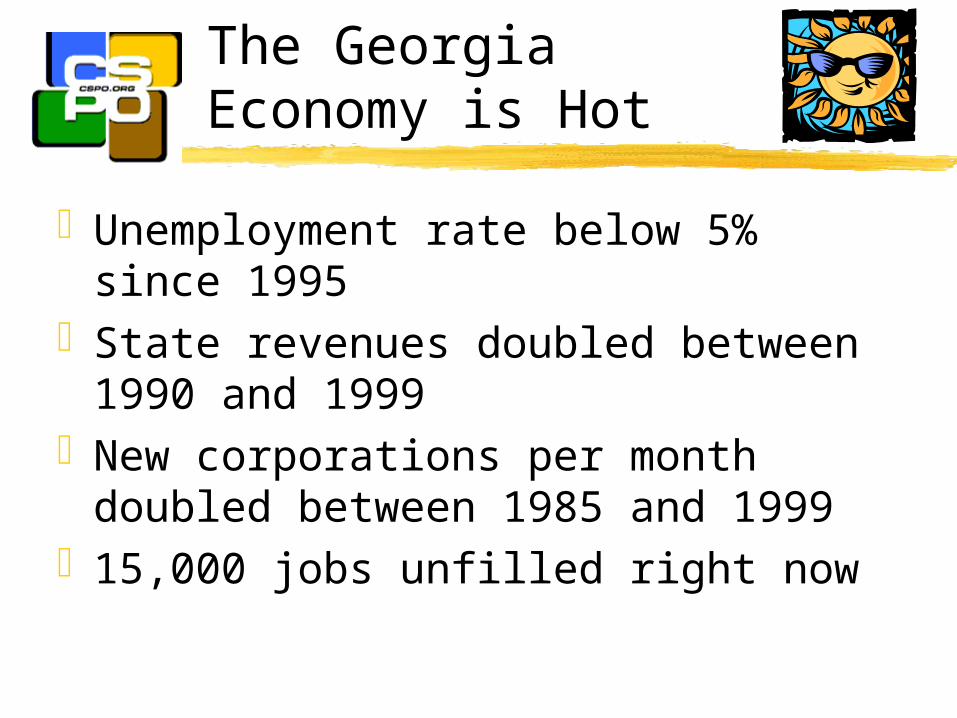
The Georgia Economy is Hot
Unemployment rate below 5% since 1995
State revenues doubled between 1990 and 1999
New corporations per month doubled between 1985 and 1999
15,000 jobs unfilled right now
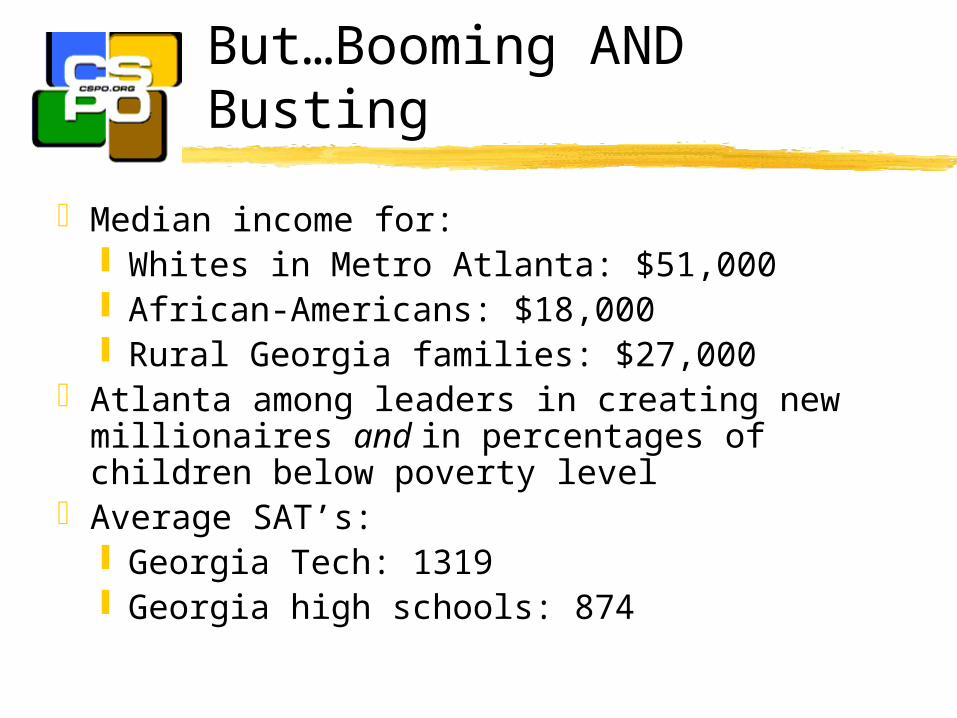
But…Booming AND Busting
Median income for: Whites in Metro Atlanta: $51,000 African-Americans: $18,000 Rural Georgia families: $27,000
Atlanta among leaders in creating new millionaires and in percentages of children below poverty level
Average SAT’s: Georgia Tech: 1319 Georgia high schools: 874

Georgia has the worst high school graduation rate in the nation

TABLE ONE. Budget: R&D Based Economic Development Programs of State of Georgia.
Traditional Georgia Advanced TechnologyIndustries Research Development Total Initiatives Alliance (GRA) Center (ATDC) ($ in thousands)
1993 . 15,050 1,555 16,6051994 2,200 22,000 1,581 25,7811995 5,172 44,625 1,886 51,6831996 5,915 29,744 1,979 37,6381997 7,615 40,129 2,282 50,0261998 6,160 38,925 2,388 47,4731999 7,150 42,400 2,178 51,728
Source: Budget Report 2000, 1999, 1998, 1997, 1996 State of Georgia

Georgia Research Alliance
Mission: “to foster economic development within Georgia by developing and leveraging the research capabilities of research universities within the state and to assist and develop scientific and technology-based industry.”

Georgia Research Alliance: Research Centers
Georgia Center for Advanced Telecommunications Technology (GCATT)
Georgia Biotechnology Center (GBC)Georgia Environmental Technology
Consortium (GETC)Alliance Technology Ventures

Georgia Research Alliance: Impact
GRA Sponsored Research Programs: $700 M in 1996.
Intellectual Property: licenses increased from 22 in 1990 to almost 50 in 1996.
Industry-University Collaboration Start-Ups Research Partnerships

Is Georgia S&T Policy a “Success”?
Yes: Creates jobs, creates wealth, does a lot with a little
No: Exacerbates wage gaps, promotes uneven development, contributes to suburban rim sprawl

Is the Georgia Economic Case Representative?
Poorest 20% of U.S. population had declining real income 1977-1999
Number of full-time workers with poverty level incomes increased by 459,000 in 1998

Running in Place, Running Ahead:
The median wage earner has advanced only 8% in income growth during past two decades

The Dual Agenda: Science and Social Equity
The Challenge: to develop science and technology policy that reaches the significant proportion of each state’s working poor who have been bypassed by the economic boom...

Why a Dual Agenda?
Public programFairness Raw self interest

Outcomes Challenge
Quality of LifeCooperative Technology EducationRe-focused Centers of Excellence
Programs

How do the S&T programs we implement affect the distribution and equity of outcomes?

Science Policy Research Needs
New science policy indicatorsNew tools of evaluationNew vision for what science can bring to our
futureEducation of scientists and politiciansReplace Cold War paradigm as outmoded

Conductof Science
EconomicOutcomes
S&TOutcomes
SocietalOutcomes
POLICY New industries
Tech transfer
Knowledge transfer
Partnerships
New social structures
EducationNew skills
New institutions
Linking Scientific Research to Societal Outcomes: New Models

Morality and Science
What is the collective good that we want inquiry to promote?
Philip Kitcher, Professor of Philosophyin Science, Truth and Democracy, to be published, 2001


