Embed Size (px)
Citation preview

Economic Forces in American History
1
The New Deal

Economic Forces in American History
2
The New Deal: Outline
Explaining the Depression’s Length
Slow Recovery?
Fast Recovery?
New Deal Legislation
World War II: The true fiscal stimulus
Martha Olney (U.C. Berkeley)

Economic Forces in American History
Table 1. Unemployment Rate
1920 5.2 1931 16.3
1921 11.7 1932 24.1
1922 6.7 1933 25.2
1923 2.4 1934 22.0
1924 5.0 1935 20.3
1925 3.2 1936 17.0
1926 1.8 1937 14.3
1927 3.3 1938 19.1
1928 4.2 1939 17.2
1929 3.2 1940 14.6
1930 8.9 1941 9.9
Source: Historical Statistics, Series D8.
3
The Slow Recovery Unemployment above 10 % until 1942

Economic Forces in American History
4
Path of Real GDP
Real GDP doesn’t return to trend until 1941
Economic Forces in American History
5
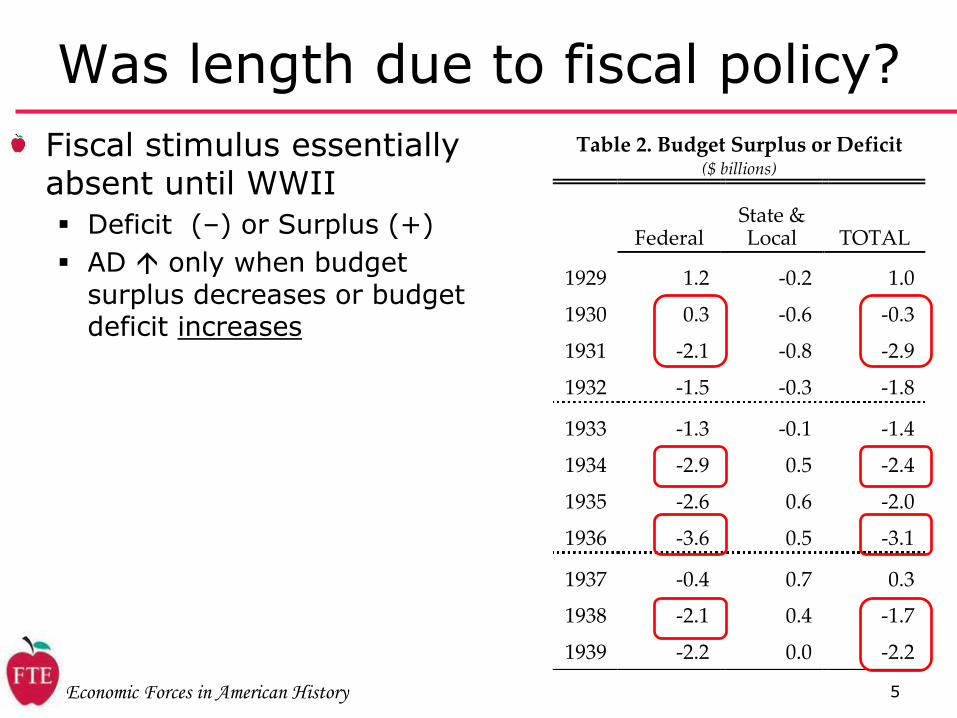
Was length due to fiscal policy?
Fiscal stimulus essentially absent until WWII
Deficit (–) or Surplus (+)
AD only when budget surplus decreases or budget deficit increases
Table 2. Budget Surplus or Deficit ($ billions)
Federal State & Local TOTAL
1929 1.2 -0.2 1.0
1930 0.3 -0.6 -0.3
1931 -2.1 -0.8 -2.9
1932 -1.5 -0.3 -1.8
1933 -1.3 -0.1 -1.4
1934 -2.9 0.5 -2.4
1935 -2.6 0.6 -2.0
1936 -3.6 0.5 -3.1
1937 -0.4 0.7 0.3
1938 -2.1 0.4 -1.7
1939 -2.2 0.0 -2.2
Source: Historical Statistics, Series F558-F560.

Economic Forces in American History
Table 3. Net Shift in Full-Employment Demand As a Percent of Full-Employment GNP
Federal State & Local Total
1929 -0.4 1.8 1.4
1930 0.0 2.0 1.9
1931 1.7 1.8 3.6
1932 1.0 0.9 1.8
1933 0.5 0.1 0.5
1934 2.0 -0.4 1.5
1935 1.9 -0.3 1.6
1936 2.5 0.2 2.7
1937 0.1 0.1 0.2
1938 1.2 0.0 1.2
1939 1.4 0.5 2.0
Source: E. Cary Brown, “Fiscal Policy in the ‘Thirties: A
Reappraisal,” American Economic Review (Dec. 1956): 864-
865.
6
Discretionary fiscal policy untried
Here, as % of full employment GNP
Deficit (+) or Surplus (–)
Expansionary policy could have helped:
1931 & 1936 deficit expansion due to payment of Veterans’ Bonus
Increased consumer spending resulted

Economic Forces in American History
7
Was length due to monetary policy?
Friedman & Schwartz: Fed inaction

Economic Forces in American History
8
Was length due to structural change?
Investment Falling
Textiles
Iron & Steel
Lumber
Investment Rising
Appliances
Chemicals
Processed Food
Petroleum
Tobacco
Michael Bernstein

Economic Forces in American History
9
Why Recovery Was So Fast Christina Romer
Rapid GNP & money supply growth
Table 4. Fast Recovery
real GNP ($ Billions)
%Δ of real GNP
M2 (Billions)
%Δ in M2
1929 203.6 6.7 46.60 0.4
1930 183.5 -9.9 45.73 -1.9
1931 169.3 -7.7 42.69 -6.6
1932 144.2 -14.8 36.05 -15.6
1933 141.5 -1.9 32.22 -10.6
1934 154.3 9.0 34.36 6.6
1935 169.5 9.9 39.07 13.7
1936 193.0 13.9 43.48 11.3
1937 203.2 5.3 45.68 5.1
1938 192.9 -5.1 45.51 -0.4
1939 209.4 8.6 49.27 8.3
Source: Real GNP: Historical Statistics, Series F3 and X415.
Figure 1Figure 1

Economic Forces in American History
10
Comparing Fiscal & Monetary Policy

Economic Forces in American History
12
New Deal Legislation
FDR goals
Relief
Recovery
Reform
Mostly legislative
Limited fiscal stimulus
Economic Forces in American History
13
New Deal: Banking & Finance
Bank Holiday, 3/6/1933
Glass-Steagall Act (1933)
Banking Act (1933)
Bank Act (1935)
Securities & Exchange Act (1934)

Economic Forces in American History
14
New Deal: Industry
National Industrial Recovery Act (NIRA, 1933)
National Recovery Administration (NRA, 1935)

Economic Forces in American History
15
New Deal: Agriculture
Agricultural Adjustment Act, (AAA, 1933)
Agricultural Adjustment Act, (AAA, 1938)

Economic Forces in American History
16
New Deal: Labor
Works Progress (Projects) Administration (WPA)
Public Works Administration (PWA)
Civilian Conservation Corps (CCC)
Table 5. New Deal Relief Spending, 1933-39 (millions of $)
Total Grant to
States
Amount Used as Work Relief
Earnings
FERA $3,017 $1,238
CCC 2,622 1,734
CWA 807 718
WPA 6,804 6,586
FSA 273 100
PWA 1,791 - - -
$10,376
Source: Hughes and Cain, American Economic History, 4th
edition, Table 25.3, p. 454; attributed to John Wallis.
Note: PWA expenditures were for public infrastructure
and were therefore not counted as “relief” expenditures.
Federal Emergency Relief Act (FERA, 1933), which included

Economic Forces in American History
17
New Deal: Labor Federal Emergency Relief Act (FERA, 1933)
National Labor Relations Act (NLRA, Wagner Act, 1935)
Fair Labor Standards Act (1938)
Table 6. Federal Minimum Wage, Years when Changes Enacted, 1938 -1997
Year Increase Implemented Nominal
Real (1998 dollars)
1938 0.25 2.89
1939 0.30 3.52
1945 0.40 3.62
1950 0.75 5.07
1956 1.00 5.99
1961 1.15 6.27
1963 1.25 6.66
1967 1.40 6.83
1968 1.60 7.49
1974 2.00 6.61
1975 2.10 6.36
1976 2.30 6.59
1978 2.65 6.63
1979 2.90 6.51
1980 3.10 6.13
1981 3.35 6.01
1990 3.80 4.74
1991 4.25 5.09
1996 4.75 4.93
1997 5.15 5.23
2005 5.15 4.30
Source: U.S. Department of Labor, “Value of the Federal
Minimum Wage, 1938-1997,
ttp://www.dol.gov/esa/minwage/chart.htm (accessed
11/6/06). Updated to 2005 using CPI data from U.S. Economic
Report of the President 2006, Table B-60, adjusted to 1998 base
year.

Economic Forces in American History
18
New Deal: Labor, continued
Federal Emergency Relief Act (FERA, 1933)
National Labor Relations Act (NLRA, Wagner Act, 1935)
Fair Labor Standards Act (1938)
Social Security Act (1935)

Economic Forces in American History
19
World War II Mobilization
Federal budget deficit increased . . . lots!
From $3 billion
Less than 3% of GDP
To over $50 billion
over 30% of GDP
Table 7. Federal Govt Spending, 1939-1947
(Billions of $)
TA G + TR
Budget Balance
BS (BD) / GNP
1939 6.6 9.4 -2.9 -3.3
1940 6.9 9.6 -2.7 -2.8
1941 9.2 14.0 -4.8 -4.3
1942 15.1 34.5 -19.4 -13.7
1943 25.1 78.9 -53.8 -30.8
1944 47.8 94.0 -46.7 -23.3
1945 50.2 95.2 -45.0 -10.7
1946 43.5 61.7 -18.2 -8.7
1947 43.5 36.9 6.6 3.0
Source: Historical Statistics, Series Y339-Y341, F1.

Economic Forces in American History
20

Economic Forces in American History
21
War Finance: Bonds
WWII paid for with
Taxes 46%
Borrowing 54%
Borrowed from
Households 23%
Banks 40%
Nonbank institutions 37%

Economic Forces in American History
22
War Finance: Bonds

Economic Forces in American History
23
Interest Rates Kept Low
In 1942, the Fed promised the Treasury:
“We will keep nominal rates low”
Promise ends in 1951 with “Accord”

Economic Forces in American History
24
Labor Force Changes
1940
Labor Force = 32 million
1943
Labor Force = 42 million
Military = 9 million
Where did all those people come from?

Economic Forces in American History
25
Rosie the Riveter Was Rosie a housewife drawn into the labor force by patriotic appeal?
No.
Rosie the Riveter was often a woman with previous manufacturing experience, not a housewife.

Economic Forces in American History
26
Women Aided the War Effort