Embed Size (px)
Citation preview
The Neural and Behavioral Processes Underlying Limb Selection
by
Rebecca Handelman Stoloff Elenzil
A dissertation submitted in partial satisfaction of the
requirements for the degree of
Joint Doctor of Philosophy
with the University of California, San Francisco
in
Bioengineering
in the
Graduate Division
of the
University of California, Berkeley
Committee in charge:
Professor Richard Ivry, Chair
Professor Srikantan Nagarajan
Professor Jon Wallis
Fall 2013

Copyright 2013
by Rebecca Handelman Stoloff Elenzil
All rights reserved.
1
ABSTRACT
The Neural and Behavioral Processes Underlying Limb Selection
by
Rebecca Handelman Stoloff Elenzil
Joint Doctor of Philosophy
with the University of California, San Francisco
in
Bioengineering
University of California, Berkeley
Professor Richard Ivry, Chair
In the process of planning a reaching movement, people have two principle decisions: where to reach and which limb to reach with. Recent investigations have shed light on how the brain integrates value information about different stimulus-outcome pairs in order to make this first decision. However, recent work in neuroeconomics, while abundant, has almost exclusively focused on how we decided between stimuli external to the body and ignored how we decide between our two limbs.
In this dissertation, I explore the psychological processes and neural correlates of hand choice in three experiments, all of which involve an unconstrained reaching task. The first study demonstrates that hand choice is influenced by recent reinforcement history: People increase the use of the non-dominant hand when the likelihood of hitting the target with the non-dominant hand is increased and/or the likelihood of missing the target with the dominant hand is decreased. In the second study, I use functional neuroimaging to explore the neural correlates of hand choice, comparing conditions in which people are either directed to use the left or right hand or free to choose between the two hands. The free choice condition led to increased hemodynamic activity in a network of cortical and subcortical areas, including the medial prefrontal cortex, posterior parietal area, basal ganglia, and cerebellum. In the third experiment, I lay the groundwork for a full characterization of the neural regions involved in value-based decision making between two targets and two limbs.

i
This dissertation is dedicated to my always loving, ever supportive husband
Orion X Wilson X Elenzil
You are the light of my life.

ii
ACKNOWLEDGEMENTS
Thank you to all the members of CognAc for their feedback through the years: Flavio Oliveira, Peter Butcher, Sarah Hillenbrand, Ryan Morehead, Alex Carstensen, Lu Labruna, Alit Stark-Inbar, Matt Crossley, Ian Greenhouse, Nola Klemfuss, and Laura Hieber. A special thank you to Arne Ridderikhoff and John Schlerf for their programming assistance and Jing Xu and Jordan Taylor for their help with the mathematical model for Chapter I. Another special thank you to my collaborator Dav Clark for his fMRI study design and analysis expertise for Chapter II. I am forever grateful to undergraduate research assistants Robert Lomerena, Molly Memel, Andy Noblet, and Si Wang for their assistance in hardware design and data collection.
Thank you to the members of my dissertation committee, Jon Wallis and Sri Nagarajan, for your valuable feedback. To my advisor Rich Ivry, thank you for sharing your time, patience, and brilliance. Thank you to my parents Betty and Bob and my sister Sarah for supporting me through the years. Thank you to my husband Orion for loving me and sustaining me. To my daughter Viva, you are a wonder. You have already brought me so much joy. To my friends: the members of the brass liberation orchestra, housemates through the years, bike touring partners, and many more, thanks for coming along for the ride, it’s been a blast!
I would like to thank my funding sources: (1) The National Science Foundation – Graduate Research Fellowship Program, (2) The National Science Foundation – Project Project: NSF BCS 0726685, and (3) The National Institute of Health – NIH R01 NS074917.
iii
TABLE OF CONTENTS INTRODUCTION 1-3 CHAPTER I: Effect of reinforcement history on hand choice in an unconstrained 4-24 reaching task. Abstract 4 Introduction 4-5 Methods Participants 5-6 Design and Procedures Experiment 1 6-7 Experiment 2 7-8 Analysis 8-10 Results Experiment 1 10-15 Experiment 2 15-18 Reinforcement Learning Model 19-20 Discussion 21-23 Acknowledgements 24 CHAPTER II: Neural processes underlying free limb selection. 25-36
Introduction 25-26 Methods Participants 26 Design and Procedures 26-29 Results Task Performance 29-30 Imaging Results 30-33 Discussion 34-36 Acknowledgements 36 CHAPTER III: The value-based decision processes of effector and target selection. 37-54 Introduction 37-38 Methods Participants 38-39 Design and Procedures 39-45 Hand Choice 40-41 Target Choice 41-42 Analysis 42-45 Results Choice Behavior 45-49 Reinforcement Learning Model 49-51 Discussion 51-54 CONCLUSION 55-56 REFERENCES 57-61
1
INTRODUCTION Reaching to grasp an object is one of our most fundamental skills. While people prefer to use their dominant hand, we show amazing flexibility in hand choice. Recent work in neuroeconomics has almost exclusively focused on how we decide between stimuli external to the body. This work has focused on how we make a decision such as do we want an ice cream cone with chocolate or vanilla ice cream. Ignored in this literature is the fundamental question of how we decide which hand to use to pick up the ice cream cone. The behavioral and neural correlates of limb selection are largely unknown, yet this is an elementary decision that we make hundreds of times each day. Characterizing this process is particularly compelling considering its potential application for physical rehabilitation after stroke. It is estimated that 795,000 strokes occur each year in the United States, making stroke the leading cause of serious, long-term disability and the 3rd leading cause of death (The Internet Stroke Center). Thus, the development of effective and accessible stroke rehabilitation therapies is of critical clinical importance. The debilitating condition that most often results from stroke is hemiparesis, the partial paralysis of the limbs contralateral to the lesion. In order for stroke patients to regain function such that they are able to participate in normal daily living activities, it is important to develop rehabilitation therapies that facilitate increased use of the affected side. Even after regaining the ability to control the affected limb, many stroke patients continue to exclusively use the unaffected limb. This behavior has been viewed as the consequence of compensatory strategies. During the recovery period, the patients have learned to perform tasks with their unaffected limbs and continue to do so through the operation of simple reward mechanisms. This behavioral mechanism has been termed learned non-use (Taub 2000). The learned non-use theory postulates that even if a patient has the ability to perform a task with their affected side, they will choose to use their unaffected side due to behavioral factors such as attention, motivation, and sense of effort (Sterr 2002). This mechanism arises from the negative reinforcement that patients receive when they initially try to use their affected limb following the stroke. Many rehabilitation strategies have focused on overcoming learned non-use as a means to increase the patients’ spontaneous use of the paretic limb. Han et al (2008) propose that rehabilitation training is required to increase spontaneous use of the paretic limb above a certain threshold in order to enter a virtuous circle of use and improved performance. Rehabilitation strategies that may help to reverse non-use and accelerate recovery after stroke include behavioral methods such as mirror visual feedback (MVF) therapy as well as physiological methods involving the excitation of the ipsilesional motor cortex and inhibition of the contralesional motor cortex with transcranial magnetic stimulation (TMS) (Ramachandran 2009, Oujamaaa 2009). One strategy that has shown clinical efficacy (Wolf 2007) in overcoming learned non-use is constraint-induced movement therapy (CIMT). As the name suggests, this method involves imposing a physical constraint on the unaffected limb in order to force the patients to use their affected limb. The behavioral gains arising from CIMT have been correlated with structural brain changes and thus seen as facilitating neuroplasticity (Gauthier 2008). While there is compelling evidence for the efficacy of CIMT in improving function following stroke (Wolf 2006), the long-term effects of this therapy have yet to be demonstrated. Furthermore, the therapy is labor intensive for the patient and therapist, and thus not accessible for many patients. In addition, a limitation of this therapy is that it relies on an external physical constraint. Investigations into

2
new strategies for overcoming learned non-use that fundamentally change the patients’ belief about the efficacy of their affected limb are necessary. An alternative avenue for promoting use of an affected limb would be to exploit intrinsic reinforcement mechanisms that promote the selection of that limb. The work described in Chapter I of this dissertation demonstrates that recent reinforcement history affects hand choice: People increase their use of the non-dominant hand when the likelihood of successfully hitting a target with the non-dominant hand is increased or the likelihood of missing the target with the dominant hand is increased (Stoloff 2011). Participants reported little awareness in either their shift in hand use or the change in reward rates. Furthermore, the hand choice data was well described by a model of reinforcement learning (Sutton 1998). The model offers the potential to develop predictive computational tools that can be used to rigorously assess protocols designed to facilitate increased use of the affected limb after stroke. Taken together, this study provides a proof of concept of a paradigm that could facilitate increased use of the affected side in hemiparetic patients and thus lays the groundwork for translational research investigating this potential. Behavioral and computational models provide one tool for investigating the mechanisms of limb selection. The development of translational methods, however, also requires basic neuroscientific investigations to define the mechanisms underlying limb selection. Studies in the decision making literature have shed light on how the brain integrates information to assess and compare the value of different stimulus-outcome pairs. A substantial body of work implicates the orbitofrontal cortex as the locus of the value signal (Chib 2009, Croxson 2009, Lim 2011, Wallis 2011). Furthermore, it has been suggested that the dorsomedial prefrontal and parietal cortex serve as a comparator for these value signals (Hare 2011). Moreover, it has been shown that neurons in the parietal cortex reflect the values of competing actions (Sugrue 2004). Tosono et al (2008) demonstrate that increased activation in the contralateral parietal area is correlated with an arbitrary visual reach decision, corroborating the idea that accumulation of sensory evidence for decision making is linked to the specific planned action (Tosoni 2008). In addition, Gershman et al (2009) demonstrated that that left striatum and intraparietal sulcus code right-hand choices (and vice-versa for the left-hand choices). While this work has emphasized that effector information is incorporated in the decision making process, the studies have generally entailed comparisons between different effector groups (e.g., hands vs. eyes). To date, no study has investigated the neural correlates of limb selection. Even within the motor control literature, the focus has been on identifying the neural correlates of planning movements with a specified limb. For example, neurons in the posterior parietal cortex code the position of a target with respect to the body (Batista 2001). Similar representations are observed in frontal motor regions, including dorsal premotor cortex. In this region, neurons may reflect the parallel preparation of reaches to multiple targets, with the dynamics of activity eventually settling on a choice (Cisek 2005). Recent work in humans (Beurze 2007) and in monkey’s (Hoshi 2000), dating back to 2000, has demonstrated that target and body-part information are integrated in premotor cortex and the posterior parietal cortex. However, these studies do not provide a choice in target and limb, but instead specify the target and the limb with subsequent cues and hence do not address the question of how the organism determines which limb should be used to perform the action. The work described in Chapter II and III of this dissertation is an investigation of the neural correlates of competition in limb selection. In the experiment described in Chapter II, I use functional magnetic resonance imaging (fMRI) to compare neural activity while participants
3
reach to targets on a touch pad in two different conditions: (1) participants are free to select their right or left limb for the reach and (2) participants are instructed which limb to reach with. While I am ultimately interested in exploring the neural correlates of variables that influence limb selection such as positive and negative reinforcement, it seemed essential to being with a simpler problem, asking about the neural networks that are engaged when people resolve the competition between the two limbs when reaching for an object when the main source of constraint is the location of the object. I hypothesize that the frontoparietal choice network that has been implicated in perceptual decision making will also be involved in the competitive process of limb selection. In addition, I anticipate that the cerebellum will be involved in the decision of what limb to reach with given its important role in motor control.
The investigation in Chapter III of this dissertation begins to explore the neural processes involved in the positive and negative reinforcement of right and left limb use. In this work, I directly compare a hand choice task with a more traditional object choice task. In both tasks, I manipulate the reinforcement history and use a model-based approach to explore the dynamics of decision making in these two contexts. Moreover, I compare the performance of neurologically intact participants to patients with cerebellar ataxia, examining the role of the cerebellum in value-based decision processes for both object and limb choice. If the cerebellum is particularly involved in limb selection given it involves an assessment of the accuracy of each hand, I anticipate that patients with cerebellar ataxia will be selectively affected in the hand choice task. Finally, through the implementation of a mathematical to characterize choice behavior in both the hand and target choice tasks, I lay the groundwork for the neuroimaging work that will identify the neural processes involved in reinforcement learning in effector selection.
4
CHAPTER I: Effect of reinforcement history on hand choice in an unconstrained reaching task. ABSTRACT
Choosing which hand to use for an action is one of the most frequent decisions people make in everyday behavior. We developed a simple reaching task in which we vary the lateral position of a target and the participant is free to reach to it with either the right or left hand. While people exhibit a strong preference to use the hand ipsilateral to the target, there is a region of uncertainty within which hand choice varies across trials. We manipulated the reinforcement rates for the two hands, either by increasing the likelihood that a reach with the non-dominant hand would successfully intersect the target or decreasing the likelihood that a reach with the dominant hand would be successful. While participants had minimal awareness of these manipulations, we observed an increase in the use of the non-dominant hand for targets presented in the region of uncertainty. We modeled the shift in hand use using a Q-learning model of reinforcement learning. The results provided a good fit of the data and indicate that the effects of increasing and decreasing the rate of positive reinforcement are additive. These experiments emphasize the role of decision processes for effector selection, and may point to a novel approach for physical rehabilitation based on intrinsic reinforcement.
INTRODUCTION
Reaching to grasp an object is one of our most common actions. In the process of planning a reaching movement, people have two principle decisions (Horowitz 1999): where to reach (target selection) and which limb to reach with (effector specification). Target selection decisions are often dictated by a desired goal. If we want to take a break from our writing, we may decide to reach for the cup of coffee. The decision processes underlying effector selection are less clear. While people prefer to use their dominant hand, we also show impressive flexibility in hand choice in ousr everyday behavior (Johansson 2006). For example, we sometimes use the left hand to pick up the cup and other times use the right hand. Similar flexibility is observed in a variety of behaviors such as pointing out directions to a lost traveler or pressing the elevator call button.
A substantial literature has focused exclusively on the problem of target selection, or more generally, decisions that require the person to make a choice between different objects. This literature has explored the relative importance of cost and reward in decision making (Rudebeck 2006), the neural representation of the value of competing perceptual targets (Churchland 2008; Cisek 2005; Sugrue 2004), and the effector-specific nature of these representations (Gershman 2009, Tosoni 2008). Goal-related activity in posterior parietal cortex (PPC) has been modeled as an accumulation process, resulting in the selection of one action over another (Batista 2001; Huk 2005; Churchland 2008; Seo 2009). Similar patterns of activation have been observed in frontal motor areas. Interestingly, activity in dorsal premotor cortex may reflect the presence of multiple response options, pointing to the parallel preparation of candidate movements, with the final selection of a single action dependent on a threshold process (Cisek 2006).
These studies have generally been restricted to experimental tasks in which a single effector is used (e.g., point to the chosen object) or effector selection is used to indicate the chosen object (e.g., use the left hand to chose object on the left). Work in humans (Beurze 2007; Medendorp 2005) and non-human primates (Hoshi 2000) has demonstrated that target and body-
5
part information are integrated in premotor cortex and the posterior parietal cortex. However, an external cue is typically used in these studies to specify the target and effector. Few studies have been conducted in which the participant must self-select which effector to use to reach for a single target. One exception here has been the work of Schieber and colleagues. When monkeys are free to use either hand to retrieve a food reward, their choice is strongly biased by hand preference (Lee 2006). However, this bias can be modulated by other factors such as the location of the stimulus, with the animals exhibiting a preference to reach to eccentric targets with the ipsilateral hand (Schieber 2000; Gabbard 2004; Gardiner 2006), and head position (Dancause 2010). Interestingly, hand/target choices were more closely linked with prior success for particular head/hand/location pairs rather than with movement speed, indicating that hand choice may be related to reinforcement history.
In the present pair of experiments, we examine the role of reinforcement on effector selection during reaching. Reinforcement is likely related to hand preference: we are more likely to be successful in producing a skilled action when using our dominant limb. Of course this is a bit of a chicken-and-egg question. Do we become more skilled with one hand because of an intrinsic preference for one hand over the other? Or do we choose the preferred hand because it is, intrinsically more coordinated? Ontologically, the answer is probably a bit of both, with handedness constituting a self-reinforcing process. Nonetheless, over a shorter time scale, people exhibit flexibility in hand choice and their choices here may reflect recent reinforcement history. You can imagine that if you spilled your coffee when last using the left hand to pick up the cup, you would become more likely to use the right hand the next time. However, if you are holding something with the right hand, you might still choose to use your left hand to pick up the coffee cup.
In this way, hand choice can be viewed as a decision process, with relative costs and rewards being assigned to competing action alternatives. Given that the likelihood of reward involves the effort of a particular action and the accuracy or proficiency of that action, we hypothesized that the competitive process underlying effector choice would be influenced by limb-dependent task success. To investigate the effect of reinforcement on hand choice, we varied limb-dependent task success in a target interception task. We first established a psychometric function describing hand choice as a function of target location in a task in which participants were free to use either their right or left hand. We then introduced an experimental manipulation in which we modified the reinforcement rate. Exploiting the fact that right-handed participants show an overall right-hand bias, we either increased the rate of positive reinforcement for the left hand, decreased the rate of positive reinforcement for the right hand, or simultaneously applied both manipulations. We compare the effectiveness of these manipulations in producing a shift in hand choice. Given this reinforcement-learning framework, we applied a Q-learning model to characterize the change in behavior over time.
METHODS
Participants. Fifty-six participants (27 females; age range 18-24) participated in Experiment 1 and
received course credit for their participation. Twenty-seven (16 females; age range 19-30) participated in Experiment 2 and were paid for their participation. All participants were right-handed. Data from six participants (three for each experiment) were excluded. Five participants were excluded because they almost always used one hand (right only=4; left only=1). One participant from Experiment 2 did not return for the second session. The protocol was approved

6
by the UC Berkeley Institutional Review Board and all participants provided informed written consent at the start of the test session.
Design and Procedures. Experiment 1. The experiment was performed in a virtual environment that interfaced with a 3-D
robotic manipulandum (PHANToM 1.5 System, SensAble Technologies). A mirrored projection system was used to display the visual stimuli (Figure 1). The participants' task was to reach through a target that appeared at one of 7 locations along a semicircular array. The participant held a robotic manipulandum in each hand and moved this device to reach through the target location. Movements were confined to the horizontal plane.
Figure 1. (A) A computer monitor projected stimuli onto a mirror, creating the impression that the stimuli were in the same plane as the participant’s hands. The robotic device restricted movement to this plane. (B) Stimuli appeared in one of seven locations in Experiment 1 (shown here) and one of nine locations in Experiment 2. While the visible size of the targets remained constant, a staircase algorithm adjusted the radius of a virtual target region that was used to achieve a specified reward rate.
Two green squares (2x2cm) centered 4.5 cm apart indicated the starting location for the
hands. At the beginning of each trial, participants were instructed to move two spherical cursors, corresponding to the positions of the two hands, into these start squares. After the start positions were maintained for 200 ms, the blue cursors disappeared and a red target appeared at one of 7 locations along a semicircular array approximately 9 cm from the start positions. The exact radius of the array was scaled to each individual’s arm length. The participants were instructed to reach with one hand until they saw the target explode, indicating a hit, or heard a tone (242 ms), indicating a miss. Vision of their hands was occluded by the mirror and the hand cursor was not displayed during the reaching movement. Thus, participants could not make online corrections to their movements.
The participants were trained to move at a comfortable speed. Auditory feedback was also used to indicate if the movement time fell outside a criterion window of approximately 300 - 700 msec. The precise time window depended on the arm-length scaled target distance. One sound was played if the movement time was too short (duration: 232 msec) and another sound was played if the movement time was too long (duration: 1200 msec). A high pitched beep was played if subjects stopped reaching before they hit the target (duration: 135 msec). These reaches were coded as errors and accounted for less than 2% of the trials.
Participants completed 12 experimental blocks of 100 trials each (1200 trials total). Within a block of 100 trials, the target appeared at the ±55° locations on eight trials, the ±30° and ±17.4° locations on 16 trials, and at the center location on 20 trials. This distribution was chosen to increase the sampling rate at locations in which participants were expected to use both hands (ambiguous locations). The eccentric, 55° locations were included to decrease the likelihood that
Monitor
Mirror
(A) (B)

7
participants would adopt a strategy of using one hand to reach to all of the targets. The sequence of target locations was randomized.
Across the 12 blocks, we manipulated the target reward rate. The first four blocks served as the baseline phase. During these blocks, the target reward rate was set to 68% for each hand (see below for description of how we controlled the reward rate). Blocks 5-8 constituted the manipulation phase. During these blocks, the target reward rate was adjusted differently for four participant groups: BOOST (n=12): The left hand reward rate was increased to 86% while the right hand reward rate remained at 68%; TAX (n=14): right hand reward rate was reduced to 50% while the left hand reward rate was maintained at 68%; BOTH (n=13): The reward rates for the left and right hands were adjusted to 86% and 50%, respectively; NOMANIP: (n=14): The target reward rates for both hands remained at 68%. The final four blocks served as the post-manipulation phase. Here the reward rate for all four groups was set to 68% for both hands.
The desired target reward rate was experimentally controlled using a variable ratio staircase procedure (Garcia-Perez 1998) in which the size of the virtual target was adjusted. The target displayed to the subjects was a consistent visual size (radius4 mm). However, we also defined a virtual target region; the hand had to pass within this region for the trial to result in a successful reach (i.e., a hit). The staircase procedure was used to adjust the size of the virtual target region. The size was decreased after a hit and increased after a miss. Following a miss, the radius of the virtual target region was always increased by 1.5 mm. Following a hit, the radius was reduced, with the amount of the reduction a function of the target reward rate. Reductions of 0.3 mm, 0.6 mm, and 1.5 mm were used for target reward rates of 86%, 68%, and 50%, respectively. Note that the radius of the virtual target was limb specific since the target reward rate for the two hands could differ during the manipulation phase.
To increase subject motivation, a point counter at the center of the screen kept a running tally on the number of hits. Between each block, the score for that block, as well as the total current score were displayed.
Before the start of the experimental blocks, participants performed one practice block of 100 trials. During the practice blocks, participants had online feedback of their hand position during the reaches (i.e., the spherical cursors remained visible). The virtual target and visible target were identical in this block and reinforcement was based on whether or not the participant's hand passed through the target. We also provided 10 practice trials with online feedback at the start of each of the 12 experimental blocks. These practice trials were included so that the participants remained calibrated throughout the experiment.
Awareness. We included a debriefing survey to assess participants' awareness of the experimental manipulation. Participants were asked if they had noticed any change over the course of the experiment. Specifically they were asked if the task got easier, harder, or stayed the same for the right and left hand. Additionally they were asked if they used one hand more than the other, and if this changed over the course of the experiment.
Experiment 2. The apparatus and stimulus displays were slightly modified in Experiment 2. First, we
updated the virtual environment to include angled mirrors, providing for better 3-D vision. Movements were again confined to the horizontal plane. Second, the density of targets near the midline was increased such that a target could also appear at ±8.6°, increasing the number of target locations from seven to nine. The eccentric target was moved in to ±45° from ±55°. In a 100-trial test block, targets appeared at the eccentric ±45° locations on six trials, at the three intermediary locations (±30°, ±17.4°, ±8.6°) on 12 trials each, and at the midline location on 16

8
trials. Third, approximate reach lengths were 11 cm compared to 9 cm in Experiment 1 (again scaled to arm length). Slightly longer reaches were possible given the new apparatus configuration. Fourth, a variable delay (50 - 250 ms) was introduced between the time the participants positioned their hands in the start squares and the onset of the target. Fifth, the point counter was not visible during the experimental blocks; summary feedback was only presented between blocks.
The design of Experiment 2 involved two primary changes in the experimental design. First, to obtain a better understanding of the differences in the effects of increasing and decreasing positive reinforcement on hand choice, a within-subject design was adopted with testing limited to the BOOST and TAX conditions. Second, we modified the target reward rates so they were identical for the BOOST and TAX conditions in the manipulation phase. For the BOOST condition, the target reward rate was 70% for each hand in the baseline and post-manipulation phases. During the manipulation phase, the reward rate for the left hand was set to 84% and the right hand remained at 70%. For the TAX condition, the target reward rate was 84% for both hands during the baseline and post-manipulation blocks. During the manipulation phase, the reward rate dropped to 70% for the right hand and remained at 84% for the left hand. Thus, the manipulation phase always involved a change in the reward rate of 14% for one hand, and resulted in target rates of 70% and 84% for the right and left hands, respectively. We again used a staircase procedure to produce the desired reward rates. The base step size was increased to 3 mm in Experiment 2, given the increase in reach distance and pilot work that indicated this would provide better experimental control of the reward rates.
The BOOST and TAX conditions were tested in separate sessions, separated by one day. Within each session, the participants completed twelve experimental blocks with 100 trials each (1200 trials total), divided into four baseline blocks, four manipulation blocks, and four post-manipulations blocks. Half of the participants started with BOOST and the other half started with TAX.
As in Experiment 1, participants completed a practice block of 100 trials at the start of the test session.
Awareness. We again included a debriefing survey to assess participants' awareness of the experimental manipulation. This survey was only given at the end of the second session. Participants were informed that they had been randomly assigned to one of two groups: Group A in which the reward rate for each hand was consistent throughout the experiment or Group B in which the reward rate changed in a way that corresponded to their particular condition. They were asked to indicate their perceived group assignment.
Analysis Percent Right Hand Use. To measure hand preference, we calculated the total percent
right hand use across all targets for each block. This value was also calculated for each target to obtain a psychometric function of hand choice as a function of target location. By fitting a logistic regression to this curve, we estimated the point of subjective equality (PSE), the theoretical point where the participant was equally likely to use his/her right or left hand. This procedure was performed separately for the three phases. To obtain estimates of the PSE values when performance was relatively stables, we limited the data set to the final two blocks of each phase (baseline: blocks 3-4; manipulation: blocks 7-8; post-manipulation: blocks 11-12). These values were entered into an ANOVA to determine the effectiveness of the experimental manipulations of reward rate.

9
Sequential Effects. We quantified sequential effects by calculating the probability of using the right hand at the center target on trial t given that the previous trial t-1 was either a right hand hit, a right hand miss, a left hand hit, or a left hand miss. Given the small amount of data for each pair of locations, the data were collapsed over the experimental phases and conditions. We also combined the data over all previous t-1 locations in an ANOVA designed to assess the probability of choosing the right hand on the current trial as a function of the Hand (right or left) and Outcome (hit or miss) from the previous trial.
Reaction Time. Reaction time was defined as the interval between the onset of the target and the time at which the chosen hand left the start box. Our primary focus with these data was to compare the reaction time to targets at the center location to those at the more peripheral targets (±30°, ±17.4° in Experiment 1 and ±30°, ±17.4°, ±8.6° in Experiment 2). We did not include the data from the most eccentric locations in the RT analysis since these locations were used much less frequently. We excluded the data from the first block since we observed that participants' generally showed a considerable reduction in RT over the first 100 trials as they became familiar with the task. In order to have the same amount of data in each phase, we also excluded the first block for the manipulation and post-manipulation phases.
Reinforcement Learning Model. A reinforcement learning model based on a temporal difference (TD) algorithm was fit to the data (Watkins 1992; Kaelbling 1996; Sutton 1998; Kaelbling 1996; Gersham et al 2009). The model assigns a value to each state-action pair where the state (s) is the target location and the action (a) is a right or left hand reach. The action values are learned and updated each trial t using the following update rule:
Q at+1c ,st+1( ) = Q at
c,st( ) 1!"( ) + "# t (1)
Q at+1u ,st+1( ) = Q at
u,st( ) 1!"( ) !"# t (2) where st represents the target location at the current trial t, and for the action, a, the superscript c or u refers to chosen and unchosen hand, respectively. The learning rate α is a free parameter. δ is the prediction error defined by the following equation:
(3)
The probability by which a particular action is chosen on trial t is a function of the current action-state value Q and is given by a “softmax” (logistic) rule:
(4)
On each trial, the probability of a particular action given by the softmax function was compared to a threshold of PT0.5 such that
at =R, if P(a | st ) > PtL otherise
! " # (5)
!
" t = rt #Q(at ,st )
!
P(a | st ) =eQt (a,st )
eQ(ai ,st )i=1
n
"

10
The Q values were initialized using the average percent right hand use (PER) over the baseline phase (first 4 blocks). The Q values were set to PER - 0.5, bounding them between -0.5 and 0.5. The model was fit to the data from the manipulation and post-manipulation phases (Blocks 5-12). We compared three models: Alpha_4: For this model, we allowed alpha to have a different value for each condition (Experiment 1: αBOOST, αTAX, αBOTH, αNOMANIP ; Experiment 2:
αBOOST-Day1, αTAX-Day1, αBOOST-Day2, αTAX-Day2); Alpha_1: Alpha was constrained to take on a single value for each experiment; No_Learn: A reinforcement-free model in which alpha was fixed at zero The No_Learn model serves as a null model. Here, hand choice is restricted to the biases exhibited during the baseline phase and does not depend on changes in reinforcement history. In contrast, hand choice can vary with reinforcement history in the Alpha_1 and Alpha_4 models. For the former, hand choice will vary with reward rate in the same manor in all four types of manipulations. For the latter, the learning rates may vary as a function of the type of manipulation. In particular, we included the Alpha_4 model to ask whether learning rate differed for changes related to increasing the rate positive reinforcement, decreasing the rate of reinforcement, or, in Experiment 1, both manipulations.
To obtain the best fitting values for the free parameter alpha in these Alpha_1 and Alpha_4 models, we minimized the negative log likelihood (-LL). For each value of alpha, the average percent hand use for each block, calculated from the data, was compared to the model prediction. The alpha value ranged from 0.01 to 0.49 and was incremented in steps of 0.01.
We used a bootstrapping (Fisher 1993) procedure to determine the best fit learning rate (alpha) for each of the models Alpha_1 and Alpha_4. We generated 1000 group averaged data sets by randomly resampling with replacement from the original participant pool and fit the models to each data set. To evaluate the model fits, we used the likelihood ratio test statistic (LR):
LR Model1 vs. Model2 -2(LLModel1-LLModel2) (6) We also calculated the Pearson correlation coefficient (R2). To compare Alpha_4 and Alpha_1 to No_learn models, we calculated a pseudo-R2 statistic defined as the (R-Q)/R where R is the –LL for the random choice model and Q is the –LL for the Alpha_4 and Alpha_1 (Gershman 2009). We explored models with more parameters. These included models in which different learning rates were set for the right and left hands, different learning rates were set for the chosen and unchosen hand, and models in which a temperature parameter that dictated how exclusively choices were restricted to the highest valued action was allowed to vary. These models did not significantly improve the obtained fits and, introduced considerable variability in the parameter selection. While a more complex model may capture nuances in the data, we focus on a simplistic model that can capture the way in which recent reinforcement history affects hand choice. RESULTS
Experiment 1 Reward rates. The observed reward rates were close to the desired target reward rates
(Figure 2A). Participants were rewarded slightly more often during the baseline and post-manipulation blocks than expected (69.3% compared to target rate of 68%). During the manipulation phase, the reward rate for the left hand increased to 83.1 ± 0.3% in the BOOST condition and fell to 49.9 ± 0.1% for the right hand in the TAX condition. Thus, while the experiment was designed to produce an 18% shift for both BOOST and TAX conditions, the

11
actual changes were approximately 14% and 19%. For the BOTH condition, the observed reward rates during the manipulation phase were 83.3 ± 0.3% % and 50.7 ± 0.2% % for the left and right hands, respectively.
Figure 2. Observed rewards rates for the right hand (red) and left hand (blue) Target reward rate was fixed for Blocks 1-4 (baseline), adjusted in Blocks 5-8 (manipulation), and then returned to the initial rates in Blocks 9-12 (post-manipulation). (A) Experiment 1 reward rates for the four experimental conditions (BOOST: increase reward rate for left hand, TAX: decrease reward rate of right hand, BOTH: both tax and boost manipulations, NOMANIP: no manipulation. (B) Experiment 2 reward rates for the two experimental conditions and two subjects groups.
Percent Right Hand Use/PSE. The psychometric function for hand choice was very steep (Figure 3A). Participants almost always used the right hand to reach for the three target locations in the right visual field, even during the manipulation phase when the reward rates favored left hand use. The left hand was selected for the majority of left visual field targets, but there were some trials in which the right hand was selected. More variability was evident at the center location, both within and across subjects. During the baseline phase, the right hand was used on 82.3 ± 1.9% (across all 53 participants) of the trials to reach to the center location. Right hand use decreased during manipulation phase for the BOOST, TAX, and BOTH conditions (Figure 3B). This shift was not evident in the control, NOMANIP condition.
1 5 9
50
70
85
BOOST
Rewa
rd R
ate
1 5 9
TAX
1 5 9
BOTH
1 5 9
NOMANIP
1 5 9 1 5 9
70
85
BOOST Day 1, TAX Day 2
Rewa
rd R
ate
1 5 9 1 5 9
TAX Day 1, BOOST Day 2
(A)
(B)
Block Block
Block Block Block Block

12
Figure 3. Hand choice results for Experiment 1 in the BOOST (green), TAX (cyan), BOTH (magenta), NOMANIP (black) conditions. (A) Mean probability of right hand use as a function of target location. Solid lines are for data from the last two blocks of the manipulation phase (Blocks 7-8) and dotted lines are for data from the last two blocks of the baseline phase (Blocks 3-4). (B) Percent right hand use across all targets as a function of block number. (C) PSE values, calculated from the data for the last two blocks of each phase (B = Baseline, M = Manipulation, P = Post-Manipulation).
To quantify these effects, PSE values were estimated for each phase. As can be seen in
Figure 3C, the PSE values were all negative during the baseline phase, consistent with the right hand bias evident in the psychometric functions. During the manipulation phase, these values became less negative, indicative of greater left hand use. The main effect of phase was significant (F(2,98)=13.89, p<0.0001), and this factor interacted with condition (F(6,294)=2.80, p=0.02). When compared to the NOMANIP condition, the decrease in right hand use was reliable for all three conditions: BOOST (t(23)=2.30, p=0.01), TAX (t(25)=2.24, p=0.02), and BOTH (t(24)=3.50, p<0.001). Furthermore, changing the reward rate simultaneously for both hands had a larger effect on right hand use than either increasing the reward rate for the left hand (BOOST vs BOTH: t(23)=1.90, p=0.04) or decreasing the reward rate for the right hand (TAX vs BOTH: t(25)=1.98, p=0.03). There was no difference between the shift in hand use between the BOOST and TAX conditions (t(24)=0.03, p=0.49).
This decrease in right hand use was maintained during the post-manipulation phase, and correspondingly, the PSEs during the post-manipulation phase were less negative than the PSEs during the baseline phase. In a series of pair-wise comparisons between the baseline PSE and the post-manipulation PSE, reliable effects were observed for the BOOST (t(11)=2.90, p<0.01) and
!30 0 300
25
50
75
100
Target
BOOST%
Righ
t Han
d Us
e
1 5 9 45 50 55 60 65 70
Block
% R
ight H
and
Use
B M P!15
!12
!9
!6
!3
Phase
PSE
(deg
rees
)
!30 0 30Target
TAX
1 5 9Block
B M PPhase
!30 0 30Target
BOTH
1 5 9Block
B M PPhase
!30 0 30Target
NOMANIP
1 5 9Block
B M PPhase
(A)
(B)
(C)

13
BOTH (t(12)=3.60, p=0.02) conditions. The effect for the TAX condition was marginally significant (t(13)=1.75, p=0.052). Again, there was no change in right hand use for the NOMANIP condition (t(12)=0.32, p=0.38).
Sequential Analysis. Given that hand choice was influenced, albeit in a subtle manner, by the change in reinforcement rate, we performed a sequential analysis, asking if the cause of these shifts might be evident in the local reinforcement history. We note at the outset that this analysis is problematic because the shift in hand choice was most pronounced at the central location and targets only appeared at this location on 20% of the trials. As such, the trial-by-trial pairs involving non-central targets on trial t involve reaches where hand choice was dominated by target location.
Nonetheless, we focus here on a qualitative analysis of reaches to the more ambiguous, center location, asking if hand choice on these trials is influenced by the location of the target, hand choice, and outcome on trial t-1. If hand choice was impervious to local history, then these functions would be flat. As can be seen in Figure 4A, sequential effects are evident in hand choices made to central targets. First, there is a bias for participants to use the same hand as was selected on the previous trial. This is most evident when the target on trial t-1 was also at the center location, but is also evident at the other locations (e.g., right hand at center location is greater after a right visual field target compared to a left visual field target). Second, there is a "contrast" effect in the sequential data. The more eccentric a target was on trial t-1, the more likely the participant was to switch hands when the target on trial t appeared at the center location. This effect was present for both hands.
Figure 4. Sequential analysis of hand choice for Experiment 1 (A) and Experiment 2 (B). The functions depict the probability of right hand use for targets at the center location (0°) as a function of the previous trial (n-1), divided by the location of the last target, the hand used on the last trial, and the success on that trial. Right miss (red dashed), Right Hit (red solid), Left miss (blue dashed), Left hit (blue solid).
The functions in Figure 4A indicate a modest effect of reinforcement on hand choice.
Participants were more likely to use their right hand to reach to the center target if the left hand had missed a target on the previous trial (77.0 ± 2.7%) compared to when the left hand has successfully reached a target on the previous trial (73.9 ± 2.7%). Conversely, the participants were more likely to use their right hand if that hand had successfully intercepted a target on the previous trial (79.1 ± 2.5%) compared to a right-hand miss (77.7 ± 3.2%). In an ANOVA collapsing across t-1 target location, there was no main effect of the hand used on the previous trial (F(1,49)=1.50, p=0.23) nor on the outcome (hit or miss) of the previous trial (F(1,49)=0.93,
!30 0 30
50
60
70
80
90
% R
ight H
and
Use
Experiment 1
n!1 Target!30 0 30
50
60
70
80
90
Experiment 2
n!1 Target t-1 Target t-1 Target
(A) (B)

14
p=0.34). However, these two factors did interact (F(1,49)=5.12, p=0.03), consistent with the hypothesis that hand choice was more likely to switch after a miss.
Reaction Time. Figure 5 plots the RT data as a function of target position. We combined the data for targets at -30° and -17.4° using only left hand reaches and the data for the +30° and +17.4° targets using only right hand reaches. For the central target, the data are divided into right and left hand reaches. Note the number of observations is not equal for the two hands given the hand choice biases. Two trends are evident in the figure. First, right hand reaches were initiated faster than left hand reaches (F(1,49)=30.29, p<0.001, main effect of hand). Second, RTs to the center location were slower than RTs to more peripheral locations (F(1,49)=68.12, p<0.001, main effect of target). The hand by location interaction was also reliable (F(1,49)=15.73, p<0.001) due to the fact that the peripheral advantage was more pronounced for right hand reaches.
550
600
650
700
750
BOOST
Reac
tion
Time
(mse
c)
550
600
650
700
750
TAX
Reac
tion
Time
(mse
c)
550
600
650
700
750
BOTH
Reac
tion
Time
(mse
c)
EL C ER EL C ER EL C ER 550
600
650
700
750
Target
NOMANIP
Reac
tion
Time
(mse
c)
Figure 5. Left (blue) and right (red) hand reaction time data for Experiment 1. For each condition, the data are plotted separately for the three phases (baseline = left cluster; manipulation = center cluster; post-manipulation = right cluster). Within each cluster, the data were combined for eccentric targets at ±30° and ±17.4° for the left and right hands (EL and ER). Data for the central target (C) is depicted separately for right and left hand reaches.

15
Awareness. No participants spontaneously reported being aware of the experimental manipulation. Two participants in BOOST, two in TAX, eight in BOTH, and three in the NOMANIP condition commented that they used their left hand more over the course of the experiment. In general, these participants reported being concerned about the accuracy of their left hand initially, but became more confident over time. They tended to attribute the increase in left hand use to intrinsic factors. One subject remarked that they might have used their left hand more than they would have expected because they spend a lot of time playing video games, while another subject reported that over the course of the experiment they “put a little more faith” in their left hand.
When directly asked whether the task became easier, harder, or stayed the same for the right and left hands, participants in the TAX and BOOST conditions were nearly equally likely to say that the difficulty remained the same across the experimental session as they were to state that the difficulty changed in accordance with their particular experimental manipulation. For example, 42% of the participants in the BOOST condition reported that the task got easier for the left hand, compared to 25% who reported it got harder. However, for the TAX condition, 46% also reported that the task got easier for the right hand! Participants were more sensitive to the experimental manipulations in the BOTH condition. Here 57% reported that the task became harder for the right hand (compared to 14% who reported it got easier) and 64% reported that the task became easier for the left hand (compared to 0% who reported it got harder). While the participants in the NOMANIP group distributed their responses across the three choices with near-identical frequencies for the right hand, they were more likely to report that left hand reaches became easier (39%) compared to harder (15%). Thus, this control condition suggests that participants experienced a general practice effect when using their non-dominant limb.
Summary: The results of Experiment 1 indicate that, hand choice was sensitive to reinforcement. Regardless of whether we reduced the reinforcement rate for the right hand, increased the rate for the left hand, or introduced both manipulations, participants exhibited a spontaneous increase in the use of their left hand. The shift was generally restricted to regions in which hand choice exhibited some ambiguity in the baseline phase, and was of comparable values for the TAX and BOOST conditions. The increase in left hand use for these conditions occurred despite the participants' lack of awareness of the experimental manipulation.
Our interpretation of this finding is that the change in reward rates led to a change in the value state associated with left and right hand choices, thus influencing the outcome of a competitive process underlying hand choice. The RT data are in accord with this hypothesis: participants were slower to initiate responses when the target appeared at the ambiguous, central location.
Experiment 2. Although we did not observe a differential effect of increasing and decreasing the rate of
positive reinforcement in Experiment 1, the data showed a trend for a larger effect of BOOST in the post-manipulation phase, the condition in which the left hand reward rate was increased. However, Experiment 1 might not provide a fair contrast of BOOST and TAX since the absolute reinforcement rates, as well as change in reinforcement rates, differ for the two conditions during the manipulation phase. Moreover, despite our efforts to use a constant size shift (18%), the observed changes in reward rates differed for the two conditions. To better compare the effects of increasing and decreasing the rate of positive reinforcement, we used a more powerful within-subject design in Experiment 2. In addition, we equated the reward rates in the BOOST and TAX

16
conditions during the manipulation phase and added target locations at ±8.6°, close to the central location, to more densely sample the ambiguous area.
Reward Rates. In Experiment 2, the average reward rates during the last three blocks of baseline and last three blocks of post-manipulation were were 69.5 ± 0.1% and 69.6 ± 0.1% for the right and left hands, respectively in the BOOST condition. For the TAX condition, the observed reward rates were 83.7 ± 0.2% for each hand over these two phases. These values are very close to the desired values of 70% and 84% (Figure 2B). During the manipulation phase, the reward rates for the two groups were near-identical (BOOST: 69.8 ± 0.1% (right), 83.5 ± 0.2% (left); TAX: 69.7 ± 0.3% (right), 83.6 ± 0.2% (left)).
Figure 6. Hand choice results for Experiment 2 for participants who were tested on BOOST in Day 1 (left side) or TAX on Day 1 (right side). BOOST is shown in green and TAX in cyan. (A) Mean probability of right hand use as a function of target location. Solid lines are for data from the last two blocks of the manipulation phase (Blocks 7-8) and dotted lines are for data from the last two blocks of the baseline phase (Blocks 3-4). (B) Percent right hand use across all targets as a function of block number. (C) PSE values, calculated from the data for the last two blocks of each phase (B = Baseline, M = Manipulation, P = Post-Manipulation).
Percent Right Hand Use/PSE. As in Experiment 1, the psychometric functions were
very steep, with participants overwhelmingly preferring to use the ipsilateral hand when reaching to peripheral targets (Figure 6A). A right-hand bias was again observed at the center location (71.5 ± 2.6%), although there were a significant number of left hand reaches to this location during the baseline phase. The inclusion of target locations just off-center (±8.6°) increased the
!30 0 30 !30 0 300
25
50
75
100
Target
BOOST Day 1, TAX Day 2
% R
ight H
and
Use
1 5 9 1 5 9 45
50
55
60
65
Block
% R
ight H
and
Use
B M P B M P
!6
!4
!2
0
Phase
PSE
(deg
rees
)
!30 0 30 !30 0 30Target
TAX Day 1, BOOST Day 2
1 5 9 1 5 9Block
B M P B M PPhase
(A)
(B)
(C)

17
occurrence of off-center ambiguity, with the right-hand being used to cross the midline on 20.2±1.8% of the trials during the baseline phase. Interestingly, the inclusion of these locations may have reduced participants' willingness to use the right hand to reach to the -17.4° target (left of midline): The percentage of right hand reaches to this location during the baseline phase was only 5.8 ± 1.3%, compared to 16.1 ± 1.7% in Experiment 1. We did not analyze this effect given the various methodological differences between the two experiments.
Figures 6B and 6C depict the shift in right hand use and corresponding changes in PSEs over the course of the experiment. In the ANOVA of the PSE data (within-subject factors: phase and condition, between-subject factor: order of conditions), we observed a marginally reliable main effect of phase (F(2,44)=2.57, p=0.09). The main effects of condition (F(1,22) =0.03, p=0.87) and test order were not reliable (F(1,22)=0.15, p=0.70), nor did any of the 2-way or 3-way interactions approach significance. In pair-wise comparisons of the scores between baseline and manipulation phases, we observed a marginal shift in the PSEs during the manipulation phase for BOOST (t(22)=1.52, p=0.07) and a reliable shift for TAX (t(22)=2.92, p<0.01), Unlike Experiment 1, this shift was not maintained in the post-manipulation phase for either condition, relative to baseline (BOOST: t(22)=-0.59, p=0.28; TAX: t(22)=-0.002, p=0.50).
Sequential Effects. Figure 4B shows the sequential analysis for Experiment 2, again restricted to trials in which the target on trial t appeared at the center location. As in Experiment 1, participants exhibited a bias to reach with the hand used on the last trial (on top of an overall bias to use the right hand). Moreover, hand switches were more likely to occur when the center location was preceded by a target at a more eccentric location, an effect that was especially pronounced after hits.
Unlike Experiment 1, we did not observe a win-stay/lose-shift strategy. There was a main effect of the hand used on the previous trial (F(1,23)=6.85, p<0.01) and an effect of the outcome of the last trial (F(1,23)=13.14, p=0.001). However, these factors did not interact (F(1,23)=0.01, p=0.92). Rather, there was an unexpected outcome-related sequential effect in Experiment 2: Independent of whether the last reach was with the right or left hand, participants were more likely to use their right hand after a miss compared to a hit. The probability of using the right hand at the center target after a left miss was 65.7 ± 4.7% compared to 59.7 ± 4.5% after a left hand hit. Surprisingly, the probability of using the right hand at the center target after a right hand hit was 76.1 ± 3.6% compared to 70.5 ± 3.6% after a right hand miss. One interpretation of this effect is that participants became more reliant on their dominant hand after an error, independent of which hand has produced the error.
Reaction Time. The reaction time data were very similar to those observed in Experiment 1 (Figure 7). Participants were faster to initiate reaches with the right hand (F(1,22)=16.20, p=0.001) and showed an RT cost when the target appeared at the center location compared to the more peripheral locations (F(1,22)=14.46, p=0.001). Unlike Experiment 1, the hand by target interaction was not reliable (F(1,22)=0.42, p=0.52).

18
Figure 7. Left (blue) and right (red) hand reaction time data for Experiment 2. The data are plotted for the three phases (baseline = left cluster; manipulation = center cluster; post-manipulation = right cluster). Within each cluster, the data were combined for eccentric targets at ±30°, ±17.4°, and ±8.6° for the left and right hands (EL and ER). Data for the central target (C) is depicted separately for right and left hand reaches.
Awareness. As in Experiment 1, participants did not spontaneously report becoming
aware of the experimental manipulations during either session of the experiment. Due to a filing error, the survey data were not retained for nine participants. For the other 18, eleven judged that they had been in a group in which the reward rate remained unchanged over the course of the experiment, with the percentage similar for the BOOST and TAX conditions.
Summary. In Experiment 2 we equated the TAX and BOOST manipulations by employing different reward rates during the baseline phase. In both conditions, we observed an increase in left hand use when the reinforcement rates were altered for one of the two hands, although these effects were only marginally reliable in the overall ANOVA. We had hoped to observe more ambiguous target locations in Experiment 2 by including a denser sampling of midline targets (targets at ±8.6°). However, the inclusion of this target may have reduced the (small) ambiguity observed at more eccentric locations, and as such, effectively reduced the range of ambiguity compared to Experiment 1. The smaller sample of ambiguous targets could account for the smaller shift in hand choice observed in Experiment 2, as well as the lack of persistence of the hand choice shift during the post-manipulation phase (see Discussion).
As in Experiment 1, we failed to observe any obvious differential effect of increasing or decreasing the rate of positive reinforcement. We examine this issue in more detail in the following section in which we apply a reinforcement learning model.
550
600
650
700
750
BOOST Day 1Re
actio
n Tim
e (m
sec)
TAX Day 2
EL C ER EL C ER EL C ER550
600
650
700
750
Target
BOOST Day 2
EL C ER EL C ER EL C ER550
600
650
700
750
Target
TAX Day 1
Reac
tion
Time
(mse
c)
19
Reinforcement Learning Model. We fit the hand choice data to a Q-learning model. We used the data from the baseline phase to establish initial Q values at each location. These data capture the biases of the participants to respond to eccentric targets with the ipsilateral hand and to prefer the dominant over the non-dominant hand (for most participants) for central locations. We then fit the data for the manipulation and post-manipulation phases. By comparing three models, we addressed two questions. First, is a better fit obtained when the model reflects recent reinforcement history? To address this question, we compared models that included a learning rate parameter, alpha, to a model in which hand choice preferences remained invariant over the course of the experiment (null model). Note that if reinforcement history modifies hand choice, we may observe an improved fit with the alpha model even in the condition in which we did not alter the success rate (NOMANIP in Experiment 1). Second, we compared two classes of models, one in which a single alpha value was set for all of the experimental conditions compared to one in which alpha was free to vary across experimental conditions. In this way, we could ask if hand choice was differentially affected by increasing or decreasing the rate of positive reinforcement, as well as whether choice behavior changed at a different rate when the success rate for both hands was simultaneously adjusted. The model fits and free parameter estimates are presented in Table 1. For both experiments, the Alpha_1 models provide a much better fit than the null model. A likelihood-ratio test as approximated by chi-square test of the log likelihood ratios showed that the fit was much better for the Alpha_1 model compared to the null model in both experiments (Experiment 1: χ2(1)1191, p<0.0001; Experiment 2: χ2(1) 1358, p<0.0001). Indeed, the percentage of variance accounted for (R2) was low for the set of null models, but rose to 94% and 97% for the Alpha_1 models in Experiments 1 and 2, respectively. Thus, while the effect of reinforcement was relatively modest in the group-averaged data of hand choice, recent reinforcement history had a significant impact on hand choice preferences. The R2 values are also very high for each condition in the Alpha_4 models. It should be noted that the improved fit for Alpha_4 as compared to the corresponding null model holds even for the NOMANIP condition in Experiment 1, where we did not vary reinforcement rate. Thus, the effect of reinforcement history on hand choice does not require that the system be perturbed with a change in reinforcement rate: the current data suggest that hand choice preferences are constantly being updated as a function of success rates, at least when reaching to ambiguous locations. This observation is consistent with the fact that the participants exhibited minimal awareness of the experimental manipulation of reinforcement rates, yet altered their hand choice preferences. The goodness-of-fit was similar for the Alpha_1 and Alpha_4 models. A chi-square test of the likelihood ratios did not show a reliable difference between the two alpha models in Experiment 1 (χ2 (3)2, p1). While the Alpha_4 model did provide a significant improvement over the Alpha_1 model in Experiment 2 (χ2(3)=24, p<0.0001). This effect is relatively modest, and likely reflects the fact that the alpha values were different for the two subject groups, and not for the two reinforcement manipulations. This difference .Thus, the modeling results confirm that participants were equally sensitive to reinforcement changes that either increased the success rate of the left hand or decreased the success rate for the right hand. While our manipulation confounds the form of reinforcement and hand, the results suggest that the increasing or decreasing the rate of positive reinforcement operate through a common mechanism. In terms of the estimates of learning rate, the alpha values for the four conditions in

20
Experiment 1 were not reliably different from one another as estimated by a bootstrapping procedure (p>0.055, significance criterionp<0.0125 to correct for multiple comparisons) and were quite similar to the alpha value obtained for the Alpha_1 model. Of note here is that the estimate of the alpha rate for the BOTH condition is similar to the estimates for the TAX and BOOST conditions. Thus, it appears that simultaneously increasing and decreasing reinforcement rates has an additive effect on behavior. The alpha estimates are more problematic for Experiment 2. Here we observed a much larger estimate of alpha for the participants who were tested in the BOOST condition on Day 1 compared to those who were first tested in the TAX condition. While this might suggest greater sensitivity to positive reinforcement (or a manipulation targeted at the non-dominant hand), two features of the data suggest that this difference may be idiosyncratic to these particular groups of individuals. First, these differences were also evident in the estimates obtained from the day 2 data. Second, the actual reinforcement rates are identical for the BOOST conditions in Experiments 1 and 2 (shift from 70/70 reinforcement rates during baseline to 85/70 during the manipulation phase). Nonetheless, the estimates of alpha were much larger in Experiment 2 for the BOOST data on day 1. In summary, a reinforcement learning model provided an excellent fit to the data in both experiments. Participants altered their hand choice preferences for each location (Q values) as a function of their recent success or failure in reaching to targets at that location. Moreover, the modeling results indicate that participants were equally sensitive to manipulations that increased or decreased the rate of positive reinforcement. Not only were the estimates of alpha similar across conditions in Experiment 1 and within conditions in Experiment 2, but a model with a single learning rate performed essentially as well as one with separate learning rates for each condition. Table 1. Reinforcement learning model fits. Model Condition α -LL pseudo-R2 R2
Expe
rimen
t 1
No_Learn
BOOST - 340 ± 37 - -0.03 ± 0.13 TAX - 392 ± 39 - 0.21 ± 0.14 BOTH - 557 ± 67 - 0.39 ± 0.07 NOMANIP - 419 ± 42 - 0.24 ± 0.06 SUM - 1708 ± 184 - 0.20 ± 0.05
Alpha_1 ALL CONDITIONS 0.28 ± 0.09 1113 ± 14 0.35 0.94 ± 0.01
Alpha_4
BOOST 0.22 ± 0.05 253 ± 4 0.26 0.91 ± 0.03 TAX 0.24 ± 0.15 310 ± 13 0.21 0.89 ± 0.05 BOTH 0.25 ± 0.01 276 ± 2 0.50 0.95 ± 0.01 NOMANIP 0.24 ± 0.12 273 ± 2 0.35 0.94 ± 0.02 SUM - 1112 ± 21 0.35 0.94 ± 0.01
Expe
rimen
t 2
No_Learn
BOOST - Day 1 - 387 ± 31 - 0.44 ± 0.13 TAX - Day 1 - 412 ± 34 - 0.48 ± 0.16 BOOST - Day 2 - 379 ± 13 - 0.75 ± 0.15 TAX - Day 2 - 486 ± 116 - 0.62 ± 0.30 SUM - 1665 ± 194 - 0.64 ± 0.18
Alpha_1 ALL CONDITIONS 0.38 ± 0.07 998 ± 6 0.40 0.97 ± 0.01
Alpha_4
BOOST - Day 1 0.37 ± 0.08 258 ± 9 0.33 0.96 ± 0.02 TAX - Day 2 0.36 ± 0.12 273 ± 2 0.34 0.97 ± 0.01 TAX - Day 1 0.23 ± 0.02 226 ± 2 0.40 0.98 ± 0.01 BOOST - Day 2 0.25 ± 0.01 229 ± 4 0.53 0.97 ± 0.02 SUM - 986 ± 17 0.41 0.97 ± 0.01

21
DISCUSSION The pair of experiments reported here demonstrate that hand choice in an unconstrained reaching task can be influenced by limb-dependent task success. Both decreasing the rate of positive reinforcement for the dominant hand and/or increasing the rate of positive reinforcement for the non-dominant hand increased the likelihood that participants would use their non-dominant to reach to ambiguous target locations. We were able to account for these transient changes in performance within a reinforcement learning framework using a Q-learning model. Hand Choice as a Competitive Process. Previous work on the behavioral and neural correlates of decision making during reaching has focused on target selection (Churchland 2008, Cisek 2005, Sugrue 2004). The current studies suggest that hand choice may also be viewed as a competitive process. Participants exhibited between-trial variability in hand choice at locations near the midline. Moreover, RTs at these ambiguous locations(s) were slower than RTs to targets at neighboring locations, an effect we interpret as a signature of a competitive process. This RT cost is not observed when the responses are limited to a single hand (Oliveira 2010). Interestingly, participants were faster when using their right hand in the current studies, whereas they showed a surprising left hand advantage in Oliveira et al. This difference may reflect the accuracy requirements used here. RTs were approximately 200 ms slower in the current experiments, likely due to the fact that accuracy constraints had to be incorporated in trajectory planning processes given that online corrections were precluded (Sainburg 2000). . By viewing hand choice as a competitive process, it is reasonable to think that this simple decision might be affected by recent reinforcement history. An increase in the rate of positive reinforcement for the non-dominant limb or decrease in the rate for the dominant limb led to an increase in the use of the non-dominant limb. The small size of the shift likely arises from at least two factors. First, hand choice was strongly constrained by target position-- the participants showed a large bias to use their ipsilateral hand to reach to eccentric targets, an effect that may be especially pronounced when head position and fixation are centered near the midline (Dancause 2010). Thus, the effects of reinforcement are intermixed with other constraints determining hand choice. Second, the change in reinforcement rates was relatively subtle, an increase or decrease of around 20%, changes that are much smaller than those used in many studies of reinforcement learning (Daw 2006; Seymour 2007). We opted to use these values so that we could examine the effects of reinforcement in the absence of awareness. Indeed, none of the participants in the TAX and BOOST conditions of either experiment reported being aware of the experimental manipulation. Those who had a sense of increasing their left hand use tended to attribute the change in their behavior to intrinsic factors.
The implicit nature of the changes observed here may have important implications for physical rehabilitation after neurological injury. Patients with hemiparesis frequently exhibit compensatory strategies, using the arm on their unaffected side to accomplish tasks previously performed with the affected limb. This shift may persist even after the individual exhibits considerable recovery with the affected limb, creating a significant loss of functional recovery. This effect has come to be referred to as learned nonuse (Taub 1980) and has been attributed to behavioral factors such as attention, motivation, and sense of effort (Sterr 2002). That is, the patient’s internal assessment, at least during the first months after the stroke, may be that use of the affected limb is not only much more effortful, but also less likely to be behaviorally successful. This experience is reinforcing, increasing the likelihood that the individual will continue to use the unaffected limb at the expense of the affected limb.

22
Clinical trials have been designed to counteract the effects of learned disuse. One approach is to force the individual to use the affected limb through constraint induced movement therapy (Wolf 2006) and/or with virtual reality environments that augment feedback (Merians 2002; Piron 2010). However, the benefits of such interventions are modest and the mechanisms underlying such benefits remain unknown (Wolf 2007). The limited success of guided therapeutic interventions such as constraint-induced therapy may, in part, be related to their reliance on extrinsic manipulations of behavior. The person is physically restrained from using the affected limb. Such procedures, while producing improvements within the therapeutic setting, may not generalize well when the contextual cue is absent. Our implicit, reinforcement manipulation is designed to alter behavior through intrinsic processes. Altering the person's internal sense of success may prove to be an important component of inducing long-term changes in behavior. Reinforcement Valence. We did not find a reliable difference in the efficacy of increasing and decreasing the rate of positive reinforcement for inducing changes in hand choice preference. The modeling results also suggest that the learning rate is comparable for conditions in which the rate of positive reinforcement is increased compared to conditions in which the rate of positive reinforcement is decreased. This suggests that a common underlying mechanism may be sensitive to these two types of reinforcement. It is important to note that, although we describe our experimental manipulations in terms of varying the rates of positive reinforcement, we did not test models in which we allowed different alpha values for updating the Q-values following hits versus misses.
The neural mechanisms involved in limb selection, and how this process is influenced by reinforcement, remain to be explored. Using a similar task to that employed here, Oliveira et al (2010) observed that stimulation of posterior parietal cortex of the left hemisphere increased left hand use, an effect especially pronounced around the PSE. This effect suggest that activity in PPC contributes to effector selection. Other studies point to a role for premotor cortex in such decisions (Beurze 2007; Beurze 2009). Here we show that shifts in hand use can also be induced by short-term changes in reinforcement rates. The dopaminergic system has been implicated as facilitating learning for both positive and negative reinforcement. Dopamine bursts are associated with positive reinforcement, and through associative mechanisms, with prediction errors to a stimulus that foreshadows an unanticipated reward (Schultz 1997; O'Doherty 2003; O'Doherty 2004). Although the evidence is less compelling, a drop in the firing rate of dopaminegeric neurons can be observed when an expected reward is withheld (Schultz 1997; O'Doherty 2003; O'Doherty 2004). Similarly, high amounts of dopamine facilitate learning from positive reinforcement, while low amounts of dopamine facilitate learning from negative reinforcement (Frank 2004). The modulatory effect of dopamine is especially pronounced under conditions of uncertainty (Cooper 2008; Koch 2008), something that should be prominent in our experimental task given the relatively high error rates. Future studies can directly address the role of dopamine in modulating hand choice preferences, designed to ask if the effects on effector selection are similar to those observed in tasks examining goal selection.
The Q-learning model was successful in capturing the gradual shifts in hand choice preferences as a function of reinforcement. However, the model fails to account for some of the trial-by-trial effects observed in the data (see Figure 4). First, when the target appeared at the same location on two successive trials, participants exhibited a pronounced bias to repeat the reach with the same hand. In its current form, location biases are established by choices exhibited in the baseline phase. Similarly, the model cannot account for the fact that the
23
likelihood of a hand switch was greater when the distance between successive targets increased. The updating of the Q-values following reinforcement was restricted to the pair of values associated with actions to the target location for that trial. Additional parameters would be required to impose additional biases related to repetition or “contrast” effects.
Reinforcement learning should decrease the likelihood that a given action will be chosen following an error (and conversely, increase the likelihood of that action following a hit). Of course this does not mean that behavior will exhibit win-stay/lose-shift tendencies. The reinforcement-related changes may be insufficient to alter preferences to use one hand or the other at a given location. A win-stay/lost-shift tendency was observed in Experiment 1. However, we observed an unexpected sequential effect in Experiment 2: Participants were more likely to use the right hand after an error, regardless of whether that error was produced with the left or right hand. We hypothesize that the decrease in positive feedback may have biased the participants to resort to their dominant hand, reflecting a greater comfort level in using this hand to make accurate movements. It remains unclear why we observed different sequential effects in the two experiments.
A second difference between the two experiments was observed in the post-manipulation phase. On average, participants in Experiment 1 continued to use their non-dominant limb more often than during the baseline phase, whereas those in Experiment 2 returned to baseline choice preferences. Given that the patterns within an experiment were quite consistent across experimental conditions, we expect the difference is related to the methodological changes introduced in Experiment 2. For example, we increased the step size of the staircase procedure and added a new target location to increase the number of trials involving reaches to ambiguous locations. The former change, adopted to help ensure that the average reward rate over an entire block of trials was more consistent across participants, may have increased the rate of learning. The latter may have increased the sensitivity of the experiment to learning effects, now evident during both the manipulation and post-manipulation phases. Models of hemiparesis suggest that efforts to increase the use of an affected limb should accelerate once some minimum threshold of use is achieved (Han 2008). Reinforcement manipulations may facilitate this process, especially if the observed rate of reinforcement exceeds the expected rate. In terms of rehabilitation, it will be desirable to design experimental manipulations that produce stronger and lasting changes in hand choice preferences than those observed with our current procedures. Conclusions. Goal-oriented behavior requires the operation of decision processes at multiple levels. Fluid behavior involves that we successfully operate in a variable environment that presents a stream of choices. Moreover, the manner in which we interact with the environment is variable and context-dependent. We have focused here on a neglected, but fundamental decision process for motor control, the choice between executing an action with the right or left hand. In many situations, this choice is highly constrained, reflecting factors such as the position of the object with respect to the body or a lifetime preference for the dominant limb. Yet for many actions, especially those that do not involve tools, people exhibit considerable flexibility, switching readily between the two limbs. The experiments presented here demonstrate that principles derived from studies of goal-selection, can shed insight into the processes underlying limb selection.

24
Acknowledgements The authors would like to thank Robert Lamorena and Andy Noblet for their assistance with data collection. This study was supported by the National Institutes of Health (P01 NS040813) and the National Science Foundation (IIS 0703787). Previously published – see reference Stoloff 2011.

25
CHAPTER II: Neural processes underlying free limb selection INTRODUCTION
Interacting with the world involves the continuous selection of actions. Studies in the decision making literature have shed light on how the brain integrates information to assess and compare the value of potential actions. Neurophysiological (Hoshi 2000, Cisek 2005) and neuroimaging (Medendorp 2005, Tosoni 2008; Beurze 2007, 2009) studies have identified a frontoparietal network that is engaged in decision making tasks. While the contributions of different regions within this network remains the subject of considerable debate, a number of studies have focused on the role of orbitofrontal cortex (OFC) in the representation of value, integrating information about variables such as payoff, likelihood, and effort (Chib 2009, Croxson 2009, Lim 2011, Wallis 2011). One hypothesis is that value signals in the OFC bias activity in the dorsal medial prefrontal cortex and parietal cortex, supporting processes involved in the comparison and selection of actions (Hare 2011). Supporting this idea, Sugrue et. al (2004) found that neurons in the parietal cortex reflect the values of competing actions.
Within the motor control literature, work has been done to identify the neural correlates of planning movements with a specified limb. Neurons in a region termed the parietal reach region, located in the posterior parietal cortex, code the position of a target with respect to the body (Batista and Anderson 2001). Similar representations are observed in frontal motor regions, including the dorsal premotor cortex. In this region, neurons may reflect the parallel preparation of reaches to multiple targets, with the dynamics of activity eventually settling on a choice (Cisek and Kalaska 2005). Recent work in humans (Beurze 2007, 2009) and in monkeys (Hoshi 2000) has demonstrated that target and body-part information are integrated in the premotor cortex and the posterior parietal cortex. Tosoni et al (2008) demonstrated that increased activation in the contralateral parietal area is correlated with an arbitrary visual reach decision, corroborating the idea that accumulation of sensory evidence for decision making is linked to the specific planned action. The question remains as to what extent the choice of where to reach is integrated with the choice of which limb to reach with.
Choosing which limb to reach with is a fundamental decision process that involves varying degrees of competition depending on factors such as target location and hand dominance. While people favor their dominant limb, there is evidence for flexible hand use in object manipulation such that hand assignment is largely dependent on task goals (Johansson 2006). Work in motor control investigates how people decide to execute a selected action–for example, where should a tool be grasped. This work has focused on how stimulus factors (e.g., object orientation, handle width, object mass) and biomechanical factors (e.g., end-state comfort, bimanual symmetry) constrain such choices (Cohen 2004, Van der Wel 2010). Similarly, the effect of environmental factors on reach endpoint and trajectory selection has been investigated. People are able to integrate information about their own movement variability with environmental variability to move in a way that minimizes risk and maximizes reward (Trommershauser 2008). Another interesting and understudied question is what are the value-based decision and control processes involved in deciding which limb to reach with. In this study, we investigate what brain regions are involved in limb selection. Using functional magnetic resonance imaging (fMRI) we compare brain activity when the participants are free to reach with either limb to when the limb is specified. Since reaches during both conditions activate regions of the brain that are involved in integrating effector and target information, comparing brain activity during these two conditions will allow us to identify the
26
areas within this network that are specifically involved in the choice between effectors. We predict that a frontoparietal choice network associated with perceptual decision making will also be involved in the competitive process of limb selection. METHODS Participants. Fifteen participants (8 Females; mean age ± standard error 23.3 ± 1.3 years) participated in the experiment and were paid for their participation. All participants were right-handed. One participant was excluded from the analysis because he did not follow the instructions, failing to reach to the target on many trials. Thus, the behavioral and imaging data is from 14 participants. The protocol was approved by the UC Berkeley Institutional Review Board and all participants provided informed written consent before the start of the session. Design and Procedures Apparatus. The experiment was performed in an fMRI scanner (3 Tesla Siemans TIM/Trio scanner). The participant was in the standard supine position within the scanner, with two long cylindrical cushions placed along the trunk on each side to support their arms. The participant rested their hands on two low-resistance, large buttons on an MRI-compatible response box that was placed approximately 10 centimeters above their waist. A touch pad was supported by a triangular pillow, and thus placed at a 45° angle at the participant’s waist. A mirrored projection system was used to display the stimuli.
Behavioral Task. Each trial began with a 750 msec presentation of a fixation bar that spanned the extent of the screen (32 cm wide - approximately 48° of visual angle). The fixation bar was then replaced by the appearance of a white circular target. The participant was instructed to reach to the position corresponding to the circular target on the touch pad as quickly as possible, using an out-and-back movement so that the hand returned to the resting position on the response box. The response box was used to detect which hand had been selected to make the reaching movement and to detect the reaction time. Reach lengths were approximately 10 cm. The target remained visible for 1750 msec, even though almost all of the responses were completed in a much shorter interval. Blocks of trials alternated between two types: (1) free: the participant was free to choose their left or right hand to reach to the target and (2) forced: the participant was instructed what hand to use to reach to the target. In order to match behavior between the two conditions, the instructions for which hand to reach with during the forced blocks were based on which hand was chosen for each trial in the proceeding free block. Thus, if a participant had used the right hand on 65% of the trials during the free block, the participant would be instructed to use the right hand on 65% of the trials in the subsequent forced block. During the free blocks, the fixation bar was either green indicating the subject should reach to the target with either their right or left hand (Go, 79% of Trials) or the fixation bar was red, indicating the subject should not reach when the target appeared (No-Go, 21%) (Figure 1A). During the forced blocks the fixation bar was either yellow or blue, indicating the subject should reach with their right or left hand, respectively (Go, 79%), or red (No-Go, 21%) (Figure 1B). By including No-Go trials, we ensured that the participant had to attend to the cue in both conditions, free and forced. Subjects were unaware that the sequence of target locations was repeated from the free block to the following forced block.
Each participant completed four scanning runs. Each run was composed of eight blocks of 14 trials each. The eight blocks alternated between the free and forced conditions. Trials were

27
evenly spaced every 2.5 seconds and there was a 15 second rest between blocks. Thus each block lasted 35 seconds, and each scan lasted 6 minutes and 55 seconds. Across the four runs, there were a total of 448 trials (354 Go trials; 94 No-Go trials).
Prior to the experiment, the participant completed one to two practice blocks in a “mock” scanner (a decommissioned fMRI scanner) to familiarize themselves with the task.
Figure 1. (A) During free choice, participants fixated on a green bar and reached to a spot on the touch pad corresponding the displayed target location with either their right or left hand. (B) During forced choice, participants fixated on an instructive colored bar and reached with their right hand (yellow bar) or left hand (blue bar) when the target appeared. Behavior was matched during free and forced Choice. No-Go (red bar) trials were included to equate the attentional demands of the two tasks.
At any one point in time, there were seven possible target locations (Figure 2). The vertical position of the target was fixed, appearing in the middle of the screen. The middle location was set to the current estimate of the participant’s point of subjective equality (PSE), determined by an adaptive procedure (see below). This location was flanked on each side by two target locations, one pair 0.5 cm from the PSE and the other pair 1.0 cm from the PSE. We chose to use this configuration to ensure a set of target locations in which effector selection was demanding. There were also two eccentric target locations, 7.8 cm to the left and right of the PSE. These eccentric locations were included to ensure that the participant did not adopt a single hand strategy. Note that we employed a fixation bar rather than a small central fixation symbol so that the cue did not provide a spatial referent for the target (i.e., leftward).
Figure 2. On each trial a target location was drawn from an array of seven locations. The center of the array (dashed line), the estimated point of subjective equality, was continuously updated to generate approximately equal right and left hand usage.
Fixate (0.75s)! Fixate (0.75s)! Fixate (0.75s)!Reach (1.75s)! Reach (1.75s)! No Reach (1.75s)!
Fixate (0.75s)! Fixate (0.75s)! Fixate (0.75s)!Right Reach (1.75s)! Left Reach (1.75s)! No Reach (1.75s)!
(A) FREE!
(B) FORCED!

28
During free blocks, the center of the target location array was continually updated using an adaptive staircase procedure. The procedure shifted the array to the left after a trial in which the right hand was chosen and shifted the array to the right after a trial in which the left hand was chosen. The array was shifted left or right between 10% and 100% of a 5 mm step size depending on the target location. This procedure was used to generate approximately the following right hand use at the seven target locations: [0%, 25%, 37.5%, 50%, 62.5%, 75%, 100%]. The percent step sizes for the seven target locations were as follows: [10-100%, 33-100%, 50-100%, 100-100%, 100-50%, 100-33%, 100-10%]). For instance, after a left-handed reach to target #2 (5 cm to the left of the PSE), the center of the array was moved 33% of the 5 mm step size to the right (1.65 mm). After a right-handed reach at this location, the center of the array was moved the full 5 mm to the left. This algorithm is optimized to ensure that the participant will be equally likely to use each hand the trials at the center location, the PSE.
Scan Acquisition. A localizer scan, an anatomical scan, and four experimental scans were obtained for each participant. To minimize head movement, a custom bite bar was fit to each participant. Additionally, two pilot participants completed one or two runs without bite bars in the mock scanner, where head movement in the x, y, and z directions were measured using an accelerometer. Pilot testing illustrated that even without a bite bar, head movement was minimal.
Data was acquired on a 3-Tesla Siemans TIM/Trio scanner. Echo planar imaging sequences were used. Thirty-six (36) sagittal slices (including the cerebellum) with a 64 x 64 matrix, voxel size of 3mm3, and 0.85mm spacing was used. The TR was 2 seconds. The total field of view was 19.2 cm x 19.2 cm x 13.9 cm. Imaging Analysis. fMRI data processing was conducted with FEAT (FMRI Expert Analysis Tool) Version 5.98, a package within FSL (FMRIB's Software Library, www.fmrib.ox.ac.uk/fsl). Preprocessing analyses included motion correction (MCFLIRT, Jenkinson 2002), non-brain masking (BET, Smith 2002), spatial smoothing with a Gaussian kernel of FWHM 5mm, grand-mean intensity normalization of the entire 4D dataset by a single multiplicative factor, and highpass temporal filtering (Gaussian-weighted least-squares straight line fitting, with sigma=49.11s). ICA-based exploratory data analysis was carried out using MELODIC (Beckmann 2004) to investigate the possible presence of unexpected artifacts or activation. Time-series statistical analysis was carried out using FILM with local autocorrelation correction (Woolrich 2001). Z (Gaussianised T/F) statistic images were thresholded using clusters determined by Z>2.3 and a (corrected) cluster significance threshold of P=0.05 (Worsley 2001). Images were resampled to 2 mm cubic voxels, standardized to the corresponding MNI152 template, and registered to high-resolution structural and/or standard space images (FLIRT, Jenkinson 2001, 2002). Registration from high resolution structural to standard space was then further refined using FNIRT nonlinear registration (Andersson 2007a, 2007b). Higher-level analysis was carried out using a fixed effects model, by forcing the random effects variance to zero in FLAME (FMRIB's Local Analysis of Mixed Effects) (Beckmann 2003, Woolrich 2004, Woolrich 2008). We were particularly interested in the activity in posterior parietal cortex, dorsal premotor area, and medial prefrontal cortex in the comparison of the free and forced conditions. To identify regions of interests (ROIs) in these areas, a univariate contrast was performed, comparing the blood-oxygen-level-dependen (BOLD) activity for two contrasts: move versus

29
rest and free versus forced. The ROIs were identified by manual hill-climbing to find peaks from these contrasts. A connectivity analysis was performed between the ROIs. For this analysis, the Pearson product-moment correlation coefficient (R) between the average BOLD time course for each cubic 27 voxel ROI was calculated. RESULTS Task Performance. Percent Right Hand Use. Trials were grouped into seven bins using target positions in 4-degree windows. While the targets could theoretically be presented at locations spanning the full width of the projection screen, the majority of target presentations were limited to a 30° window spanning the midline (-15° to 15°). Targets to the left of this range were only required for participants who exhibited a strong right-hand bias. The staircase procedure used to position the target array attempted to estimate each participant’s PSE, the location where the participant reached with the right and left hands on 50% of all trials. Given that all participants demonstrated a right hand bias, targets were more frequently presented on the left side of the screen than the right side (Figure 3B). Overall, participants used their right hand on 45 ± 2% of the trials in the free choice condition and 44 ± 2% of trial in the forced choice condition. Note that since the target locations and hand specifications in the forced choice condition were repeated from each participant’s behavior in the previous free choice block, right hand use should have been exactly the same in the two conditions. The difference between right hand use during the free and forced choice conditions was caused by a small number of errors in the forced choice condition where the participant failed to use the instructed hand, as well as errors when participants reached on No-Go trials. (A) (B)
Figure 3. (A) Average percent right hand use and (B) average target presentation frequency per run use as a function of target location (4-degree bin). The limited number of more peripheral target locations (> ±15°) are not included in the figure. Reaction Time. The reaction time for the free and forced conditions were compared for
12° 6° 0° 6° 12°0%
25%
50%
75%
100%
Perc
ent R
ight
Han
d U
se
Target Visual Angle (degrees)12° 6° 0° 6° 12°
0
4
8
12
16
20
Targ
et P
rese
ntat
ion
Freq
uenc
y
Target Visual Angle (degrees)

30
each hand (Figure 4). Reaction times were 61 ± 7 msec slower during free choice than forced choice [F(1,13) = 4.72, p = 0.04], where the reaction time for free choice was 499 ± 15 msec and the reaction time for forced choice was 438 ± 12 msec. There was no significant difference between reaction times for the left and right hands [F(1,13) = 1.12, p = 0.38], such that the reaction time for the left hand was 455 ± 15 msec and the reaction time for the right hand was 482 ± 15 msec. These reaction times are roughly in line with reaction times in similar experimental set-ups (Sainburg 2009) where there is an indirect mapping between the stimulus and response space (stimuli appear on a monitor and participants reach along a table positioned in an orthogonal plane).
Figure 4. Reaction time for the left (blue) and right hands (red) during free choice (dark) and forced choice (light).
Imaging Results. MOVE > REST. We first compared the hemodynamic response between epochs in which the participants moved (free and forced) and epochs in which they were at rest. This contrast revealed the standard activation pattern for reaching (Table 1, Figure 5). Cortically, the BOLD response was larger during movement in the primary motor cortex (M1), dorsal premotor area (PMd), primary somatosensory cortex (S1), intraparietal sulcus (IPS), and precuneus (PCUN). Subcortically, movement led to a larger BOLD response in the basal ganglia (BG), inferior ceberellum (Vermis/Crus II), and superior cerebellum (Lobule V-VI). In all of these regions, the move > rest contrast was bilateral, consistent with the fact that participants used the right and left hands.
Free Forced Free Forced
350
400
450
500
Rea
ctio
n Ti
me
(mse
c)

31
Figure 5. The move vs. rest contrast revealed the standard brain activation pattern for reaching.
Table 1. ROI coordinates.
x = 10 y = -18 z = 54
Anatomical Region Abbre-viation
Hemi-sphere
Peak Coordinates (MNI) (x,y,z)
Z-Score (at peak)
Move > RestBasal Ganglia BG L -16, -22, 6 5.15
R 16, -22, 4 4.82Primary Motor Cortex M1 L -32, -26, 60 5.09
R 32, -26, 52 5.59Dorsal Premotor Area PMd L -26, -6, 58 5.47
R 34, -4, 60 5.16Precuneus PCUN L -10, -64, 50 4.50
R 10, -64, 50 4.22Primary Somatosensory Cotex S1 L -32, -40, 50 5.15
R 34, -36, 56 5.27Intraparietal Sulcus IPS L -30, -58, 48 5.43
R 30, -50, 52 4.99Inferior Cerebellum iCB L -24, -48, -54 5.44
R 18, -58, -54 5.21Superior Cerebellum sCB L -18, -46, -26 6.60
R 16, -44, -26 6.07Free > ForcedVentral Lateral Prefrontal Cortex vlPFC R 46, 16, 2 3.48Posterior Parietal Cortex PPC1 R 40, -58, 44 3.47Posterior Parietal Cortex PPC2 R 46, -54, 32 3.54Cerebellum CB1 L -4, -78, -30 3.44Cerebellum CB2 L -2, -68, -28 3.32Dorsal Medial Prefrontal Cortex dmPFC1 R 10, 20, 56 3.68Dorsal Medial Prefrontal Cortex dmPFC2 L -4, 22, 42 2.80Dorsal Medial Prefrontal Cortex R 8, 22, 40 3.11Paracingulate Gyrus PC Gyrus L -8, 36, 26 3.30Paracingulate Gyrus R 10, 26, 40 3.17Parietal-Occipital Sulcus P-O Sulcus R 16, -76, 42 3.26

32
FREE versus FORCED. We next turned to the direct contrast between the free and forced choice conditions. It should be emphasized that the behavior in the two conditions is closely matched since we yoked the forced choice stimuli/responses to that obtained in the free choice condition. As such, the location of the stimuli and use of hands is essentially identical. Inclusion of No-Go trials insured that participants had to attend to the colored cue in both conditions. The main difference is that in the free choice condition, the participant was free to reach with either hand (and presumably this is the source of the increase in reaction time for the free choice condition). Areas in the posterior parietal cortex (PPC), medial prefrontal cortex (mPFC), and cerebellum (CB) (Vermis/Crus II) showed a stronger BOLD response in the free condition compared to the forced condition (Table 1, Figure 6). Surprisingly, of these regions, only the cerebellum overlapped with the move > rest network. While the cerebellar activation difference was predominantly in the midline, both the parietal and prefrontal activation differences were mainly in the right hemisphere. It is possible that this right hemisphere bias reflects the fact that more of targets were presented in the left visual field (Figure 3B). However, it should be noted that the stimulus locations were matched in the two conditions. We did not identify any brain regions that were more active during forced choice as compared to free choice.
Figure 6. Areas of the brain where activity was greater during free choice than during force choice include the (A) cerebellum (CB) (B) dorsal medial prefrontal cortex (dmPFC), (C) ventrolateral prefrontal cortex (vlPFC), and (D) posterior parietal cortex (PPC). Connectivity. We completed a multivariate analysis examining the connectivity between the ROIs identified in the move > rest and free > forced contrasts. Cubic 27 voxel ROIs centered at the peak activation were identified for each of these regions. A control region centered at the corner of the sampled space (88, -124, -70) was also included. The connectivity analysis was completed on the time course of the BOLD response during all movement (both free and forced conditions), as well as movement during the free condition only and movement during the forced
x = -4 x = 10z = 30 y = 20
z = 2 x = 46 z = 32 z = 52
(A) (B)
(C) (D)

33
condition only. This allowed us to investigate the overall pattern of connectivity during movement, as well as any potential differences between the patterns of connectivity during the free and forced conditions.
Figure 7. Correlation (R) between all ROIs identified in move>rest and free>forced contrasts1.
Activity in all of the ROIs was positively correlated (Figure 7). We hypothesized that
there would be greater connectivity between the parietal and premotor regions during free choice as compared to forced choice (Pesaran 2008). Contrary to this prediction, the correlations between the BOLD time courses for all ROIs was similar for the free and forced choice data (resulting in difference scores of approximately zero).
1Three ROIs listed in Table 1 were input into the connectivity analysis with slightly different coordinates. These were the Right Primary Somatosensory Cortex (46, -36, 52), the Ventral Lateral Prefrontal Cortex (50, 16, -4), and the Parietal-Occipital Sulcus (14, -76, 44). In addition the ROIs labeled PPC2, dmPFC2, and dmPFC3 were not included in the connectivity analysis. Given that we did not find any difference between the connectivity during the free and forced condition, we did not repeat the connectivity analysis with the most up-to-date list of ROIs. We do not anticipate that the results would be significantly different.
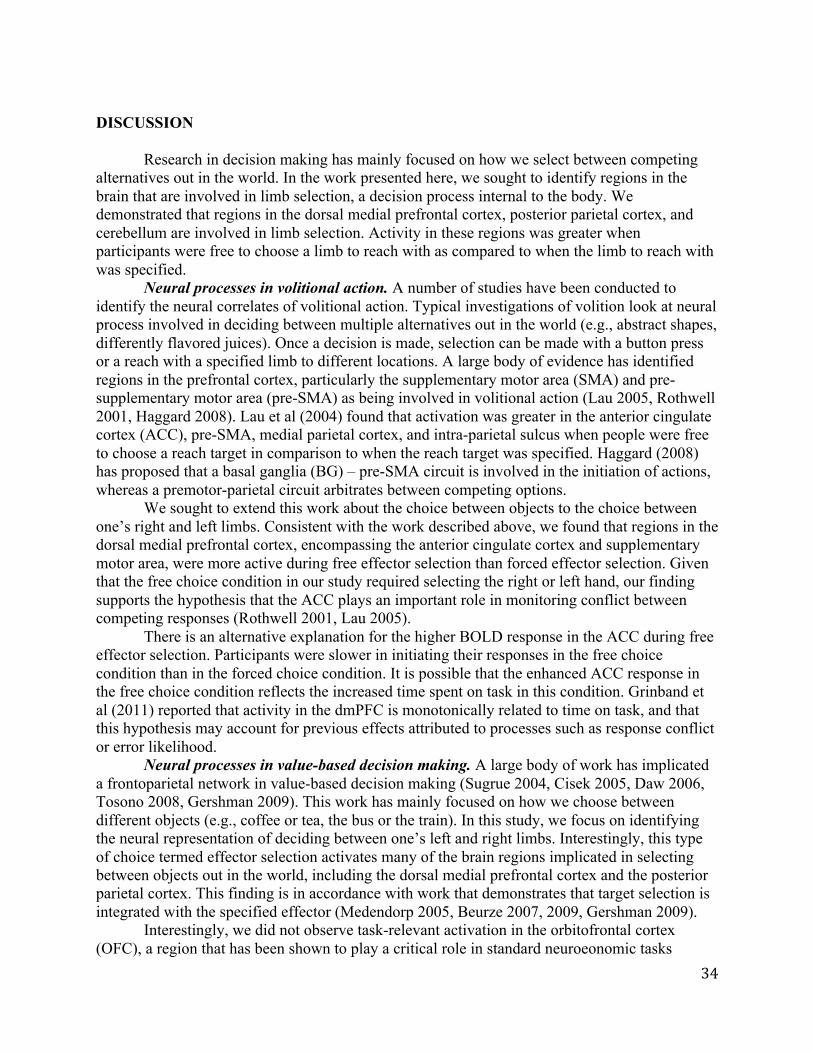
34
DISCUSSION Research in decision making has mainly focused on how we select between competing alternatives out in the world. In the work presented here, we sought to identify regions in the brain that are involved in limb selection, a decision process internal to the body. We demonstrated that regions in the dorsal medial prefrontal cortex, posterior parietal cortex, and cerebellum are involved in limb selection. Activity in these regions was greater when participants were free to choose a limb to reach with as compared to when the limb to reach with was specified. Neural processes in volitional action. A number of studies have been conducted to identify the neural correlates of volitional action. Typical investigations of volition look at neural process involved in deciding between multiple alternatives out in the world (e.g., abstract shapes, differently flavored juices). Once a decision is made, selection can be made with a button press or a reach with a specified limb to different locations. A large body of evidence has identified regions in the prefrontal cortex, particularly the supplementary motor area (SMA) and pre-supplementary motor area (pre-SMA) as being involved in volitional action (Lau 2005, Rothwell 2001, Haggard 2008). Lau et al (2004) found that activation was greater in the anterior cingulate cortex (ACC), pre-SMA, medial parietal cortex, and intra-parietal sulcus when people were free to choose a reach target in comparison to when the reach target was specified. Haggard (2008) has proposed that a basal ganglia (BG) – pre-SMA circuit is involved in the initiation of actions, whereas a premotor-parietal circuit arbitrates between competing options. We sought to extend this work about the choice between objects to the choice between one’s right and left limbs. Consistent with the work described above, we found that regions in the dorsal medial prefrontal cortex, encompassing the anterior cingulate cortex and supplementary motor area, were more active during free effector selection than forced effector selection. Given that the free choice condition in our study required selecting the right or left hand, our finding supports the hypothesis that the ACC plays an important role in monitoring conflict between competing responses (Rothwell 2001, Lau 2005). There is an alternative explanation for the higher BOLD response in the ACC during free effector selection. Participants were slower in initiating their responses in the free choice condition than in the forced choice condition. It is possible that the enhanced ACC response in the free choice condition reflects the increased time spent on task in this condition. Grinband et al (2011) reported that activity in the dmPFC is monotonically related to time on task, and that this hypothesis may account for previous effects attributed to processes such as response conflict or error likelihood. Neural processes in value-based decision making. A large body of work has implicated a frontoparietal network in value-based decision making (Sugrue 2004, Cisek 2005, Daw 2006, Tosono 2008, Gershman 2009). This work has mainly focused on how we choose between different objects (e.g., coffee or tea, the bus or the train). In this study, we focus on identifying the neural representation of deciding between one’s left and right limbs. Interestingly, this type of choice termed effector selection activates many of the brain regions implicated in selecting between objects out in the world, including the dorsal medial prefrontal cortex and the posterior parietal cortex. This finding is in accordance with work that demonstrates that target selection is integrated with the specified effector (Medendorp 2005, Beurze 2007, 2009, Gershman 2009). Interestingly, we did not observe task-relevant activation in the orbitofrontal cortex (OFC), a region that has been shown to play a critical role in standard neuroeonomic tasks

35
involving choice behavior (Chib 2009, Croxson 2009, Lim 2011, Wallis 2011). The OFC has been shown to represent the value of competing options in value-based object selection. Several explanations exist for this distinction from the traditional value-based decision making literature. In our study, subjects made a body-based decision and not a decision between objects out in the world. Thus, the neural value signal may be closer to effector specific brain areas such as regions in the cerebellum or parietal cortex. In addition, participants were not rewarded for selecting one hand or the other, nor were they rewarded for hitting the target. Thus, there was no explicit reward or value signal which the OFC is shown to encode. As such, a neuroimaging study comparing the role of reward learning in object selection and effector selection should be undertaken to fully characterize the neural substrates of value-based decision making. A behavioral paradigm for such a study is outlined in Chapter III. Cerebellar Activation. There is a wealth of research demonstrating the cerebellum’s role in sensorimotor control (Manto 2011). Patients with cerebellar lesions are impaired in a variety of motor tasks including visuomotor adaptation (Martin 1996; Baizer 1999) and sequence learning (Shin 2003). We found that there was greater activation in cerebellar regions traditionally involved in motor function during free choice as compared to forced choice (Küper 2010). This activation overlapped with the cerebellar activation in the move > rest contrast. One explanation for the increased activation in the cerebellum during free choice is that this condition required participants to integrate target location information with body information to make an effector selection for action. The cerebellum may be critical for making motor control decisions with regard to effector selection. This is distinct from selecting between different objects out in the world. Another explanation for the increased cerebellar activation during free choice as compared to forced choice involves the cerebellum’s important role in error-based learning. The cerebellum plays a critical role in integrating information about the body and world (Taylor 2010, Manto 2011). Even in our task, where participants have no explicit error signal and are not told whether they hit the target or not, they are still, as instructed, doing their best to reach to the touch pad at the correct spot. Participants have a forward model of their reach dynamics, and will make an internal judgment as to whether or not they were successful. Thus, it follows that more demand will be placed on the cerebellum when participants are free to choose their right or left hand as this choice will effect their chance of achieving a successful reach. Recent evidence demonstrates that sequence learning in patients with cerebellar ataxia is persevered when the movements are directly cued (Spencer 2009). In the study described here, all movements were indirectly cued. Thus, a final additional explanation for the increased cerebellar activation during free choice is that this condition puts a higher demand on the cerebellum with regards to the indirect cuing of reaches. Right lateralization of activity in the posterior parietal cortex. The right parietal reach region (PRR), but not the left, was more active during free limb selection than forced limb selection. Given that neuronal representation of reach direction is limb dependent, one explanation for this asymmetry could be that participants demonstrated a left hand bias, reaching with their left hand on 55% of all trials (Gershman 2009, Chang 2012, Bernier 2012). This is an unlikely explanation because the asymmetry was present in the free and forced condition. Still, to investigate the effect of the hand use asymmetry on the free > forced contrast, a subset of the participants (n=7) whose overall limb selection was more symmetrical (51 ± 2% left) was analyzed. This analysis confirmed that the BOLD response was greater in the right, but not the left, PRR.

36
Another explanation for the asymmetry in PRR activity could be that target presentations were weighted towards the left side of the screen (Figure 3B). This asymmetrical stimulus display occurred because all subjects were right handed and an adaptive procedure moved the target display such that each hand was selected approximately 50% of the time. It is possible that this perceptual bias could have facilitated the laterality bias in the PRR. However, this is again an unlikely explanation because the perceptual bias was present equally in the free choice and forced choice conditions. Oliveira et. al (2010) demonstrated that transcranial magnetic stimulation (TMS) to the left PPC, but not right PPC biases the competitive process of limb selection. One explanation for this effect is that the representation of reaches in the right hemisphere may be broader and thus harder to perturb with TMS. This broader representation in the right parietal cortex could explain the greater activity in the right PPC during free choice as compared to forced choice. Connectivity. Planning and executing a reaching movement involves the frontal and parietal areas (Beurze 2007, Beurze 2009, Medendorp 2011, Pesaran 2008, Cisek 2005, Hoshi 2000). Recent work has tried to elucidate the functional roles of these regions in action selection. Using fMRI, in a delayed reaching task where temporally distinct cues specified the effector and the target location, Medendorp et al (2005) demonstrated that target and effector information are integrated in the posterior parietal cortex (PPC) and the dorsal premotor cortex (PMd). To identify the neural substrates of this integration (how monkeys decided where to reach), Pesaran et al (2008) recorded from neurons in the PMd and the PRR while monkeys reached to a series of targets in two conditions: (1) free: monkeys were free to search for a reward at three targets in any order (2) instructed: monkeys were instructed in which order to search the targets. Greater coherence was observed between neural activity in the PMd and PRR in the free reaching condition compared to when the monkeys were instructed where to reach. We expected to find a similar enhancement of connectivity between PMd and PRR during the free condition. However, the analysis failed to show greater connectivity PMd and the other ROIs during free choice compared to forced choice. We did find that acitivity in the PMd was highly correlated to acitivity in the cerebellum and parietal cortex during movement in both condition (Figure 7). It is possible that fMRI was not a precise enough measure of neural activity to detect changes in connectivity in this task. Further electrophysiological work should be done to identify the neural circuit of free limb selection. Conclusions. This study is some of the first work identifying the neural correlates of free limb selection and thus adds an important piece to the work in neuroeconomics investigating the processes underlying value-based decision making. Future work will move beyond this basic correlational study, and characterize the role of specific brain regions in specific effector selection processes including the role of uncertainty, effort, value updating, and selection for action. Given the clinical importance of developing rehabilitation therapies that facilitate the affected side after stroke, it is important to establish both behavioral and neuroscientific measures of functional recovery. Identification and characterization of the brain regions implicated in limb selection in healthy individuals will provide a basis for better evaluation of impairments and improvement in stroke patients and thus inform rehabilitation therapies. Acknowledgements Study design, data collection, and analysis for this project were completed in collaboration with Dav Clark.

37
CHAPTER III: The value-based decision processes of effector and target selection. INTRODUCTION When planning a reaching movement, people have two principal decisions (Horowitz 1999): where to reach (target selection) and which limb to reach with (limb selection). Research in the behavioral and neural processes of decision making have focused on the first choice: where to reach. A large body of work has implicated a fronto-parietal choice network in value-based decision making (Tosoni 2008; Beurze 2007, 2009; Medendorp 2011; Hoshi 2000; Cisek 2005). As described in the introduction of Chapter II, there is substantial neuroimaging evidence pointing to the orbitofrontal cortex (OFC) as the locus of the value signal (Chib 2009; Croxson 2009; Lim 2011; Wallis 2011). In addition, patients with damage to their OFC show deficits in reward-based decision making (Izquierdo 2004; Fellows 2006). Further research points to the dorsomedial prefrontal cortex (dmPFC) and the parietal cortex as involved in the comparison of values and selection for action (Hare 2011). The basal ganglia (BG) has been shown as the nexus of a prediction error signal, important for reward learning (Schultz 1997; O’Doherty 2003; Seymour 2007). More recent work has demonstrated the involvement of the cerebellum in reward learning processes. There is substantial evidence in the imaging literature showing that activity in the cerebellum codes the signed prediction error in appetitive conditioning and aversive learning tasks (O’Doherty 2003; Seymour 2004). The cerebellar activation was similar to that in the BG and OFC, only it responded significantly more to reward learning tasks with lower learning rates. Thoma et al (2008) found that patients with cerebellar lesions could initially acquire the contingencies in a reward-based associative learning task, but showed an impairment in reward-based reversal learning. Considering the well-established role of the cerebellum in sensorimotor learning (Manto 2012) and this more recent work demonstrating the cerebellum’s role in reward learning processes, we sought to understand the role of the cerebellum in value-based effector selection. Given our finding that the cerebellum is more active during free limb selection (Chapter II), we expected that patients with cerebellar ataxia would show a selective deficit in tracking limb-dependent reward rates. We previously demonstrated that reinforcement history affects hand choice in an unconstrained reaching task: People became more likely to use their non-dominant hand when the likelihood of hitting the target with the non-dominant hand was increased or the likelihood of missing the target with the dominant hand was increased (Stoloff 2011, Chapter I). We are interested in understanding the ways in which the value-based decision process of choosing a limb differs from the well-studied value-based decision process of choosing between objects out in the world. Work in value-based decision making has focused on questions such as how we decide between items such as chocolate, strawberry, and vanilla ice cream. The OFC codes the value of these items, and this value signal helps one decide between a scoop of the more desired chocolate ice cream and two scoops of the less desired vanilla ice cream. Less attention has been paid to the fundamental question of how we decide which hand to use to pick up the ice cream. Do we use our right, dominant hand even though the ice cream is on a table to our left? Where in the brain is the value signal that helps us make this decision, and what are the behavioral processes that contribute to updating this signal? Research in value-based decision making has employed a novel technique to investigate the neural correlates of the different processes involved in action selection (e.g., the prediction error, the value signal, trading off between exploration and exploitation, etc.) (Daw 2006;

38
Gershman 2009; Rutledge 2009). This novel technique involves varying the probability of the rewards given for choosing competing alternatives (different shapes or colors). The reward functions either employ a step function (Rutledge 2009) or a Gaussian random walk (Daw 2006; Gershman 2009). Either way, the optimal choice changes over time, and participants must continually explore their environment to determine the best choice at any given time.
In these studies, mathematical models of reinforcement learning are fit to the choice data to characterize the process involved in this sort of value-based decision making. The best-fit parameters of these models are used as regressors in fMRI analyses. These analyses have revealed that the striatum is the locus of the prediction error signal. Furthermore, regions in the parietal cortex and prefrontal cortex code the value signal (Daw 2006; Gershman 2009). In addition to this neuroimaging work, to support the critical role of dopamine and the striatum in reinforcement learning, Rutledge et al (2009) found that Parkinson’s patients on a dopamine agonist had a faster learning rate in a reward learning task compared to healthy controls. In the study presented here, we directly compared the effect of recent reinforcement history in a hand choice task and a more traditional target choice task. Both tasks required participants to intercept a virtual target location. In the hand choice task, participants were free to reach with their right or left hand. Their choice behavior was influenced by an imposed limb-dependent variable reinforcement rate. In the target choice task, participants were free to reach to a red or blue target. Their choice behavior was influenced by an imposed color-dependent variable reinforcement rate. A model of reinforcement learning was applied to characterize the change in choice behavior over time. This analysis allowed us to compare the processes involved in value-based decision making between two effectors and two targets for neurologically intact participants and patients with cerebellar ataxia. METHODS Participants. Thirty-three paid volunteers participated in the study: 9 patients with cerebellar ataxia (4 females; mean age ± standard error: 49.4 ± 4.6 years), 12 matched healthy older controls (5 females; 46.8 ± 4.1 years), and 12 younger controls (6 females; 21.6 ± 1 years). All participants were right-handed. The data from six of the participants was excluded in the results presented here. Two participants (one older control and one younger control) exclusively used their right hand in the hand choice task. Two other participants (one older control and one younger control) adopted an outright strategy of simply switching between the two target colors and did not regard feedback in the target choice task. One patient in the cerebellar ataxia group did not complete the second task because of time limitations; only his data from the hand choice task is included. A second patient only completed the target choice task because of a problem with his left hand that was unrelated to his ataxia. The data from his performance on the target task is included. The protocol was approved by the UC Berkeley Institutional Review Board. All participants provided informed written consent at the start of the test session. Prior to the test session, participants’ degree of handedness bias was assessed with the Edinburgh Handedness Questionnaire. Cognitive impairment in the patients with cerebellar ataxia and older controls was assessed with the Montreal Cognitive Assessment (MoCA). A quantification of impairment due to cerebellar ataxia was completed using the International Cooperative Ataxia Rating Scale (ICARS). Patients were scored in a variety of different areas including postural and gait disturbances, limb ataxia, dysarthria, and oculomotor disturbances. ICARS scores are out of 100,

39
with higher scores indicating a greater degree of impairment. ICARS scores have been shown to be correlated with the amount of cerebellar degeneration (Richter 2004). Patients in this study had ICARS scores ranging from 11 to 42.5. Older controls and patients with cerebellar ataxia were well matched in their MoCA scores and years of education, but had a different degree of handedness bias as measured by the Edinburgh Handedness Questionnaire. This difference will be discussed in the results section. Table 1. Information for participants included in analysis (mean ± standard error)
2 Design and Procedures. The participants made horizontal reaching movements, sliding their hand along the surface of a table in an attempt to intercept a visually displayed target. The target was displayed on a 27 cm x 48 cm LCD computer monitor mounted horizontally 22 cm above the table top. The movements were tracked by a 3D motion tracking system (miniBIRD, Ascension Technology, Burlington, VT, USA; sampling rate = 138 Hz). A sensor was placed on the tip of the right and left index fingers (Figure 1A). This set-up allowed vision of the hand to be occluded such that we could best deliver feedback for the experimental manipulation of reward described below. This set-up allowed us to investigate the processes involved in value-based decision making in effector and target selection. Each participant completed two tasks, always in the same order. First, each participant completed a task where they selected their right or left hand to reach through a blue circular target (diameter = 2cm). Second, each participant completed a task where they used their right, dominant hand to reach through a red or blue target. The targets were closer to coral and lavender in color, but I will refer to them as the red and blue target and use these colors in the figures for fluency purposes.
(A) (B) (C)
Figure 1. (A) Reaching movements were displayed on a computer monitor 22 cm above the table top. (B) Blue targets appeared at one of seven locations in the hand choice task. (C) A red and blue (right/left randomized) target appeared at one of seven locations in the target choice task. 2 The mean ages reported in the text include all participants. The mean ages reported in the table include only the participants included in the following analyses (6 participants excluded per description).
Group Age (years)
Edinburgh Handedness Percentage
MoCA (score/30) Education ICARS
Younger Controls (n=10) 20.9 ± 0.7 75.8 ± 6.1 - - -Older Controls (n=10) 48.1 ± 4.5 66.7 ± 4.3 27.1 ± 0.6 16.2 ± 0.7 -Cerebellar Ataxia (n=8) 49.4 ± 4.8 77.1 ± 8.3 26.1 ± 1.3 15.7 ± 0.7 24.1 ± 3.9
!
42! 42!
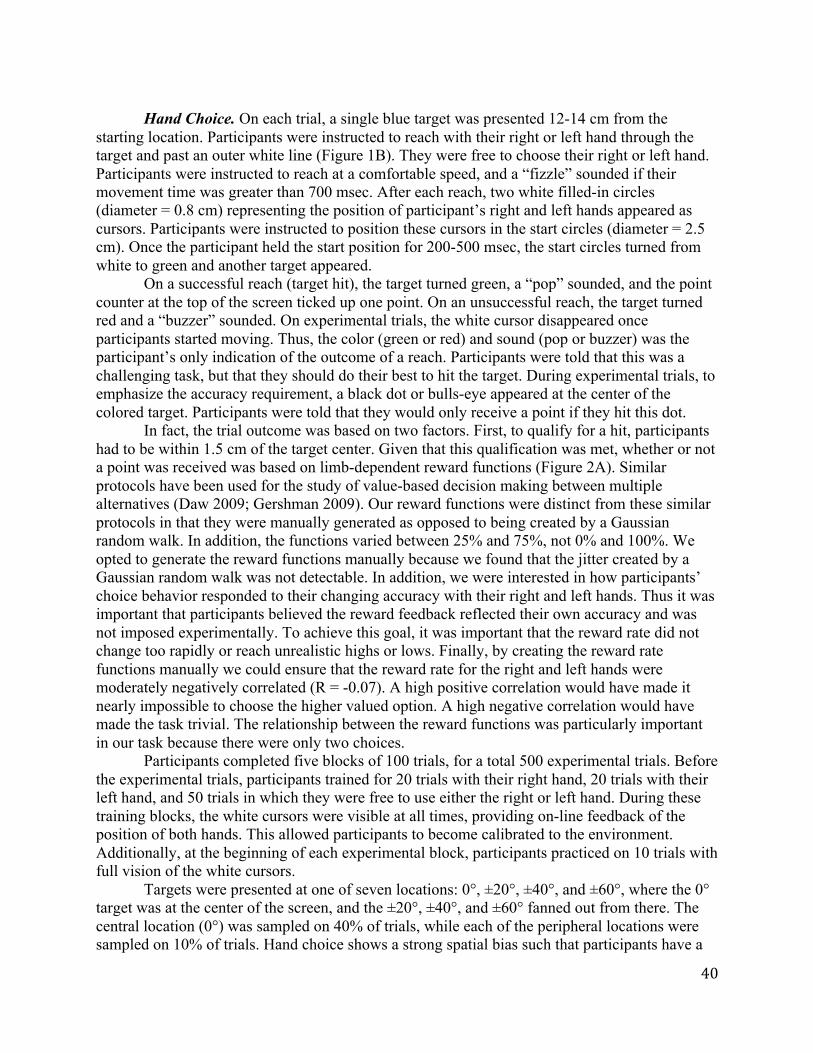
40
Hand Choice. On each trial, a single blue target was presented 12-14 cm from the
starting location. Participants were instructed to reach with their right or left hand through the target and past an outer white line (Figure 1B). They were free to choose their right or left hand. Participants were instructed to reach at a comfortable speed, and a “fizzle” sounded if their movement time was greater than 700 msec. After each reach, two white filled-in circles (diameter = 0.8 cm) representing the position of participant’s right and left hands appeared as cursors. Participants were instructed to position these cursors in the start circles (diameter = 2.5 cm). Once the participant held the start position for 200-500 msec, the start circles turned from white to green and another target appeared.
On a successful reach (target hit), the target turned green, a “pop” sounded, and the point counter at the top of the screen ticked up one point. On an unsuccessful reach, the target turned red and a “buzzer” sounded. On experimental trials, the white cursor disappeared once participants started moving. Thus, the color (green or red) and sound (pop or buzzer) was the participant’s only indication of the outcome of a reach. Participants were told that this was a challenging task, but that they should do their best to hit the target. During experimental trials, to emphasize the accuracy requirement, a black dot or bulls-eye appeared at the center of the colored target. Participants were told that they would only receive a point if they hit this dot.
In fact, the trial outcome was based on two factors. First, to qualify for a hit, participants had to be within 1.5 cm of the target center. Given that this qualification was met, whether or not a point was received was based on limb-dependent reward functions (Figure 2A). Similar protocols have been used for the study of value-based decision making between multiple alternatives (Daw 2009; Gershman 2009). Our reward functions were distinct from these similar protocols in that they were manually generated as opposed to being created by a Gaussian random walk. In addition, the functions varied between 25% and 75%, not 0% and 100%. We opted to generate the reward functions manually because we found that the jitter created by a Gaussian random walk was not detectable. In addition, we were interested in how participants’ choice behavior responded to their changing accuracy with their right and left hands. Thus it was important that participants believed the reward feedback reflected their own accuracy and was not imposed experimentally. To achieve this goal, it was important that the reward rate did not change too rapidly or reach unrealistic highs or lows. Finally, by creating the reward rate functions manually we could ensure that the reward rate for the right and left hands were moderately negatively correlated (R = -0.07). A high positive correlation would have made it nearly impossible to choose the higher valued option. A high negative correlation would have made the task trivial. The relationship between the reward functions was particularly important in our task because there were only two choices.
Participants completed five blocks of 100 trials, for a total 500 experimental trials. Before the experimental trials, participants trained for 20 trials with their right hand, 20 trials with their left hand, and 50 trials in which they were free to use either the right or left hand. During these training blocks, the white cursors were visible at all times, providing on-line feedback of the position of both hands. This allowed participants to become calibrated to the environment. Additionally, at the beginning of each experimental block, participants practiced on 10 trials with full vision of the white cursors. Targets were presented at one of seven locations: 0°, ±20°, ±40°, and ±60°, where the 0° target was at the center of the screen, and the ±20°, ±40°, and ±60° fanned out from there. The central location (0°) was sampled on 40% of trials, while each of the peripheral locations were sampled on 10% of trials. Hand choice shows a strong spatial bias such that participants have a

41
high probability of using their right hand for targets located on the right side of the table and their left hand for targets located on the left side of the table, regardless of the current limb-dependent reward rates. As such, the peripheral locations insured that participants did not adopt a strategy of using just one hand throughout the experiment. The central location, where participants used their right and left hand interchangeably, was sampled more frequently than all other locations. This target location provided a measure of changing choice behavior in response to the experimental limb-dependent reward rate manipulation.
(A) (B)
Figure 2. Imposed reward rates for the right (pink) and left (green) hands and red (red) and blue (blue) targets. Reward rates were bounded between 25% and 75% and identical for the (A) hand choice and (B) target choice tasks. Target Choice. On each trial, two targets, one red and the other blue was presented 12-14 cm from the starting location. The relative right/left position of the colors of the targets was randomized, and there was no evidence that participants preferred to reach to one side or the other. Participants were instructed to reach with their right (dominant) hand through one of the two targets and past an outer white line (Figure 1C). The block structure, number of blocks, and target location were identical to the hand choice task. The main difference was the participant’s belief in the source of receiving a point. In the hand choice task, the importance of accuracy was emphasized. In the target choice task, the participant was told that the accuracy requirement had been eased. To emphasize this change, the bulls-eye was no longer presented at the center of the target. The participant was told that sometimes when they hit the target they would receive a point and sometimes they would not. They were free to choose the red or blue target. They were not told that the different colored targets would be probabilistically rewarded and change over time. They were simply told to do the best they could to earn as many points as they could.
As in the hand choice task, subjects had to be within 1.5 cm of the center of the target to qualify for a point. Given that this criterion was met, a point was given probabilistically depending on the target color dependent reward rates (Figure 2B). The reward rates for the target choice task were identical to those in the hand choice task. The reward rate function for the red target was the same as for the right hand, and the reward rate function for the blue target was the same as for the left hand. This allowed us to best compare the processes involved in these two types of value-based decision making.
Participants always completed the hand choice task and then the target choice task. In the
100 300 5000
25
50
75
100
Trial
Rew
ard
Rat
e (%
)
100 300 500Trial

42
target choice task participants understood that sometimes they would not receive a point when they hit the target, and many surmised that the reward contingency was target color dependent. In the hand choice task, it was important for our experimental question that participants believed that when they hit the target they would receive a point, and when they missed the target they would not receive a point. Thus, it was important that their understanding of the reward contingency in the target choice task did not interfere with their belief about reward in the hand choice task. If participants completed the hand choice task after the target choice task, they may have begun to treat their hands like two objects. However, it should be noted that even with this concern, five pilot participants completed the target choice task before the hand choice task. These participants did not show any differences in behavior from the participants who completed the hand choice task first.
Analysis The analyses performed were nearly identical for the hand choice and target choice tasks.
I will describe how the data from the hand choice task were analyzed, and indicate, via parentheses, the parallel procedures for the target choice task.
Choice Behavior. We sought to characterize the effect of reinforcement on hand and target selection. In order to fully understand the effect of reinforcement on choice behavior it is important to establish any initial biases in choice. To quantify the baseline bias in right hand choice (red target choice), the percent right hand choice (red target choice) was calculated over the first 100 trials (first block) where the reward rates for the right and left hands (red and blue targets) were fixed at approximately 62%. These values were entered into two separate ANOVAs (one for each task) to determine whether there were any between group differences in initial hand (target) choice bias.
In addition, the amount of variation in choice over the course of the task was measured as the range between the minimum and maximum percent right hand choice (red target choice) from trials 101-500 (blocks 2-5) smoothing over a bin of 50 trials. These values were entered into two separate ANOVAs (one for each task) to evaluate group differences in the extent of the variation of hand choice (target choice).
Sequential Effects. Recent reinforcement history can influence choice behavior on multiple time scales. For instance, participants may integrate reward rates over the last 10, 50, 100, etc. number of trials to determine the highest valued choice. In addition, participants’ choices may be affected on a more local level, for instance, by the choice, outcome, and/or location of the previous trial. Participants may prefer to repeat previous choices regardless of the outcome on the previous trial. Alternatively, participants may adopt a win-stay lose-shift strategy where they are more likely to repeat a choice if it was rewarded on the previous trial and more likely to switch their choice if it was not rewarded on the previous trial.
The effect of trial-by-trial dynamics on hand and target choice was analyzed. We quantified these effect by calculating the probabilities of choosing the right hand (red target) at the center target on trial t given that the previous trial t-1 was a right hand hit, right hand miss, left hand hit, or left hand hit (red target hit, red target miss, blue target hit, or blue target miss) at each of the target locations. These values were entered into an ANOVA that allowed us to determine the contribution of the location, choice, and outcome of the previous trial to the choice on the current trial.
Reinforcement Learning Model. The experimental design was adopted in part because it is well suited to a model-based analysis that allows for a characterization of the processes involved in value-based effector and target selection. Thus, a model of reinforcement learning
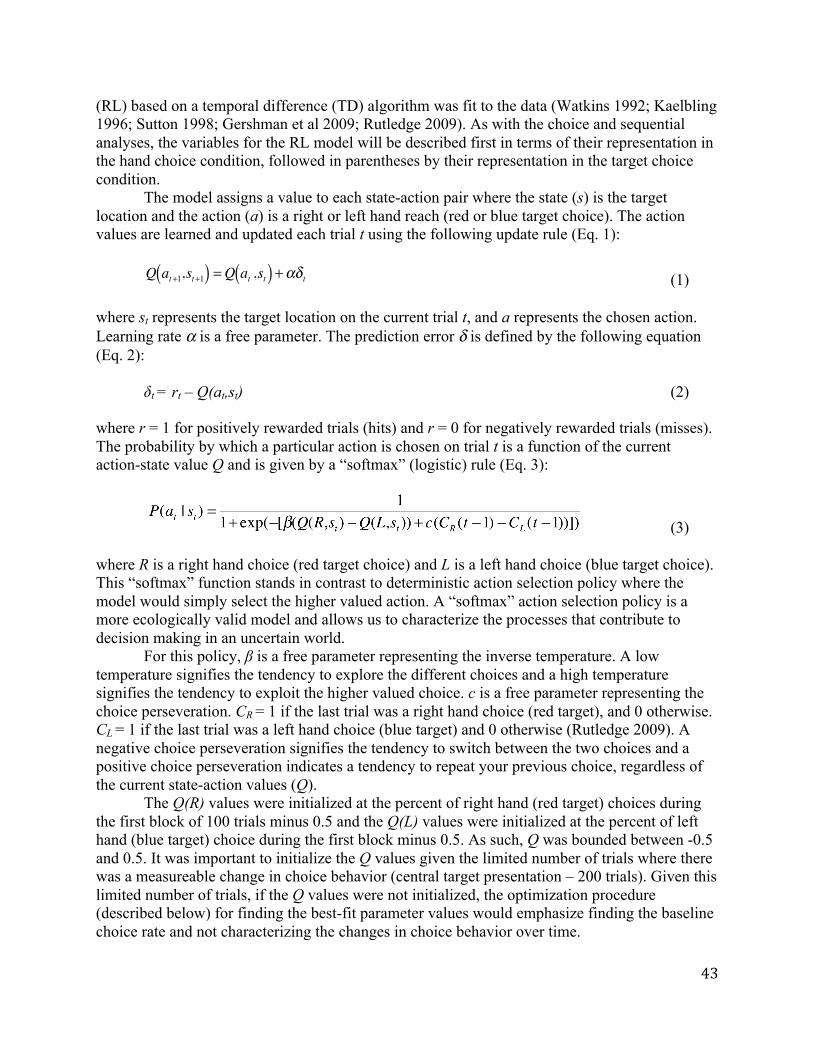
43
(RL) based on a temporal difference (TD) algorithm was fit to the data (Watkins 1992; Kaelbling 1996; Sutton 1998; Gershman et al 2009; Rutledge 2009). As with the choice and sequential analyses, the variables for the RL model will be described first in terms of their representation in the hand choice condition, followed in parentheses by their representation in the target choice condition.
The model assigns a value to each state-action pair where the state (s) is the target location and the action (a) is a right or left hand reach (red or blue target choice). The action values are learned and updated each trial t using the following update rule (Eq. 1):
(1) where st represents the target location on the current trial t, and a represents the chosen action. Learning rate α is a free parameter. The prediction error δ is defined by the following equation (Eq. 2): δt = rt – Q(at,st) (2) where r = 1 for positively rewarded trials (hits) and r = 0 for negatively rewarded trials (misses). The probability by which a particular action is chosen on trial t is a function of the current action-state value Q and is given by a “softmax” (logistic) rule (Eq. 3):
(3)
where R is a right hand choice (red target choice) and L is a left hand choice (blue target choice). This “softmax” function stands in contrast to deterministic action selection policy where the model would simply select the higher valued action. A “softmax” action selection policy is a more ecologically valid model and allows us to characterize the processes that contribute to decision making in an uncertain world.
For this policy, β is a free parameter representing the inverse temperature. A low temperature signifies the tendency to explore the different choices and a high temperature signifies the tendency to exploit the higher valued choice. c is a free parameter representing the choice perseveration. CR = 1 if the last trial was a right hand choice (red target), and 0 otherwise. CL = 1 if the last trial was a left hand choice (blue target) and 0 otherwise (Rutledge 2009). A negative choice perseveration signifies the tendency to switch between the two choices and a positive choice perseveration indicates a tendency to repeat your previous choice, regardless of the current state-action values (Q). The Q(R) values were initialized at the percent of right hand (red target) choices during the first block of 100 trials minus 0.5 and the Q(L) values were initialized at the percent of left hand (blue target) choice during the first block minus 0.5. As such, Q was bounded between -0.5 and 0.5. It was important to initialize the Q values given the limited number of trials where there was a measureable change in choice behavior (central target presentation – 200 trials). Given this limited number of trials, if the Q values were not initialized, the optimization procedure (described below) for finding the best-fit parameter values would emphasize finding the baseline choice rate and not characterizing the changes in choice behavior over time.
Q at+1,st+1( ) = Q at ,st( ) + !" t

44
A second model was evaluated where Q was only a function of hand choice (target choice), and not also target location. This second model was considered because it is possible that participants updated their value (Q) for actions independent of target location. Such value updating is more likely for the target choice task than for the hand choice task, given that effector selection has a large spatial bias. This model will be referred to as the state-independent model (as opposed to the state-dependent model). The update rule for the state-independent model is as follows (Eq. 4, 5): (4) δt = rt – Q(at) (5) The probability by which a particular action is chosen on trial t is given by the “softmax” rule (Eq. 6):
(6)
The goal of both the state-dependent and state-independent models is to characterize the
processes involved in value-based decision making. There is evidence that learning from reward involves different behavioral and neural processes than learning from errors (Frank 2004). Thus, a state-dependent and state-independent model with a single learning rate (α) was compared to a model where the learning rate was different for positively and negatively rewarded trials such that: α= αp for r = 1 α= αn for r = 0 Model fits and comparisons were complete on four models:
(1) State-Dependent – Single Learning Rate (2) State-Dependent – Dual Learning Rate
(3) State-Independent – Single Learning Rate (4) State-Independent – Dual Learning Rate
All models were fit to data from blocks 2-5 (trials 101-500). To obtain the best-fit values for the free parameters (α , c, and β), we minimized the negative log likelihood . A proprietary procedure that uses gradient descent was employed for the optimization of parameter values (fminsearchbnd, Matlab Mathworks, Version R2011b) . The bounds for α , c, and β were [0, 1], [-10, 10], and [-50, 50]. These bounds were chosen to speed up the optimization procedure. They represented bounds that spanned the values found in an unbounded optimization procedure. When α = 0, the Q values are not updated at all and when α = 1, the Q values are updated by the entire amount of the prediction error. A negative c value indicates that the participant prefers to alternate choices independent of the Q values, and positive c values indicate that the participant prefers to repeat a previous choice independent of the Q values. Finally, high positive values of β indicate a tendency to exploit the highest valued option, whereas low positive values of β indicate a tendency to explore both choices. Negative β values must be considered, as these indicate a tendency to choose the lower valued option.
Q at+1( ) = Q at( ) + !" t

45
The Bayesian Information Criterion (BIC) was used for model comparison, where the BIC (Eq. 7) was a function of the negative log-likelihood (–LL), number of parameters (k), and number of trials (n):
BIC = -2ln(-LL) + kln(n) (7)
As with all mathematical modeling, it was imperative that we evaluate the possibility of over-fit. It is critical that a reinforcement learning model with a free learning rate parameter provides a better fit to the data than a model where the learning rate is not allowed to vary. This indicates that a reward learning process, as opposed to random variation, accounts for the change in choice behavior. Thus, a null model was also generated to which all four models were compared. In the null model, the Q values were fixed at the those initialized from the choice probabilities during the first block. The learning rate (α) was set to zero. The best-fit values for the choice perseveration (c) and temperature (β) parameters for the null model were found in the same way as the parameters for the models where the learning rate was allowed to vary. To compare the four models described above to the null model, we calculated a pseudo-R2 statistic defined by (R-Q)/R where R is the –LL for the null model and Q is the –LL for the single and dual learning rate models (Gershman 2009). RESULTS
Choice Behavior Participants flexibly used their right and left hands during the course of the experiment.
Similarly, participants varied their choices between the red and blue target. The variation in choice behavior seemed to correspond to the limb-dependent and target-dependent reward rate functions. Characterization of the changing choice behavior is described in the following analysis of percent right hand and percent red target choice as well as in the model-based analysis. Hand Choice vs. Target Choice. In the hand choice task, all participants demonstrated an initial right hand bias. This stands in contrast to the target choice task, where participants were not biased to choose one color target over the other [F(2,24) = 35.537, p < 0.001] (Figure 3). Another significant difference in the choice behavior between the two tasks is that the change in choice over time was greater in the target choice condition than the hand choice condition [F(2,24) = 10.945, p < 0.01] (Figure 4). This change was measured as the difference between the maximum percent right hand (red target) choice and minimum percent right hand (red target) choice during trials 101-500 over a bin of 50 trials. Hand Choice. The presence of an initial right hand bias in all three groups is demonstrated by the baseline percent right hand use. The percent right hand use during the first block (100 trials) where the reward rate for the right and left hands was fixed at 62% was 73.7 ± 3.5%, 59.0 ± 4.5%, and 70.7 ± 5.0% for the younger controls, older controls, and patients with cerebellar ataxia, respectively (Figure 3A). These figures demonstrate that older controls had a significantly lower right hand bias than the younger controls or patients with cerebellar ataxia [F(1,27) = 3.403, p < 0.05]. This difference was expected given that we assessed that older participants had a weaker right hand bias using the Edinburgh Handedness Questionnaire (see discussion). Thus, younger participants who were well matched to patients with cerebellar ataxia with regards to degree of handedness bias were included in all analyses.
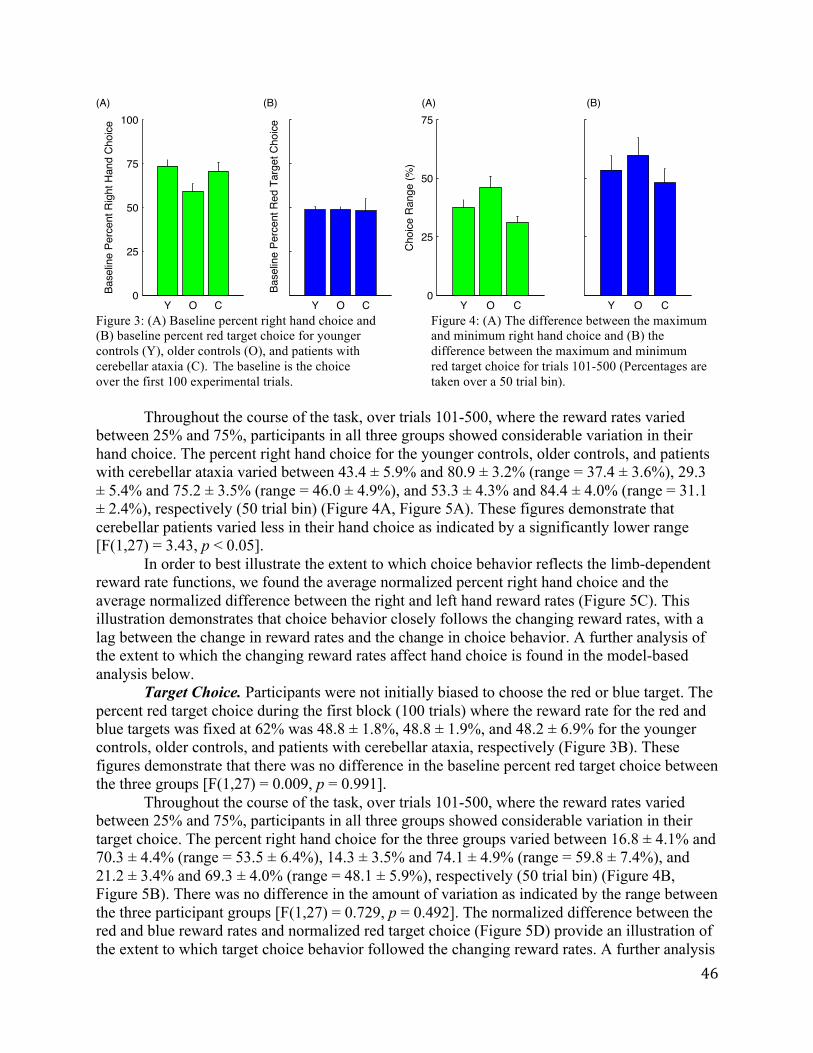
46
(A) (B) (A) (B)
Figure 3: (A) Baseline percent right hand choice and Figure 4: (A) The difference between the maximum (B) baseline percent red target choice for younger and minimum right hand choice and (B) the controls (Y), older controls (O), and patients with difference between the maximum and minimum cerebellar ataxia (C). The baseline is the choice red target choice for trials 101-500 (Percentages are over the first 100 experimental trials. taken over a 50 trial bin). Throughout the course of the task, over trials 101-500, where the reward rates varied between 25% and 75%, participants in all three groups showed considerable variation in their hand choice. The percent right hand choice for the younger controls, older controls, and patients with cerebellar ataxia varied between 43.4 ± 5.9% and 80.9 ± 3.2% (range = 37.4 ± 3.6%), 29.3 ± 5.4% and 75.2 ± 3.5% (range = 46.0 ± 4.9%), and 53.3 ± 4.3% and 84.4 ± 4.0% (range = 31.1 ± 2.4%), respectively (50 trial bin) (Figure 4A, Figure 5A). These figures demonstrate that cerebellar patients varied less in their hand choice as indicated by a significantly lower range [F(1,27) = 3.43, p < 0.05]. In order to best illustrate the extent to which choice behavior reflects the limb-dependent reward rate functions, we found the average normalized percent right hand choice and the average normalized difference between the right and left hand reward rates (Figure 5C). This illustration demonstrates that choice behavior closely follows the changing reward rates, with a lag between the change in reward rates and the change in choice behavior. A further analysis of the extent to which the changing reward rates affect hand choice is found in the model-based analysis below. Target Choice. Participants were not initially biased to choose the red or blue target. The percent red target choice during the first block (100 trials) where the reward rate for the red and blue targets was fixed at 62% was 48.8 ± 1.8%, 48.8 ± 1.9%, and 48.2 ± 6.9% for the younger controls, older controls, and patients with cerebellar ataxia, respectively (Figure 3B). These figures demonstrate that there was no difference in the baseline percent red target choice between the three groups [F(1,27) = 0.009, p = 0.991]. Throughout the course of the task, over trials 101-500, where the reward rates varied between 25% and 75%, participants in all three groups showed considerable variation in their target choice. The percent right hand choice for the three groups varied between 16.8 ± 4.1% and 70.3 ± 4.4% (range = 53.5 ± 6.4%), 14.3 ± 3.5% and 74.1 ± 4.9% (range = 59.8 ± 7.4%), and 21.2 ± 3.4% and 69.3 ± 4.0% (range = 48.1 ± 5.9%), respectively (50 trial bin) (Figure 4B, Figure 5B). There was no difference in the amount of variation as indicated by the range between the three participant groups [F(1,27) = 0.729, p = 0.492]. The normalized difference between the red and blue reward rates and normalized red target choice (Figure 5D) provide an illustration of the extent to which target choice behavior followed the changing reward rates. A further analysis
Y O C0
25
50
75
100Ba
selin
e Pe
rcen
t Rig
ht H
and
Choi
ce
Y O C
Base
line
Perc
ent R
ed T
arge
t Cho
ice
Y O C0
25
50
75
Choi
ce R
ange
(%)
Y O C

47
of the extent to which the changing reward rates affect the target choice is found in the model-based analysis below. (A) (B) (C) (D)
Figure 5. (A) Average percent right hand use and (B) average percent red target choice as a 50 trial moving average (black) are presented with the average experienced reward rates for the right (pink) and left (green) hands and red and blue targets. The three participants groups are presented: younger controls (top), older controls (middle), patients with cerebellar ataxia (bottom). (C) Average normalized percent right hand use and (D) average normalized percent red target choice as a 50 trial moving average (black) are presented with the average normalized difference between the experienced reward rates for the right and left hands (pink-green) and red and blue targets (red-blue). Choice by Target Location. The choice percentages described above collapse over all target locations. In the hand choice task, hand choice demonstrates a strong spatial bias. When the targets were on the far right side of the screen, participants almost always used their right hand. When the targets were on the far left side of the screen, participants almost always used their left hand (Figure 6A). Given that hand choice demonstrates this strong spatial bias, in order to get a measure of the effect of the limb-dependent reward rates on hand choice, we sampled the center target location (0°) on 40% of all trials. The spatial bias present in the hand choice task is not present for the target choice task (Figure 6B). In the target choice task, regardless of the target location, participants varied their choice between the red and blue target in response to the changing color-dependent reward rates.
0255075
100
0255075
100
% R
ight
Han
d U
se /
Rew
ard
Rat
es
% R
ed T
arge
t Cho
ice
/ Rew
ard
Rat
es
100 300 5000
255075
100
Trial100 300 500
Trial
0
1
0
1
Nor
mal
ized
Per
cent
Rig
ht H
and
Use
/ R
ewar
d R
ate
Diff
eren
ce
Nor
mal
ized
Per
cent
Red
Tar
get C
hoic
e / R
ewar
d R
ate
Diff
eren
ce
100 300 5000
1
Trial100 300 500
Trial
Younger Controls Older Controls Cerebellar Patients

48
-60° -40° -20° 0° 20° 40° 60° Figure 6. (A) Average percent right hand use and (B) average percent red target choice as a function of target location for each of the participant groups: younger controls (light gray), older controls (dark gray), and patients with cerebellar ataxia (black). Sequential Effects. We performed a sequential analysis to determine to what extent hand and target choices were influenced by the choice, outcome, and location of the previous trial. Given the strong spatial bias in the hand choice task described above, the examination of the trial-by-trial effects only included trials where the current trial was a target presentation at the center location (0°). Since 40% of the targets were presented at the center location, we were afforded many trials where we could look at how choice behavior changed in response to the choice, outcome, and location of the previous trial. Hand Choice. Sequential analysis revealed that hand choice on the current trial was not affected by the reward outcome on the previous trial [Main effect of outcome: F(1,25) = 0.004, p = 0.953]. However, the analysis revealed that the younger controls and older controls were more likely to choose their right hand after a right handed trial, and choose their left hand after a left handed trial, regardless of outcome of the previous trial (Figure 7A). [Main effect of choice: F(1,25) = 38.893, p < 0.001]. This effect was strongest when the target repeated at the center location on successive trials3 [Main effect of location: F(3,23) = 13.867, p < 0.001]. Interestingly, this perseveration effect was not present in the patients with cerebellar ataxia [Interaction between participant group and choice: F(2,25) = 5.888, p < 0.01]. One might explain the lack of perseveration in patients with cerebellar ataxia by their high right hand bias. However, it should be noted that younger controls also had a high right hand bias, but still showed this perseveration effect (see discussion). Target Choice. The target choice analysis revealed that participants were more likely to choose the red target after a red target hit than after a red target miss (Figure 7B). Similarly, they 3 For the hand choice sequential analysis, it should be noted that while there are seven different target locations, given the limited number of right hand choices for targets located on the left side of the screen and left hand choices for targets located on the right side of the screen, only four locations for each hand were input into the statistical analysis (right: 0°, 20°, 40°, and 60°, left: 0°, -20°, -40°, and -60°). For the target choice sequential analysis, given the large possible number of target location sequences (49), each sequence of target location presentations was only sampled a few times. Thus the statistical analysis collapsed over all seven locations.
% R
ight H
and
Use
% R
ed T
arge
t Cho
ice(A)
(B)
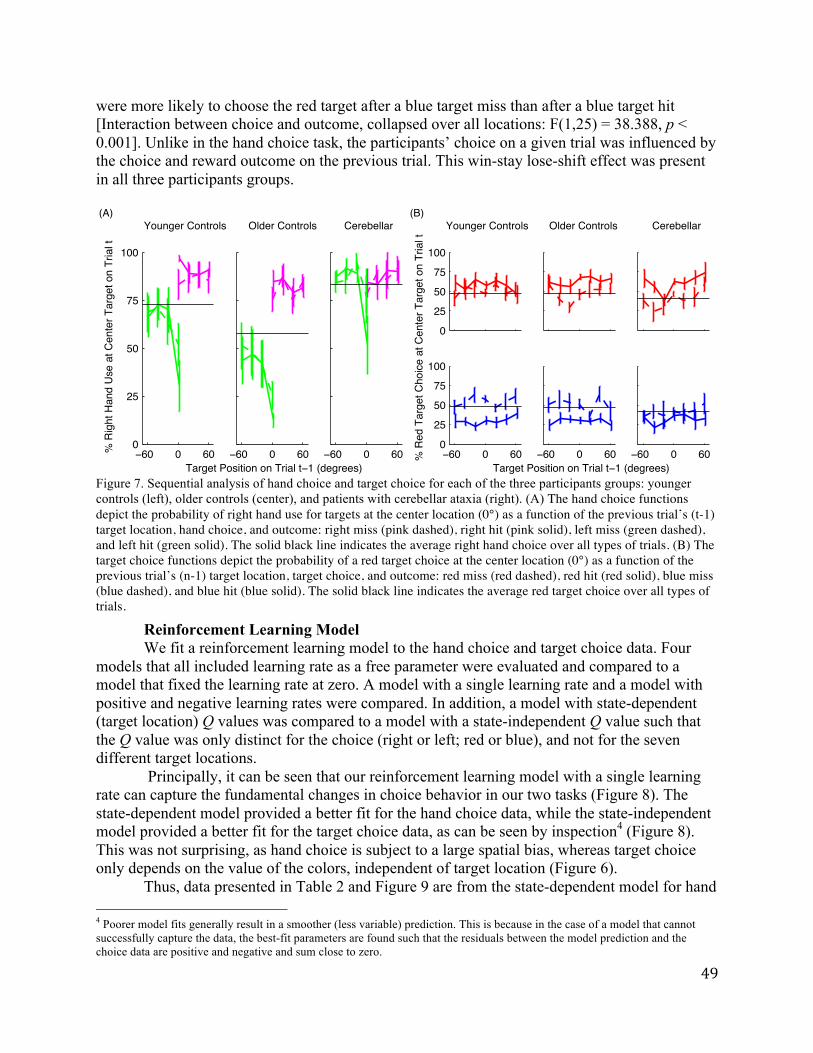
49
were more likely to choose the red target after a blue target miss than after a blue target hit [Interaction between choice and outcome, collapsed over all locations: F(1,25) = 38.388, p < 0.001]. Unlike in the hand choice task, the participants’ choice on a given trial was influenced by the choice and reward outcome on the previous trial. This win-stay lose-shift effect was present in all three participants groups. (A) (B) Younger Controls Older Controls Cerebellar Younger Controls Older Controls Cerebellar
Figure 7. Sequential analysis of hand choice and target choice for each of the three participants groups: younger controls (left), older controls (center), and patients with cerebellar ataxia (right). (A) The hand choice functions depict the probability of right hand use for targets at the center location (0°) as a function of the previous trial’s (t-1) target location, hand choice, and outcome: right miss (pink dashed), right hit (pink solid), left miss (green dashed), and left hit (green solid). The solid black line indicates the average right hand choice over all types of trials. (B) The target choice functions depict the probability of a red target choice at the center location (0°) as a function of the previous trial’s (n-1) target location, target choice, and outcome: red miss (red dashed), red hit (red solid), blue miss (blue dashed), and blue hit (blue solid). The solid black line indicates the average red target choice over all types of trials.
Reinforcement Learning Model We fit a reinforcement learning model to the hand choice and target choice data. Four
models that all included learning rate as a free parameter were evaluated and compared to a model that fixed the learning rate at zero. A model with a single learning rate and a model with positive and negative learning rates were compared. In addition, a model with state-dependent (target location) Q values was compared to a model with a state-independent Q value such that the Q value was only distinct for the choice (right or left; red or blue), and not for the seven different target locations. Principally, it can be seen that our reinforcement learning model with a single learning rate can capture the fundamental changes in choice behavior in our two tasks (Figure 8). The state-dependent model provided a better fit for the hand choice data, while the state-independent model provided a better fit for the target choice data, as can be seen by inspection4 (Figure 8). This was not surprising, as hand choice is subject to a large spatial bias, whereas target choice only depends on the value of the colors, independent of target location (Figure 6). Thus, data presented in Table 2 and Figure 9 are from the state-dependent model for hand 4 Poorer model fits generally result in a smoother (less variable) prediction. This is because in the case of a model that cannot successfully capture the data, the best-fit parameters are found such that the residuals between the model prediction and the choice data are positive and negative and sum close to zero.
60 0 600
25
50
75
100
% R
ight
Han
d U
se a
t Cen
ter T
arge
t on
Tria
l t
60 0 60Target Position on Trial t 1 (degrees)
60 0 60
0
25
50
75
100
60 0 600
25
50
75
100
60 0 60Target Position on Trial t 1 (degrees)
60 0 60% R
ed T
arge
t Cho
ice
at C
ente
r Tar
get o
n Tr
ial t

50
choice and the state-independent model for target choice. As such, separate task-specific statistical analyses were performed on the best-fit parameter values for the model fits. A between task analysis was completed with the understanding that there were fundamental differences between the type of models applied to the two tasks. These differences could account for any effects that we find. (A) (B)
Figure 8. (A) Average percent right hand use and Figure 9. Best-fit parameter values for the (B) average percent red target choice as a 10 trial moving learning rate reinforcement learning model of average (black) are presented with the average percent right (A) hand choice and (B) target choice for younger right hand use and red target choice predicted by the best-fit controls (Y), older controls (O), and patients with model with state-dependent Q values (red) and state- cerebellar ataxia (C). independent Q values (blue). The three subjects groups are presented: younger controls (top), older controls (middle), patients with cerebellar ataxia (bottom).
Table 2. Reinforcement learning model best-fit parameter values (mean ± standard error).
0255075
100
0255075
100
% R
ight
Han
d U
se
% R
ed T
arge
t Cho
ice
100 300 5000
255075
100
Trial100 300 500
Trial
0
0.05
0.10
0.15
0.20
Lear
ning
Rat
e
Y O C0
2
4Te
mpe
ratu
re
Y O C0
1
2
0
0.5
1
1.5
Choi
ce P
erse
vera
tion
0
0.2
0.4
0.6
0
0.25
0.50
Participant Group
Model Condition /Participant Group
! Learning
Rate
c Choice
Perseveration
" Temperature
-LL BIC Pseudo-R2
Hand ChoiceYounger Controls 0.08 ± 0.02 - 0.95 ± 0.13 3.9 ± 0.3 101 ± 17 9.0 ± 0.4 0.16 ± 0.05Older Controls 0.13 ± 0.05 - 1.24 ± 0.25 4.2 ± 0.3 98 ± 10 8.9 ± 0.2 0.15 ± 0.04Cerebellar Patients 0.03 ± 0.01 - 0.41 ± 0.28 4.5 ± 0.4 104 ± 10 8.7 ± 0.2 0.10 ± 0.03
Target ChoiceYounger Controls 0.33 ± 0.08 - 0.11 ± 0.13 2.0 ± 0.4 239 ± 7 7.0 ± 0.1 0.06 ± 0.02Older Controls 0.38 ± 0.10 - 0.38 ± 0.10 1.7 ± 0.3 222 ± 11 7.2 ± 0.1 0.07 ± 0.02Cerebellar Patients 0.42 ± 0.14 - 0.42 ± 0.14 1.1 ± 0.4 238 ± 11 7.0 ± 0.1 0.07 ± 0.03
!P !N
Hand ChoiceYounger Controls 0.15 ± 0.03 0.08 ± 0.05 0.92 ± 0.13 3.4 ± 0.2 100 ± 16 15.1 ± 0.4 0.17 ± 0.05Older Controls 0.19 ± 0.06 0.09 ± 0.05 1.22 ± 0.23 4.0 ± 0.3 96 ± 10 14.9 ± 0.2 0.17 ± 0.04Cerebellar Patients 0.06 ± 0.02 0.03 ± 0.01 0.39 ±0.29 4.1 ± 0.3 102 ± 9 14.8 ± 0.2 0.12 ± 0.03
Target ChoiceYounger Controls 0.41 ± 0.12 0.27 ± 0.06 0.09 ± 0.14 3.1 ± 0.8 238 ± 7 13.0 ± 0.1 0.07 ± 0.02Older Controls 0.48 ± 0.13 0.40 ± 0.10 0.36 ± 0.09 2.7 ± 0.6 221 ± 11 13.2 ± 0.1 0.08 ± 0.02Cerebellar Patients 0.28 ± 0.12 0.40 ± 0.13 0.06 ± 0.15 1.6 ± 0.3 237 ± 12 13.0 ± 0.1 0.07 ± 0.03
Sin
gle
Lear
ning
Ra
te
Posi
tive
and
Neg
ativ
e Le
arni
ng
Rate
s
(A) Younger (B) Older Cerebellar
51
The single learning rate model provided an excellent fit to the choice data. We also looked at models where there were separate learning rates for positively and negatively rewarded trials. The best-fit parameter values for the negative learning rate were less than the positive learning rate in the hand choice model fit, but not in the target choice model fit. This suggests that the decision process of choosing the right or left hand is affected differently by hits and misses (see discussion). However, while the introduction of positive and negative learning rates resulted in a lower negative log-likelihood (-LL), when taking into account the additional free parameter with the Bayesian Information Criterion (BIC), the positive and negative learning rate model did not provide a superior fit. Furthermore, for the dual learning rate model, the best-fit negative learning rate for multiple subjects was zero. This could possibly suggest that the introduction of a second learning rate parameter resulted in an over-fit of the data. However, if this was the case, one would expect that the best-fit parameters would be identical for the positive and negative learning rates. Given that there was not an improvement in fit and that there is no clear explanation for the zero value of the negative learning rate, statistical analyses were not performed on the models with separate parameters for positive and negative learning rates. For hand choice, the patients with cerebellar ataxia had a marginally lower learning rate [F(2) = 2.288, p = 0.122] and a significantly lower choice perseveration [F(2) = 4.380, p = 0.023]. These findings are in accordance with the choice behavior analysis and sequential analysis that demonstrated that patients with cerebellar ataxia show less variation in their hand choices and do not perseverate. There was no difference between the groups in the temperature [F(2) = 0.723, p = 0.495] (Figure 9A). For target choice, there was no difference in the best-fit parameter values (learning rate: [F(2) = 0.204, p = 0.817], choice perseveration: [F(2) = 1.875, p = 0.174], and temperature: [F(2) = 1.494, p = 0.244]) between the three participant groups (Figure 9B). For all three parameters, there was an effect of condition. The learning rate was lower for hand choice as compared to target choice [F(1,24) = 18.274, p < 0.001]. The choice perseveration was higher for hand choice as compared to target choice [F(1,24) = 17.458, p < 0.001]. Finally, the temperature was higher for hand choice as compared to target choice [F(1,24) = 93.396, p < 0.001] . DISCUSSION The study described here extends our findings from Chapter I and demonstrates that hand choice can be influenced by dynamic limb-dependent task success. Through direct comparison to a parallel target choice task, we were able to elucidate the similarities and differences between value-based effector selection and target selection. We found that patients with cerebellar ataxia only behaved differently in the hand choice task when compared to healthy controls. This supports the findings in Chapter II, pointing to a critical role of the cerebellum in effector selection. Both the hand choice data and target choice data were well fit by a model of reinforcement learning. The model-based analysis lends support to our behavioral findings. Hand Choice vs. Target Choice. One fundamental difference between hand choice and target choice is that hand choice demonstrates a strong initial bias. Participants prefer to reach with their right, dominant hand. In contrast, participants are not initially biased to choose the red or blue target. In our study, the initial hand choice bias was markedly different in the three participant groups as assessed with the Edinburgh Handedness Questionnaire and with the percent right hand use over the first 100 experimental trials. Younger controls and patients with

52
cerebellar ataxia demonstrated a stronger right hand bias than older controls. Przybyla et al (2011) showed that motor asymmetries between the dominant and non-dominant limb decrease with age. It is possible that given that cerebellar ataxia results in motor impairments, even in the absence of hemiparesis, these patients do not experience this stereotyped reduction in motor asymmetries. Thus they maintain a strong handedness bias as they age. To ensure that any affects we found of cerebellar ataxia on choice behavior could not be simply attributed to this high degree of handedness bias, data from younger controls was included in all analyses. Younger controls were well matched to the patients with regards to their handedness bias. Another one of the most notable differences between effector selection and target selection is that effector selection demonstrates a strong spatial bias (Gardiner 2006; Dancause 2010). People prefer to use their ipsilateral limb to reach to items regardless of hand dominance or current reward contingencies. Target selection does not demonstrate this spatial bias. In our tasks, this difference is demonstrated by participants’ hand choice variation at the center target location and nearly static hand choice at the peripheral target locations. In contrast, participants vary their target choice at all target locations. This behavioral difference accounts for the difference in the best-fit model for the two tasks.
The hand choice data is best accounted for by a model with state-dependent Q-values (Kaebling 1996) whereas the target choice data is best account for by a model with state-independent Q-values (Daw 2006; Gershman 2009). This fundamental behavioral difference, captured by two distinct models, may account for the difference in the best-fit learning rates found in the two tasks. In effect, in the target choice task, participants are afforded more trials to learn the reward contingencies. In the hand choice task, participants’ reward rate learning is limited to 40% of the trials where they use their right and left hands interchangeably. Thus, there is a higher learning rate in the target choice task than in the hand choice task. The difference in learning rates could account for the differences the patients with cerebellar ataxia demonstrate in choice behavior in the hand choice task, but not in the target choice task.
Patients with Cerebellar Ataxia. Patients with cerebellar ataxia had a smaller range in hand choice variation as compared to healthy controls. Furthermore, the best-fit learning rate was lower for the patients with cerebellar ataxia. O’Doherty et al (2003) showed that the cerebellum codes a signed prediction error in an appetitive conditioning task. While activity in the striatum and orbitofrontal cortex (OFC) were fit equally well by fast and slow learning rates, the activity in the cerebellum was significantly better fit by slower learning rates. As such, given the slow learning rates in the hand choice task, patients with cerebellar ataxia may have been differentially affected in this task. In the target choice task, activity in the striatum and/or the OFC could have been sufficient for the value-based decision making processes.
Another notable difference in hand choice behavior between patients with cerebellar ataxia and healthy controls is that patients demonstrated less perseveration in their choices. Healthy controls were more likely to choose their right hand when the previous trial was a right hand choice, and were similarly more likely to choose their left hand when the previous trial was a left hand choice. This effect was most prominent for repeated trials at the center target location. This effect was not present in the patients with cerebellar ataxia, as confirmed by the sequential analysis and lower choice perseveration parameter in the model-based analysis.
Rutledge et al (2009) found that Parkinson’s patients showed greater perseveration in their choices in a reward learning task. This affect was reduced to the perseveration level of healthy older controls when the patients took a dopamine agonist. In this case, it is hypothesized that the decreased dopamine level in Parkinson’s patients contributes to a deficit in switching

53
choices. In contrast, in our study, it is possible that damage to the cerebellum contributed to a deficit in repeating choices in the hand choice task.
There was no difference between the groups in the sequential effects in target choice behavior. All groups demonstrated a win-stay lose-shift pattern such that they were more likely to choose a red target if the previous trial was a red target choice that was rewarded than if it was a red target choice that was not rewarded. Similarly, they were more likely to choose a red target if the previous trial was a blue target choice that was not rewarded than if it was a blue target choice that was rewarded.
Reinforcement Learning Model. We investigated four different reinforcement learning models: (1) State-Dependent – Single Learning Rate, (2) State-Dependent – Dual Learning Rate, (3) State-Independent – Single Learning Rate, (4) State-Dependent – Dual Learning Rate. The rationale for the state-dependent and state-independent models is described above. Models with a single learning rate and a distinct learning rate for positively and negatively rewarded trials were included in order to characterize differences in learning from positive and negative outcomes. This characterization will allow for a better comparison of the behavioral processes of value-based effector selection and the behavioral processes of value-based target selection. In addition, there is evidence that different neural structures and processes contribute to learning from reward and learning from punishment. For instance, “…high amounts of dopamine facilitate learning from positive reinforcement, while low amounts of dopamine facilitate learning from negative reinforcement” (quoted from Stoloff 2011; Frank 2004). In accordance with this finding, Rutledge et al (2009) demonstrated that patients taking a dopamine agonist had a heightened positive, but not negative, learning rate in a model-based analysis of reward-based decision making. The cerebellum has a well-established role in error-based learning (Manto 2012). More recent work points to the important role of the cerebellum in reward-based learning (O’Doherty 2003; Seymour 2004; Thoma 2008). As such, it is critical to elucidate the mechanisms by which the cerebellum contributes to value-based decision making. Characterizing the distinct role the cerebellum plays in learning from positive and negative reinforcement will add to this understanding. Unfortunately, our findings with regards to the positive and negative learning rates in the model-based analysis were inconclusive. While it appeared that the hand choice task was best fit by a lower negative learning rate, the finding that many participants had a best-fit negative learning rate of zero made it difficult to interpret this result. Thus, future work should be undertaken to characterize how positive and negative outcomes differentially affect value-based decision making. This work should include both value-based effector selection and target selection in healthy controls and different patient populations including patients with cerebellar ataxia, Parkinson’s disease, and damage to the OFC. Future Directions. Activation in the prefrontal cortex (PFC), and specifically the orbital frontal cortex (OFC) as measured by functional magnetic resonance imaging (fMRI) has been shown to code the value signal for decision making (Chib 2009, Croxson 2009, Lim 2011, Wallis 2011). Furthermore, there is evidence that patients with damage to their OFC acquire and organize value information for decision making differently than people with no neurological impairment. When comparing the value of different apartments, neurologically intact participants compare category specific information such as rent or noise level across apartments, whereas patients with OFC damage organize information around specific apartments. This difference in value information acquisition is potentially due to their “…impaired ability to determine the relative value of alternatives” (Fellows 2006). Similarly, Izquierdo et al (2004) found that rhesus

54
monkeys with bilateral OFC lesions were impaired at making choices guided by reward. Considering this work demonstrating the importance of the OFC in value-based decision making, we have begun evaluating patients with OFC damage on the hand choice and target choice tasks described in this study. We anticipate that we will replicate the result that patients with damage to the OFC are impaired in reward-based decision making in the target choice task (Wallis 2007, Kennerly 2011). Given that their impairment in decision making is thought to arise in part from an inability to correctly code and use the prediction error signal, it is possible that OFC patients will also be impaired in the hand choice task. Furthermore, the impulsive nature of patients with damage to the OFC may results in deficits in both tasks. The neuropsychological work reported in this study with patients with cerebellar ataxia and the work proposed with patients with damage to their OFC provides one piece of the puzzle in identifying the regions of the brain involved in value-based effector and target selection. In conjunction with this work, neuroimaging techniques can provide more information to characterize the neural processes in value-based decision making. Computational models of reinforcement learning provide an important tool for identifying and characterizing the behavioral processes involved in decision making. Together with neuroimaging, these mathematical models allow us to more specifically characterize the function of different brain regions. Daw et al (2009) fit a reinforcement learning model to choice behavior in a probabilistic reward-learning task. Using fMRI, they demonstrated that activity in the striatum was significantly correlated with the prediction error (δ). Furthermore, using the reinforcement model to characterize choices as exploitive or exploratory (β), they found that activation was greater in the intra-parietal sulcus (IPS) for exploratory choices. Similarly, Gershman et al (2009) used fMRI and an RL model to show that activity in the parietal cortex and prefrontal cortex correspond to the chosen value (Q) and that activity in the striatum corresponds to the prediction error (δ). Given this work demonstrating the fruitfulness of combining neuroimaging techniques, psychophysical studies of reinforcement learning, and mathematical models in identifying and characterizing the neural regions involved in value-based decision making, we have begun to adapt the tasks described in this chapter for a study in the fMRI scanner. We have already demonstrated that the choice behavior in the hand choice and target choice task can be well fit by a mathematical model of reinforcement learning. Thus, by adapting these tasks to the scanner, we will be able to establish the model elements including the Q value, the learning rate (α), the temperature (β), and the choice perseveration (c) as regressors in an fMRI analysis. As such, we will be able to identify the role of specific brain regions in the value-based decision making processes of choosing a hand and choosing a target. Conclussions. Goal directed reaching requires two principal decisions: where to reach and which limb to reach with. In this study, we extended our previous work on the effect of recent reinforcement on effector selection (Chapter I, Stoloff 2011) in order to compare and contrast the processes involved in reward-based effector selection and target selection. As such, we were able to continue to shed light on the processes involved in value-based decision making. We provided further evidence of a critical role of the cerebellum in effector selection. In addition, we established congruous behavioral paradigms and models of reinforcement learning for the study of effector and target selection. Thus, the stage has been set for future neuroimaging studies that will identify and characterize the neural regions involved in value-based effector and target selection.

55
CONCLUSION Interacting with the world requires the continuous selection of actions. For instance, on a typical morning, before you have even left the house, you will make decisions about what to where (e.g., a skirt or slacks), what to drink (e.g., orange juice or coffee), what to eat for breakfast (e.g., toast, cereal, eggs), and which mode of transit to take to work (e.g., bike, car, subway). The decisions you make will likely be based on your previous experiences. You are more likely to choose cereal if the cereal you had yesterday was delicious than if it left you with a funny feeling in your stomach. Furthermore, your decisions will interact with one another. If you choose to ride your bike, you may opt to wear slacks instead of a skirt. These decisions about objects in the world will interact with decisions about how to perform these actions. For instance, if you choose to drink coffee, you may prefer to lift the mug with your dominant hand given that the weight and temperature of the coffee require that you keep the mug steady. If you choose orange juice, you will not be as particular how you lift the cup, and you may even use a straw and not lift it at all. Recent work in the neuroscience of decision making has focused on how we make decisions about objects in the world (i.e. do we want orange juice or coffee). Less attention has been paid to how we decide between competing responses, and specifically how we decide between using our right or left hand in everyday, moment-to-moment decisions. The findings in the first study (Chapter I, Stoloff 2011) described in this dissertation demonstrate that recent reinforcement history affects limb selection. This study provides a proof of concept of a paradigm that could be effective in facilitating use of the effected side after a stroke. A secondary finding of this study is that there is a cost of competitive limb selection as evidenced by an increased reaction time at target locations where the right and left are selected interchangeably. In Chapter II of this dissertation, we sought to characterize the neural processes involved in competitive limb selection by comparing neural activity when participants were free to reach with either limb to neural activity when the limb to reach with was specified. We found that regions implicated in decision making, including the prefrontal cortex, the posterior parietal cortex, and the cerebellum, were more active during free effector selection than specified (forced) effector selection. Finally, in Chapter III, we sought to further characterize the processes involved in effector and target selection. We compared behavior in a traditional value-based decision making task between two probabilistically rewarded targets (target choice) to behavior in a value-based decision making task between the two effectors (hand choice). We found that patients with cerebellar ataxia showed selectively different behavior in the hand choice task. Furthermore, we fit a mathematical model of reinforcement learning model to the choice behavior in both tasks to help characterize these selective differences. We found that patients with cerebellar ataxia showed less variation in their hand choice and tended to switch their hand choice more (perseverate less) than older and younger controls. Taken together, the work presented in this dissertation makes a substantial contribution to the current research on the behavioral and neural processes of value-based decision making. A fundamental understanding of the processes underlying limb selection are particularly important in light of the pressing need to develop effective and accessible rehabilitation strategies after stroke. In order to best help hemiparetic patients, it is critical that we have a full understanding of the behavioral and neural processes underlying limb selection in healthy people. This work,

56
particularly the work described in Chapter III, provides a foundation for future investigations of the neuroscience of limb selection.

57
REFERENCES Andersson JLR, Jenkinson M, and Smith SM (2007) Non-linear optimization. FMRIB technical report TR07JA1. Andersson JLR, Jenkinson M, and Smith SM. (2007) Non-linear registration, aka Spatial normalisation FMRIB technical report TR07JA2. Baizer JS, Kralj-Hans I, and Glickstein M (1999) Cerebellar Lesions and Prism Adaptation in Macaque Monkeys. J Neurophysiology 81: 1960-1965. Batista A. and Anderson R (2001) The Parietal Reach Region Codes the Next Planned Movement in a Sequential Reach Task. J Neurophysiology 85: 539-544. Beckmann C, Jenkinson M, and Smith SM (2003) General multi-level linear modelling for group analysis in FMRI. NeuroImage 20: 1052-1063. Beckmann CF and Smith SM (2004) Probabilistic Independent Component Analysis for Functional Magnetic Resonance Imaging. IEEE Trans. on Medical Imaging 23(2): 137-152. Beurze SM, de Lange FP, Toni I., and Medendorp WP (2007) Integration of Target and Effector Information in the Human Brain During Reach Planning. J Neurophysiology 97: 188-199. Beurze SM, de Lange FP, Toni I, and Medendorp WP (2009) Spatial and Effector Processing in the Human Parietofrontal Network for Reaches and Saccades. J Neurophysiology 101: 3053- 3062. Bernier PM, Cieslak M, and Grafton ST (2012) Effector selection precedes reach planning in the dorsal parietofrontal cortex. J Neurophysiology 108: 57-68. Chang SWC and Snyder LH (2012) The Representations of Reach Endpoints in Posterior Parietal Cortex Depend On Which Hand Does the Reaching. J Neurophysiology 107(9): 2352-65. Chib VS, Rangel A, Shimojo S, and O’Doherty JP (2009) Evidence for a Common Representation of Decision Values for Dissimilar Goods in Human Ventromedial Prefrontal Cortex. J Neuroscience 29(39): 12315–20. Churchland AK, Roozbeh K, and Shadlen MN (2008) Decision-making with multiple alternatives. Nature Neuroscience 11: 693-702. Cisek P and Kalaska JF (2005) Neural correlates of reaching decisions in dorsal premotor cortex: specification of multiple direction choices and final selection of action. Neuron 45: 801-14. Cisek, P (2006) Integrated Neural Processes for Defining Potential Actions and Deciding between Them: A Computational Model. J Neuroscience 26: 9761-9770. Cisek P and Kalaska JF (2010) Neural Mechanisms for Interacting with a World Full of Action Choices. Annual Review of Neuroscience 33: 269-298. Cohen, RG and Rosenbaum, DA (2004) Where objects are grasped reveals how grasps are planned: Generation and recall of motor plans. Experimental Brain Research 157: 486-495. Connolly J, Anderson R, Goodale MA (2003) FMRI evidence for a ‘parietal reach region’ in the human brain. Experimental Brain Research 153: 140-145. Cooper JC and Knutson B (2008) Valence and salience contribute to nucleus accumbens activation. NeuroImage 39: 538-547. Croxson PL, Walton ME, O’Reilly JX, Behrens TEJ, and Rushworth MFS (2009) Effort-Based Cost–Benefit Valuation and the Human Brain. J Neuroscience 29(14): 4531-4541. Dancause N and Schieber M (2010) The impact of head direction on lateralized choices of target and hand. Experimental Brain Research 201: 821-835. Daw N, O'Doherty JP, Dayan P, Seymour B, and Dolan RJ (2006) Cortical Substrates for exploratory decisions in humans. Nature 441: 876-879.

58
Fellows, LK (2006) Deciding how to decide: ventromedial frontal lobe damage affects information acquisition in multiattribute decision making. Brain 129: 944–952. Fisher NI (1993) Statistical analysis of circular data. Cambridge, UK: University Press. Frank MJ, Seeberger LC, and O’Reilly RC (2004) By Carrot or by Stick: Cognitive Reinforcement Learning in Parkinsonism. Science 306: 1940-1943. Gabbard, C and Helbig, C (2004) What drives children’s limb selection for reaching in hemispace? Experimental Brain Research 156: 325-332. Garcia-Perez MA (1998) Forced-choice staircases with fixed step sizes: asymptotic and small- sample properties. Vision Research 38: 1861-1881. Gardiner J, Franco V, and Schieber MH (2006) Interaction between lateralized choices of hand and target. Experimental Brain Research 170: 149-159. Gauthier LV, Taub E, Perkins C, Ortmann M, Mark VW, and Uswatte G (2008) Remodeling the Brain Plastic Structural Brain Changes Produced by Different Motor Therapies After Stroke. Stroke 39: 1520-25. Gershman S.J., Pesaran B., and Daw N. (2009). Human Reinforcement Learning Subdivides Structured. Action Spaces by Learning Effector-Specific Values. J Neuroscience 29:13524- 31. Grinband J, Savitskaya J, Wager TD, Teichert T, Ferrera VP, and Hirsch J (2011). The dorsal medial frontal cortex is sensitive to time on task, not response conflict or error likelihood. Neuroimage 57(2): 303-311. Hadland KA, Rushworth MFS, Passingham RE, Jahanshahi M, and Rothwell JC (2001). Dissociating response selection and conflict in the medial frontal surface. Neuroimage 29: 446-451. Haggard P (2008). Human volition: towards a neuroscience of will. Nature Reviews 9: 934-946. Han CE, Arbib MA, and Schweighofer N (2008) Stroke Rehabilitation Reaches a Threshold. PLoS Computational Biology 4(8). Hare TA, Schultz W, Camerer CF, O'Doherty JP, Rangel A (2011) Transformation of stimulus value signals into motor commands during simple choice. PNAS 108(44): 18120-5. Horowitz GD and Newsome WT (1999) Separate Signals for Target Selection and Movement Specification in the Superior Colliculus. Science 284: 1158 -1161. Hoshi E and Tanji J (2000) Integration of target and body-part information in the premotor cortex when planning action. Nature 408: 466-470. Huk AC and Shadlen MN (2005). Neural acitivity in macaque parietal cortex reflects temporal integration of visual motion signals during perceptual decision making. J Neuroscience 25: 10420-36. The Internet Stroke Center. Stroke Staistics: U.S. Statistics, <http://www.strokecenter.org/patients/stats.htm>. Izquierdo A, Suda RK, and Murray EA (2004) Bilateral orbitalprefrontal cortex lesions in rhesus monkeys disrupt choices guided by both reward value and reward contingency. J Neuroscience 24: 7540–7548. Jenkinson M and Smith SM (2001) A Global Optimization Method for Robust Affine Registration of Brain Images. Medical Image Analysis 5(2): 143-156. Jenkinson M, Bannister P, Brady M and Smith S (2002). Improved Optimization for the Robust and Accurate Linear Registration and Motion Correction of Brain Images. NeuroImage 17(2): 825-841.

59
Johansson RS, Theorin A, Westling G, Andersson M, Ohki Y, and Nyberg L (2006) How a lateralized brain supports symmetrical bimanual tasks. PLoS Biology 4: 1025-1034. Kaelbling LP, Littman ML, and Moore AW (1996) Reinforcement Learning: A Survey. Journal of Artifical Intelligence Research 4: 237-285. Kennerly SW and Walton ME (2011) Decision Making and Reward in Frontal Cortex: Complementary Evidence. Behavioral Neuroscience 125(3): 297-317. From Neurophysiological and Neuropsychological Studies Kim JH, Lee JM, Jo HJ, Kim SH, Lee JH, Kim ST, Seo SW, Cox RW, Na DL, Kim SI, and Saad ZS (2009) Definine function SMA and pre-SMA subregions in human MFC using resting state fMRI: Functional connectivity-based parcellation method. NeuroImage 49: 2375-2386 Koch K, Schachtzabel C, and Wagner G (2008) The neural correlates of reward-related trial-and- error learning: An fMRI study with a probabilistic learning task. Learning Memory 85: 728- 778. Küper M, Dimitrova A, Thürling M, Maderwald S, Roths J, Elles HG, Gizewski ER, Ladd ME, Diedrichsen J, and Timmann D (2010) Evidence for a motor and a non-motor domain in the human dentate nucleus--an fMRI study. Neuroimage 54(4): 2612-22. Lau HC, Rogers RD, Ramnani N, and Passingham RE (2004). Willed action and attention to the selection of action. NeuroImage 21: 1407-1415. Lau H, Rogers R, and Passingham RE (2005) Dissociating response selection and conflict in the medial frontal surface. Neuroimage 29: 446-451. Lee D and Schieber M (2006) Serial correlation in lateralized choices of hand and target. Experimental Brain Research 174: 499-509. Lim SL, O'Doherty JP, and Rangel A (2011) The decision value computations in the vmPFC and striatum use a relative value code that is guided by visual attention. J Neuroscience 31(37): 13214-23. Manto M, Bower JM, Conforto AB, Delgado-García JM, da Guarda SN, Gerwig M, Habas C, Hagura N, Ivry RB, Mariën P, Molinari M, Naito E, Nowak DA, Oulad Ben Taib N, Pelisson D, Tesche CD, Tilikete C, and Timmann D (2012) Consensus paper: roles of the cerebellum in motor control--the diversity of ideas on cerebellar involvement in movement. Cerebellum 11(2): 457-87. Martin TA, Keating JG, Goodkin HP, Bastian AJ, and Thach WT (1996) Throwing while looking through prisms. I. Focal olivo-cerebellar lesions impair adaptation. Brain 119: 1183- 1198. Medendorp P, Goltz H, Crawford JD, and Villis T (2005) Integration of target and effector information in human posterior parietal cortex for the planning of action. J Neurophysiology 93: 954-962. Merians AS, Jack D, Boian R, Tremaine M, Burdea GC, Adamovich SV, Recce M, and Poizner H (2002) Virtual Reality–Augmented Rehabilitation for Patients Following Stroke. Physical Therapy 82: 898-915. O’Doherty J, Critchley H, Deichmann R, and Dolan RJ (2003) Dissociating valence of outcome from behavioral control in human orbital and ventral prefrontal cortices. J Neuroscience 23: 7931-7939. O’Doherty JP, Dayan P, Friston K, Critchley H, and Dolan R (2003) Temporal Difference Models and Reward-Related Learning in the Human Brain. Neuroimage 28: 329–337.

60
O'Doherty J (2004) Reward representations and reward-related learning in the human brain: insights from human neuroimaging. Current Opinion in Neurobiology 14: 769-76. Oliveira FTP, Diedrichsen J, Verstynen T, Duque J, and Ivry R (2010) Transcranial magnetic stimulation of posterior parietal cortex affects decisions of hand choice. PNAS 107(41): 17751-6. Oujamaaa L, Relavea I, Frogera J, Mottet D, and Pelissiera JY (2009) Rehabilitation of arm function after stroke. Literature review. Ann Phys Rehabil Med 52(3): 269-93. Persaran B, Nelson M, and Andersen R (2008) Free choice activates a decision circuit between frontal and parietal cortex. Nature 453: 406-409. Piron L, Turolla A, Agostini M, Zucconi CS, Ventura L, Tonin P, and Dam M (2010) Motor Learning Principles for Rehabilitation: A Pilot Randomized Controlled Study in Poststroke Patients. Neurorehabil Neural Repair 24: 501-508. Przybyla A, Haaland KY, Bagesteiro LB, and Sainburg RL (2011) Motor asymmetry reduction in older adults. Neuroscience Letters 489(2): 99-104. Ramachandran (2009) The use of visual feedback in restoring brain function. Brain 132: 1693– 1710. Richter S, Dimitrova A, Maschke M, Gizewski E, Beck A, Aurich V, and Timmann D (2004) Degree of Cerebellar Ataxia Correlates with Three-Dimensional MRI-Based Cerebellar Volume in Pure Cerebellar Degeneration. Eur Neurol 54(1): 23-7. Rutledge RB, Lazzaro SC, Lau B, Myers C, Gluck MA, and Glimcher PW (2009) Dopaminergic Drugs Modulate Learning Rates and Perseveration in Parkinson’s Patients in a Dynamic Foraging Task. J Neuroscience 29(48): 15104 –15114. Rosenbaum DA, Slotta JD, Vaughan J, and Plamondon R (1991) Optimal Movement Selection. Psychological Science 2(2): 86-91. Rudebeck PH, Walton ME, Smyth AN, Bannerman DM, and Rushworth MFS (2006) Separate neural pathways process different decision costs. Nature Neuroscience 9: 1161-1168. Sainburg RL and Kalakanis D (2000) Differences in control of limb dynamics during dominant and non-dominant arm reaching. J Neurophysiology 83: 2661-75. Schieber MH (2000) Inactivation of the ventral premotor cortex biases the laterality of motoric choices. Experimental Brain Research 130: 497-507. Seo H, Barraclough DJ, and Lee D (2009) Lateral intraparietal cortex and reinforcement learning during a mixed-strategy game. J Neuroscience 29: 7278-89. Seymour B, O’Doherty JP, Dayan P, Koltzenburg M, Jones A, Dolan R, Friston K, and Frackowiak RS (2004) Temporal difference models describe higher-order learning in humans. Letters to Nature 429: 664-667. Seymour B, Daw N, Dayan P, Singer T, and Dolan R (2007) Differential Encoding of Losses and Gains in the Human Striatum. J Neuroscience 27: 4826-2831. Schultz W, Dayan P, Montague PR (1997). A Neural Substrate of Prediction and Reward. Science 275: 1593-1599 Sirigu A, Daprati E, Ciancia S, Girauz P, Nighoshossian N, Posada A, and Haggard P (2004) Altered awareness of voluntary action after damage to the parietal cortex. Nature Neuroscience 7: 80-84. Smith S (2002) Fast Robust Automated Brain Extraction. Human Brain Mapping 17(3): 143-155. Spencer RMC and Ivry RB (2009) Sequence learning is preserved in individuals with cerebellar degeneration when the movements are directly cued. J Cognitive Neuroscience 21(7): 1302- 1310.

61
Sterr A, Freivogel S, and Schmalohr D (2002) Neurobehavioral Aspects of Recovery: Assessment of the Learned Nonuse Phenomenon in Hemiparetic Adolescents. Arch Phys Med Rehabil 83: 1726-1731. Stoloff RH, Xu J, Taylor JA, Ridderikoff A, and Ivry RB (2011) Effect of recent reinforcement history on hand choice in an unconstrained reaching task. Frontiers in Decision Neuroscience: The Neurobiology of Choice 5(41). Sunderland A and Tuke A (2005) Neuroplasticity, learning and recovery after stroke: a critical evaluation of constraint-induced therapy. Neuropsychol Rehabil 15(2): 81-96. Sugrue LP, Corrado GS, and Newsome WT (2004) Matching behavior and the representation of value in the parietal cortex. Science 304: 1782-1787. Sutton RS and Barto AG (1998). Reinforcement learning. Cambridge, MA: MIT. Taub E (1980) “Somatosensory deafferentation research with monkeys: implications for rehabilitation medicine” in Behavioral Psychology in Rehabilitation Medicine: Clinical Applications. ed. L. P. Ince (New York, NY: Williams & Wilkins), 371-401. Taub E, Miller NE, Novack TA, Cook EW 3rd, Fleming WC, Nepomuceno CS, Connell JS, Crago JE (1993) Technique to improve chronic motor deficit after stroke. Arch Phys Med Rehabil 74: 347-354. Taylor JA, Klemfuss NM, and Ivry RB (2010) An explicit strategy prevails when the cerebellum fails to compute movement errors. Cerebellum 9: 580-586. Thoma P, Bellebaum C, Koch B, Schwarz M, and Daum I (2008) The Cerebellum Is Involved in Reward-based Reversal Learning. Cerebellum 7: 433–443. Tosoni A, Galati G, Romani GL, and Corbetta M (2008) Sensory-motor mechanisms in human parietal cortex underlie arbitrary visual decisions. Nature Neuroscience 11: 8646-8653. Trommershauser J, Maloney LT, and Landy MS (2008) Decision making, movement planning and statistical decision theory. Trends in Cognitive Sciences 12(8): 291-297. Van der Wel RP and Rosenbaum, DA (2010) Bimanual grasp planning reflects changing rather than fixed constraint dominance. Experimental Brain Research 205: 351-362. Wallis JD (2007) Orbitofrontal cortex and its contribution to decision-making. Annual Review of Neuroscience 30:31-56. Wallis JD and Kennerley SW (2011) Contrasting reward signals in the orbitofrontal cortex and anterior cingulate cortex. Ann NY Acad Sci 1239: 33–42. Watkins CJ and Dayan P (1992) Q-learning. Machine Learning 8: 279-292. Wolf SL, Winstein CJ, Miller JP, Taub E, Uswatte G, Morris D, Giuliani C, Light KE, Nichols- Larsen D; EXCITE Investigators (2006) Effect of constraint-induced movement therapy on upper extremity function 3 to 9 months after stroke: the EXCITE randomized clinical trial. JAMA 296: 2095-2104. Wolf SL (2007) Revisiting constraint-induced movement therapy: are we too smitten with the mitten? Is all nonuse "learned"? and other quandaries. Physical Therapy 87: 1212-1223. Woolrich MW, Ripley BD, Brady JM and Smith SM (2001) Temporal Autocorrelation in Univariate Linear Modelling of FMRI Data. NeuroImage 14(6): 1370-1386. Woolrich MW, Behrens TEJ, Beckmann CF, Jenkinson M and Smith SM (2004) Multi-level linear modelling for FMRI group analysis using Bayesian inference. NeuroImage 21(4): 1732-1747. Woolrich MW (2008) Robust Group Analysis Using Outlier Inference. NeuroImage 41(2): 286- 301.


![INDEX.* [digitalassets.lib.berkeley.edu]digitalassets.lib.berkeley.edu/anthpubs/ucb/text/ucp008-009.pdf · Keruk, 277, 283, 294, 311, 336, 337, 358. Kimul Chehenish, 103. Kish, 102,](https://img.dokumen.tips/doc/110x75/5cc16c2188c99315158c0e6a/index-keruk-277-283-294-311-336-337-358-kimul-chehenish-103.jpg)


![B&M HANDELMAN INVESTMENTS LIMITED, E. MANSON …...court file no. cv-18-593698-00cl ontario superior court of justice [commercial list] b e t w e e n: b&m handelman investments limited,](https://img.dokumen.tips/doc/110x75/5fbcddad80823120d02209c4/bm-handelman-investments-limited-e-manson-court-file-no-cv-18-593698-00cl.jpg)