Embed Size (px)
Citation preview

The Need for One Single Transport Model to Simulate Dispersion from Roadways and Tunnel Portals in Australia and New Zealand Joint CASANZ SIG and NZ Transport Agency Workshop
New Directions in Managing Transport-Related Air Quality in NZ 11 December, 2014
Jennifer Barclay
December 11, 2014

Introduction
Why Conduct Air Quality Modelling for Transport
What we do in AU and NZ
Line Source Gaussian Models and Problems
Problems with our current choice of model
Tunnels
One model for all transport
Page 2 December, 11, 2014

Why Conduct Air Quality Modelling
Page 3 January 19, 2015
receptors are inexpensive
not restricted to a few measurement points
Evaluate the influence of geophysical factors at each point due to
terrain elevation
presence of water bodies
urbanization
variations in surface conditions/land use
“Numerical laboratory”
conduct experiments that would be cost prohibitive in the real world
evaluate rare events for planning purposes
accidental releases
worst case scenario evaluation

Why Conduct Air Quality Modelling
Page 4 January 19, 2015
Modelling can be used to evaluate impacts of future/proposed sources
it can be used to conduct detailed source contribution analyses
it can be used as an Air quality tracking tool, and/or part of a regulatory
permitting program
it can be used for source mitigation and control scenario evaluation
engineering design
cost-benefit analysis
it can be used Real-time or in forecast mode as an operational emissions
control tool

1/19/2015 Page 5
What We Do in AU and NZ
- We use multiple models which appear to be randomly applied
• Roadways - Mix of steady state Gaussian models - AUSROADS, CALINE4,
AERMOD, ADMS and non-steady state models - CALPUFF
• Tunnel Portals – Seldom modelled. Or when modelled AUSROADS or CALINE4 are
applied. Portal plume length is sometimes estimated using Ginzburg and Schattanek
(1997).
• Vent Stacks – AERMOD, AUSPLUME, CALPUFF
- No consistent approach to the use of models for transport applications.
- The use of multiple models is problematic
- Time-consuming – leads to errors as work is doubled
- Difficult to understand or explain any one model result
- Difficult to compute a cumulative effect
- Lack of consistency between the models

1/19/2015 Page 6
What We Do in AU and NZ
- Lack of understanding by consultants and EPA of model limitations and assumptions
- Further, none of these models are designed to model dispersion involving the special features of tunnels, portals, or sunken roadways, vertical walls, vehicle induced turbulence and the turbulent effect of a jet of contaminated air exiting a tunnel

1/19/2015 Page 7
Line Source Gaussian Models - CALINE4
Of the line source models used for Roadways, CALINE4 is the most
advanced
- Developed by CA Dept of Transportation
• Gaussian diffusion equation and employs a mixing zone concept to characterize
pollutant dispersion over the roadway
• Given source strength, meteorology and site geometry can predict at receptors within
500m of source
• Predict inert pollutants CO and NO2 and suspended particle concentrations
• Special options for modelling near intersections, street canyons and parking facilities
CALINE 4 is considered an extremely easy model to implement. Optional inputs can be
bypassed or worst case values assumed.
CALINE4 has come a long way from its predecessor, CALINE2, which due to is gross
over predictions (esp. for stable parallel wind case) prevented highway projects from
moving ahead. Key changes included
- The ability to specify line source strength
- Ability to use roughness length
.

1/19/2015 Page 8 1/19/2015 Page 8
CALINE4, AUSROADS
- steady-state Gaussian-plume dispersion models
- Inverse wind speed dependency hence cannot manage calms and light wind scenarios
- No memory of previous hours emissions
- Straight line plumes
- Cannot handle terrain or building structures
- Overestimate roadway concentrations, esp. under light winds parallel to the source
- For tunnels. The inability to model the jet effect combined with the ambient changing wind directions on the position of the dominant plume means they tend to grossly over predict tunnel portal emissions.
Problems With Line Source Gaussian Models

1/19/2015 Page 9
Gaussian Plume models (AERMOD, CALROADS, AUSROADS) are very sensitive to Land Use
1/19/2015 Page 10
There is this assumption that …………….
More complex approaches to dispersion modelling are unnecessary for most applications because of the uncertainties in estimating emission factors and traffic volumes for future years.
It is widely felt that the simple model’s (CALINE4's) accuracy is well balanced with the accuracy of state of the art predictive models for emissions and traffic.
Conservatism is good, but …………in an airshed that is fast filling up, these models are too conservative and too inaccurate.
Problems with Line Source Gaussian Models

1/19/2015 Page 11 1/19/2015 Page 11
One Model for Air Quality Transport
A regulatory air quality transportation model for roads, vents and tunnel portals
must be sensitive to the following
- Building downwash
- Ability to account for terrain
- Ability to handle low wind speeds
- Ability to use a full year of varying meteorological data without compromising CPU time or model capabilities

1/19/2015 Presentation Title Page 12

Tunnels
Australia and New Zealand have a small population of 23.1 and 4.7 compared to Europe.
Major tunnels and roadways are in cities, close to residential areas. Very different to Europe – hilly terrain, very long tunnels, both in cities and country.
No major tunnels in rural areas, Australia is mostly flat and due to NZ’s small size windy roads are the norm.
Tunnel Lengths
- New Zealand, 340m – 623m
- Australia - up to 9km (new North Connex motorway)
Page 13 January 19, 2015

In-Tunnel Ventilation System – AU and NZ
Mechanical Ventilation
- All major tunnels in AU and NZ for last 20 years are longitudinally ventilated
- Typical AU and NZ ventilation system comprises a ventilation station and stack at the exit of each of the tunnels, providing a separate ventilation system for each tunnel tube. Fresh air is drawn in at the entry to the tunnels, with the flow of air induced by the flow of traffic, and with the assistance from ceiling mounted fans.
- Fans within the tunnel and in the ventilation stations enable the air to be extracted through a ceiling mounted vent and then discharged through the ventilation stacks. The ventilation stacks house air quality sampling and monitoring equipment so that emissions into the local environment can be monitored.
Page 14 January 19, 2015

1/19/2015 Page 15
In-Tunnel Ventilation System – AU and NZ
Mechanical Ventilation
- Automatic control systems with oversight by a human operator act to ensure continuous ventilation at all times in all major Australian and New Zealand tunnels. These systems monitor air flows, traffic conditions and pollution levels, and adjust the ventilation rates to suit the prevailing conditions in the tunnel.
- Vent stacks are located at tunnel entrances or sometimes further away as in M5 East Stack which is 1km away
- Ventilation systems are meant to prevent portal emissions, but they do occur during tunnel maintenance procedures, vehicle breakdowns and v high congestion
Vent stacks are;
- highly controversial, very emotional public
Portal emissions
- mentioned in reports, but generally not modelled

1/19/2015 Page 16 1/19/2015 Page 16
Vents stacks are highly controversial, public were previously unaware of portal emissions, now knowledgeable

1/19/2015 Page 17
MM5 East Tunnel, Sydney
Works of art !
1/19/2015 Page 18
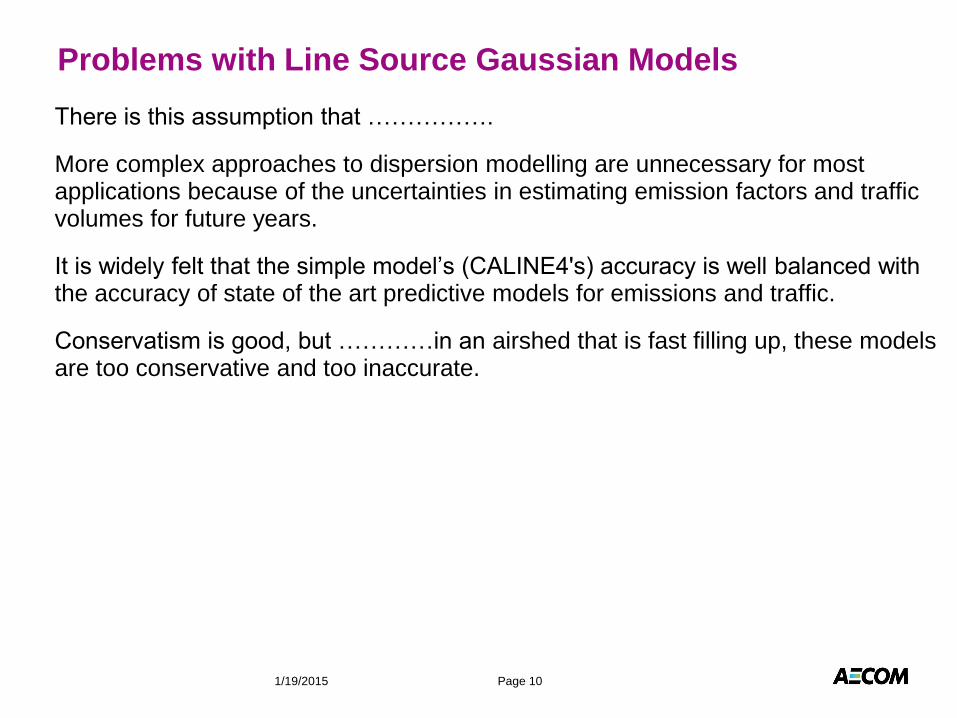
Waterview Tunnel Vent Stack - Auckland

1/19/2015 Page 19
The basis for the design calculation of the tunnel ventilation system capacity is based on the first year of tunnel opening. This is because emissions in year 1 will be higher than subsequent years as vehicle emissions improve faster than traffic growth rates. In Europe “As a result of the reduction in vehicle emissions with the introduction of stricter emissions standards, the stacks were eliminated from the design… The energy consumption of the ventilation was a strong driver in this decision process” Hafnerberg Tunnel in Zurich (circa 2008)
There is a desire in AU and NZ to reduce mechanical ventilation in favour of portal emissions due to high costs of maintaining and running ventilation systems plus the fact that vehicle emissions are reducing.
Ventilation System Capacity

1/19/2015 Page 20
Automated longitudinal tunnel ventilation systems, like that of the Lane Cove Tunnel require high on-going operational costs to ventilate in-tunnel air via above ground ventilation stacks. Longitudinally ventilated tunnels by design were made to self ventilate via the tunnel portals. Placement of the fans along the tunnel length along with the increased boost of air flow caused by the traffic piston effect can cause positive tunnel exit velocities in the region of 2 m/s or greater. The effect of the tunnel jet is to remove contaminants from within the tunnel via the tunnel portals into the portal zone which can extend as far as 300m from the portal exits. As long as contaminants, mostly CO, NO2 and PM are kept below the ambient NAQS within the tunnel portal zones then self ventilation is an attractive option as it helps reduces ongoing operational costs.
Ventilation System – Cost Savings

1/19/2015 Page 21
GRAL is an attractive model for roadways and tunnels
• GRAL was developed specifically to model tunnel portal emissions.
• GRAL is a Lagrangian Particle model developed by the Institute for Internal Combustion Engines and Thermodynamics, Technical University Graz, Austria (Oettl et al 2002, Oettl et al 2003, Oettl et al 2005). Of all the models used for portal emissions,
• GRAL has undergone extensive evaluations using SF6 as a tracer and wind tunnel experiments.
• GRAL is able to treat the momentum of the tunnel jet, the buoyancy effects due to the temperature difference between the jet stream and ambient air and the influence of the changing wind directions of the ambient flow on the position of the jet stream.
• Suitable for regulatory applications and can use a full year of meteorological data
GRAL Dispersion Model

1/19/2015 Page 22
• Model is undergoing continuous re-development. Not hampered by large control organisations such as the EPA
• Model is being developed by specialists in the field.
GRAL Dispersion Model

1/19/2015 Page 23

1/19/2015 Page 24 1/19/2015 Page 24
GRAL HISTORY

1/19/2015 Page 25

1/19/2015 Page 26
Evaluations

1/19/2015 Page 27

1/19/2015 Page 28

1/19/2015 Page 29

1/19/2015 Page 30
Kathrin Baumann-Stanzer, ZAMG. GRAL workshop, Austria, October 2014

1/19/2015 Page 31 1/19/2015 Page 31 1/19/2015 Page 31
Meteorology
Combination of 12km MM5 data into CALMET diagnostic meteorological model with 5 observation stations.
62 x 60km meteorological model domain at 250m resolution
Dispersion
Portal Emissions – GRAL, using Meteorological data from CALMET at tunnel entrance (wind direction, wind speed, atmospheric stability, exit velocity of the tunnel air, temperature difference between the tunnel air and ambient air and, stiffness of the column jet)
Example of Modelling of Portal Emissions Lane Cove
Tunnel, NSW
Model Inputs to GRAL for Lane Cove Tunnel
Tunnel Height (m) 5
Tunnel exit velocity (m/s) 2
Delta T (K) 1.5
Bi-directional or Uni-directional tunnel Uni-directional
Average Daily traffic 4000 vehicles per day

1/19/2015 Page 32
Figure 5. This plot shows isopleths of ground level concentrations of PM10 (assuming a unit emission rate) resulting from a full year simulation of meteorology at Lane Cove Tunnel’s west end portal. The plot represents the highest frequency of meteorological conditions in the year and represents NW winds of ~ 2.34 m/s and a stable atmosphere. The meteorological conditions fitting this scenario occur more than 5% in the year. Because the ambient flow opposes the tunnel jet the combination of these scenarios is to push the portal zone in the opposite direction to the tunnel jet

Thank You