Embed Size (px)
Citation preview
The need for generic policies as part of health reform
Richard Laing EMP/WHO
for Geneva
2013
2 • 2
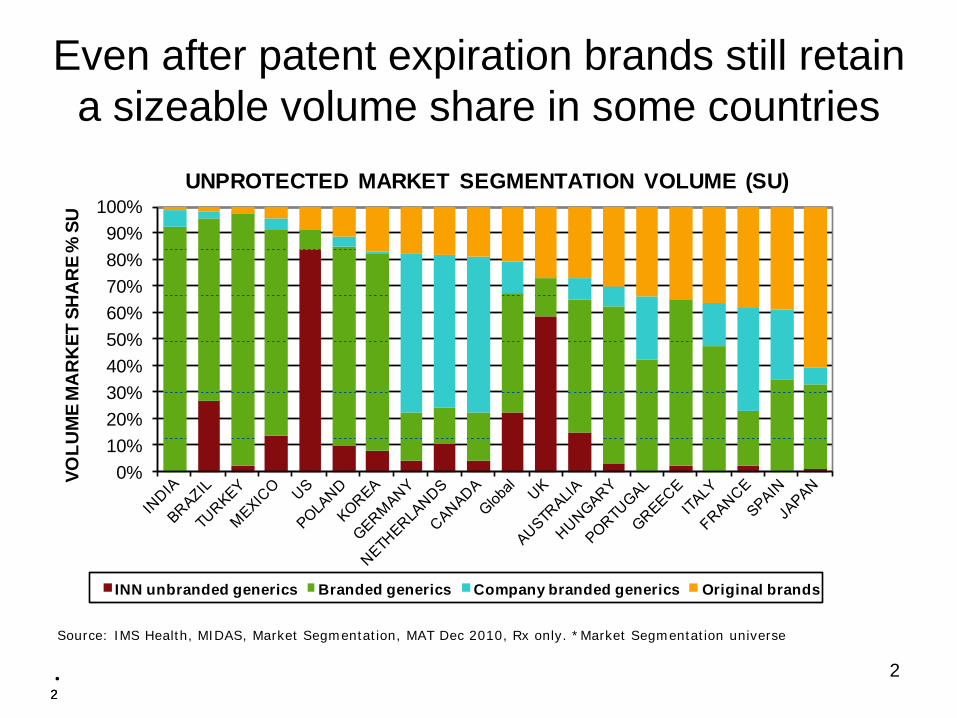
Even after patent expiration brands still retain a sizeable volume share in some countries
0%10%20%30%40%50%60%70%80%90%
100%
VOLU
ME
MA
RK
ET S
HA
RE
% S
U
UNPROTECTED MARKET SEGMENTATION VOLUME (SU)
INN unbranded generics Branded generics Company branded generics Original brands
2
Source: IMS Health, MIDAS, Market Segmentation, MAT Dec 2010, Rx only. *Market Segmentation universe

3
Total US generic market share has risen over each of the past 5 years Generic Share of Total Prescriptions • Generic prescription share reached 78%
in 2010 which was 4% higher than 2009 levels.
• This share gain is caused by a 3% gain in the available market for generics (81 to 84% in 2010) as well as a 1% gain in generic efficiency (93% vs. 92%).
• Most states allow pharmacists to substitute generics when available, others require a doctor’s direct instruction or restrict substitution for specific therapies where differences between brands and generics may impact patients.
• The broad availability of discounted generics is a further positive influence on efficiency.
X
Source: IMS Health, National Prescription Audit, Dec 2010
COMPARISON OF 2010 VERSUS 2009 SPENDING
Chart notes Prescriptions dispensed include retail pharmacies and longterm care facilities. Generic prescription share represents the percentage of unbranded and branded generic prescriptions dispensed annually. Generic availability is measured by evaluation of products at the form level that have a comparable generic available on the market in the time period. Generic efficiency is calculated based on the percentage of generic prescribing of the generically available market.

4
Source: IMD MIDAS, Dec 2010
X
Generic Share of Total Volume
Germany generic market dynamics
4

5
Source: IMD MIDAS, Dec 2010
X
Generic Share of Total Volume
Austria generic market dynamics
5

6
Source: IMD MIDAS, Dec 2010
X
Generic Share of Total Volume
Brazil generic market dynamics
6

7
Source: IMD MIDAS, Dec 2010
X
Generic Share of Total Volume
South Africa generic market dynamics
7

8
Brand Prescription Share of Molecule Post-Expiry
In US, Generics capture over 80% of a brand’s volume within 6 months
Source: IMS Health, National Prescription Audit, Dec 2010

9
Germany brand erosion after loss of exclusivity
Germany Brand Volume Share of Molecule Post-Expiry
Source: IMS MIDAS Monthly, Mar 2011. *2010 curve contains incomplete periods.
% S
HARE
OF
PRE-
EXPI
RY
MO
LECU
LE T
OTA
L SU
MONTHS SINCE PATENT EXPIRY
9
10
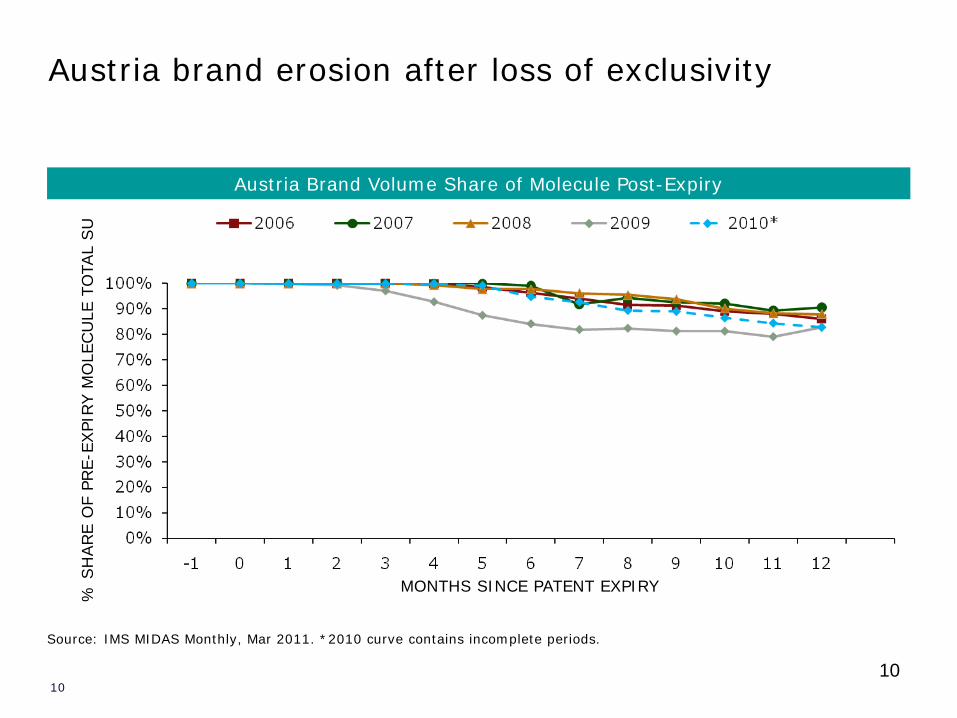
Austria brand erosion after loss of exclusivity
Austria Brand Volume Share of Molecule Post-Expiry
Source: IMS MIDAS Monthly, Mar 2011. *2010 curve contains incomplete periods.
% S
HARE
OF
PRE-
EXPI
RY
MO
LECU
LE T
OTA
L SU
MONTHS SINCE PATENT EXPIRY
10
11
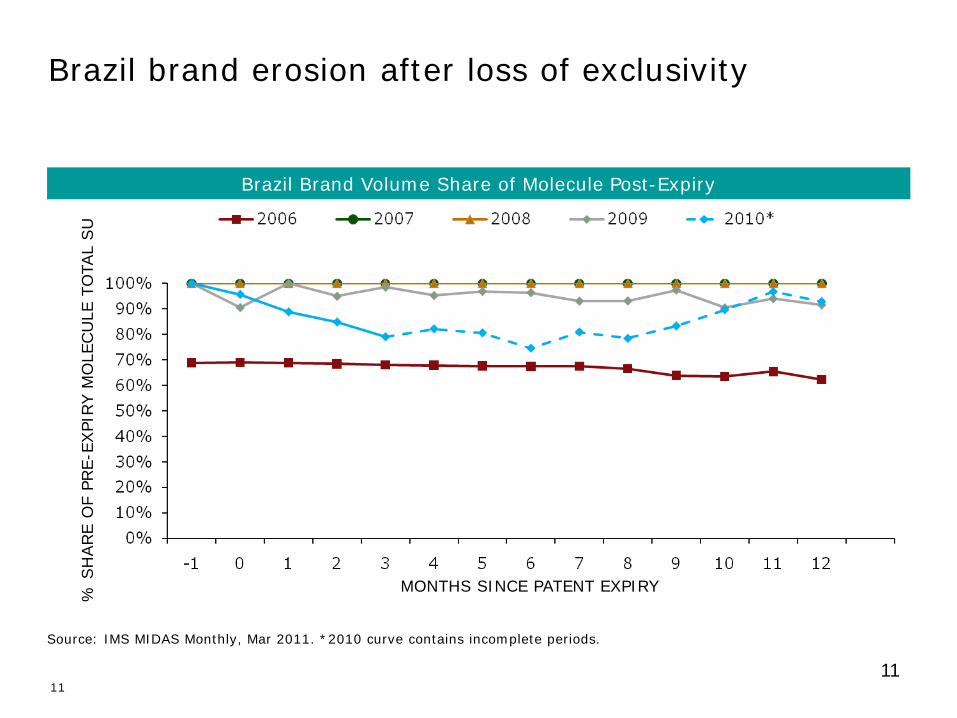
Brazil brand erosion after loss of exclusivity
Brazil Brand Volume Share of Molecule Post-Expiry
Source: IMS MIDAS Monthly, Mar 2011. *2010 curve contains incomplete periods.
% S
HARE
OF
PRE-
EXPI
RY
MO
LECU
LE T
OTA
L SU
MONTHS SINCE PATENT EXPIRY
11

12
S. Africa brand erosion after loss of exclusivity
S. Africa Brand Volume Share of Molecule Post-Expiry
Source: IMS MIDAS Monthly, Mar 2011. *2010 curve contains incomplete periods.
% S
HARE
OF
PRE-
EXPI
RY
MO
LECU
LE T
OTA
L SU
MONTHS SINCE PATENT EXPIRY
12

13
Total potential cost savings and average percentage savings that could be obtained from switching private sector consumption from originator brands to lowest-priced generics, for a limited basket of medicines
Country (n= number of medicines)
Total potential cost savings (2008 USD)
Average percentage
savings across individual
medicines* China, public hospitals (n=4) $86,492,276 65.1% Colombia (n=9) $3,229,092 88.7% Ecuador (n=12) $3,066,407 63.2% Indonesia (n=9) $6,405,597 84.2% Jordan (n=11) $887,262 55.9% Kuwait (n=6) $64,261 9.3% Lebanon (n=8) $4,397,432 67.5% Malaysia, private hospital and retail sectors (n=10) $7,419,942 67.2%
Source WHR 2010 Chapter 4

14
Conclusions • In all but high income countries out of pocket
payment is the most frequent form of payment for medicines
• When health insurance is introduced and covers medicines they need to have generic policies in place
• Where people have to pay out of pocket generic policies individuals can reduce costs by about 60% and this could make the difference between death or impoverishment and survival.

15
Components of a generics policy Prerequisite: Quality assurance recognized by
prescribers & patients
"Generics policies" is a broad term comprising a heterogeneous set of specific practices, including: – Fast track registration: abbreviated and less costly
registration procedure for generics, Bolar provision – Procurement of medicines under INN or generic name; – Encouraged or mandatory prescribing by generic
name; – Generic substitution by pharmacists; – Information and incentives for generic utilization to
prescribers, pharmacists and consumers; – Selective financing of generics in positive lists,
reference price systems, procurement by tendering, IPR policies.

16
But implementation may be difficult: Public advertisement, Guatemala, 2006 and 2010
"I have diabetes. If my medication fails, I could suffer a diabetic coma."
"I don't take chances. I only use originals"