Embed Size (px)
Citation preview

1
“It took millions of times more computing power to map the human genome than it did to land a man on the moon, and that’s only a fraction of what’s needed right now. The biggest challenge in biology is going to be computing.”
Dr. J. Craig VenterChairman of the BoardThe Institute for Genomic ResearchDec. 2001
The Need For Computing

1
Clusters : What and Why?What?• Collection of computers networked
together to perform a particular application in parallel
Why?• Scalability• Cost-effective

1
Role of Your Cluster Vendor
Expertise with cluster management• Allow you to concentrate on the complexities
of your models – not your computer system
Expertise with turnkey solutions• Open Source distribution• Proven compatibility with
life sciences applications
One-stop support

1
Trend to Clustered Supercomputers
Numbers Overwhelm Size

1
• High throughput screening runs involving multiple, repetitive sequence comparisons on vast amounts of data.
• Data or query can be partitioned and dispatched to nnodes of a cluster to gain direct n-fold speedup and gain in throughput.
• Even the most compute-intensive fine-grain applications (e.g., molecular chemistry) can be deployed on a cluster equipped with a high-performance interconnect fabric.
Clusters in the Life Sciences

1
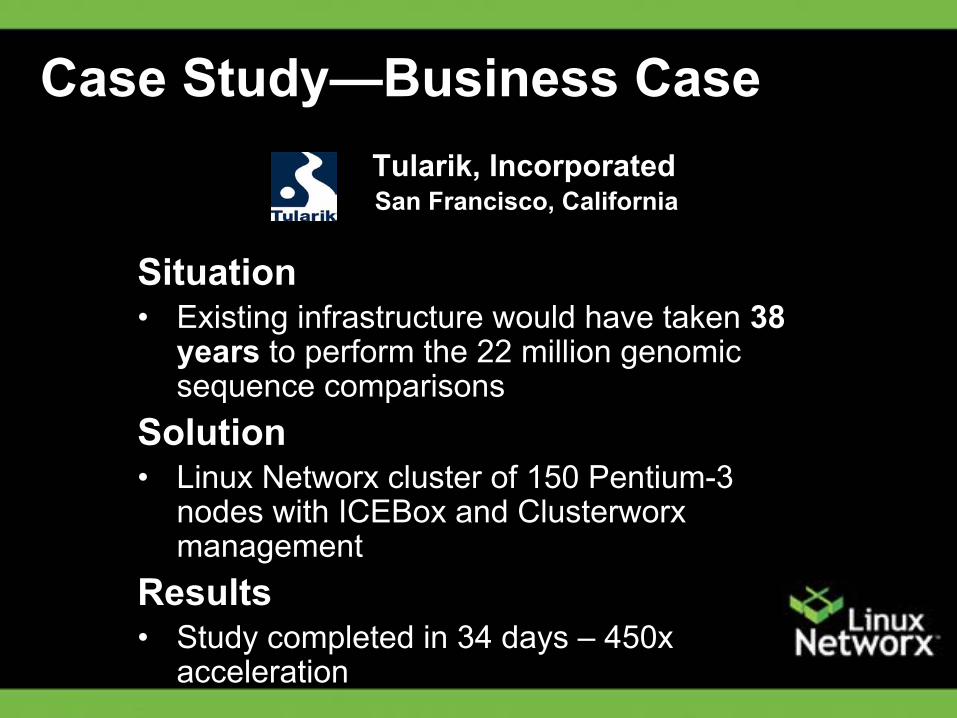
Situation• Existing infrastructure would have taken
38 years to perform the 22 million genomic sequence comparisons
Solution• Linux Networx cluster of 150 Pentium-3
nodes with ICEBox and Clusterworx management
Results• Study completed in 34 days – 450x
acceleration
Tularik, IncorporatedSan Francisco, California
Case Study—Business Case

1
“Cluster management tools from Linux Networx are setting the standard …. Without cluster management tools, we would be spending five times as long managing the cluster…. ICE tools allow us to concentrate on finding new genes that cause disease and not worry about cluster management”
- Gene CutlerTularik, Inc.
Tularik, IncorporatedSan Francisco, California
Case Study— Business Success

Terascale Linux Clusters: Supercomputing Solutions for the
Life Sciences
Dr. Padmanabhan Iyer, Linux Networx
Dr. Bruce Ling, Tularik

The Need For ComputingThe Need For Computing“It took millions of times more computing power to map the human genome than it did to land a man on the moon, and that’s only a fraction of what’s needed right now. The biggest challenge in biology is going to be computing.”
Dr. J. Craig VenterChairman of the BoardThe Institute for Genomic Research Dec. 2001

Clusters : What and Why?What?•Collection of computers networked together to perform a particular application in parallel
Why?•Scalability•Cost-effective

Expertise with cluster management• Allow you to concentrate on the complexities
of your models – not your computer system
Expertise with turnkey solutions• Open Source distribution• Proven compatibility with
life sciences applications
One-stop support
Role of Your Cluster Vendor

Trend to Clustered Supercomputers
Numbers Overwhelm Size

Clusters in the Life Sciences
• High throughput screening runs involving multiple, repetitive sequence comparisons on vast amounts of data.
• Data or query can be partitioned and dispatched to nnodes of a cluster to gain direct n-fold speedup and gain in throughput.
• Even the most compute-intensive fine-grain applications (e.g., molecular chemistry) can be deployed on a cluster equipped with a high-performance interconnect fabric.
Case Study—Business CaseTularik, IncorporatedSan Francisco, California
Situation• Existing infrastructure would have taken 38
years to perform the 22 million genomic sequence comparisons
Solution• Linux Networx cluster of 150 Pentium-3
nodes with ICEBox and Clusterworxmanagement
Results• Study completed in 34 days – 450x
acceleration

Case Study— Business SuccessTularik, IncorporatedSan Francisco, California
“Cluster management tools from Linux Networx are setting the standard …. Without cluster management tools, we would be spending five times as long managing the cluster…. ICE tools allow us to concentrate on finding new genes that cause disease and not worry about cluster management”
- Gene CutlerTularik, Inc.

Bruce Ling, Ph.DDirector, Bioinformatics

Discovery Platform – working around the clock
Tularik, Inc. Tularik, Inc. in S. San Francisco, CA- headquarter
Tularik Genomics DivisionTularik Genomics Division in Cold Spring Harbor, NY- Cancer gene discovery
Tularik Pharmaceutical CompanyTularik Pharmaceutical Company in S. San Francisco, CA- Metabolic disease drug discovery
Tularik GmbHTularik GmbH in Regensburg, Germany- Screening technology and HTS
Cumbre Inc.Cumbre Inc. in Dallas, TX- Anti-microbial drug discovery
Tularik Ltd.Tularik Ltd. in Macclesfield, United Kingdom- Computer-Aided Molecular Design (CAMD)
• Virtual screening


Tularik’s Drug Discovery Pipeline

Drug Discovery and Development Pipeline
ImmunologyImmunology
Metabolic diseaseMetabolic disease
Various tumor typesVarious tumor types
CancerCancer
INDCandidates
55
Clinical Testing
44
Drug Leads
2626
Drug Targets
8888ObesityObesity
DiabetesDiabetes
CMV CMV -- transplanttransplant
Immune disordersImmune disorders
InflammationInflammation
Lipid disordersLipid disorders

Public Domain Genome Projects

Bioinformatics Data Mining
Pattern Match

IssueComputing power deficit
Data Mining Bottleneck

Linux: THE way to go

• Approach: using batch queuing systems
• Key: effective management and exploitation of all available computing resources
High Throughput Computing
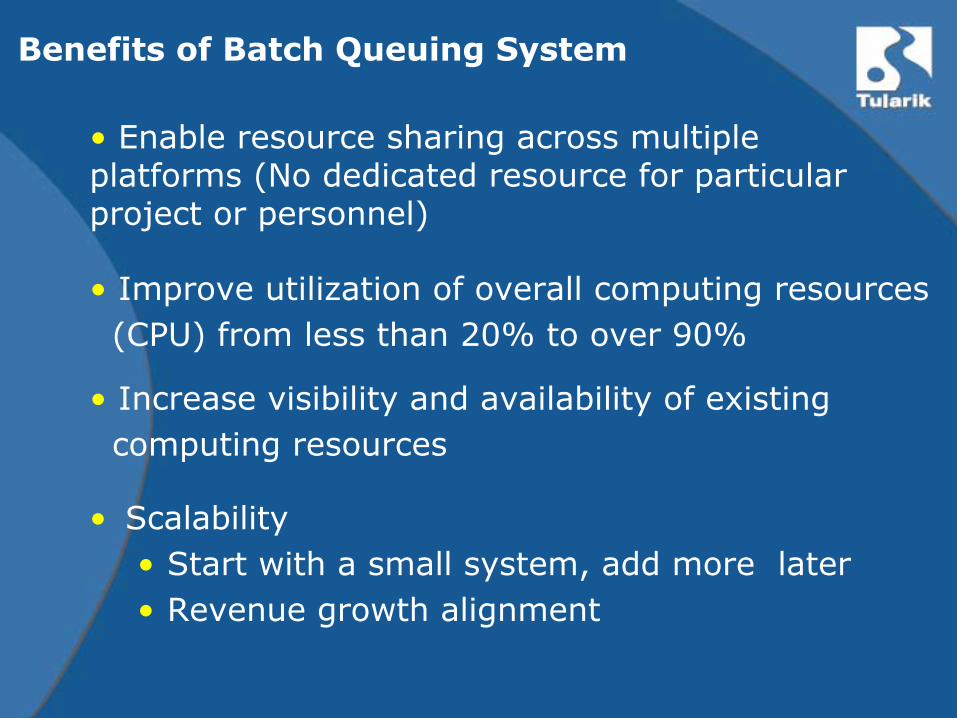
Benefits of Batch Queuing System
• Scalability• Start with a small system, add more later• Revenue growth alignment
• Enable resource sharing across multiple platforms (No dedicated resource for particular project or personnel)
• Improve utilization of overall computing resources (CPU) from less than 20% to over 90%
• Increase visibility and availability of existing computing resources

single node
Linux Cluster Supporting Data Mining

Old vs. New• Time taken to BLAST raw mouse genomic sequence read against
human genome database:
34 days38 yearsAll mouse genomic
sequence reads at NCBI
(22 million reads)
3 minutes15 hours1000 mouse sequences
10 seconds1 minute1 mouse sequence
Linux Cluster
(RedHat 7.1)
Darwin
(SGI Irix 6.5)
Note:Darwin is a heavily used machine, So it is not a machine to machine comparison-
However, it does accurately reflect the environment in which these computers are used.

Linux Cluster Dedicated to J2EE Discovery Architecture

Discovery Platform J2EE Application Cluster
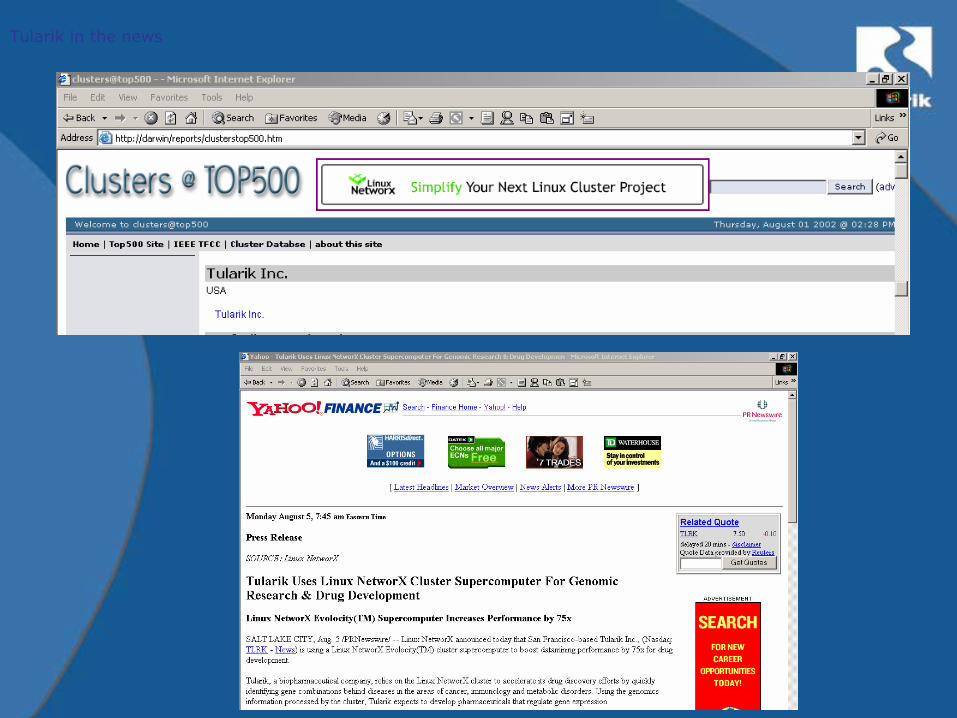
Tularik in the news


Celera HGSC (Ensembl) Celera
06-2000
07-2000
09-2000
10-2000
E-0.8.0
12-2000 E-1.0.0
04-2001 E-1.1.0
08-2001 E-1.2.0
12-2001
04-2002
R18, R19
R20, R21
R22, R23
R24
R25e
R25h
R26b
R26f
E-5.28
R25e
R25h
R26b
R26d
R26e
R26f, R26h
R26j
R26k
E-3.26
Assembly Curated genesRelease date
05-2000
08-2000
11-2000
01-2001
07-2001
01-2002
05-2002
10-2001
11-2001
06-2002
HGSC (UCSC)
06-2000
07-2000
09-2000
10-2000
12-2000
04-2001
08-2001
12-2001
04-2002
R26i
E-4.2803-2002


ENZYME Level 1
HYDROLASESLevel 2
GENE FUNCTIONROOT
TRANSFERASESLevel 2
SWISS-PROTsequences
mouse
TRANSFERASEsignature domains mouse
chicken
human
Human member A
Human member B
STRUCTURALPROTEINS RECEPTORS
ACCEPTED SEQUENCES
REJECTED SEQUENCES
Ontology EngineeringOntology Engineering


D IA N D atabase
Com
pute
r-A
ided
Hum
an C
urat
ion
M ap unto o ntolo gy
R epeat
C o rrect ass ig n m e nt
Inco rrect ass ig nm e nt
E volv ingC o ntro lled vo cab ulary
G B
S P
P DB
G P
U N IG EN E
V ocabular y-based m apping
D om ain-based m apping
K now ledge B ase
C ontro lled V ocabulary
D o m a in s
S W IS S -PR O T
A ss ig n m e nt D B

Ontological concept (Biological Process)
Use Ontology to Annotate MicroArray data

The Drug Discovery Pipeline
Biology Chemistry DevelopmentTarget ID Target Validation Screening Optimization Pre-clinical Clinical
Genomic Location
Expression
SNP
Function
Pathway
Structure
Cross-species homology
knockout
mutation
Compound binding Toxicity
Literature
Disease information

Target Identification

RequestPatent & competitors’ information arebadly needed for Tularik Genes of Interest
Tularik Legal

Introducing Commercial Patent Database In House

•Automatic Pipeline Architecture enables •Regular & automatic data analysis initiation •Proper Update
•Dynamically link to BLAST Application
•Dynamically link to other intellect property sites• Derwent.com• Nerac.com• Dialogweb.com
•Synthesize information from various resources into the genomic relational database and notify relevant decision makers
Tularik Genes of InterestAutomatic Intellectual Properties Retrieval

Micro-Array Bioinformatics

Chip Design: Tularik Genes of Interest

• 60 – 80 mer
• Uniqueness in the genome
• Optimal melting temperature
• No secondary structure
• Allow high throughput design
•Software package: Oligo-Jungle
Oligo Chip Design Algorithm Development

• Minimized distance from 3' end (<350 bases)
• Consideration of splice variants
one probe designed to recognize all splice variants for a gene
• Minimized cross-homology
Algorithm Design Concerns
Oligo Chip Design Algorithm Development

TMAX – Tularik Micro Array Explorer
Tularik Micro-array Data Storageand Analysis Software Suite

TMAX Welcome Page

TMAX Overview
• TMAX is Tularik’s in-house micro-array data storage and analysis software solution.
– Designed for the needs of biologists studying gene expression or genomic amplification/deletion.
– Flexible technology-independent design that handles data in in a variety of formats including Incyte, Affymetrix, Scanalyze, Genepix, Rosetta, Motorola, and simple spreadsheets.
– TMAX is comprised of 12 front-end applications plus a database server and several administrator support tools.
– Currently, TMAX contains about more than 14 million data points.

TMAX Overview
• Data Management -- Administration
• Add Experiment• Delete Experiment• Edit Experiment Annotation• Combine Experiments• Export Experiments
• Data Analysis / Visualization
• Experiment Summarizer• Basic Query• Complex Query• Chip-Viewer• Chip-Plotter• Chip-Cluster• Genome-Scan

TMAX Overview
• Administration
– Add Experiment• Upload data, sequence, and image files into the TMAX
database.
– Delete Experiment• Remove unwanted experiments from the database.
– Edit Experiment Annotation• Modify annotation for loaded experiments..
– Combine Experiments• Generate synthetic data sets by combining replicate
data sets.
– Export Experiments• Export loaded experiments for use with other software.

TMAX Overview
• Analysis– Experiment Summarizer
• Generate a quick summary of an experiment, including research notes; numbers of genes up-regulated, down-regulated and unchanged; top 5 up-regulated genes; top 5 down-regulated genes.
– Basic Query• Retrieve data across multiple experiments based on
signal intensity, fold change, quality score, gene name, and/or gene accession values.
– Complex Query (functional group analysis)• Retrieve data across multiple experiments by specifying
fold change criteria in individual conditions. Can do “fuzzy” matching.

TMAX Overview
• Visualization analysis
– Chip-Viewer• Display fluorescence image of micro-array and pick
spots to display corresponding data. Mainly for quality control.
– Chip-Plotter• Display scatter plots of fold change values for a
selected pair of experiments to quickly identify genes that are similarly or differentially modulated in different conditions.
– Chip-Cluster• Perform clustering of data across multiple experiments
so that patterns of change can be observed. Can choose between a variety of hierarchical and non-hierarchical algorithms.
– Genome-Scan• Plot fold change data from multiple experiments along
chromosomes using radiation-hybrid mapping data. Allows for quick identification of genomic regions that are amplified or deleted.

TMAX Add Experiment

TMAX Summarizer
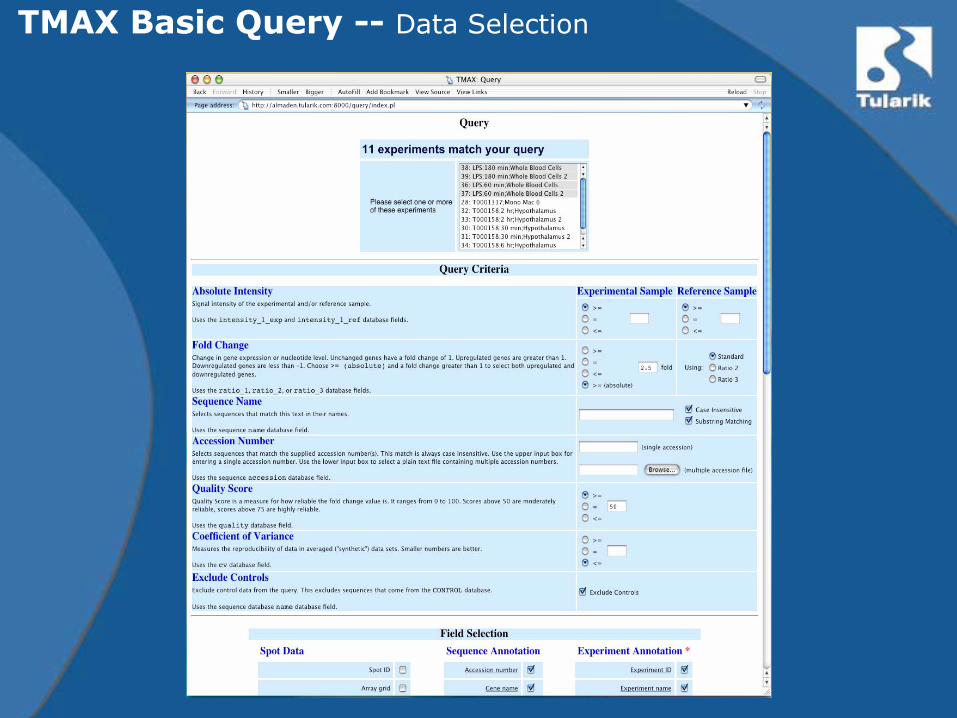
TMAX Basic Query -- Data Selection

TMAX Basic Query
Basic Query: Query Results• Results can also be downloaded as a spreadsheet for further processing

TMAX Complex Query
Complex Query: Data Selection• Select genes that have specific fold changes with different treatments• Can do “fuzzy matching” (e.g. up-regulated in 3 out of 4 conditions)

TMAX Complex Query
Complex Query: Query Results• Data can also be downloaded as a spreadsheet for further analysis
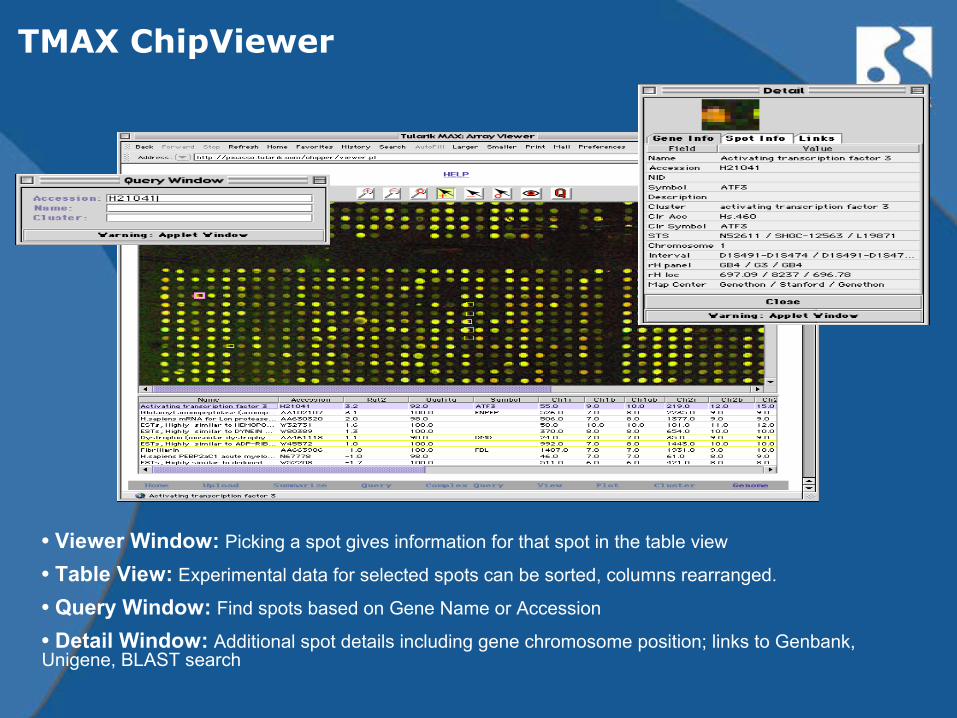
TMAX ChipViewer
• Viewer Window: Picking a spot gives information for that spot in the table view
• Table View: Experimental data for selected spots can be sorted, columns rearranged.
• Query Window: Find spots based on Gene Name or Accession
• Detail Window: Additional spot details including gene chromosome position; links to Genbank, Unigene, BLAST search

TMAX Chip-Plotter
Plotter: Results Display

TMAX ChipCluster
Cluster: Results Window• Each row represents a single gene across several experimental conditions.• The color of each box represents the fold change of one gene in one condition.

TMAX GenomeScan
• View Window: Each gene from each condition is plotted along the selected chromosome based on mapping data. Fold change is plotted on the Y-axis.
• Control Panel: Selects the chromosome to plot, the mapping panel to display, the quality cutoff score for data display and the scale of the Y-axis
• Gene Table: Displays additional data on the selected genes including experimental measurements, chromosome mapping information, and UniGene cluster information

Tularik’s lead discovery informatics
~80 to 90current targets
50+ different HTS assaysperformed annually
>950,000 compoundscreening library
• Proprietary & comprehensive screening database
• Information intensive lead discovery demands powerful informatics support

MicroArray
GenomeLegal
StructuralBiology
Virtual Screening
Chemistry
SAR
In vivo
HTS
Personnel
Clinical
• T-number database• Chemical characterization• Inventory
• Biological assays • CYP, solubility/permeability, cytotoxicity• PK
• Biological results from HTS• Equipment scheduling
• Pharmacology• Special PK experiments
Types of Data, Links

IT&S for Research
Acquisition
Storage
Reports
DataManagement
HTS
ADMET
SAR
MicroArray
Acquisition InventoryProcesses
Compounds
Assays
Identification Validation
Targets

HTS MicroarraysSAR ADMET
Automated Data Analyses
Assay Registration
On-line Data Management
Reporting (ISIS &Browsers)
Assays---ActivitiesLead Discovery and Follow-up
Experiments

Security Entities
Resource Entities Reports Entities
Operation Entities
Collaboration Entities
Chemistry Entities
Biology Entities
Administration Entities
Data Entities
Business Entities Modeling

Raw Data
Other Data
“Discovery Platform for Drug Discovery Data management”
Data Interpretation
e.g. “Screen Hits”
Data Automatic Upload
Presentation Logic Data Logic
Biology Process Logic
Data Analysis
Configuration
Chemistry Process Logic
Compound Priority
Data QA
Curve Fitting

single node
Dedicated Linux cluster Infrastructure
34 days38 yearsAll mouse genomic
sequence reads at NCBI
(22 million reads)
3 minutes15 hours1000 mouse sequences
10 seconds1 minute1 mouse sequence
Linux Cluster
(Red Hat 7.1)
Darwin
(SGI Irix 6.5)
Corporate Database
http://discovery.tularik.com
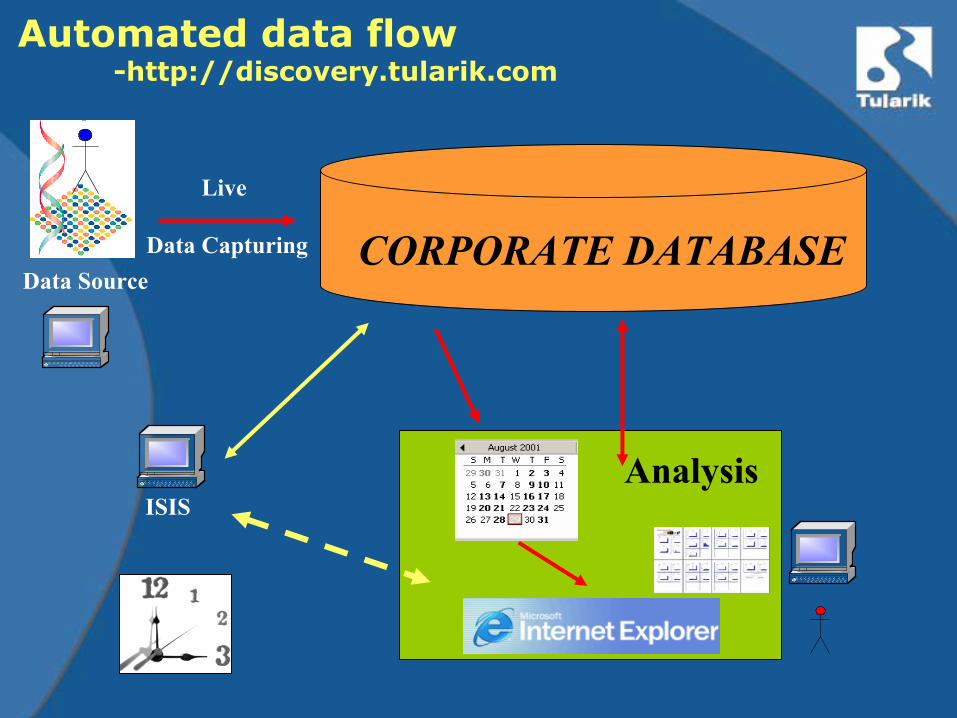
Automated data flow-http://discovery.tularik.com
Live
Data Capturing CORPORATE DATABASEData Source
ISISAnalysis

Discovery Platform– http://discovery.tularik.com
Web Server
Client
Reader
OracleServer
Fishnet
Security Server
Application ServerCluster
Data Central
Enterprise JAVA ArchitectureEnterprise J2EE Architecture
Web Server
OracleServer
Security Server
XML
Cluster
Rule Server
LDAP
Data Central
XML
Reader
XML Objects
XML Objects
Central Controller
XSLTTransformer
Client
JMS
Application Controller
Automated Data Flow
Live
Data Capturing CORPORATE DATABASEData Source
Visualization
Registration
Configuration
Data Analysis
ISIS
Discovery J2EE Architecture
J2EE•Extensible•Flexible•Reusable

Discovery Platform– http://discovery.tularik.com

Bruce Ling, Ph.DDirector, Bioinformatics