Embed Size (px)
Citation preview

1
Mega-StatesAn Analysis of Student Performance in the Five Most Heavily Populated States in the Nation
U.S. Department of EducationNCES 2013-450
CALIFORNIA
FLORIDA
ILLINOIS
NEW YORK
TEXAS

Contents
1 Why Focus on Mega-States?
8 Reading
14 Mathematics
20 Science
26 Technical Notes
NY
ILCA
FL
IL
NY
TX
FLORIDA
CALIFORNIA
TEXAS
ILLINOIS
NEW YORK
What Is The Nation’s Report CardTM? The Nation’s Report Card™ informs the public about the academic achievement of elementary and secondary students in the United States. Report cards communicate the findings of the National Assessment of Educational Progress (NAEP), a continuing and nationally representative measure of achievement in various subjects over time.
Since 1969, NAEP assessments have been conducted periodically in reading, mathematics, science, writing, U.S. history, civics, geography, and other subjects. NAEP collects and reports information on student performance at the national and state levels, making the assessment an integral part of our nation’s evaluation of the condition and progress of education. Only academic achievement data and related background information are collected. The privacy of individual students and their families is protected.
NAEP is a congressionally authorized project of the National Center for Education Statistics (NCES) within the Institute of Education Sciences of the U.S. Department of Education. The Commissioner of Education Statistics is responsible for carrying out the NAEP project. The National Assessment Governing Board oversees and sets policy for NAEP.
Photo Credits:
© Image Source/Getty Images #103060530; © Catherine Yeulet/iStockphoto #19549320; © 4X-image/iStockphoto #19751728; © Steve Debenport/ iStockphoto #21746504; © Maciej Toporowicz, NYC/Flickr Open/Getty Images #127987621; © Photodisc/Getty Images #RBRB_1479; © Fstop123/ iStockphoto #19529577; © Jon Stokes/Media Bakery #SPY0008768; © Media Bakery #GRM0004181; © Tom Oram/Media Bakery #AFS0401813; © Image Source #IS099M9MR; © Nadya Lukic/Getty Images #143918789; © Dwayne Brown/Media Bakery #BRN0004417; © Media Bakery #MKB0003749; © KidStock/Getty Images #138709883; © Christopher Futcher/iStockphoto #19262465

MEGA-STATES REPORT INTRODUCTION
WHY FOCUS ON MEGA-STATES?
California, Florida, Illinois, New York,
and Texas enroll close to 40 percent of
the nation’s public school students.
MEGA-STATES:
AN OVERVIEW
18.7 million students
2.9 million ELL students
Range of per-pupil
expenditures from
$8,562 (TX) to
$17,746 (NY)
The importance of these “Mega-States” goes beyond the sheer size of their population. They now serve more than half of the nation’s English language learners (ELL), as well as some of the largest concentrations of children from lower-income families. As policymakers and educators look at the nation’s changing demographics and
explore ways to close achievement gaps, the educational progress of children in these states is of interest far beyond their state borders. That’s why the National Center for Education Statistics and the National Assessment Governing Board focused this special report on educational outcomes in the five largest states.
--
SEE THE REPORT COME ALIVE ONLINE AT http://nationsreportcard.gov/megastates/.
1

INTRODUCTION THE NATION’S REPORT CARD
A snapshot of the Mega-States The Mega-States are home to nearly one-third of the nation’s public schools.
In 2010, there were about 49.5 million students in public schools nationwide, and close to 19 million of them attended schools in the Mega-States. Illinois educates over 2 million students, Florida and New York have more than 2.5 million students each, and California and Texas combined account for over 11 million students. By comparison, all other states have between 89,000 and 1.8 million students.
The Mega-States exemplify our nation’s changing demographics
The Mega-States are at the forefront of the demographic shifts in our nation. California, Texas,
New York, and Florida had the largest increases in the immigrant population over the last decade. Illinois had the sixth largest increase.1
1 Data from Center for Immigration Studies: http://www.cis.org/2000-2010-record-setting-decade-of-immigration, table 2.
Most of our nation’s ELL students are being educated in the Mega-States. California enrolls nearly 1.5 million ELL students—the largest number in the nation. That’s more than twice the amount of any other Mega-State.
More than one-third of all families below the poverty line live in the Mega-States. About 9 million families in the United States reported income below the poverty line in 2011; 3.4 million of them were in the Mega-States.2
2 Data from U.S. Census Bureau, 2011 American Community Survey: http://factfinder2.census.gov/faces/tableservices/jsf/pages/ productview.xhtml?pid=ACS_11_1YR_C17023&prodType=table.
Table 1. School and student characteristics for public elementary and secondary schools, by state/jurisdiction: Fiscal year 2009, school year 2009–10, and school year 2010–11
State/ jurisdiction
Number of operating schools
Number of students
Current expenditures
per pupil Student/
teacher ratio
Percentage of students
eligible for free or reduced- price school
lunch
Number of English language learners
United States 98,817 49,484,181 $10,591 16.0 48.0 5,208,247
California 10,124 6,289,578 9,503 24.1 53.8 1,467,989
Florida 4,131 2,643,347 8,867 15.1 56.0 260,202
Illinois 4,361 2,091,654 11,592 15.7 46.6 176,262
New York 4,757 2,734,955 17,746 12.9 47.8 237,634
Texas 8,732 4,935,715 8,562 14.7 50.0 726,823
NOTE: The results for current expenditures per pupil are based on fiscal year 2009, and the results for the number of English language learners are based on school year 2009–10. The other results shown in the table are based on school year 2010–11. SOURCE: U.S. Department of Education, National Center for Education Statistics, Common Core of Data (CCD), “Public Elementary/Secondary School Universe Survey,” 2010–11, Version 1a; and “State Nonfiscal Survey of Public Elementary/Secondary Education,” 2010–11, Version 1a; and “National Public Education Financial Survey,” FY09 (2008–09); and Consolidated State Performance Reports, 2009–10.
2

MEGA-STATES REPORT INTRODUCTION
Compared to the national average, California, Florida, and Texas all have higher percentages of students who are eligible for the National School Lunch Program (NSLP). New York is about the same as the national average, while Illinois is lower.
NAEP uses the percentages of students who are eligible for NSLP as a proxy for income. Students from lower-income families are eligible for either free or reduced-price school lunches, while students from higher-income families are not (see the Technical Notes for eligibility criteria).
Resources vary widely across the Mega-States
Although the five Mega-States share many common characteristics, they have important differences. For example, expenditures per pupil ranged from $8,562 in Texas to $17,746 in New York, while the national average is $10,591.
California has a student/teacher ratio of 24 students per teacher compared to the national average of 16 students per teacher. Florida, Illinois, New York, and Texas are below the national average.
Explore more about Mega-States online, including: • Achievement information and contextual data for reading, mathematics, science, and
all student groups
• Interactive tools that let you explore and compare achievement gains and gaps
• Demographic and classroom context data
To learn more, visit http://nationsreportcard.gov/megastates.
3
INTRODUCTION THE NATION’S REPORT CARD
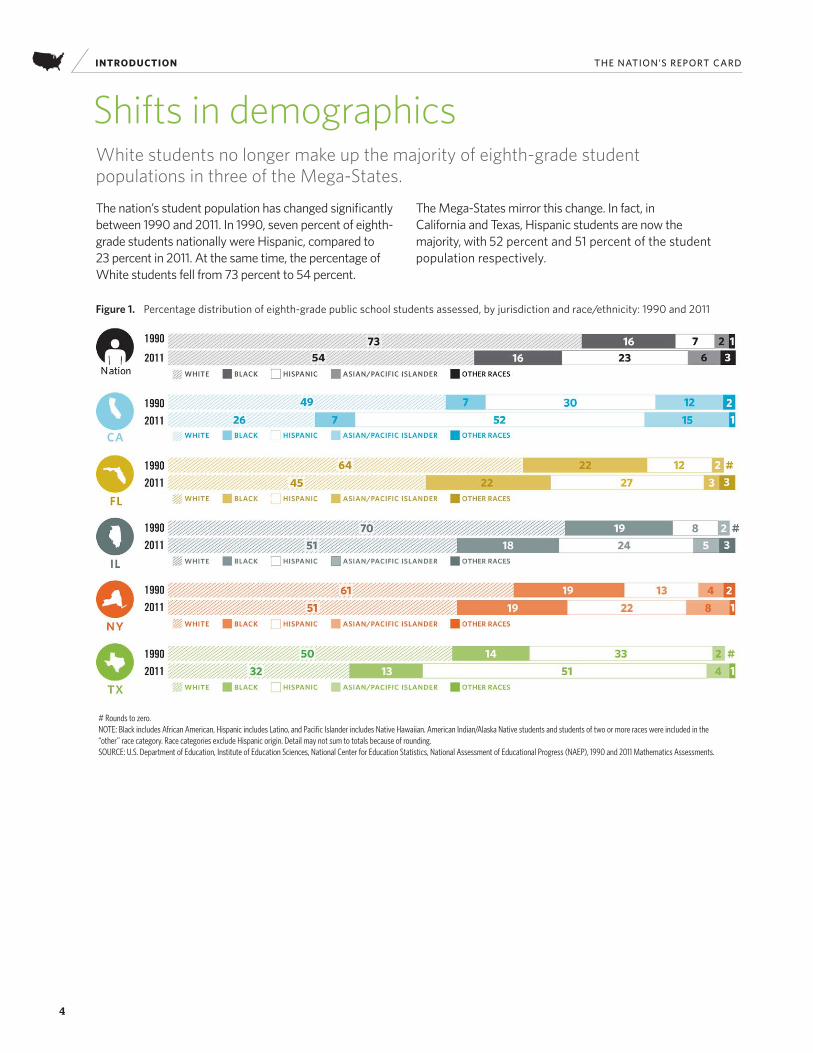
Shifts in demographics White students no longer make up the majority of eighth-grade student populations in three of the Mega-States.
The nation’s student population has changed significantly between 1990 and 2011. In 1990, seven percent of eighth-grade students nationally were Hispanic, compared to 23 percent in 2011. At the same time, the percentage of White students fell from 73 percent to 54 percent.
The Mega-States mirror this change. In fact, in California and Texas, Hispanic students are now the majority, with 52 percent and 51 percent of the student population respectively.
Figure 1. Percentage distribution of eighth-grade public school students assessed, by jurisdiction and race/ethnicity: 1990 and 2011
# Rounds to zero. NOTE: Black includes African American, Hispanic includes Latino, and Pacific Islander includes Native Hawaiian. American Indian/Alaska Native students and students of two or more races were included in the “other” race category. Race categories exclude Hispanic origin. Detail may not sum to totals because of rounding. SOURCE: U.S. Department of Education, Institute of Education Sciences, National Center for Education Statistics, National Assessment of Educational Progress (NAEP), 1990 and 2011 Mathematics Assessments.
4

MEGA-STATES REPORT INTRODUCTION
Accommodations and exclusions in the Mega-States NAEP’s goal is to be as inclusive as possible when assessing the achievement of our nation’s students. Testing accommodations are provided for students with disabilities (SD) and English language learners (ELL) to include as many students as possible. Even with the availability of accommodations, however, some students may still be excluded.
Figure 2 shows the percentages of students identified and excluded in grade 4 reading for 1998 (the first year in which accommodations were offered in NAEP) and 2011. It is important to note identification rates have increased over time, as have the percentages of students being assessed for the nation and for most Mega-States.
The variations in state policies and percentages of SD and ELL students identified in each Mega-State, along with the
variations in exclusion and accommodation rates, are part of the overall context for interpreting academic achievement. For example:
• In the nation overall and in most of the Mega-States, the percentages of students identified as ELL in 2011 increased in comparison to 1998. The apparent increase in California was not statistically significant.
• In the nation overall and in California, Illinois, and New York, the percentages of students who are ELL and excluded decreased in 2011 in comparison to 1998.
• In 2011, Texas was the only Mega-State to exclude higher percentages of SD and ELL students than the nation overall.
Figure 2. Percentage of fourth-grade public school students with disabilities (SD) and English language learners (ELL) identified and excluded in NAEP reading, as a percentage of all students, by jurisdiction and SD/ELL category: 1998 and 2011
NOTE: Detail may not sum to totals because of rounding. SOURCE: U.S. Department of Education, Institute of Education Sciences, National Center for Education Statistics, National Assessment of Educational Progress (NAEP), 1998 and 2011 Reading Assessments.
See tables TN1 through TN6 or visit http://nationsreportcard.gov/megastates/ for more information on identification, exclusion, and accommodations for SD and ELL students.
5

INTRODUCTION THE NATION’S REPORT CARD
Student performance in the Mega-States Mega-States generally do not perform higher than the nation, but they have made some gains over time. Many factors influence student achievement, including demographics, educational polices and practices, resources, and student mobility. The most recent NAEP results reveal some achievements and challenges across the Mega-States. They include the following:
• California scored lower than the nation in reading, mathematics, and science.
• Florida scored higher than the nation in grade 4 reading, but lower in grade 8 mathematics and science.
• Illinois scored higher than the nation in grade 8 reading, but lower in science.
• New York scored higher than the nation in grade 4 reading, but lower in grade 4 mathematics and grade 8 mathematics and science.
• Texas scored higher than the nation in grade 8 mathematics and science, and lower in reading.
This report features more information on the performance of different student groups in these assessments, and looks at gains over time. In many cases, students in the Mega-States have made significant gains, or rival the nation in the percentage of students at the Proficient achievement level.
Figure 3. Comparison of states to the nation for the most recent NAEP assessments given to public school students in reading, mathematics, and science: 2009 and 2011
NOTE: The reading and mathematics assessments were administered at the state level at both grades 4 and 8 in 2011. Science was most recently administered at grade 4 in 2009 and at grade 8 in 2011. SOURCE: U.S. Department of Education, Institute of Education Sciences, National Center for Education Statistics, National Assessment of Educational Progress (NAEP), 2009 and 2011 Science Assessments, and 2011 Reading and Mathematics Assessments.
6
What results will I find for the Mega-States? The following pages provide a more in-depth look into the performance of specific student groups and performance by subject, including
• academic performance over time and in the most recent assessments;
• comparisons to the nation and among the five states;
• highlights of gains for student groups, including those that performed higher than their peers in the nation; and
• student performance at or above the NAEP Proficient level.
The results presented by each subject area are for public school students only. NAEP reports results using widely accepted statistical standards; findings are reported based on a statistical significance level set at .05 with appropriate adjustments for multiple comparisons. See the Technical Notes for more information.
Reading Mathematics Science
Please note that writing results were not included in this report because the 2011 writing framework begins a new trend line. In addition, the 2011 computer-based writing assessment was not administered at the state level.
SEE THE REPORT COME ALIVE ONLINE AT .
7
http://nationsreportcard.gov/megastates/
MEGA-STATES REPORT INTRODUCTION

READING THE NATION’S REPORT CARD
Reading The NAEP reading assessment was first administered at the state level to grade 4 students in 1992 and grade 8 students in 1998. The assessment measures students’ comprehension skills by asking them to read selected grade-appropriate materials and answer questions based on what they read.
8

99
The Reading Framework The Reading Framework for the 2011 National Assessment of Educational Progress describes the types of texts and questions to be included in the assessment as well as how the questions should be designed and scored. The framework defines reading as a dynamic cognitive process that involves • understanding written text; • developing and interpreting meaning; and • using meaning as appropriate to the type
of text, purpose, and situation.
Types of text The NAEP reading framework calls for the use of literary and informational texts in the assessment.
Literary texts include fiction, literary nonfiction, and poetry.
Informational texts include exposition, argumentation and persuasive texts, and procedural texts and documents.
Reading cognitive targets The term cognitive target refers to the mental processes that underlie reading comprehension. The framework specifies that the assessment questions measure three cognitive targets for both literary and informational texts. Locate and Recall. When locating or recalling information from what they have read, students may identify explicitly stated main ideas or may focus on specific elements of a story.
Integrate and Interpret. When integrating and interpreting what they have read, students may make comparisons, explain character motivation, or examine relations of ideas across the text. Critique and Evaluate. When critiquing or evaluating what they have read, students view the text critically by examining it from numerous perspectives or may evaluate overall text quality or the effectiveness of particular aspects of the text. The complete reading framework for the 2011 assessment is available at http://www.nagb.org/ content/nagb/assets/documents/publications/ frameworks/reading-2011-framework.pdf.
Achievement Levels Based on recommendations from policymakers, educators, and members of the general public, the Governing Board sets specific achievement levels for each subject area and grade assessed. For a full description of the NAEP achievement levels in reading, see http://nces.ed.gov/nationsreportcard/ reading/achieve.asp.
Reporting NAEP Reading Results The results in this report are based on representative samples of public school students at grades 4 and 8. Reading scores are reported on a 0–500 scale. For more information regarding scales, see the Technical Notes.
MEGA-STATES REPORT READING

GRADE 4 READING THE NATION’S REPORT CARD
FL fourth-graders lead in reading gains In 2011, the reading score for fourth-graders in Florida was above the national average. The 16-point gain between 1992 and 2011 was larger than all other gains in the Mega-States with reportable results, and larger than the national average.
Both Florida and New York scored higher than the national average in 2011, California scored lower, and scores for Illinois and Texas were not significantly different from the nation.
Figure R1. Average score changes for fourth-grade public school students in NAEP reading between selected assessment years, by jurisdiction: 1992, 2003, and 2011
* Score change was statistically significant (p < .05) between 1992 and 2011. NOTE: Score changes were calculated using unrounded average scores. Illinois did not participate or did not meet the minimum participation guidelines for reporting at the state level prior to 2003.
Black students in CA and FL make larger gains than their peers nationally Many historically lower performing student groups had significant gains in the Mega-States, often larger than the nation.
Between 1992 and 2011, Black students in California and Florida, White students in Florida, and Hispanic students in New York made larger gains than their national peers. Between 2003 and 2011, Florida students with disabilities and those eligible for free or reduced-price school lunch made greater gains than their peers in the nation.
1 9 9 2 – 2 0 1 1
Figure R2. Average score gains for fourth-grade public school students in NAEP reading between selected assessment years, by jurisdiction and selected student groups: 1992, 2003, and 2011
NOTE: Only score gains that are higher than the national average of students in the same student group are shown in the figure. Black includes African American, and Hispanic includes Latino. Race categories exclude Hispanic origin.
SOURCE: U.S. Department of Education, Institute of Education Sciences, National Center for Education Statistics, National Assessment of Educational Progress (NAEP), 1992, 2003, and 2011 Reading Assessments.
10

MEGA-STATES REPORT GRADE 4 READING
How do student groups compare to the nationin performance at or above Proficient?
HOW TO USE THE PROFICIENCY MAP
Numerals in the circles indicate the percentages from each of the student groups performing at or above Proficient. Text boxes with arrow indicators highlight examples of the various results in this figure.
NATION
CALIFORNIA
FLORIDA
ILLINOIS
NEW YORK
TEXAS
Figure R3. Percentage of fourth-grade public school students at or above Proficient in NAEP reading, by selected student groups and jurisdiction: 2011
The percentage at or above Proficient in FL was higher than their peers in the nation and in the other Mega-States.
The percentages at or above Proficient in the Mega-States were not significantly different from their peers in the nation.
The percentage at or above Proficient in CA was lower than their peers in the nation and in the other Mega-States.
* Significantly different (p < .05) from the nation. ** Significantly different (p < .05) from the nation and the other Mega-States. NOTE: Black includes African American, and Hispanic includes Latino. Race categories exclude Hispanic origin.
SOURCE: U.S. Department of Education, Institute of Education Sciences, National Center for Education Statistics, National Assessment of Educational Progress (NAEP), 2011 Reading Assessment.
11

GRADE 8 READING THE NATION’S REPORT CARD
FL eighth-graders make gains in reading The average score for eighth-graders in Florida increased from lower than the national average in 1998 to not significantly different from the nation in 2011. Florida’s 8-point gain was the only statistically significant gain for the Mega-States.
Illinois scored higher than the national average in 2011, California and Texas scored lower, and the score for New York was not significantly different from the nation.
Figure R4. Average score changes for eighth-grade public school students in NAEP reading between selected assessment years, by jurisdiction: 1998, 2003, and 2011
# Rounds to zero. * Score change was statistically significant (p < .05) between 1998 and 2011. NOTE: Score changes were calculated using unrounded average scores. Illinois did not meet the minimum participation guidelines for reporting at the state level prior to 2003.
Black students in FL make larger gains than their peers in the nation In Florida, the score gains for both Black students and students identified as having a disability were greater than national gains for those student groups.
Figure R5. Average score gains for eighth-grade public school students in NAEP reading between selected assessment years, by jurisdiction and selected student groups: 1998, 2003, and 2011
NOTE: Only score gains that are higher than the national average of students in the same student group are shown in the figure. Black includes African American and excludes Hispanic origin.
SOURCE: U.S. Department of Education, Institute of Education Sciences, National Center for Education Statistics, National Assessment of Educational Progress (NAEP), 1998, 2003, and 2011 Reading Assessments.
1212

MEGA-STATES REPORT GRADE 8 READING
How do student groups compare to the nationin performance at or above Proficient?
HOW TO USE THE PROFICIENCY MAP
Numerals in the circles indicate the percentages from each of the student groups performing at or above Proficient. Text boxes with arrow indicators highlight examples of the various results in this figure.
NATION
CALIFORNIA
FLORIDA
ILLINOIS
NEW YORK
TEXAS
Figure R6. Percentage of eighth-grade public school students at or above Proficient in NAEP reading, by selected student groups and jurisdiction: 2011
The percentages at or above Proficient in FL and IL were higher than their peers in the nation.
The percentage at or above Proficient in NY was higher than their peers in the nation.
The percentages at or above Proficient in CA, FL, and TX were lower than their peers in the nation.
* Significantly different (p < .05) from the nation. NOTE: Black includes African American, and Hispanic includes Latino. Race categories exclude Hispanic origin.
SOURCE: U.S. Department of Education, Institute of Education Sciences, National Center for Education Statistics, National Assessment of Educational Progress (NAEP), 2011 Reading Assessment.
1313

MATHEMATICS THE NATION’S REPORT CARD
Mathematics The NAEP mathematics assessment was first administered at the state level to grade 4 students in 1992 and grade 8 students in 1990. At each grade, students responded to questions designed to measure what they know and can do across five mathematics content areas.
14

The Mathematics Framework To ensure an appropriate balance of content and allow for different ways of knowing and doing mathematics, the Mathematics Framework for the 2011 National Assessment of Educational Progress specifies that each question in the assessment measure one of the five mathematical content areas. The framework has been updated since 1990, but comparisons of students’ performance in 2011 can be made to previous assessment years.
Mathematics content areas There has been a consistent focus across frameworks on collecting information on students’ performance in the following five areas:
Number properties and operations measures students’ understanding of ways to represent, calculate, and estimate with numbers.
Measurement assesses students’ knowledge of units of measurement for such attributes as capacity, length, area, volume, time, angles, and rates.
Geometry measures students’ knowledge and understanding of shapes in two and three dimensions, and relationships between shapes such as symmetry and transformations.
Data analysis, statistics, and probability measures students’ understanding of data representation, characteristics of data sets, experiments and samples, and probability.
Algebra measures students’ understanding of patterns, using variables, algebraic representation, and functions.
15
Levels of mathematical complexity The framework describes three levels of mathematical complexity that reflect the cognitive demands that questions make on students’ thinking:
• Low complexity questions typically specify what a student is to do, which is often to carry out a routine mathematical procedure.
• Moderate complexity questions involve more flexibility of thinking and often require a response with multiple steps.
• High complexity questions make heavier demands on students’ thinking and often require abstract reasoning or analysis in a novel situation.
The complete mathematics framework for the 2011 assessment is av
. ailable at http://www.nagb.org/
publications/frameworks/math-2011-framework.pdf
Achievement Levels Based on recommendations from policymakers, educators, and members of the general public, the Governing Board sets specific achievement levels for each subject area and grade assessed. For a full description of the NAEP achievement levels in mathematics, see http://nces.ed.gov/ nationsreportcard/mathematics/achieve.asp.
Reporting NAEP Mathematics Results The results in this report are based on representative samples of public school students at grades 4 and 8. Mathematics scores are reported on a 0–500 scale. For more information regarding scales, see the Technical Notes.
MEGA-STATES REPORT MATHEMATICS
GRADE 4 MATHEMATICS THE NATION’S REPORT CARD
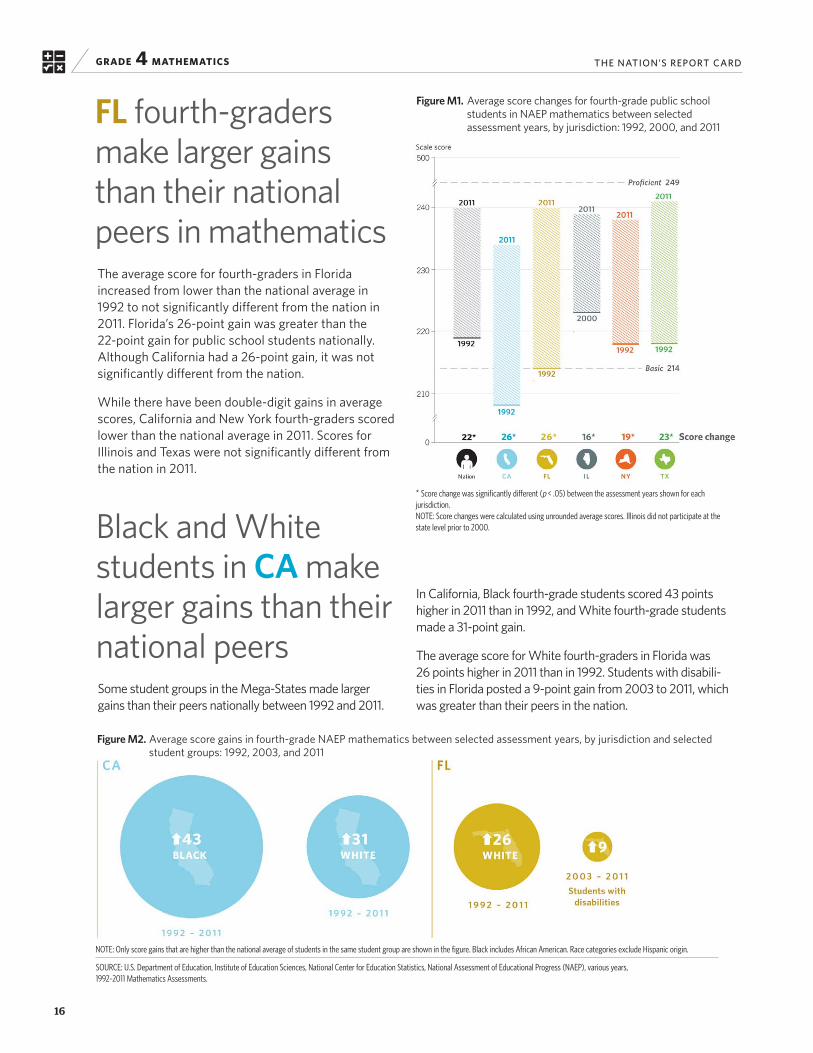
FL fourth-graders make larger gains than their national peers in mathematics The average score for fourth-graders in Florida increased from lower than the national average in 1992 to not significantly different from the nation in 2011. Florida’s 26-point gain was greater than the 22-point gain for public school students nationally. Although California had a 26-point gain, it was not significantly different from the nation.
While there have been double-digit gains in average scores, California and New York fourth-graders scored lower than the national average in 2011. Scores for Illinois and Texas were not significantly different from the nation in 2011.
Figure M1. Average score changes for fourth-grade public school students in NAEP mathematics between selected assessment years, by jurisdiction: 1992, 2000, and 2011
* Score change was significantly different (p < .05) between the assessment years shown for each jurisdiction. NOTE: Score changes were calculated using unrounded average scores. Illinois did not participate at the state level prior to 2000. Black and White
students in CA make larger gains than their national peers Some student groups in the Mega-States made larger gains than their peers nationally between 1992 and 2011.
In California, Black fourth-grade students scored 43 points higher in 2011 than in 1992, and White fourth-grade students made a 31-point gain.
The average score for White fourth-graders in Florida was 26 points higher in 2011 than in 1992. Students with disabilities in Florida posted a 9-point gain from 2003 to 2011, which was greater than their peers in the nation.
Figure M2. Average score gains in fourth-grade NAEP mathematics between selected assessment years, by jurisdiction and selected student groups: 1992, 2003, and 2011
NOTE: Only score gains that are higher than the national average of students in the same student group are shown in the figure. Black includes African American. Race categories exclude Hispanic origin.
SOURCE: U.S. Department of Education, Institute of Education Sciences, National Center for Education Statistics, National Assessment of Educational Progress (NAEP), various years, 1992–2011 Mathematics Assessments.
16

MEGA-STATES REPORT GRADE 4 MATHEMATICS
How do student groups compare to the nationin performance at or above Proficient?
HOW TO USE THE PROFICIENCY MAP
Numerals in the circles indicate the percentages from each of the student groups performing at or above Proficient. Text boxes with arrow indicators highlight examples of the various results in this figure.
NATION
CALIFORNIA
FLORIDA
ILLINOIS
NEW YORK
TEXAS
Figure M3. Percentage of fourth-grade public school students at or above Proficient in NAEP mathematics, by selected student groups and jurisdiction: 2011
The percentages at or above Proficient in FL and TX were higher than their peers in the nation.
The percentages at or above Proficient in CA and FL were lower than their peers in the nation.
The percentages at or above Proficient in FL and NY were not significantly different from their peers in the nation.
* Significantly different (p < .05) from the nation. NOTE: Black includes African American, and Hispanic includes Latino. Race categories exclude Hispanic origin.
SOURCE: U.S. Department of Education, Institute of Education Sciences, National Center for Education Statistics, National Assessment of Educational Progress (NAEP), 2011 Mathematics Assessment.
17

GRADE 8 MATHEMATICS THE NATION’S REPORT CARD
TX leads in eighth-grade mathematics gains The average mathematics score for Texas eighth-graders was 32 points higher in 2011 than in 1990. This increase was larger than all the other Mega-States. Texas was also the only Mega-State to score higher than the national average in 2011. California, Florida, and New York all scored lower, and the score for Illinois was not significantly different from the nation.
Figure M4. Average score changes for eighth-grade public school students in NAEP mathematics between selectedassessment years, by jurisdiction: 1990 and 2011
* Score change was significantly different (p < .05) between 1990 and 2011. NOTE: Score changes were calculated using unrounded average scores.
Black students in TX post greatest gains among Mega-States Black eighth-graders in Texas scored 42 points higher in 2011 than in 1990, which was a larger gain than in any of the Mega-States. In addition, White and Hispanic students in Texas had greater gains in average scores from 1990 to 2011 compared to their peers in the nation. Students from lower-income families in Texas and students with disabilities in Texas and Florida had greater gains than the nation from 2003 to 2011.
Figure M5. Average score gains in eighth-grade NAEP mathematics between selected assessment years, by jurisdiction and selected student groups: 1990, 2003, and 2011
1 9 9 0 – 2 0 1 1
NOTE: Only score gains that are higher than the national average of students in the same student group are shown in the figure. Black includes African American, and Hispanic includes Latino. Race categories exclude Hispanic origin.
SOURCE: U.S. Department of Education, Institute of Education Sciences, National Center for Education Statistics, National Assessment of Educational Progress (NAEP), 1990, 2003, and 2011 Mathematics Assessments.
1818

MEGA-STATES REPORT GRADE 8 MATHEMATICS
How do student groups compare to the nationin performance at or above Proficient?
HOW TO USE THE PROFICIENCY MAP
Numerals in the circles indicate the percentages from each of the student groups performing at or above Proficient. Text boxes with arrow indicators highlight examples of the various results in this figure.
NATION
CALIFORNIA
FLORIDA
ILLINOIS
NEW YORK
TEXAS
Figure M6. Percentage of eighth-grade public school students at or above Proficient in NAEP mathematics, by selected student groups and jurisdiction: 2011
The percentages at or above Proficient in TX were higher than their peers in the nation and in the other Mega-States.
The percentages at or above Proficient in CA and NY were lower than their peers in the nation.
The percentages at or above Proficient in IL and NY were not significantly different from their peers in the nation.
* Significantly different (p < .05) from the nation. ** Significantly different (p < .05) from the nation and the other Mega-States. NOTE: Black includes African American, and Hispanic includes Latino. Race categories exclude Hispanic origin.
SOURCE: U.S. Department of Education, Institute of Education Sciences, National Center for Education Statistics, National Assessment of Educational Progress (NAEP), 2011 Mathematics Assessment.
1919

20
THE NATION’S REPORT CARD SCIENCE
Science The NAEP science assessment was administered under the current framework at the state level to grade 4 students in 2009 and grade 8 students in 2009 and 2011. At each grade, students responded to questions designed to measure what they know and can do in three science content areas.

21
The Science Framework The Science Framework for the 2011 National Assessment of Educational Progress describes the types of questions to be included in the assessment and how they should be designed and scored.
Science content areas The framework organizes science content into three broad content areas:
• Physical science includes concepts related to properties and changes of matter, forms of energy, energy transfer and conservation, position and motion of objects, and forces affecting motion.
• Life science includes concepts related to organization and development, matter and energy transformations, interdependence, heredity and reproduction, and evolution and diversity.
• Earth and space sciences include concepts related to objects in the universe, the history of the Earth, properties of Earth materials, tectonics, energy in Earth systems, climate and weather, and biogeochemical cycles.
Science practices The framework also defines four science practices in addition to the science content areas. These four practices—identifying science principles, using science principles, using scientific inquiry, and using technological design—describe how students use their science knowledge by measuring what they are able to do with the science content.
The complete science framework for the 2011 assessment is available at http://www.nagb.org/ content/nagb/assets/documents/publications/ frameworks/science-2011.pdf.
Achievement Levels Based on recommendations from policymakers, educators, and members of the general public, the Governing Board sets specific achievement levels for each subject area and grade assessed. For a full description of the NAEP achievement levels in science, see http://nces.ed.gov/ nationsreportcard/science/achieve.asp.
Reporting NAEP Science Results State results at grade 4 are available for 2009 only and at grade 8 for 2009 and 2011. The results in this report are based on representative samples of public school students at grades 4 and 8. Science scores are reported on a 0–300 scale. For more information regarding scales, see the Technical Notes.
MEGA-STATES REPORT SCIENCE

CA trails the nation and Mega-States in science California fourth-graders scored lower than the nation and all the other Mega-States in science in 2009. Scores for the other Mega-States were not significantly different from the national average in this initial assessment under the new science framework.
Figure S1. Average scores for fourth-grade public school students in NAEP science, by jurisdiction: 2009
GRADE 4 SCIENCE THE NATION’S REPORT CARD
** Significantly different (p < .05) from the nation and the other Mega-States.
SOURCE: U.S. Department of Education, Institute of Education Sciences, National Center for Education Statistics, National Assessment of Educational Progress (NAEP), 2009 Science Assessment.
22

MEGA-STATES REPORT GRADE 4 SCIENCE
How do student groups compare to the nationin performance at or above Proficient?
HOW TO USE THE PROFICIENCY MAP
Numerals in the circles indicate the percentages from each of the student groups performing at or above Proficient. Text boxes with arrow indicators highlight examples of the various results in this figure.
NATION
CALIFORNIA
FLORIDA
ILLINOIS
NEW YORK
TEXAS
Figure S2. Percentage of fourth-grade public school students at or above Proficient in NAEP science, by selected student groups and jurisdiction: 2009
The percentages at or above Proficient in IL, NY, and TX were not significantly different from their peers in the nation.
The percentages at or above Proficient in IL and NY were lower than their peers in the nation.
The percentages at or above Proficient in TX and FL were higher than their peers in the nation and in the other Mega-States.
* Significantly different (p < .05) from the nation. ** Significantly different (p < .05) from the nation and the other Mega-States. NOTE: Black includes African American, and Hispanic includes Latino. Race categories exclude Hispanic origin.
SOURCE: U.S. Department of Education, Institute of Education Sciences, National Center for Education Statistics, National Assessment of Educational Progress (NAEP), 2009 Science Assessment.
23

GRADE 8 SCIENCE THE NATION’S REPORT CARD
TX leads in science scores in 2011 Texas eighth-graders scored higher than the nation and all the other Mega-States in science in 2011. California, Florida, Illinois, and New York scored lower than the national average. Apparent score differences between 2009 and 2011 were not significantly different for any of the Mega-States.
Figure S3. Average scores for eighth-grade public school students in NAEP science, by jurisdiction: 2009 and 2011
* Significantly different (p < .05) from the nation. ** Significantly different (p < .05) from the nation and the other Mega-States.
SOURCE: U.S. Department of Education, Institute of Education Sciences, National Center for Education Statistics, National Assessment of Educational Progress (NAEP), 2009 and 2011 Science Assessments.
24

MEGA-STATES REPORT GRADE 8 SCIENCE
How do student groups compare to the nationin performance at or above Proficient?
HOW TO USE THE PROFICIENCY MAP
Numerals in the circles indicate the percentages from each of the student groups performing at or above Proficient. Text boxes with arrow indicators highlight examples of the various results in this figure.
NATION
CALIFORNIA
FLORIDA
ILLINOIS
NEW YORK
TEXAS
Figure S4. Percentage of eighth-grade public school students at or above Proficient in NAEP science, by selected student groups and jurisdiction: 2011
The percentage at or above Proficient in TX was higher than their peers in the nation and in the other Mega-States.
The percentages at or above Proficient in FL and NY were not significantly different from their peers in the nation.
The percentages at or above Proficient in CA, IL, and NY were lower than their peers in the nation.
* Significantly different (p < .05) from the nation. ** Significantly different (p < .05) from the nation and the other Mega-States. NOTE: Black includes African American, and Hispanic includes Latino. Race categories exclude Hispanic origin.
SOURCE: U.S. Department of Education, Institute of Education Sciences, National Center for Education Statistics, National Assessment of Educational Progress (NAEP), 2011 Science Assessment.
25

TECHNICAL NOTES THE NATION’S REPORT CARD
Technical Notes NAEP Frameworks The National Assessment Governing Board oversees the development of the NAEP frameworks that describe the specific knowledge and skills that should be assessed in each subject. The frameworks for all main NAEP assessments are periodically updated or changed to reflect current curricula and standards. Whenever changes are made to a subject framework, every effort is made to maintain the trend lines that permit the reporting of changes in student achievement over time. If, however, the changes made to an assessment are such that the results are not comparable to earlier assessments, a new trend line is started. This was the case for the science assessment in 2009, so the science results in this report are only shown for 2009 at grade 4, and for 2009 and 2011 at grade 8.
Reporting NAEP Results The results in this report are based on representative samples of public school students at grades 4 and 8. Because NAEP scales are developed independently for each subject, scores cannot be compared across subjects. Reading and mathematics scores are reported on a 0–500 scale, while science scores are reported on a 0–300 scale. For science, a separate 0–300 scale was developed at each grade level, so scores cannot be compared across grades. For mathematics and reading, results for all grades assessed were analyzed together to create a 0–500 cross-grade scale in the base year of the trend line. In subsequent years, the data from each grade level were analyzed separately and then linked to the original cross-grade scale established in the base year. Comparisons of overall national performance across grade levels on a cross-grade scale are acceptable; however, other comparisons of scores across grades are not as strongly supported by the data, so they are therefore discouraged.
Accommodations and Exclusions in NAEP Many of the same testing accommodations allowed on state assessments (e.g., extra testing time or individual rather than group administration) are provided for students with disabilities (SD) and English language learners (ELL) participating in NAEP. Accommodations were first made available at the state level in reading
in 1998 and in mathematics in 2000. Subsequent assessment results were based on the more inclusive samples. Results for science are based on accommodated samples. Even with the availability of accommodations, some students may still be excluded. Variations in exclusion and accommodation rates, due to differences in policies and practices for identifying and including SD and ELL students, should be considered when comparing students’ performance over time and across states. States also vary in their proportions of SD and ELL students. While the effect of exclusion is not precisely known, comparisons of performance results could be affected if exclusion rates are markedly different among states or vary widely over time. See tables TN1 through TN6 for the percentages of students accommodated and excluded at the national and state levels. More information about NAEP’s inclusion policy is available at http:// nces.ed.gov/nationsreportcard/about/inclusion.asp.
National School Lunch Program NAEP collects data on student eligibility for the National School Lunch Program (NSLP) as an indicator of family income. Under the guidelines of NSLP, children from families with incomes below 130 percent of the poverty level are eligible for free meals. Those from families with incomes between 130 and 185 percent of the poverty level are eligible for reduced-price meals. (For the period July 1, 2010 through June 30, 2011, for a family of four, 130 percent of the poverty level was $28,665, and 185 percent was $40,793 in most states.)
Some schools provide free meals to all students irrespective of individual eligibility, using their own funds to cover the costs of noneligible students. Under special provisions of the National School Lunch Act intended to reduce the administrative burden of determining student eligibility every year, schools can be reimbursed based on eligibility data for a single base year. Participating schools might have high percentages of eligible students and report all students as eligible for free lunch. Because of the improved quality of the data on students’ eligibility for NSLP, the percentage of students for whom information was not available has decreased compared to the percentages reported prior to the 2003 assessment. Therefore, trend comparisons are only made back to 2003 in this report. For more information on NSLP, visit http://www.fns.usda.gov/cnd/lunch/.
26

MEGA-STATES REPORT TECHNICAL NOTES
Interpreting Statistical Significance Comparisons over time or between groups are based on statistical tests that consider both the size of the differences and the standard errors of the two statistics being compared. Standard errors are margins of error, and estimates based on smaller groups are likely to have larger margins of error.
When an estimate has a large standard error, a difference that seems large may not be statistically significant. Differences of the same magnitude may or may not be statistically significant depending upon the size of the standard errors of the estimates. For example, a 1-point change in the average score for White eighth-graders may be statistically significant, while a 1-point change for Asian/Pacific Islander students is not. Standard errors for the estimates presented in this report are available at http://nces.ed.gov/nationsreportcard/naepdata/.
A part-whole relationship exists between the state samples and the overall national samples because each state is part of the overall national public sample. Therefore, when results for individual states are compared to the nation, the significance tests appropriately reflect this dependency by adjusting the standard error of the difference to account for the overlap in samples.
To ensure that significant differences in NAEP data reflect actual differences and not mere chance, error rates need to be controlled when making multiple simultaneous comparisons. The more comparisons that are made (e.g., comparing the performance of White, Black, Hispanic, Asian/Pacific Islander, and American Indian/Alaska Native students), the higher the probability of finding significant differences by chance. In NAEP, the Benjamini-Hochberg False Discovery Rate (FDR) procedure is used to control the expected proportion of falsely rejected hypotheses relative to the number of comparisons that are conducted. A detailed explanation of this procedure can be found at http://nces.ed.gov/nationsreportcard/ tdw/analysis/infer.asp. NAEP employs a number of rules to determine the number of comparisons conducted, which in most cases is simply the number of possible statistical tests. However, when comparing multiple years, the number of years does not count toward the number of comparisons.
For more general information that relates to statistical significance, such as sampling frame and procedures, visit http://nces.ed.gov/nationsreportcard/tdw/.
27

TECHNICAL NOTES THE NATION’S REPORT CARD
Table TN1. Percentage of fourth-grade public school students with disabilities (SD) and/or English language learners (ELL) identified, excluded, and assessed in NAEP reading, as a percentage of all students, by jurisdiction and SD/ELL category: 2011
SD/ELL category Nation (public) California Florida Illinois New York Texas SD and/or ELL
Identified 23 38 23 21 23 30 Excluded 4 2 2 2 3 10 Assessed 19 35 21 19 20 20
Without accommodations 9 29 3 6 1 17 With accommodations 10 6 18 13 19 3
SD Identified 13 10 16 14 16 10
Excluded 3 2 2 1 2 6 Assessed 10 8 14 13 14 5
Without accommodations 3 3 3 4 1 2 With accommodations 7 5 11 9 13 3
ELL Identified 11 32 9 8 9 22
Excluded 1 1 1 1 1 5 Assessed 10 30 8 7 8 16
Without accommodations 7 27 # 2 # 15 With accommodations 4 3 8 6 8 1
# Rounds to zero. NOTE: Students identified as both SD and ELL were counted only once under the combined SD and/or ELL category, but were counted separately under the SD and ELL categories. Detail may not sum to totals because of rounding. SOURCE: U.S. Department of Education, Institute of Education Sciences, National Center for Education Statistics, National Assessment of Educational Progress (NAEP), 2011 Reading Assessment.
Table TN2. Percentage of eighth-grade public school students with disabilities (SD) and/or English language learners (ELL) identified, excluded, and assessed in NAEP reading, as a percentage of all students, by jurisdiction and SD/ELL category: 2011
SD/ELL category Nation (public) California Florida Illinois New York Texas SD and/or ELL
Identified 18 23 19 17 20 18 Excluded 3 2 2 2 3 6 Assessed 14 21 16 15 17 12
Without accommodations 5 15 1 3 # 9 With accommodations 9 6 15 12 17 3
SD Identified 13 10 14 14 16 11
Excluded 3 2 2 1 2 5 Assessed 10 8 13 13 14 6
Without accommodations 2 2 1 2 # 3 With accommodations 8 5 12 11 13 3
ELL Identified 6 17 5 4 6 9
Excluded 1 1 1 # 1 2 Assessed 5 16 4 3 5 7
Without accommodations 3 13 # 2 # 7 With accommodations 2 3 4 2 4 1
# Rounds to zero. NOTE: Students identified as both SD and ELL were counted only once under the combined SD and/or ELL category, but were counted separately under the SD and ELL categories. Detail may not sum to totals because of rounding. SOURCE: U.S. Department of Education, Institute of Education Sciences, National Center for Education Statistics, National Assessment of Educational Progress (NAEP), 2011 Reading Assessment.
28

MEGA-STATES REPORT TECHNICAL NOTES
Table TN3. Percentage of fourth-grade public school students with disabilities (SD) and/or English language learners (ELL) identified, excluded, and assessed in NAEP mathematics, as a percentage of all students, by jurisdiction and SD/ELL category: 2011
SD/ELL category Nation (public) California Florida Illinois New York Texas SD and/or ELL
Identified 23 38 23 21 23 30 Excluded 2 2 2 2 1 4 Assessed 21 36 22 18 22 26
Without accommodations 9 29 3 6 1 18 With accommodations 12 7 19 13 21 8
SD Identified 13 10 16 14 16 10
Excluded 2 1 1 2 1 4 Assessed 11 8 14 12 15 7
Without accommodations 3 2 3 4 1 2 With accommodations 9 6 12 8 14 5
ELL Identified 11 32 9 8 9 22
Excluded # 1 # 1 1 1 Assessed 11 31 9 7 9 21
Without accommodations 6 27 # 2 # 16 With accommodations 4 4 8 6 8 4
# Rounds to zero. NOTE: Students identified as both SD and ELL were counted only once under the combined SD and/or ELL category, but were counted separately under the SD and ELL categories. Detail may not sum to totals because of rounding. SOURCE: U.S. Department of Education, Institute of Education Sciences, National Center for Education Statistics, National Assessment of Educational Progress (NAEP), 2011 Mathematics Assessment.
Table TN4. Percentage of eighth-grade public school students with disabilities (SD) and/or English language learners (ELL) identified, excluded, and assessed in NAEP mathematics, as a percentage of all students, by jurisdiction and SD/ELL category: 2011
SD/ELL category Nation (public) California Florida Illinois New York Texas SD and/or ELL
Identified 18 23 19 17 20 18 Excluded 3 1 2 2 1 5 Assessed 15 22 17 15 19 13
Without accommodations 5 15 1 3 # 8 With accommodations 10 7 16 12 18 5
SD Identified 13 10 14 14 16 11
Excluded 2 1 2 2 1 5 Assessed 10 9 13 12 15 6
Without accommodations 2 3 1 1 # 2 With accommodations 9 6 12 10 14 4
ELL Identified 6 17 5 4 6 9
Excluded # 1 # # # 1 Assessed 6 17 5 3 5 8
Without accommodations 3 13 # 2 # 6 With accommodations 2 4 4 2 5 1
# Rounds to zero. NOTE: Students identified as both SD and ELL were counted only once under the combined SD and/or ELL category, but were counted separately under the SD and ELL categories. Detail may not sum to totals because of rounding. SOURCE: U.S. Department of Education, Institute of Education Sciences, National Center for Education Statistics, National Assessment of Educational Progress (NAEP), 2011 Mathematics Assessment.
29

TECHNICAL NOTES THE NATION’S REPORT CARD
Table TN5. Percentage of fourth-grade public school students with disabilities (SD) and/or English language learners (ELL) identified, excluded, and assessed in NAEP science, as a percentage of all students, by jurisdiction and SD/ELL category: 2009
SD/ELL category Nation (public) California Florida Illinois New York Texas SD and/or ELL
Identified 23 36 23 22 22 29 Excluded 2 2 2 2 1 3 Assessed 20 33 22 19 21 26
Without accommodations 9 27 4 5 1 16 With accommodations 12 6 18 14 20 9
SD Identified 13 10 17 15 16 10
Excluded 2 2 1 1 1 2 Assessed 12 7 15 14 15 8
Without accommodations 3 3 3 3 1 2 With accommodations 9 4 12 10 14 5
ELL Identified 10 30 8 8 8 21
Excluded 1 1 1 1 1 2 Assessed 10 29 7 7 7 19
Without accommodations 6 25 # 2 # 15 With accommodations 4 3 7 5 7 5
# Rounds to zero. NOTE: Students identified as both SD and ELL were counted only once under the combined SD and/or ELL category, but were counted separately under the SD and ELL categories. Detail may not sum to totals because of rounding. SOURCE: U.S. Department of Education, Institute of Education Sciences, National Center for Education Statistics, National Assessment of Educational Progress (NAEP), 2009 Science Assessment.
Table TN6. Percentage of eighth-grade public school students with disabilities (SD) and/or English language learners (ELL) identified, excluded, and assessed in NAEP science, as a percentage of all students, by jurisdiction and SD/ELL category: 2011
SD/ELL category Nation (public) California Florida Illinois New York Texas SD and/or ELL
Identified 18 23 19 17 20 18 Excluded 2 2 1 1 1 2 Assessed 16 22 17 16 19 16
Without accommodations 5 14 1 3 # 8 With accommodations 11 8 16 12 18 8
SD Identified 13 10 14 14 16 11
Excluded 2 2 1 1 1 2 Assessed 11 8 13 13 15 9
Without accommodations 2 2 1 2 # 2 With accommodations 9 6 12 11 14 7
ELL Identified 6 17 5 4 6 9
Excluded # 1 # # # 1 Assessed 6 16 4 4 5 8
Without accommodations 3 13 # 2 # 7 With accommodations 2 4 4 2 5 1
# Rounds to zero. NOTE: Students identified as both SD and ELL were counted only once under the combined SD and/or ELL category, but were counted separately under the SD and ELL categories. Detail may not sum to totals because of rounding. SOURCE: U.S. Department of Education, Institute of Education Sciences, National Center for Education Statistics, National Assessment of Educational Progress (NAEP), 2011 Science Assessment.
30

’ -
–
- - -
U.S. Department of Education The National Assessment of Educational Progress (NAEP) is a congressionally authorized project sponsored by the U.S. Department of Education. The National Center for Education Statistics, within the Institute of Education Sciences, administers NAEP. The Commissioner of Education Statistics is responsible by law for carrying out the NAEP project.
Arne Duncan Secretary U.S. Department of Education
John Q. Easton Director Institute of Education Sciences
Jack Buckley Commissioner National Center for Education Statistics
Peggy G. Carr Associate Commissioner for Assessment
National Center for Education Statistics
The National Assessment Governing Board In 1988, Congress created the National Assessment Governing Board to set policy for the National Assessment of Educational Progress, commonly known as The Nation's Report CardTM. The Governing Board is an independent, bipartisan group whose members include governors, state legislators, local and state school officials, educators, business representatives, and members of the general public.
Honorable David P. Driscoll, Chair Former Commissioner of Education Melrose, Massachusetts
Susan Pimentel, Vice Chair Educational Consultant Hanover, New Hampshire
Andrés Alonso Chief Executive Officer Baltimore City Public Schools Baltimore, Maryland
Louis M. Fabrizio Data, Research and Federal Policy Director North Carolina Department of Public Instruction
Raleigh, North Carolina
Honorable Anitere Flores Senator Florida State Senate Miami, Florida
Alan J. Friedman Consultant Museum Development and Science Communication
New York, New York
Rebecca Gagnon School Board Member Minneapolis Public Schools Minneapolis, Minnesota
Shannon Garrison Fourth-Grade Teacher Solano Avenue Elementary School Los Angeles, California
Doris R. Hicks Principal and Chief Executive Officer Dr. Martin Luther King, Jr. Charter School for Science and Technology
New Orleans, Louisiana
Andrew Dean Ho Assistant Professor Harvard Graduate School of Education Harvard University Cambridge, Massachusetts
Honorable Terry Holliday Commissioner of Education Kentucky Department of Education Lexington, Kentucky
Richard Brent Houston Principal Shawnee Middle School Shawnee, Oklahoma
Hector Ibarra Eighth-Grade Teacher Belin-Blank International Center and Talent Development
Iowa City, Iowa
Honorable Tom Luna Idaho Superintendent of Public Instruction
Boise, Idaho
Terry Mazany President and CEO The Chicago Community Trust Chicago, Illinois
Tonya Miles General Public Representative Mitchellville, Maryland
Dale Nowlin Twelfth-Grade Teacher Columbus North High School Columbus, Indiana
Joseph M. O’Keefe, S.J. Professor Lynch School of Education Boston College Chestnut Hill, Massachusetts
W. James Popham Professor Emeritus University of California, Los Angeles Wilsonville, Oregon
B. Fielding Rolston Chairman Tennessee State Board of Education Kingsport, Tennessee
Cary Sneider Associate Research Professor Portland State University Portland, Oregon
Blair Taylor Chief Community Officer Starbucks Coffee Company Seattle, Washington
Honorable Leticia Van de Putte Senator Texas State Senate San Antonio, Texas
John Q. Easton (Ex officio) Director Institute of Education Sciences U.S. Department of Education Washington, D.C.
Cornelia S. Orr Executive Director National Assessment Governing Board Washington, D.C.
“The Depar tment of Education’s mission is to promote student achievement and preparat ion for g lobal competit iveness by foster ing educational excel lence and ensuring equal access.”
www.ed.gov
M O R E I N F O R M A T I O N The report release site is http://nationsreportcard.gov. The NCES Publications and Products address is http://nces.ed.gov/ pubsearch.
For ordering information, write to ED Pubs U.S. Department of Education P.O. Box 22207 Alexandria, VA 22304
or call toll free 1-877-4-ED-Pubs
or order online at http://www.edpubs.gov.
THE NATION’S REPORT CARD
Mega-States FEBRUARY 2013
S U G G E S T E D C I T A T I O N
National Center for Education Statistics (2013). The Nation s Report Card: Mega States: An Analysis of Student Performance in the Five Most Heavily Populated States in the Nation (NCES 2013 450). Institute of Education Sciences, U.S. Department of Education, Washington, D.C.
C O N T E N T C O N T A C T
Ebony Walton 202-502-7823 [email protected]
This report was prepared for the National Center for Education Statistics under Contract No. ED 07 CO 0107 with Educational Testing Service. Mention of trade names, commercial products, or organizations does not imply endorsement by the U.S. Government.