Embed Size (px)
Citation preview
National Centre for Education and Training on Addiction (NCETA), Flinders University
The National
Methamphetamine Symposium Making Research Work in Practice
Understanding trends in Methamphetamine use and harm:
Implications for harm reduction
Paul Dietze
12 May 2015 | Arts Centre, Melbourne

Understanding trends in Methamphetamine use and harm: Implications for harm reduction Paul Dietze, Centre for Population Health

Over 250 articles in Herald Sun + Age from Jan 2014

Is ‘ice’ the problem?
• Crystal methamphetamine = methamphetamine = speed powder = methamphetamine = base
• Reports of greater ease in obtaining methamphetamine, increased drug quality/purity (ACC, 2014)
• Increased harms

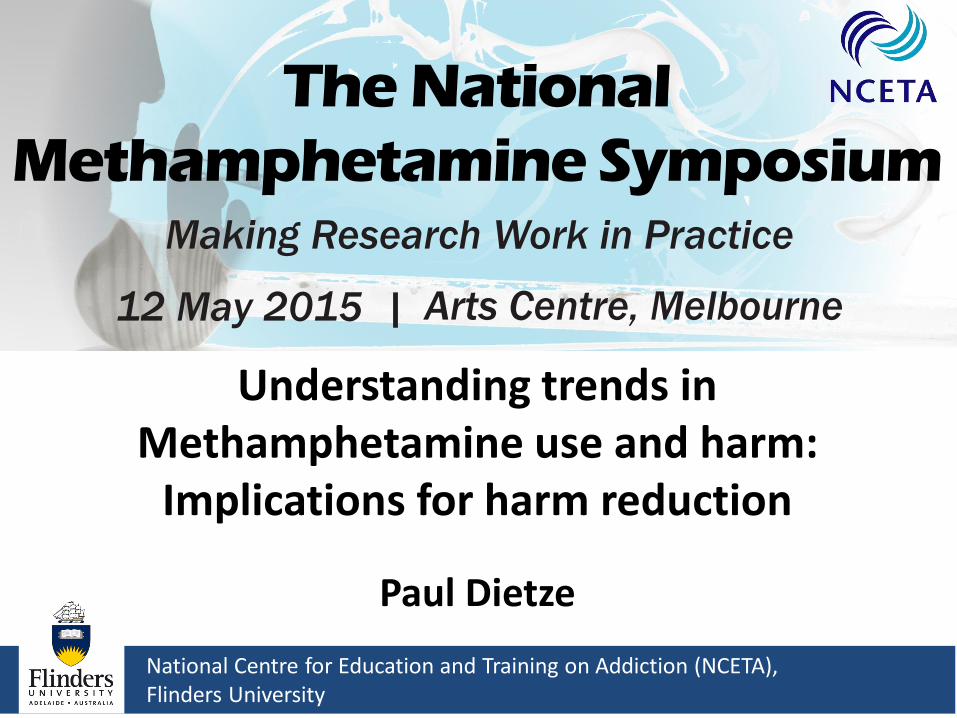
(Meth)amphetamine-related ambulance attendances
Lloyd et al. (2014). Ambo Project Report

However
• Has been an actual increase in the prevalence of methamphetamine use?
– NDSHS findings
(past-year meth/amphetamine use – 2.1% in 2010 and 2013)
• Why should we care?
– Practice/policy must be based on sound evidence to appropriately meet the needs of consumers and the wider community
– Responses to (methamphetamine use and harms) are often ill-informed and possibly counter-productive (eg ‘faces of meth’, Montana Meth Project)

IDRS: Victorian trends in methamphetamine use
Cogger et al. (2015)

EDRS: Victorian trends in methamphetamine use
Truong et al. (2015)

BDO: trends in methamphetamine use
Lim et al. (2015).

BDO: trends in methamphetamine use
Lim et al, unpublished.
(Meth)amphetamine-related ambulance attendances
Lloyd et al. (2014). Ambo Project Report

Source: Victoria Police Forensic Services Department, 2008‒2014
So what is going on? Average purity of methamphetamine seizures, VIC,
2007/08‒2013/14

So what is going on? Average purity of heroin and methamphetamine
seizures, VIC, 2009‒2013
Scott, N., Caulkins, J. P., Ritter, A. , Quinn, Q., & Dietze, P. (2014). High-frequency drug purity and price series as tools for explaining drug trends and harms in Victoria, Australia. Addiction, DOI: 10.1111/add.12740.

Purity-adjusted price of heroin and methamphetamine, 2009 to mid-2013
• Heroin experienced several mini peaks and troughs.
• Powder meth. declined.
• Crystal meth. declined.
• Both forms of methamphetamine had similar purity-adjusted prices.
Scott, N., Caulkins, J. P., Ritter, A. , Quinn, Q., & Dietze, P. (2014). High-frequency drug purity and price series as tools for explaining drug trends and harms in Victoria, Australia. Addiction, DOI: 10.1111/add.12740.

Observations: Preferred drug and drug used most in the last month
Drug used most 2009 2013
Heroin 60% 30%
Methamphetamine 7% 7%
Cannabis 19% 28%
Other 14% 35%
Preferred drug 2009 2013
Heroin 73% 64%
Methamphetamine 12% 12%
Cannabis 7% 17%
Other 8% 8%

IDRS/EDRS median days used (past 6 months)
Lim et al. (2015).

Purity Perceptions: “High” purity
Burnet Institute, unpublished

Ecstasy-related ambulance attendances
Lloyd et al. (2014). Ambo Project Report

heroin-overdose ambulance attendances
Lloyd et al. (2014). Ambo Project Report

Methamphetamine harms (MIX cohort)
Nambiar, in preparation
ED Utilisation Drug used IRR/OR (95% CI)
Any Heroin 1
Methamphetamine 1.64 (1.12-2.41)
Frequent Heroin 1
Methamphetamine 6.67 (2.64- 16.85)

NSP coverage in past 2 weeks (MIX)
OKeefe, in preparation
Coverage MA use No MA use
100%+ 65 81
<100% 35 19
Χ2=48.46, p<0.001

Time of use (MIX)
Scott et al 2014

Risk Behaviours for BBVs - IDRS
McCormack, in preparation
Behaviour Odds Ratio (95%CI)
Adjusted Odds Ratio (95%CI)
Syringe re-use
No MA use 1 1
MA use 1.82 (1.31-2.51) 1.74 (1.17-2.60)
Receptive sharing
No MA use 1
MA use 2.72 (1.2-6.17)
N/S
Distributive sharing
No MA use 1
MA use 2.72 (1.2-6.17)
N/S
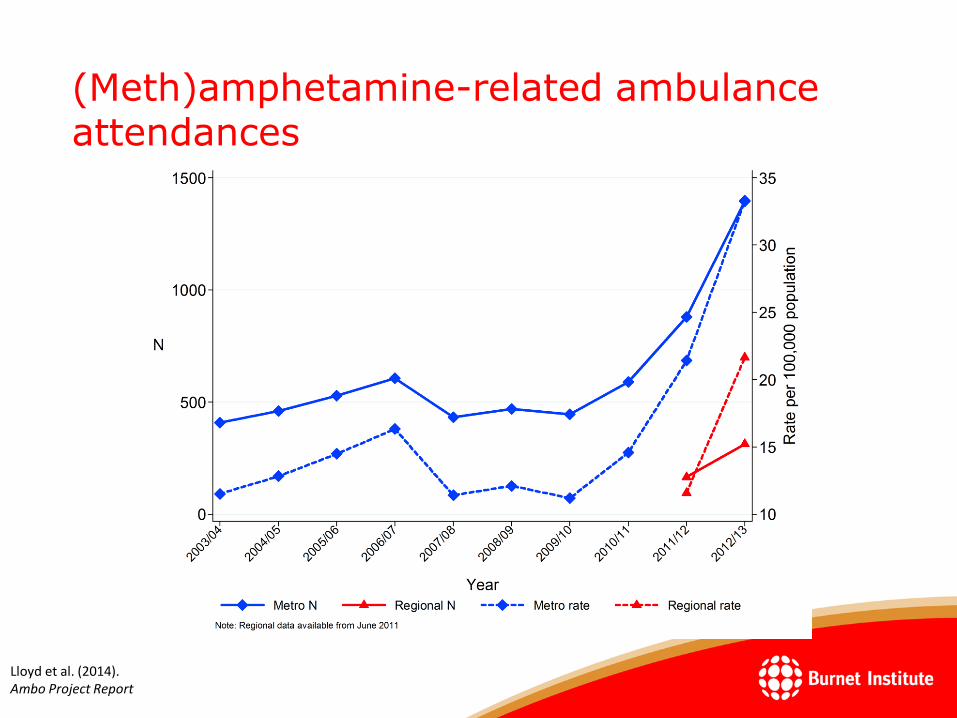
UnMet
Cohort of 255 regular methamphetamine users recruited in Melbourne in 2010-followed in 2011 (and 2015)
Pattern Baseline Follow-up
Regular use 100%
Stable Use 9%
Decreasing use 70%
Increasing use 21%
ABSTINENT 32%
Dependence 60%
Remission 45%
Escalation 5%
Quinn, 2012

UnMet: Service avoidance
• Most use not perceived to be problematic/harmful/severe enough to
warrant professional support, e.g.:
– “I don’t think it’s a problem…I don’t feel I’m addicted to it and it’s not affecting my life in a
bad way” Elise, 24-year-old female;
– “I don’t find I have a problem with [methamphetamine]…I’m not picking at imaginary
things on my skin, I don’t have festering sores” Rob, 34-year-old male
Odds Ratio (95% CI)
More likely to be employed 2.37 (1.34-4.18)
Less likely to regret decisions 0.47 (0.26-0.86)
Less likely to incur/cause methamphetamine-related injuries
0.34 (0.14-0.78)
Lower frequency of ‘recent’ methamphetamine use
0.31 (0.17-0.55)
105 (41%) ‘service avoiders’, who were:
Quinn, 2012

UnMet: Unrecognised need?
Service avoiders
– 50% classified as methamphetamine-dependent;
– 46% using methamphetamine >weekly;
– 50% primarily injected methamphetamine;
– 62% experienced methamphetamine-related financial problems last 6 months;
• There is a need for initiatives targeting this group addressing concepts of
‘problematic’ use and aiming to prevent transition to riskier/more harmful
use patterns;
– Along these lines, need to address constructs of ‘functionality’ that may distort
perceptions/awareness of ‘problematic’ use (e.g., employment);
Quinn, 2012

UnMet: Barriers to treatment access
• Preference for self-treatment (e.g., due to pride, dignity, accepting
responsibility);
– “I got myself into this pickle…should be up to me to get out of it”;
• Stigma;
– “They don’t take you in if you’re using speed, ‘cause they think you’ll be
violent”;
• Staff turnover, lack of holistic services;
– “They always move...you’re always repeating yourself like a bloody record”;
• Adverse past experiences;
– “…once we’ve been shat in the face it takes a lot of courage for us to go back
and do it again”;
• Lack of methamphetamine-specific services, staff knowledgeable about
methamphetamine;
– “[Unlike heroin] there’s nothing out there that helps with speed”;
• Lack of desire to reduce/cease use (e.g., use is functional, enjoyable);
• Adequate support networks already in place.
Quinn, 2012
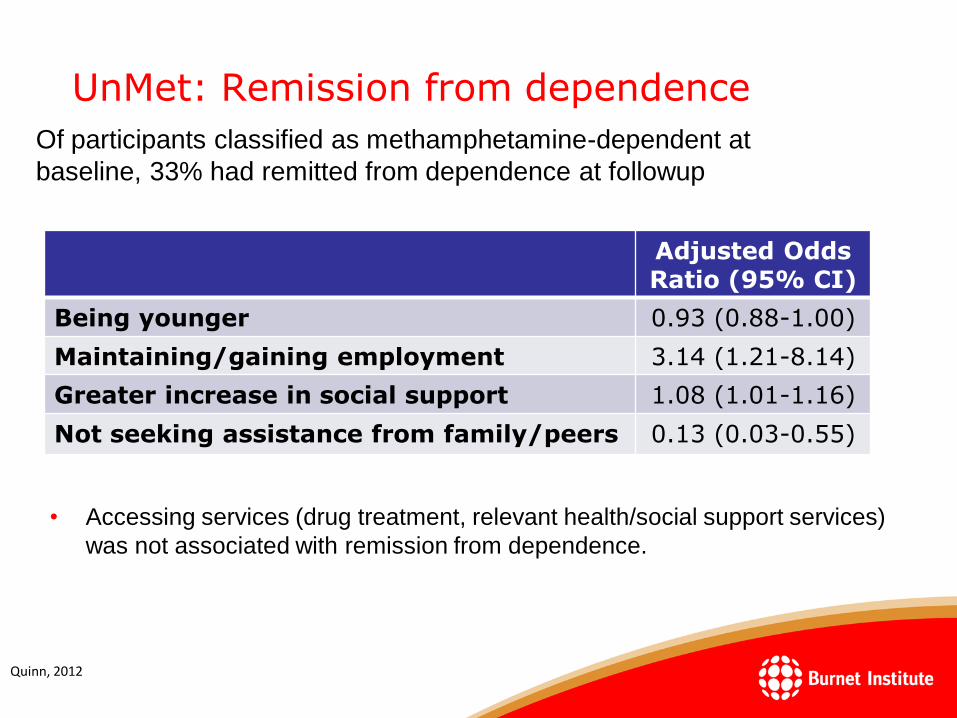
UnMet: Remission from dependence
• Accessing services (drug treatment, relevant health/social support services)
was not associated with remission from dependence.
Adjusted Odds Ratio (95% CI)
Being younger 0.93 (0.88-1.00)
Maintaining/gaining employment 3.14 (1.21-8.14)
Greater increase in social support 1.08 (1.01-1.16)
Not seeking assistance from family/peers 0.13 (0.03-0.55)
Of participants classified as methamphetamine-dependent at
baseline, 33% had remitted from dependence at followup
Quinn, 2012

Harm Reduction

Harm Reduction
• Needle and syringe programs:
– Engagement/referral
– Opening hours
– Vending machines
– Regional areas
– Investment
• Primary Care:
– GPs
– Primary health centres for injecting drug use or drug use?
• Consumption facilities/other equipment:
– Injecting, but what about other equipment?
– Bans or support?

Harm Reduction
• Safe use education
– Dose titration?
– Help and referral
• De-escalation education and training:
– Front line workers
– First responders
– Mental health triage
• Media/Social Marketing Campaigns
– Targets?
– Effectiveness?
• Drug Driving
– Testing & deterrence

Helpful images?


Acknowledgements
• Participants of the listed studies
• Burnet Staff: all who contributed to this paper, everyone else (plus non-Burnet staff) who assisted with data collection
• Turning Point and other data custodians
• Victoria Police Forensic Sciences Centre
• David Moore

Predictors/correlates of service utilisation – Discussion (1)
• Service utilisation:
– GPs most common source of professional support. Possibly indicates
greater accessibility, availability, familiarity, utilisation for other health
issues vs. other service types;
– One-on-one drug counsellors most common drug-specialist service type.
Possibly indicates:
• Presence of barriers to high-threshold services (Pennay & Lee, 2010);
• Preference for low- vs. high-threshold service types; and,
• The ability of some individuals to address dependent, harmful use patterns
without intensive professional support (important to consider with regard to
positive changes to psychosocial factors over follow-up period).
Quinn, 2012

Predictors/correlates of service utilisation – Discussion (2)
• Factors associated with service access:
– Greater perceived need/motivation to change methamphetamine use
patterns, address related harms (e.g., self-treatment, seeking help from
family/peers);
• Suggests a need to develop initiatives for users engaging in harmful use
patterns who aren’t yet experiencing ‘readiness to change’, to promote earlier
treatment engagement and reduce/prevent harms;
– Service utilisation for other issues (mental health, other drug use);
• Such contact possibly diminishes certain barriers for some methamphetamine
users, means they’re more receptive to utilising services for
methamphetamine;
• Suggests a need to facilitate pathways to professional support for those not in
contact with the service sector (e.g., non-injectors engaging in harmful use
patterns, given injecting associated with service utilisation).
Quinn, 2012