Embed Size (px)
Citation preview

The musical influence on people’s micromotion when standing still in groups
Alexander Refsum Jensenius, Agata Zelechowska, Victor Gonzalez SanchezUniversity of Oslo, Department of Musicology, fourMs Lab
[a.r.jensenius, agata.zelechowska, v.e.g.sanchez]@imv.uio.no
ABSTRACT
The paper presents results from an experiment in which91 subjects stood still on the floor for 6 minutes, with thefirst 3 minutes in silence, followed by 3 minutes with mu-sic. The head motion of the subjects was captured using aninfra-red optical system. The results show that the averagequantity of motion of standstill is 6.5 mm/s, and that thesubjects moved more when listening to music (6.6 mm/s)than when standing still in silence (6.3 mm/s). This resultconfirms the belief that music induces motion, even whenpeople try to stand still.
1. INTRODUCTION
It is commonly assumed that listening to musical sound,and particularly dance music with a clear pulse, ”makes”us move. This assumption is to some extent supported bythe literature in embodied music cognition [1,2], and thereare also empirical studies of music-induced motion [3, 4]or motion enhanced by music [5, 6]. Many of these for-mer studies have mainly focused on voluntary and fairlylarge-scale music-related body motion. As far as we know,there is little empirical evidence of music actually makingpeople move when they try to remain at rest.
Our aim is to investigate the tiniest performable and per-ceivable human motion, what we refer to as micromotion.Such micromotion is primarily involuntary and performedat a scale that is barely observable to the human eye. Stillwe believe that such micromotion may be at the core of ourcognition of music at large, being a natural manifestationof the internal motor engagement [7].
In our previous studies we have found that subjects ex-hibit a remarkably consistent level of micromotion whenattempting to stand still in silence, even for extended peri-ods of time (10 minutes) [8]. The measured standstill levelof a person is also consistent with repeated measures overtime [9]. These studies, however, were carried out on smallgroups of people (2–5), so we have been interested in test-ing whether these findings hold true also for larger groups.
In this paper we report on a study of music-induced mi-cromotion, focusing on how music influences the motionof people trying to stand still. In order to answer that ques-tion, it is necessary to have baseline recordings of howmuch people move when standing still in silence. More
Copyright: c© 2017 et al. This is an open-access article distributed under the
terms of the Creative Commons Attribution 3.0 Unported License, which permits
unrestricted use, distribution, and reproduction in any medium, provided the origi-
nal author and source are credited.
Figure 1. The setup for the “Norwegian Championship ofStandstill.” Each subject wore a reflective marker on thehead, and one static marker was recorded from a standingpole in the middle of the space as a reference.
specifically, this paper is aimed at answering the followingquestions:
• How (much) do people move when trying to standstill?
• How (much) does music influence the micromotionobserved during human standstill?
To answer these questions, we have started carrying outa series of group experiments under the umbrella name ofthe “Norwegian Championship of Standstill.” The theo-retical background of the study and a preliminary analysishave been presented in [10]. This paper presents a quan-titative analysis of the data from the 2012 edition of ourexperiment series.
2. THE EXPERIMENT
The experiment was carried out in the fourMs motion cap-ture lab at the University of Oslo in March 2012 (Figure 1).
2.1 Participants
A little more than 100 participants were recruited to thestudy, and they took part in groups consisting of 5-17 par-ticipants at a time (see Figure 1 for a picture of the setup).Not every participant completed the task and there weresome missing marker data, resulting in a final dataset of
Proceedings of the 14th Sound and Music Computing Conference, July 5-8, Espoo, Finland
SMC2017-195

0 50 100 150 200 250 300 350 400−1
−0.5
0
0.5
1
Time (s)
Ampl
itude
S1 S2 S3 S4 S5 S6 S7
Figure 2. Waveform of the sound used throughout the ex-periment. Silence for the first 3 minutes, followed by 7short music excerpts (S1–S7) ranging from non-rhythmicorchestral music to electronic dance music.
91 participants (48 male, 42 female, 1 unspecified). 1 Theaverage age was 27 years (min = 16, max = 67). The partic-ipants reported quite diverse numbers for how many hoursper week they spent listening to music (M=19, SD=15) andcreating music (M=8, SD=8), reflecting that around half ofthe participants were music students.
2.2 Task
The task given to the participants was to attempt to standas still as possible on the floor for 6 minutes in total, 3minutes in silence and 3 minutes with music. They wereaware that music would start after 3 minutes.
2.3 Sound stimulus
The sound file used as stimulus consisted of 3 minutes ofsilence, followed by 3 minutes of musical sound. Therewere 7 short musical excerpts, each with a duration of 20–40 seconds. The first musical excerpts were slow, non-rhythmic orchestral music, while the last ones were acous-tical and electronic dance music. 2 As such, the rhythmiccomplexity and loudness increased throughout the experi-ment, as can be seen in Figure 2. The sound was playedcomfortably loud from a pair of Genelec 8020 loudspeak-ers and a Genelec 7050 subwoofer.
2.4 Motion capture
Each participant wore a reflective marker on his/her head,and its position was recorded using a Qualisys infrared mo-tion capture system (Oqus 300) running at 100 Hz. Wehave previously shown that the spatial noise level of thesystem is considerably lower than that of human stand-still [11].
Data was recorded and preprocessed in the Qualisys TrackManager, and the analysis was done in Matlab using theMoCap Toolbox [12].
To illustrate how the normalized position data looks like,Figure 3 shows plots of position on the three axes overtime, as well as position spatial plots of the three planes.
1 This paper is based on the complete dataset, while a subset was usedfor the qualitative analysis presented in [10].
2 See http://www.uio.no/english/research/groups/fourms/downloads/motion-capture/nm2012/ for detailedinformation about the music excerpts.
Figure 3. Example plots of the X (sideways), Y (front-back) and Z (updown) axes of the normalized position of ahead marker. The light grey line is the raw data; the blackline results from a ten-second smoothing; and the red lineshows the linear regression (the trend) of the dataset.
3. RESULTS
3.1 Quantity of motion
To answer the question of how much people move, we cal-culated the quantity of motion (QoM) of each reflectivemarker by summing up all the differences of consecutivesamples for the magnitude of the position vector, that is,the first derivative of the position:
QoM = 1T
N∑n=2‖ p(n)− p(n− 1) ‖
where p is either the two-dimensional (XY axes—the hor-izontal plane) or three-dimensional (XYZ axes) positionvector of a marker, N is the total number of samples and Tis the total duration of the recording. The resultant QoM ismeasured in millimetres per second (mm/s).
In our previous studies [8, 9], we found QoM values inthe range of 5–7 mm/s for a small group of people. Ournew results confirm this range, with an average QoM of6.5 mm/s (SD = 1.6 mm/s) over the complete recording, assummarised in Table 1. The lowest result was 3.9 mm/s(the winner!) and the highest was 13.7 mm/s. These val-ues, however, included both the no-sound and sound con-ditions, so Table 1 also shows a breakdown of the valuesin these two conditions, as well as for the individual soundtracks. These differences will be further discussed in Sec-tion 3.5.
3.2 Motion over time
An interesting finding is that, for most participants, thequantity of motion did not change much over time, whichcan also be seen in the cumulative distance plots in Fig-ure 4. There were a few extreme cases, but most partic-ipants had consistent linear motion distribution over time.Coefficient of determination (R-Squared) values were above0.9 for most participants (mean R2 = 0.94, s.d. R2 = 0.0039minimum R2= 0.93).
Proceedings of the 14th Sound and Music Computing Conference, July 5-8, Espoo, Finland
SMC2017-196
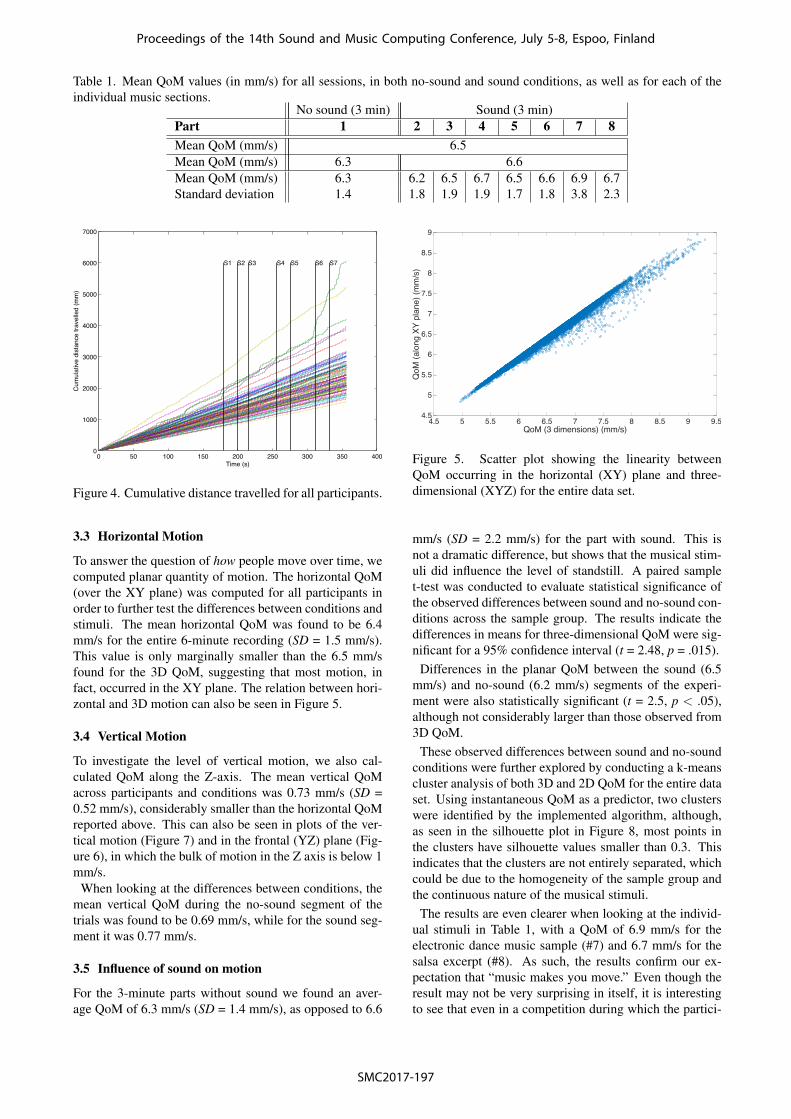
Table 1. Mean QoM values (in mm/s) for all sessions, in both no-sound and sound conditions, as well as for each of theindividual music sections.
No sound (3 min) Sound (3 min)Part 1 2 3 4 5 6 7 8Mean QoM (mm/s) 6.5Mean QoM (mm/s) 6.3 6.6Mean QoM (mm/s) 6.3 6.2 6.5 6.7 6.5 6.6 6.9 6.7Standard deviation 1.4 1.8 1.9 1.9 1.7 1.8 3.8 2.3
0 50 100 150 200 250 300 350 4000
1000
2000
3000
4000
5000
6000
7000
Time (s)
Cum
ulat
ive
dist
ance
trav
elle
d (m
m)
S1 S2 S3 S4 S5 S6 S7
Figure 4. Cumulative distance travelled for all participants.
3.3 Horizontal Motion
To answer the question of how people move over time, wecomputed planar quantity of motion. The horizontal QoM(over the XY plane) was computed for all participants inorder to further test the differences between conditions andstimuli. The mean horizontal QoM was found to be 6.4mm/s for the entire 6-minute recording (SD = 1.5 mm/s).This value is only marginally smaller than the 6.5 mm/sfound for the 3D QoM, suggesting that most motion, infact, occurred in the XY plane. The relation between hori-zontal and 3D motion can also be seen in Figure 5.
3.4 Vertical Motion
To investigate the level of vertical motion, we also cal-culated QoM along the Z-axis. The mean vertical QoMacross participants and conditions was 0.73 mm/s (SD =0.52 mm/s), considerably smaller than the horizontal QoMreported above. This can also be seen in plots of the ver-tical motion (Figure 7) and in the frontal (YZ) plane (Fig-ure 6), in which the bulk of motion in the Z axis is below 1mm/s.
When looking at the differences between conditions, themean vertical QoM during the no-sound segment of thetrials was found to be 0.69 mm/s, while for the sound seg-ment it was 0.77 mm/s.
3.5 Influence of sound on motion
For the 3-minute parts without sound we found an aver-age QoM of 6.3 mm/s (SD = 1.4 mm/s), as opposed to 6.6
4.5 5 5.5 6 6.5 7 7.5 8 8.5 9 9.5QoM (3 dimensions) (mm/s)
4.5
5
5.5
6
6.5
7
7.5
8
8.5
9
QoM
(alo
ng X
Y pl
ane)
(mm
/s)
Figure 5. Scatter plot showing the linearity betweenQoM occurring in the horizontal (XY) plane and three-dimensional (XYZ) for the entire data set.
mm/s (SD = 2.2 mm/s) for the part with sound. This isnot a dramatic difference, but shows that the musical stim-uli did influence the level of standstill. A paired samplet-test was conducted to evaluate statistical significance ofthe observed differences between sound and no-sound con-ditions across the sample group. The results indicate thedifferences in means for three-dimensional QoM were sig-nificant for a 95% confidence interval (t = 2.48, p = .015).
Differences in the planar QoM between the sound (6.5mm/s) and no-sound (6.2 mm/s) segments of the experi-ment were also statistically significant (t = 2.5, p < .05),although not considerably larger than those observed from3D QoM.
These observed differences between sound and no-soundconditions were further explored by conducting a k-meanscluster analysis of both 3D and 2D QoM for the entire dataset. Using instantaneous QoM as a predictor, two clusterswere identified by the implemented algorithm, although,as seen in the silhouette plot in Figure 8, most points inthe clusters have silhouette values smaller than 0.3. Thisindicates that the clusters are not entirely separated, whichcould be due to the homogeneity of the sample group andthe continuous nature of the musical stimuli.
The results are even clearer when looking at the individ-ual stimuli in Table 1, with a QoM of 6.9 mm/s for theelectronic dance music sample (#7) and 6.7 mm/s for thesalsa excerpt (#8). As such, the results confirm our ex-pectation that “music makes you move.” Even though theresult may not be very surprising in itself, it is interestingto see that even in a competition during which the partici-
Proceedings of the 14th Sound and Music Computing Conference, July 5-8, Espoo, Finland
SMC2017-197

3.5 4 4.5 5 5.5 6 6.5 7 7.5QoM along Y axis (mm/s)
0.4
0.6
0.8
1
1.2
1.4
1.6
1.8
2
2.2
2.4Q
oM a
long
Z a
xis
(mm
/s)
Figure 6. Plot showing QoM in the vertical plane (YZ) forthe entire data set. The majority of the motion along thisdirection was below 1 mm/s.
0 50 100 150 200 250 300Time (s)
1400
1500
1600
1700
1800
1900
2000
Positio
n a
long Z
axis
(m
m)
Figure 7. Instantaneous position of the marker along the Zaxis (vertical direction).
pants actively try to stand absolutely still, the music has aninfluence on their motion in what can be termed ”micro”level.
3.6 Age, Height and Gender
We found a significant negative correlation between the av-erage QoM results and the participants’ age. Generally,younger participants tended to move more (r = -.278, p <.01), both in the no-sound (r = -.283, p < .01) and soundconditions (r = -.255, p < .05). From the reported demo-graphic information, we also found that the younger par-ticipants listened to music more frequently (r = -,267, p <.05) and exercised more (r = -.208, p < .05). The youngerparticipants also reported feeling less tired during the ex-periment (r = -.35, p < .001), subjectively experiencedgreater motion (r = -.215, p < .05), and also reported mov-ing more when sound was being played (r = -.22, p < .05).
Unexpectedly, the QoM results did not correlate with theparticipants’ height, which was estimated by calculatingthe average of each participant’s Z-axis values. Due toa lower centre of mass, we would have expected to seeshorter people with lower QoM results. However, the win-ner was 192 cm tall, while the runner-up was 165 cm.
Also, there were no significant differences in performancebetween male and female participants (no difference in av-erage QoM, QoM in silence, QoM in music or QoM be-tween both conditions).
0 0.2 0.4 0.6 0.8 1Silhouette Value
1
2
Clu
ste
r
Figure 8. Silhouette plot from k means clustering analysisof QoM along the XY plane for the entire data set.
3.7 Effects of group, posture and physical activity
Aiming to evaluate the effects of standing strategies andpostures, the participants were allowed to choose their stand-ing posture during the experiment. In the post-experimentquestionnaire they were asked to self-report on whetherthey were standing with their eyes open or closed, andwhether they had their knees locked. The majority of theparticipants reported that they stood with open eyes (N =62 versus N = 4 for closed eyes, and N = 8 for those whoswitched between eyes opened and closed during the ex-periment). Furthermore, 33 of the participants reportedstanding with locked knees, 31 switched between open andlocked knees and 10 reported standing with their kneesopen. A 1-way ANOVA was performed to test if any ofthese factors influenced the average QoM of the partici-pants, but showed no statistically significant results.
Interestingly, the participants who reported greater amountof time spent doing physical exercise tended to move moreduring the experiment (r = -.299, p < .01). This tendencywas particularly evident during the no-sound section (r =-.337, p < .01), but it was also observed during the soundsection (r = -.251, p = < .05).
Additionally, we compared the average QoM results forall conditions (no-sound, sound, average no-sound and sound,and computed difference between sound and no-sound con-ditions) between groups of participants. Participants weresplit into 10 groups of varying age (F(8, 82) = 3.43, p <.05), experience with performing , composing or produc-ing music (F(8, 82) = 2.4, p < .05), size (min = 5, max= 17) and the proportion of gender. We found no statis-tically significant differences between groups across thesecharacteristics.
3.8 Subjective experience of motion
After taking part in the experiment the participants wereasked to estimate how much they moved, to what extentthe music influenced their movement, and how tiresomethe experience felt. Overall, the self-reported tirednessshowed some correlation with self-reported motion (r =-.44, p < .001) and with the self-reported experience ofmoving more to music (r = -.289, p < .01). The kinematicdata confirmed this sensation: the more tired the partici-pants felt, the more they moved to music (r = -.228, p <.05) and the greater was the difference in motion to soundcompared to the no-sound conditions (r = -.311, p < .01).More importantly, although the subjective experience ofmotion did not correlate with the measured level of mo-
Proceedings of the 14th Sound and Music Computing Conference, July 5-8, Espoo, Finland
SMC2017-198
tion, the participants who reported moving more to musicdid move more during the sound condition when comparedto the no-sound condition (r = -.239, p < .05 for the differ-ence in QoM between music and silence).
4. CONCLUSIONS
This study was aimed at further exploring the magnitude ofmicromotion and the influence of music on human stand-still, based on the preliminary work presented in [10]. Quan-tity of motion (QoM) was shown to be a sensitive measureof micromotion for the conditions under analysis. Thecomputation of both three-dimensional and planar QoMshowed that micromotion occurred mainly on the horizon-tal plane. Additionally, statistically significant differenceswere found between no-sound and sound conditions acrossthe dataset. Two clusters were identified in the data throughk-means cluster analysis, although most points in the clus-ters had silhouette values below 0.4. This could be dueto the continuous nature of the sound stimuli and the small(although statistically significant) differences between con-ditions.
The analysis revealed some relationships between QoMdata and the self-reported characteristics of physical activ-ity and demographic information. People who exercisedregularly found it more difficult to stand still. Moreover,younger participants tended to move more during both no-sound and sound conditions. These results may suggestthat people who tend to be more active struggle to reachand maintain a complete standstill posture, although theymight be able to stand normally for longer periods of timeand with greater balance. The correlation found betweenself-reported tiredness and both self-reported and measuredmotion can not be considered conclusive and further stud-ies will focus on a more in depth assessment of the ef-fects of tiredness in combination with sound stimuli duringstandstill.
The fact that there were no significant QoM differencesbetween the groups of participants, indicates that testingvarying number of participants at once is a viable way totest our hypotheses. Future work will focus on studyinglarger sample groups and use different stimuli, with a fo-cus on investigating in more depth how different musicalfeatures influence the micromotion of people standing still.
Acknowledgments
This research has been supported by the Norwegian Re-search Council (#250698) and Arts Council Norway.
5. REFERENCES
[1] M. Leman, Embodied music cognition and mediationtechnology. Cambridge, Mass.: MIT Press, 2008.
[2] R. I. Godoy and M. Leman, Eds., Musical Gestures:Sound, Movement, and Meaning. New York: Rout-ledge, 2010.
[3] P. Toiviainen, G. Luck, and M. Thompson, “Embodiedmeter: Hierarchical eigenmodes in music-induced
movement,” Music Perception, vol. 28, no. 1, pp.59–70, 2010. [Online]. Available: http://mp.ucpress.edu/content/28/1/59
[4] B. Burger, M. R. Thompson, G. Luck, S. Saarikallio,and P. Toiviainen, “Influences of Rhythm- and Timbre-Related Musical Features on Characteristics of Music-Induced Movement,” Frontiers in Psychology, vol. 4,2013. [Online]. Available: http://journal.frontiersin.org/article/10.3389/fpsyg.2013.00183/abstract
[5] M. Peckel, T. Pozzo, and E. Bigand, “The impact of theperception of rhythmic music on self-paced oscillatorymovements,” Frontiers in Psychology, vol. 5, Sep.2014. [Online]. Available: http://journal.frontiersin.org/journal/10.3389/fpsyg.2014.01037/full
[6] F. Styns, L. van Noorden, D. Moelants, andM. Leman, “Walking on music,” Human MovementScience, vol. 26, no. 5, pp. 769–785, 2007. [Online].Available: http://linkinghub.elsevier.com/retrieve/pii/S0167945707000589
[7] Y.-H. Su and E. Poppel, “Body movement enhancesthe extraction of temporal structures in auditorysequences,” Psychological Research, vol. 76, no. 3,pp. 373–382, May 2012. [Online]. Available: http://link.springer.com/10.1007/s00426-011-0346-3
[8] A. R. Jensenius and K. A. V. Bjerkestrand, “Exploringmicromovements with motion capture and sonifica-tion,” in Arts and Technology, Revised Selected Papers,ser. LNICST, A. L. Brooks, Ed. Berlin: Springer,2012, vol. 101, pp. 100–107. [Online]. Available: http://www.springerlink.com/content/j04650123p105646/
[9] A. R. Jensenius, K. A. V. Bjerkestrand, and V. Johnson,“How still is still? Exploring human standstill forartistic applications,” International Journal of Arts andTechnology, vol. 7, no. 2/3, p. 207, 2014. [Online].Available: http://www.inderscience.com/link.php?id=60943
[10] A. R. Jensenius, “Exploring music-related micro-motion,” in Body, Sound and Space in Music andBeyond: Multimodal Explorations. Routledge,2017, pp. 29–48, https://www.routledge.com/Body-Sound-and-Space-in-Music-and-Beyond-Multimodal-Explorations/Wollner/p/book/9781472485403.
[11] A. R. Jensenius, K. Nymoen, S. Skogstad, andA. Voldsund, “A Study of the Noise-Level in TwoInfrared Marker-Based Motion Capture Systems,” inProceedings of the Sound and Music Computing Con-ference, Copenhagen, 2012, pp. 258–263. [Online].Available: http://urn.nb.no/URN:NBN:no-31295
[12] B. Burger and P. Toiviainen, “MoCap Toolbox -A Matlab toolbox for computational analysis ofmovement data,” in Proceedings of the Sound andMusic Computing Conference, 2013, pp. 172–178.[Online]. Available: https://jyx.jyu.fi/dspace/handle/123456789/42837
Proceedings of the 14th Sound and Music Computing Conference, July 5-8, Espoo, Finland
SMC2017-199


![Micromotion Feature Extraction of Space Target Based on ...downloads.hindawi.com/journals/js/2017/8723042.pdf · micromotion such as spinning, precession, and rolling, in additiontothebodytranslation[2].Thesemicromotionswill](https://img.dokumen.tips/doc/110x75/5ebd40d7c46e79356f5cbab3/micromotion-feature-extraction-of-space-target-based-on-micromotion-such-as.jpg)