Embed Size (px)
Citation preview
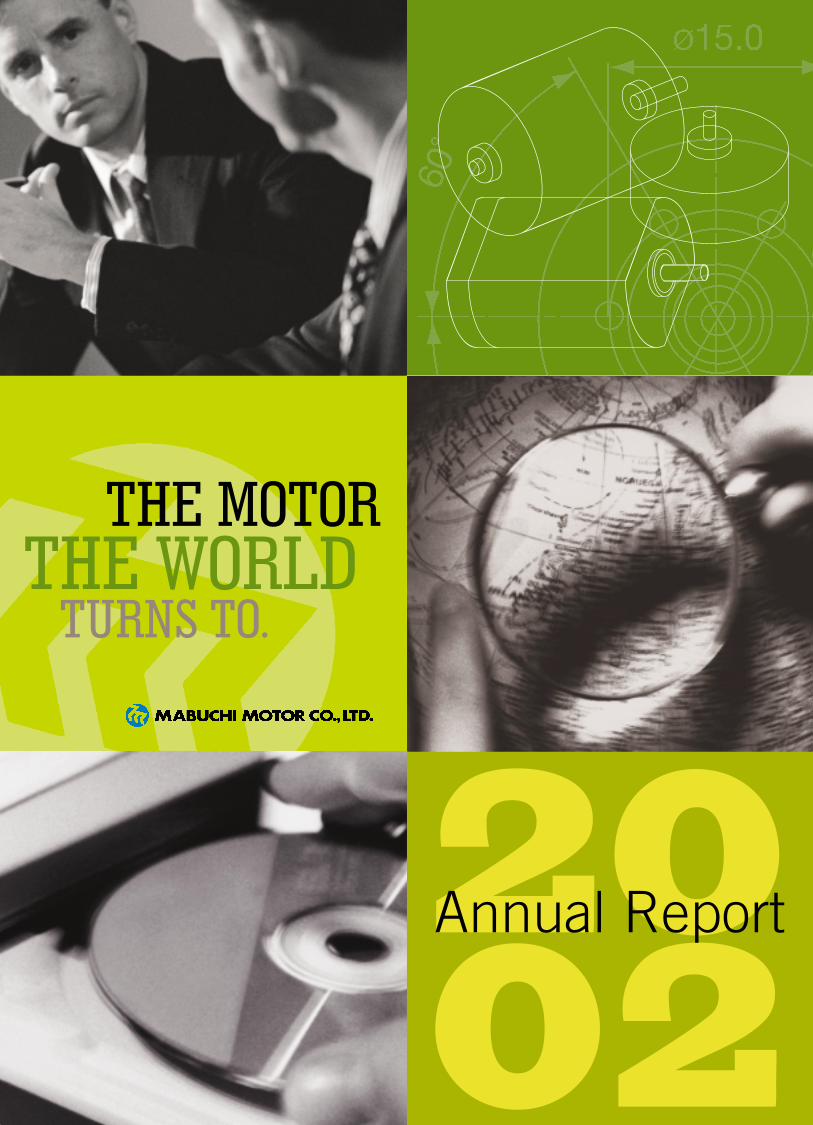
2002
THE WORLDTHE MOTOR
TURNS TO.
Annual Report

Contents
Financial Highl ights 1
Letter to Shareholders 2
About Mabuchi Motor 4
Financial Review 6
Five-Year F inancial Summary 9
Consol idated Balance Sheets 1 0
Consol idated Statements of Income 1 2
Consol idated Statements of 1 3
Shareholders ’ Equity
Consol idated Statements of Cash F lows 1 4
Notes to Consol idated F inancial 1 5
Statements
Independent Auditors ’ Report 2 3
Board of Di rectors / Corporate Di rectory 2 4
Investor Information 2 5
Net Sales ( ¥ in mi l l ions )
22002 116,3572001 105,1292000 116,2331999 117,5451998 124,652
MOTOR CO.MABUCHI
LTD.

$¥Yen U.S. Dollars(millions) (thousands)
2 0 0 0 2 0 0 1 2 0 0 2 2 0 0 2
Net sales ¥ 116,233 ¥ 105,129 ¥ 116,357 $ 969,642
Operating income 28,624 22,079 29,123 242,692
Income before income taxes 33,644 23,495 27,968 233,067and minority interests
Net income 23,472 16,281 18,025 150,208
Shareholders’ equity 218,472 241,860 224,315 1,869,292
Total assets 242,626 260,329 244,988 2,041,567
Per share of common stock: Yen U.S. Dollars
Net income ¥ 498.61 ¥ 345.85 ¥ 392.13 $ 3.27
Cash dividends 75.00 67.00 70.00 0.58
N O T E S : 1. U.S. dollar amounts have been translated from yen, for convenience only, at the rate of ¥120=U.S. $1, the approximate
exchange rate on December 31, 2002.
2. Net income per share figures are based on the weighted average number of shares of common stock outstanding during
each fiscal year.
1
Net Income( ¥ in mi l l ions )
002002 18,0252001 16,2812000 23,4721999 18,7931998 17,016
Net Income Per Share( ¥ )
22002 392.132001 345.852000 498.611999 399.201998 362.00
2002 Financial HighlightsMABUCHI MOTOR CO., LTD.

2
DDear Shareholder:
Harsh global economic conditions in 2002 tested the mettle of even the most robust businesses. Indeed, few fared
as well as Mabuchi Motor. The leading producer of small direct current motors, we touch the lives of millions of
people around the world every day. It has been our profound and abiding commitment to build a transparent and
highly efficient global management structure in order to fulfill our mission year in and year out. By meeting the
prevailing economic challenges head-on, Mabuchi has successfully demonstrated the strength and wisdom of our
management vision.
It brings us great pleasure to report a 10.7% increase in net income over the preceding year. Mabuchi earnings settled at
18,025 million yen or 392.13 yen per share, and total unit sales climbed to an all-time high of 1.746 billion motors. Total sales
for fiscal year 2002 came in at 116,357 million yen. A base dividend per share of 50 yen with a supplemental dividend of 20
yen totaled 70 yen per share.
We are also proud to announce that Mabuchi Motor has been named one of Japan’s Top Ten Excellent Companies
Building Global Business Models by the Japanese government’s Council on Economic and Fiscal Policy. This
accolade has provided a welcome validation of our efforts, and has augmented an already steadfast determination
to persist in our endeavors. Honoring our continuing commitment to the field of education and the development of
young minds, we participated this past year in the sponsorship of events such as the ABU Asia Pacific Robot
Contest and the National Technical College Robot Contest.
In 2004, Mabuchi Motor will celebrate its 50th anniversary. Beyond the evolution and reform of our management and
business, in which we are continually engaged, we have set ambitious new goals. Our Innovation 2005 initiative scheduled for
completion by the end of that year will encompass the following projects developed to intensify the synergy between all
Mabuchi Motor activities:
• Reconstruction and Reallocation of our Global Functions and Operating Systems.
• Strengthening Product Planning and Cost Planning Strategies.
• Reconfiguring our Management Information System to achieve maximum flexibility and optimize
all aspects of our business.
• Erecting a new Global Headquarters to serve as the heart and hub of all future worldwide operations,
and the wellspring of discovery, dedication, and renewed purpose.
By all indications, recovery from a distressed Japanese economy and a slumping world economy is going to take time.
Assuming our role as a leader in the global marketplace, we will strive to develop strategies to support growth in this difficult
climate. We will actively observe the market, adapt and respond to changing conditions, further secure our management
foundation, and resolutely forge ahead towards the continued realization of our management goals.
Finally, you will notice that this letter is jointly signed by Chairman and President newly elected by the Board of
Directors after the shareholders’ meeting held this morning. It reflects our unwavering commitment to this compa-
ny’s greatest ideal of contributing with all our efforts to a better world. It is a philosophy that we have embraced with
ardor and pride since our founding, and which we pledge to honor with even greater determination going forward.
Takaichi Mabuchi - Chairman
Shinji Kamei - President
March 28, 2003
2002 Letter to ShareholdersMABUCHI MOTOR CO., LTD.

OVERVIEWCORPORATE
INFORMATIONCORPORATE
Board of Di rectors / 2 4Corporate Di rectory
Investor Informaton 2 5
Financial Review 6
Five-Year F inancial Summary 9
Consol idated Balance Sheets 1 0
Consol idated Statements of Income 1 2
Consol idated Statements of 1 3Shareholders ’ Equity
Consol idated Statements of Cash F lows 1 4
Notes to Consol idated F inancial 1 5Statements
Independent Auditors ’ Report 2 3
About Mabuchi Motor 4
FINANCIALSECTION
4
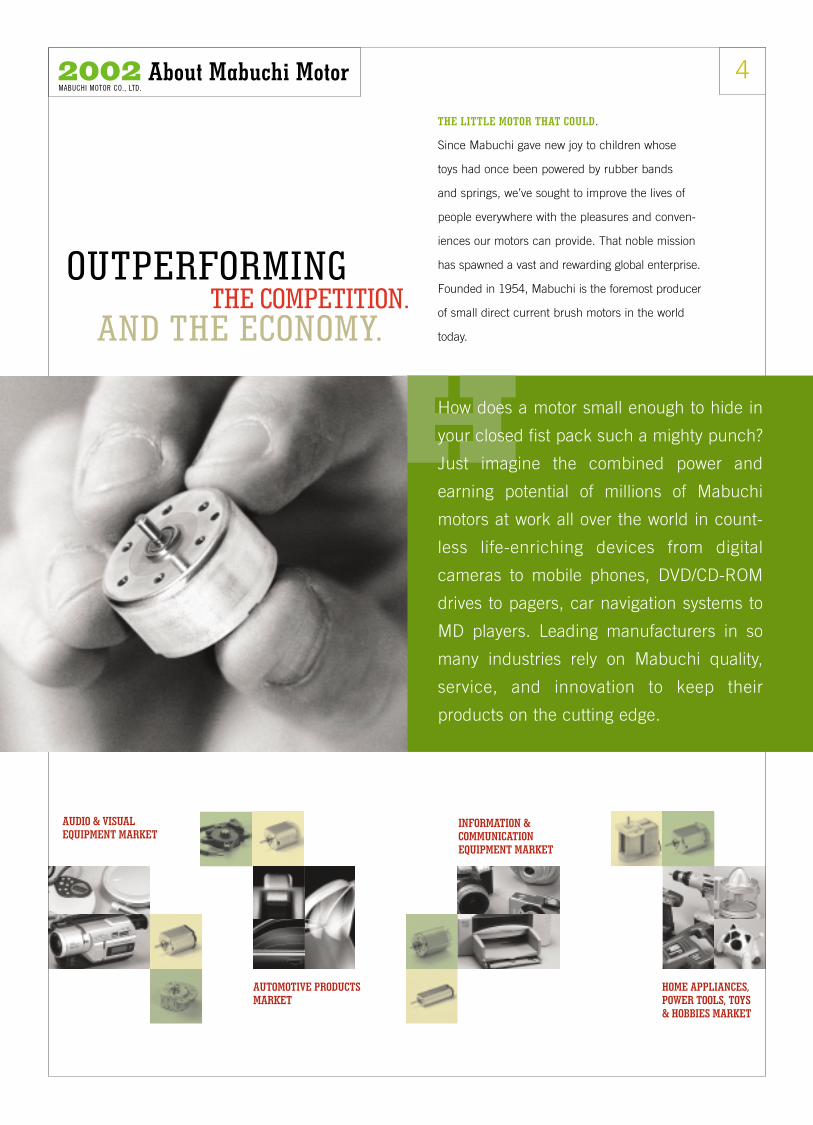
THE LITTLE MOTOR THAT COULD.
Since Mabuchi gave new joy to children whose
toys had once been powered by rubber bands
and springs, we’ve sought to improve the lives of
people everywhere with the pleasures and conven-
iences our motors can provide. That noble mission
has spawned a vast and rewarding global enterprise.
Founded in 1954, Mabuchi is the foremost producer
of small direct current brush motors in the world
today.
HHow does a motor small enough to hide in
your closed fist pack such a mighty punch?
Just imagine the combined power and
earning potential of millions of Mabuchi
motors at work all over the world in count-
less life-enriching devices from digital
cameras to mobile phones, DVD/CD-ROM
drives to pagers, car navigation systems to
MD players. Leading manufacturers in so
many industries rely on Mabuchi quality,
service, and innovation to keep their
products on the cutting edge.
AND THE ECONOMY.
OUTPERFORMINGTHE COMPETITION.
AUDIO & VISUAL EQUIPMENT MARKET
INFORMATION & COMMUNICATION EQUIPMENT MARKET
HOME APPLIANCES, POWER TOOLS, TOYS & HOBBIES MARKET
AUTOMOTIVE PRODUCTS MARKET
2002 About Mabuchi MotorMABUCHI MOTOR CO., LTD.

M A B U C H I M O T O R C O . , LT D .
5
PUTTING OUR CUSTOMER FIRST. EVERY STEP OF THE WAY.
First we develop a motor to meet the customer’s
exact performance specifications. Then we make
that motor work in as many diverse applications as
possible so we can mass-produce it at a much lower
cost per unit. Next comes quality control manage-
ment so stringent it’s won two ISO accreditations
from the Dutch Council for Certification. Finally, our
exact delivery schedules ensure that our customers
get their own products to market on time. From start
to finish, no Mabuchi Motor customer ever gets
anything less.
ACCEPTING NO LIMITS. ACKNOWLEDGING NO BORDERS.
Anticipating a global marketplace, Mabuchi estab-
lished its first overseas office in 1964. And we’ve
been aggressively expanding our production, supply,
and sales network ever since. With a presence
throughout Asia, as well as in Europe and the U.S.,
we’re optimally poised to serve the world’s markets
and meet the ever- increasing demand for low-
priced, high-performance motors.
PROFITING FROM OUR PRINCIPLES.
From the very beginning, our philosophy of contrib-
uting to a better tomorrow has guided everything we
do. Never content to rest on our laurels, we continu-
ally strive to lead the way in product development,
manufacturing capability, environmental responsibili-
ty, and superior performance. The relentless pursuit
of perfection is the key to our success.

$¥
6
Yen U.S. Dollars(millions) (thousands)
1 9 9 8 1 9 9 9 2 0 0 0 2 0 0 1 2 0 0 2 2 0 0 2
Audio-Visual Equipment ¥ 49,013 ¥ 46,207 ¥ 45,068 ¥ 38,663 ¥ 44,801 $ 373,342
Automotive Products 27,808 27,598 26,758 25,907 29,603 246,692
Information & 18,033 16,399 17,830 14,051 16,240 135,333Communication Equipment
Home Appliances & 29,611 27,266 26,529 26,451 25,688 214,067Power Tools & Others
Other* 187 75 48 57 25 208
Total ¥ 124,652 ¥ 117,545 ¥ 116,233 ¥ 105,129 ¥ 116,357 $ 969,642
*Other includes parts and equipment sales.
NET SALES BY APPLICATIONYears ended December 31
NET SALES
In fiscal 2002, consolidated sales amounted to ¥116,357 million
($970 million), increase 10.7% from the previous year due primarily
to increased sales in Audio/Visual Equipment, Information and
Communication, and Automotive Product markets, supported by
steady demand.
Following is the trend of our markets by application in 2002:
AUDIO & VISUAL EQUIPMENT
Motor sales for DVD/CD soared 15.9% to ¥44,801 million ($373
million) due to the making a round of production control by major
customers.
AUTOMOTIVE PRODUCTS
Motor sales for all main items such as air-conditioning damper
actuators, door lock, retractable rear view mirrors and motor
unit for power window lifters increased 14.3% to ¥29,603 million
($247 million) due to a strong demand.
INFORMATION AND COMMUNICATION EQUIPMENT
Motor sales for printers were increased 15.6% to ¥16,240 million
($135 milion) in spite of a decrease in sales for other items.
HOME APPLIANCES AND POWER TOOLS AND OTHERS
Motor sales were brisk but total sales decreased 2.9% to
¥25,688 million ($214 million) due to a decrease in demand for
hair dryer, shaver and toothbrushes.
39% 25% 14%22%AUDIO-VISUAL EQUIPMENT AUTOMOTIVE PRODUCTS HOME APPLIANCES & INFORMATION &
POWER TOOLS & OTHERS COMMUNICATION EQUIPMENT
140,000
120,000
100,000
80,000
60,000
40,000
20,000
0
9 8 9 9 0 0 0 1 0 2
2002 Financial ReviewMABUCHI MOTOR CO., LTD.
7
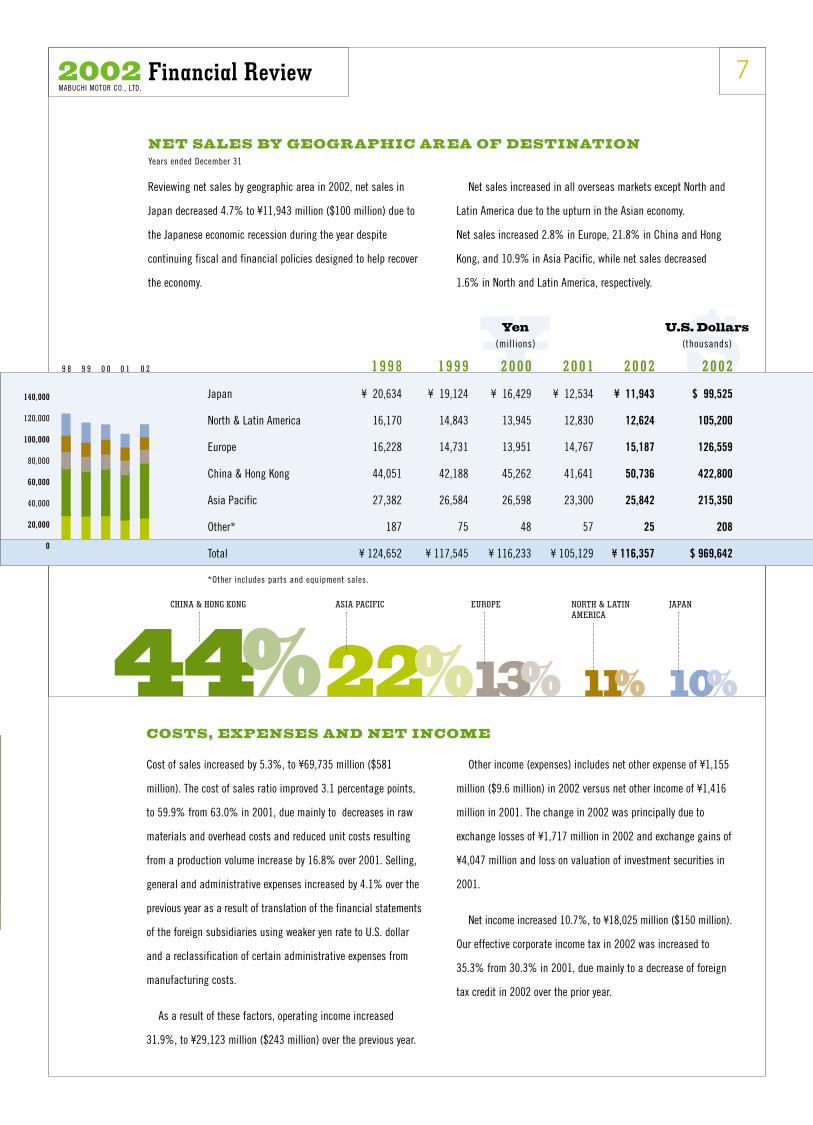
NET SALES BY GEOGRAPHIC AREA OF DESTINATIONYears ended December 31
COSTS, EXPENSES AND NET INCOME
Reviewing net sales by geographic area in 2002, net sales in
Japan decreased 4.7% to ¥11,943 million ($100 million) due to
the Japanese economic recession during the year despite
continuing fiscal and financial policies designed to help recover
the economy.
Net sales increased in all overseas markets except North and
Latin America due to the upturn in the Asian economy.
Net sales increased 2.8% in Europe, 21.8% in China and Hong
Kong, and 10.9% in Asia Pacific, while net sales decreased
1.6% in North and Latin America, respectively.
Cost of sales increased by 5.3%, to ¥69,735 million ($581
million). The cost of sales ratio improved 3.1 percentage points,
to 59.9% from 63.0% in 2001, due mainly to decreases in raw
materials and overhead costs and reduced unit costs resulting
from a production volume increase by 16.8% over 2001. Selling,
general and administrative expenses increased by 4.1% over the
previous year as a result of translation of the financial statements
of the foreign subsidiaries using weaker yen rate to U.S. dollar
and a reclassification of certain administrative expenses from
manufacturing costs.
As a result of these factors, operating income increased
31.9%, to ¥29,123 million ($243 million) over the previous year.
Other income (expenses) includes net other expense of ¥1,155
million ($9.6 million) in 2002 versus net other income of ¥1,416
million in 2001. The change in 2002 was principally due to
exchange losses of ¥1,717 million in 2002 and exchange gains of
¥4,047 million and loss on valuation of investment securities in
2001.
Net income increased 10.7%, to ¥18,025 million ($150 million).
Our effective corporate income tax in 2002 was increased to
35.3% from 30.3% in 2001, due mainly to a decrease of foreign
tax credit in 2002 over the prior year.
$¥Yen U.S. Dollars(millions) (thousands)
1 9 9 8 1 9 9 9 2 0 0 0 2 0 0 1 2 0 0 2 2 0 0 2
Japan ¥ 20,634 ¥ 19,124 ¥ 16,429 ¥ 12,534 ¥ 11,943 $ 99,525
North & Latin America 16,170 14,843 13,945 12,830 12,624 105,200
Europe 16,228 14,731 13,951 14,767 15,187 126,559
China & Hong Kong 44,051 42,188 45,262 41,641 50,736 422,800
Asia Pacific 27,382 26,584 26,598 23,300 25,842 215,350
Other* 187 75 48 57 25 208
Total ¥ 124,652 ¥ 117,545 ¥ 116,233 ¥ 105,129 ¥ 116,357 $ 969,642
*Other includes parts and equipment sales.
44%22%13% 11% 10%
CHINA & HONG KONG ASIA PACIFIC EUROPE NORTH & LATIN JAPANAMERICA
140,000
120,000
100,000
80,000
60,000
40,000
20,000
0
9 8 9 9 0 0 0 1 0 2
2002 Financial ReviewMABUCHI MOTOR CO., LTD.

$¥
8
FOREIGN CURRENCY
As indicated in Note 9 “Segment Information” to consolidated financial statements, overseas sales accounted for approximately 90% of
consolidated net sales in 2002, of which 93% was transacted by the U.S. dollar and U.S. dollar linked currencies.
In 2002, the average rate of the yen depreciated approximately 3.1% against the U.S. dollar, compared with 2001. The depreciation of
the yen against the foreign currencies resulted in increases of net sales of approximately ¥4,200 million ($35 million) and operating
income of ¥2,500 million ($21 million), respectively.
The Company uses foreign exchange forward contracts to hedge foreign exchange risks associated with accounts receivable and
payables denominated in foreign currencies (see Note 7 “Derivative Financial Instruments”).
FINANCIAL POSITION
Net working capital at December 31, 2001 and 2002
is summarized as follows (millions of yen):
The decrease in current assets at December 31, 2002 consisted mainly of a decrease of cash and cash equivalents by ¥3,366 million, an
increase of short-term investments by ¥6,163 million, and a decrease of inventories by ¥5,930 million. The decrease of cash and cash
equivalents was due to purchase of treasury stock of ¥23,800 million in June 2002 by tender offer.
Long-term liabilities increased by ¥326 million due mainly to an increase of deferred tax liability on undistributed earnings of foreign
subsidiaries.
Shareholders’ equity decreased by ¥17,545 million due primarily to the purchase of treasury stock mentioned above and a decrease of
foreign currency translation adjustments by ¥7,880 million over the previous year. As a result, the shareholders’ equity ratio declined 1.3
percentage points, to 91.6% from 92.9% at the previous year-end.
CASH FLOW
The major items of cash flows for the years ended December 31, 2001
and 2002 are summarized below:
2 0 0 1 2 0 0 2 2 0 0 2Net income ¥ 16,281 ¥ 18,025 $ 150,208
Depreciation 6,600 6,337 52,808
Additions to plant and equipment (5,145) (5,952) (49,600)
Change in short-term investments and investment securities, net (1,744) 2,292 19,100
Cash dividends paid (3,482) (3,083) (25,692)
Purchase of treasury stock (4) (23,896) (199,133)
Effect of exchange rate changes on cash and cash equivalents 5,162 (6,029) (50,242)
Other, net 6,286 8,940 74,501
Net increase (decrease) in cash and cash equivalents ¥ 23,954 ¥ (3,366) $ (28,050)
Net cash provided by operating activities increased ¥5,363 million from 2001, to ¥35,433 million ($295 million) due mainly to increases
in net income and accrued income taxes and a decrease in inventories resulting from the robust operating performance in 2002.
Net cash used in investing activities decreased ¥2,001 million from 2001, to ¥5,791 million ($48 million) which was attributable to a
decrease in purchase of investment securities in connection with the purchase of treasury stock in 2002.
Net cash used in financing activities increased ¥23,943 million from 2001, to ¥26,979 million ($225 million) due to the purchase of
treasury stock of ¥23,800 million in June 2002 by tender offer.
The Company believes that its financial condition remains very strong. The present balance of liquid assets are indispensable for the
Company to further strengthen its existing core business and create the opportunities for new business. This should absolutely help
appreciate our shareholder value.
Yen U.S. Dollars(millions) (thousands)
I n c r e a s e2 0 0 1 2 0 0 2 ( D e c r e a s e )
Current assets ¥ 132,144 ¥ 131,065 ¥ (1,079)
Current liabilities 9,465 11,462 1,997
Net working capital ¥ 122,679 ¥ 119,603 ¥ (3,076)
Current ratio 14.0 11.4
2002 Financial ReviewMABUCHI MOTOR CO., LTD. & CONSOLIDATED SUBSIDIARIES • YEARS ENDED DECEMBER 31

$¥
9
1 9 9 8 1 9 9 9 2 0 0 0 2 0 0 1 2 0 0 2 2 0 0 2Operating Results
Net sales ¥ 124,652 ¥ 117,545 ¥ 116,233 ¥ 105,129 ¥ 116,357 $ 969,642
Operating income 28,300 28,481 28,624 22,079 29,123 242,692
Income before income taxes 28,487 28,498 33,644 23,495 27,968 233,067
and minority interests
Net income 17,016 18,793 23,472 16,281 18,025 150,208
Per share of common stock:
Net income ¥ 362.00 ¥ 399.20 ¥ 498.61 ¥ 345.85 ¥ 392.13 $ 3.27
(Yen and U.S. Dollars)
Cash dividends per share 45.00 70.00 75.00 67.00 70.00 0.58
(Yen and U.S. Dollars)
Depreciation and amortization ¥ 7,314 ¥ 7,234 ¥ 6,425 ¥ 6,600 ¥ 6,337 $ 52,808
Capital expenditures 6,832 4,051 4,627 5,132 6,278 52,317
R&D expenses 3,780 3,752 2,832 3,422 3,536 29,467
Balance Sheet
Shareholders' equity ¥ 187,841 ¥ 204,403 ¥ 218,472 ¥ 241,860 ¥ 224,315 $ 1,869,292
Total assets ¥ 207,682 ¥ 218,083 ¥ 242,626 ¥ 260,329 ¥ 244,988 $ 2,041,567
Other Data
Number of shares outstanding 47,076 47,076 47,076 47,076 45,967
(thousands of shares)
Number of employees 55,530 58,279 60,511 45,203 50,762
N O T E S : 1. U.S. dollar amounts have been translated from yen, for convenience only, at the rate of ¥120=U.S. $1, the approximate exchange rate
on December 31, 2002.
2. Net income per share figures are based on the weighted average number of shares of common stock outstanding during each fiscal
year.
3. Number of employees includes contract manufacturing labor at plants in Guang Dong, China.
4. Effective 2000, the Company adopted a new accounting standard for research and development costs.
The Company changed the previous scope of such costs to disclose only costs incurred in research and development activities for new
products and processes. Those costs based on the previous scope in 2000 were ¥4,456.
Yen U.S. Dollars(millions) (thousands)
2002 Five-Year Financial SummaryMABUCHI MOTOR CO., LTD. & CONSOLIDATED SUBSIDIARIES • YEARS ENDED DECEMBER 31

$¥
10
ASSETS
2 0 0 1 2 0 0 2 2 0 0 2Current Assets:
Cash and cash equivalents ¥ 84,224 ¥ 80,858 $ 673,817
Short-term investments 5,990 12,153 101,275
Trade notes and accounts receivable 13,088 13,811 115,092
Less-Allowance for doubtful receivables (425) (351) (2,925)
Inventories 23,532 17,602 146,683
Deferred income taxes-current 1,691 1,526 12,717
Other current assets 4,044 5,466 45,549
Total current assets 132,144 131,065 1,092,208
Property, Plant and Equipment:
Land 4,774 6,147 51,225
Buildings 41,252 37,073 308,942
Machinery and equipment 64,839 59,273 493,942
Construction in progress 1,345 1,299 10,824
112,210 103,792 864,933
Less-Accumulated depreciation (73,203) (68,522) (571,016)
39,007 35,270 293,917
Investments and Other assets:
Investment securities 85,879 75,049 625,408
Long-term loans receivable 970 710 5,917
Deferred income taxes-long-term 138 136 1,133
Other investments and other assets 2,191 2,758 22,984
89,178 78,653 655,442
¥ 260,329 ¥ 244,988 $ 2,041,567
Yen U.S. Dollars(millions) (thousands)
2002 Consolidated Balance SheetsMABUCHI MOTOR CO., LTD. & CONSOLIDATED SUBSIDIARIES • DECEMBER 31, 2001 and 2002
The accompanying notes to consolidated financial statements are an integral part of these balance sheets.

$¥
11
2 0 0 1 2 0 0 2 2 0 0 2Current Liabilities:
Trade notes and accounts payable ¥ 3,462 ¥ 4,084 $ 34,033
Accrued expenses 3,117 2,788 23,233
Accrued income taxes 2,246 4,177 34,808
Deferred income taxes-current 3 0 0
Other current liabilities 637 413 3,443
Total current liabilities 9,465 11,462 95,517
Long-term Liabilities:
Allowance for severance and pension benefits 1,982 1,756 14,633
Retirement allowances for directors and statutory auditors 419 452 3,767
Deferred income taxes-long-term 4,888 5,400 45,000
Other long-term liabilities 22 29 242
7,311 7,637 63,642
Minority Interests 1,693 1,574 13,116
Contingent Liabilities
Shareholders'Equity:
Common stock, without par value :
Authorized: 100,000,000 shares:
Issued: 47,075,881 shares in 2001 and 2002 20,705 20,705 172,542
Additional paid-in capital 20,420 20,420 170,167
Retained earnings 189,972 204,805 1,706,708
Unrealized holding loss on securities (168) (770) (6,417)
Foreign currency translation adjustments 10,936 3,056 25,467
Treasury stock, at cost; 479 shares in 2001 and 2,009,096 shares in 2002 (5) (23,901) (199,175)
Total shareholders'equity 241,860 224,315 1,869,292
¥ 260,329 ¥ 244,988 $ 2,041,567
Yen U.S. Dollars(millions) (thousands)
LIABILITIES AND SHAREHOLDERS’ EQUITY

$¥
$¥
12
2 0 0 1 2 0 0 2 2 0 0 2Net Sales ¥ 105,129 ¥ 116,357 $ 969,642
Cost of Sales 66,247 69,735 581,125
Gross profit 38,882 46,622 388,517
Selling,General and Administrative Expenses 16,803 17,499 145,825
Operating income 22,079 29,123 242,692
Other Income (Expenses):
Interest and dividend income 3,368 2,266 18,883
Interest expense (1) (1) (8)
Exchange gains(losses) on foreign currency transactions 4,047 (1,717) (14,308)
Loss on valuation of investment securities (4,113) (624) (5,200)
Other, net (1,885) (1,079) (8,992)
1,416 (1,155) (9,625)
Income before Income Taxes and Minority Interests 23,495 27,968 233,067
Income Taxes:
Current 8,396 8,758 72,983
Deferred (1,288) 1,113 9,275
7,108 9,871 82,258
Minority Interests (106) (72) (601)
Net Income ¥ 16,281 ¥ 18,025 $ 150,208
2 0 0 1 2 0 0 2 2 0 0 2Per Share of Common Stock:
Net income ¥ 345.85 ¥ 392.13 $ 3.27
Cash dividends applicable to earnings of the year 67.00 70.00 0.58
Yen U.S. Dollars(millions) (thousands)
2002 Consolidated Statements of IncomeMABUCHI MOTOR CO., LTD. & CONSOLIDATED SUBSIDIARIES • FOR THE YEARS ENDED DECEMBER 31, 2001 and 2002
Yen U.S. Dollars
The accompanying notes to consolidated financial statements are an integral part of these statements.

$¥
13
2 0 0 1 2 0 0 2 2 0 0 1 2 0 0 2 2 0 0 2Common Stock:
Beginning balance 47,076 47,076 ¥ 20,705 ¥ 20,705 $ 172,542
Ending balance 47,076 47,076 ¥ 20,705 ¥ 20,705 $ 172,542
Additional Paid-in Capital:
Beginning balance ¥ 20,420 ¥ 20,420 $ 170,167
Ending balance ¥ 20,420 ¥ 20,420 $ 170,167
Retained Earnings:
Beginning balance ¥ 177,348 ¥ 189,972 $ 1,583,100
Net income 16,281 18,025 150,208
Cash dividends (3,484) (3,084) (25,700)
Bonuses to directors and statutory auditors (173) (108) (900)
Ending balance ¥ 189,972 ¥ 204,805 $ 1,706,708
Unrealized Holding Loss on Securities:
Beginning balance ¥ - ¥ (168) $ (1,400)
Net change during the year (168) (602) (5,017)
Ending balance ¥ (168) ¥ (770) $ (6,417)
Foreign Currency Translation Adjustments:
Beginning balance ¥ - ¥ 10,936 $ 91,134
Net change during the year 10,936 (7,880) (65,667)
Ending balance ¥ 10,936 ¥ 3,056 $ 25,467
Treasury Stock:
Beginning balance ¥ (1) ¥ (5) $ (42)
Net change during the year (4) (23,896) (199,133)
Ending balance ¥ (5) ¥ (23,901) $ (199,175)
Number of Shares Yen U.S. Dollars(thousands) (millions) (thousands)
2002 Consolidated Statements of Shareholders’ EquityMABUCHI MOTOR CO., LTD. & CONSOLIDATED SUBSIDIARIES • FOR THE YEARS ENDED DECEMBER 31, 2001 and 2002
The accompanying notes to consolidated financial statements are an integral part of these statements.
$¥
14
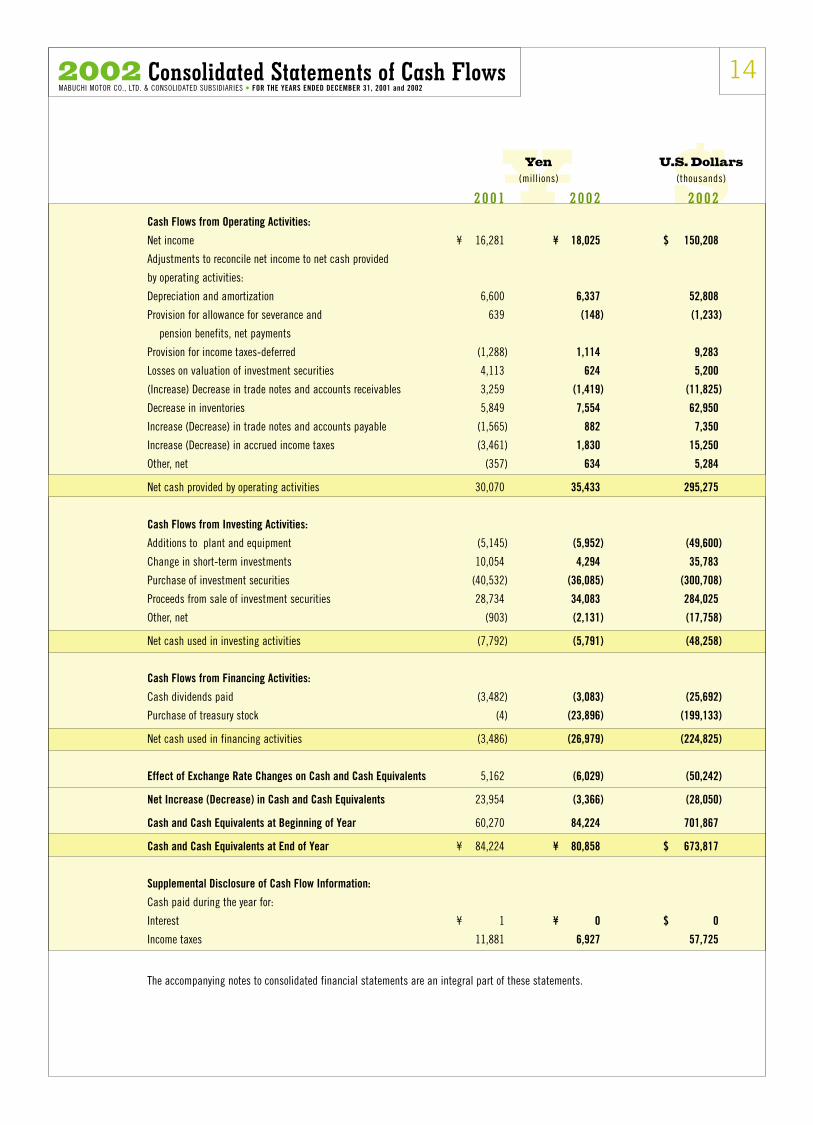
2 0 0 1 2 0 0 2 2 0 0 2Cash Flows from Operating Activities:
Net income ¥ 16,281 ¥ 18,025 $ 150,208
Adjustments to reconcile net income to net cash provided
by operating activities:
Depreciation and amortization 6,600 6,337 52,808
Provision for allowance for severance and 639 (148) (1,233)
pension benefits, net payments
Provision for income taxes-deferred (1,288) 1,114 9,283
Losses on valuation of investment securities 4,113 624 5,200
(Increase) Decrease in trade notes and accounts receivables 3,259 (1,419) (11,825)
Decrease in inventories 5,849 7,554 62,950
Increase (Decrease) in trade notes and accounts payable (1,565) 882 7,350
Increase (Decrease) in accrued income taxes (3,461) 1,830 15,250
Other, net (357) 634 5,284
Net cash provided by operating activities 30,070 35,433 295,275
Cash Flows from Investing Activities:
Additions to plant and equipment (5,145) (5,952) (49,600)
Change in short-term investments 10,054 4,294 35,783
Purchase of investment securities (40,532) (36,085) (300,708)
Proceeds from sale of investment securities 28,734 34,083 284,025
Other, net (903) (2,131) (17,758)
Net cash used in investing activities (7,792) (5,791) (48,258)
Cash Flows from Financing Activities:
Cash dividends paid (3,482) (3,083) (25,692)
Purchase of treasury stock (4) (23,896) (199,133)
Net cash used in financing activities (3,486) (26,979) (224,825)
Effect of Exchange Rate Changes on Cash and Cash Equivalents 5,162 (6,029) (50,242)
Net Increase (Decrease) in Cash and Cash Equivalents 23,954 (3,366) (28,050)
Cash and Cash Equivalents at Beginning of Year 60,270 84,224 701,867
Cash and Cash Equivalents at End of Year ¥ 84,224 ¥ 80,858 $ 673,817
Supplemental Disclosure of Cash Flow Information:
Cash paid during the year for:
Interest ¥ 1 ¥ 0 $ 0
Income taxes 11,881 6,927 57,725
Yen U.S. Dollars(millions) (thousands)
2002 Consolidated Statements of Cash FlowsMABUCHI MOTOR CO., LTD. & CONSOLIDATED SUBSIDIARIES • FOR THE YEARS ENDED DECEMBER 31, 2001 and 2002
The accompanying notes to consolidated financial statements are an integral part of these statements.
152002 Notes to Consolidated Financial StatementsMABUCHI MOTOR CO., LTD. & CONSOLIDATED SUBSIDIARIES
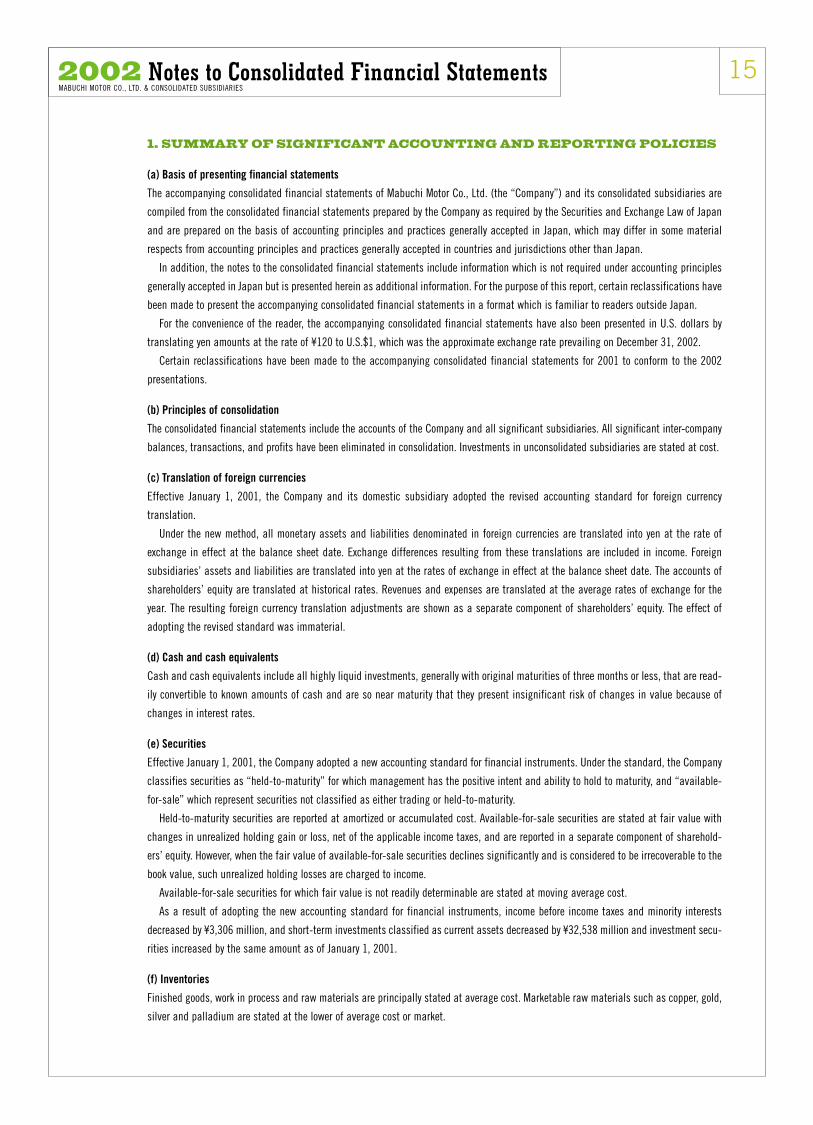
1. SUMMARY OF SIGNIFICANT ACCOUNTING AND REPORTING POLICIES
(a) Basis of presenting financial statements
The accompanying consolidated financial statements of Mabuchi Motor Co., Ltd. (the “Company”) and its consolidated subsidiaries are
compiled from the consolidated financial statements prepared by the Company as required by the Securities and Exchange Law of Japan
and are prepared on the basis of accounting principles and practices generally accepted in Japan, which may differ in some material
respects from accounting principles and practices generally accepted in countries and jurisdictions other than Japan.
In addition, the notes to the consolidated financial statements include information which is not required under accounting principles
generally accepted in Japan but is presented herein as additional information. For the purpose of this report, certain reclassifications have
been made to present the accompanying consolidated financial statements in a format which is familiar to readers outside Japan.
For the convenience of the reader, the accompanying consolidated financial statements have also been presented in U.S. dollars by
translating yen amounts at the rate of ¥120 to U.S.$1, which was the approximate exchange rate prevailing on December 31, 2002.
Certain reclassifications have been made to the accompanying consolidated financial statements for 2001 to conform to the 2002
presentations.
(b) Principles of consolidation
The consolidated financial statements include the accounts of the Company and all significant subsidiaries. All significant inter-company
balances, transactions, and profits have been eliminated in consolidation. Investments in unconsolidated subsidiaries are stated at cost.
(c) Translation of foreign currencies
Effective January 1, 2001, the Company and its domestic subsidiary adopted the revised accounting standard for foreign currency
translation.
Under the new method, all monetary assets and liabilities denominated in foreign currencies are translated into yen at the rate of
exchange in effect at the balance sheet date. Exchange differences resulting from these translations are included in income. Foreign
subsidiaries’ assets and liabilities are translated into yen at the rates of exchange in effect at the balance sheet date. The accounts of
shareholders’ equity are translated at historical rates. Revenues and expenses are translated at the average rates of exchange for the
year. The resulting foreign currency translation adjustments are shown as a separate component of shareholders’ equity. The effect of
adopting the revised standard was immaterial.
(d) Cash and cash equivalents
Cash and cash equivalents include all highly liquid investments, generally with original maturities of three months or less, that are read-
ily convertible to known amounts of cash and are so near maturity that they present insignificant risk of changes in value because of
changes in interest rates.
(e) Securities
Effective January 1, 2001, the Company adopted a new accounting standard for financial instruments. Under the standard, the Company
classifies securities as “held-to-maturity” for which management has the positive intent and ability to hold to maturity, and “available-
for-sale” which represent securities not classified as either trading or held-to-maturity.
Held-to-maturity securities are reported at amortized or accumulated cost. Available-for-sale securities are stated at fair value with
changes in unrealized holding gain or loss, net of the applicable income taxes, and are reported in a separate component of sharehold-
ers’ equity. However, when the fair value of available-for-sale securities declines significantly and is considered to be irrecoverable to the
book value, such unrealized holding losses are charged to income.
Available-for-sale securities for which fair value is not readily determinable are stated at moving average cost.
As a result of adopting the new accounting standard for financial instruments, income before income taxes and minority interests
decreased by ¥3,306 million, and short-term investments classified as current assets decreased by ¥32,538 million and investment secu-
rities increased by the same amount as of January 1, 2001.
(f) Inventories
Finished goods, work in process and raw materials are principally stated at average cost. Marketable raw materials such as copper, gold,
silver and palladium are stated at the lower of average cost or market.
162002 Notes to Consolidated Financial StatementsMABUCHI MOTOR CO., LTD. & CONSOLIDATED SUBSIDIARIES
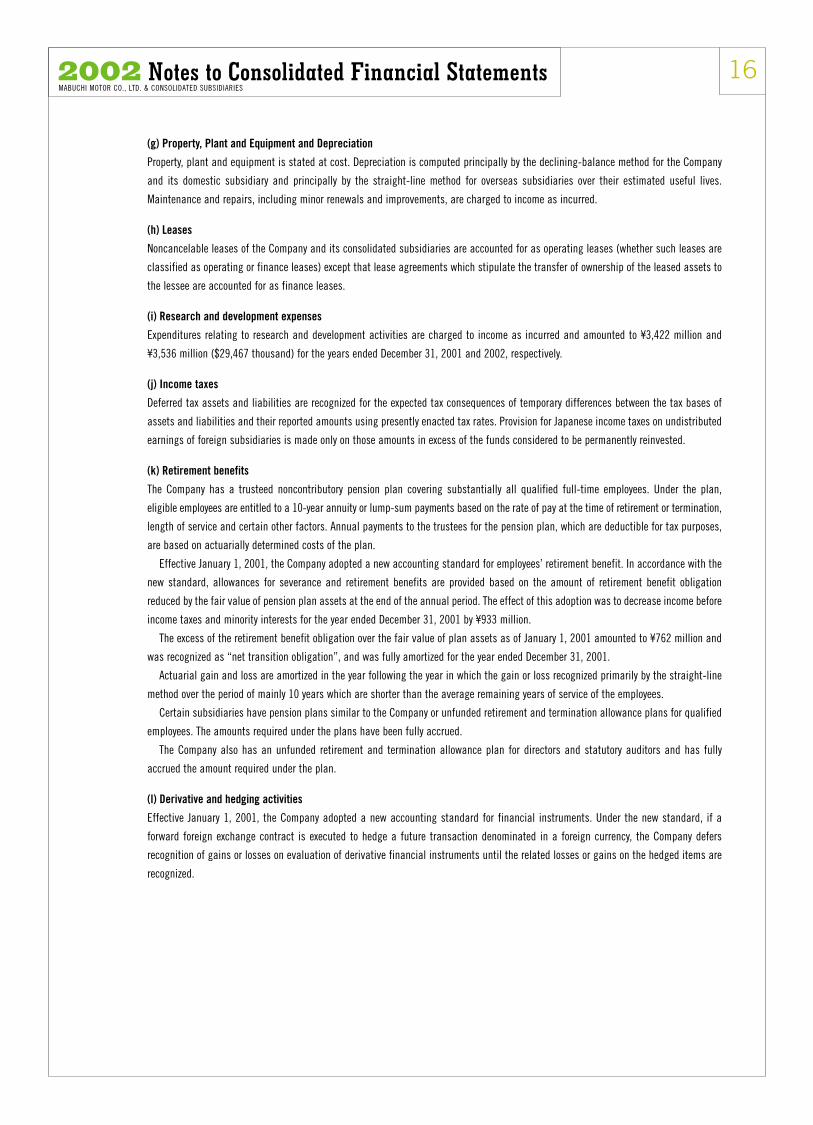
(g) Property, Plant and Equipment and Depreciation
Property, plant and equipment is stated at cost. Depreciation is computed principally by the declining-balance method for the Company
and its domestic subsidiary and principally by the straight-line method for overseas subsidiaries over their estimated useful lives.
Maintenance and repairs, including minor renewals and improvements, are charged to income as incurred.
(h) Leases
Noncancelable leases of the Company and its consolidated subsidiaries are accounted for as operating leases (whether such leases are
classified as operating or finance leases) except that lease agreements which stipulate the transfer of ownership of the leased assets to
the lessee are accounted for as finance leases.
(i) Research and development expenses
Expenditures relating to research and development activities are charged to income as incurred and amounted to ¥3,422 million and
¥3,536 million ($29,467 thousand) for the years ended December 31, 2001 and 2002, respectively.
(j) Income taxes
Deferred tax assets and liabilities are recognized for the expected tax consequences of temporary differences between the tax bases of
assets and liabilities and their reported amounts using presently enacted tax rates. Provision for Japanese income taxes on undistributed
earnings of foreign subsidiaries is made only on those amounts in excess of the funds considered to be permanently reinvested.
(k) Retirement benefits
The Company has a trusteed noncontributory pension plan covering substantially all qualified full-time employees. Under the plan,
eligible employees are entitled to a 10-year annuity or lump-sum payments based on the rate of pay at the time of retirement or termination,
length of service and certain other factors. Annual payments to the trustees for the pension plan, which are deductible for tax purposes,
are based on actuarially determined costs of the plan.
Effective January 1, 2001, the Company adopted a new accounting standard for employees’ retirement benefit. In accordance with the
new standard, allowances for severance and retirement benefits are provided based on the amount of retirement benefit obligation
reduced by the fair value of pension plan assets at the end of the annual period. The effect of this adoption was to decrease income before
income taxes and minority interests for the year ended December 31, 2001 by ¥933 million.
The excess of the retirement benefit obligation over the fair value of plan assets as of January 1, 2001 amounted to ¥762 million and
was recognized as “net transition obligation”, and was fully amortized for the year ended December 31, 2001.
Actuarial gain and loss are amortized in the year following the year in which the gain or loss recognized primarily by the straight-line
method over the period of mainly 10 years which are shorter than the average remaining years of service of the employees.
Certain subsidiaries have pension plans similar to the Company or unfunded retirement and termination allowance plans for qualified
employees. The amounts required under the plans have been fully accrued.
The Company also has an unfunded retirement and termination allowance plan for directors and statutory auditors and has fully
accrued the amount required under the plan.
(l) Derivative and hedging activities
Effective January 1, 2001, the Company adopted a new accounting standard for financial instruments. Under the new standard, if a
forward foreign exchange contract is executed to hedge a future transaction denominated in a foreign currency, the Company defers
recognition of gains or losses on evaluation of derivative financial instruments until the related losses or gains on the hedged items are
recognized.
$¥Yen U.S. Dollars(millions) (thousands)
$¥Yen U.S. Dollars(millions) (thousands)
¥Yen(millions)
$¥
17
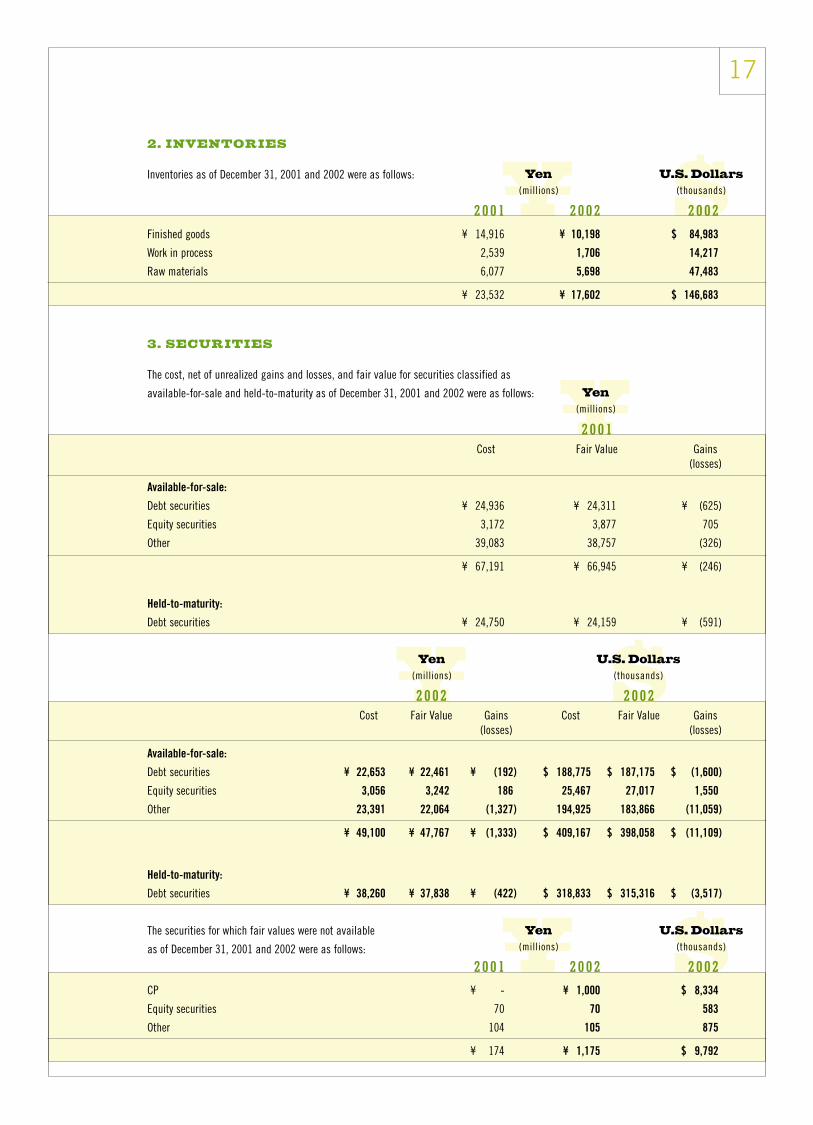
2. INVENTORIES
Inventories as of December 31, 2001 and 2002 were as follows:
2 0 0 1 2 0 0 2 2 0 0 2Finished goods ¥ 14,916 ¥ 10,198 $ 84,983
Work in process 2,539 1,706 14,217
Raw materials 6,077 5,698 47,483
¥ 23,532 ¥ 17,602 $ 146,683
3. SECURITIES
The cost, net of unrealized gains and losses, and fair value for securities classified as
available-for-sale and held-to-maturity as of December 31, 2001 and 2002 were as follows:
2 0 0 1Cost Fair Value Gains
(losses)
Available-for-sale:
Debt securities ¥ 24,936 ¥ 24,311 ¥ (625)
Equity securities 3,172 3,877 705
Other 39,083 38,757 (326)
¥ 67,191 ¥ 66,945 ¥ (246)
Held-to-maturity:
Debt securities ¥ 24,750 ¥ 24,159 ¥ (591)
2 0 0 2 2 0 0 2Cost Fair Value Gains Cost Fair Value Gains
(losses) (losses)
Available-for-sale:
Debt securities ¥ 22,653 ¥ 22,461 ¥ (192) $ 188,775 $ 187,175 $ (1,600)
Equity securities 3,056 3,242 186 25,467 27,017 1,550
Other 23,391 22,064 (1,327) 194,925 183,866 (11,059)
¥ 49,100 ¥ 47,767 ¥ (1,333) $ 409,167 $ 398,058 $ (11,109)
Held-to-maturity:
Debt securities ¥ 38,260 ¥ 37,838 ¥ (422) $ 318,833 $ 315,316 $ (3,517)
The securities for which fair values were not available
as of December 31, 2001 and 2002 were as follows:
2 0 0 1 2 0 0 2 2 0 0 2CP ¥ - ¥ 1,000 $ 8,334
Equity securities 70 70 583
Other 104 105 875
¥ 174 ¥ 1,175 $ 9,792
Yen U.S. Dollars(millions) (thousands)
$¥Yen U.S. Dollars(millions) (thousands)
$¥Yen U.S. Dollars(millions) (thousands)
$¥Yen U.S. Dollars(millions) (thousands)
¥Yen(millions)
182002 Notes to Consolidated Financial StatementsMABUCHI MOTOR CO., LTD. & CONSOLIDATED SUBSIDIARIES
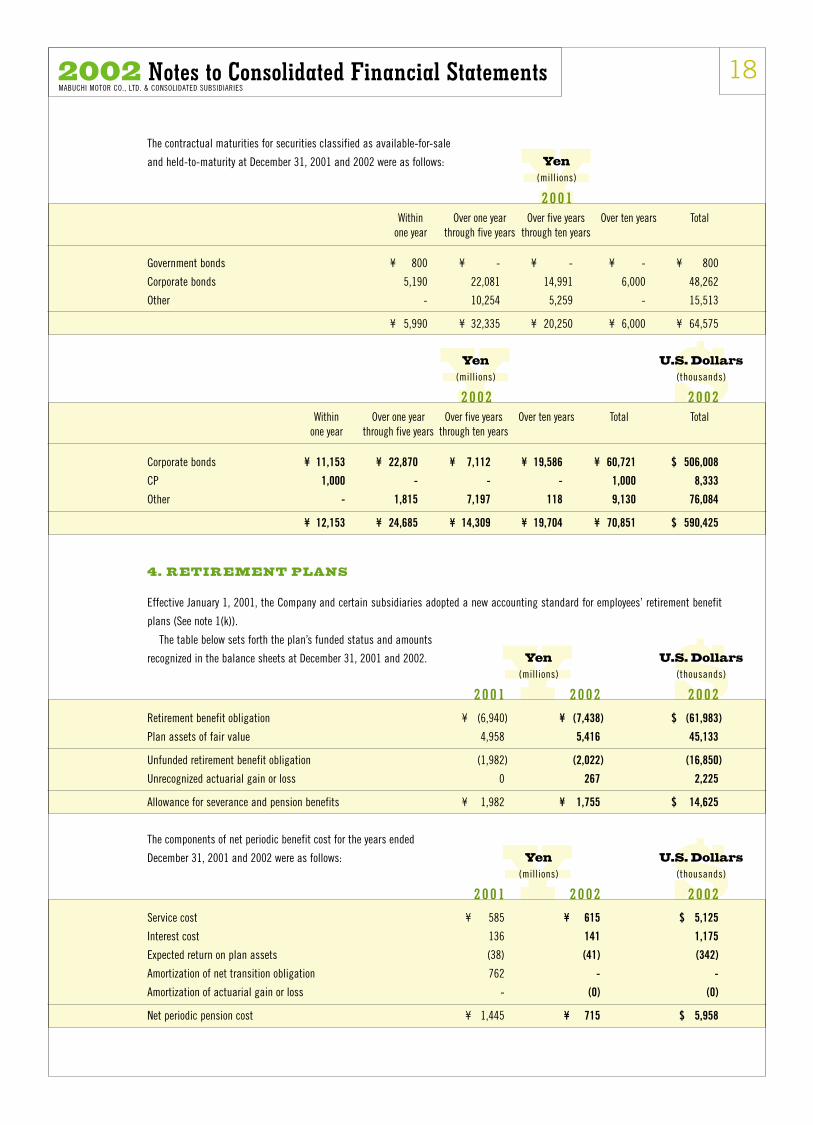
The contractual maturities for securities classified as available-for-sale
and held-to-maturity at December 31, 2001 and 2002 were as follows:
2 0 0 1Within Over one year Over five years Over ten years Total
one year through five years through ten years
Government bonds ¥ 800 ¥ - ¥ - ¥ - ¥ 800
Corporate bonds 5,190 22,081 14,991 6,000 48,262
Other - 10,254 5,259 - 15,513
¥ 5,990 ¥ 32,335 ¥ 20,250 ¥ 6,000 ¥ 64,575
2 0 0 2 2 0 0 2Within Over one year Over five years Over ten years Total Total
one year through five years through ten years
Corporate bonds ¥ 11,153 ¥ 22,870 ¥ 7,112 ¥ 19,586 ¥ 60,721 $ 506,008
CP 1,000 - - - 1,000 8,333
Other - 1,815 7,197 118 9,130 76,084
¥ 12,153 ¥ 24,685 ¥ 14,309 ¥ 19,704 ¥ 70,851 $ 590,425
4. RETIREMENT PLANS
Effective January 1, 2001, the Company and certain subsidiaries adopted a new accounting standard for employees’ retirement benefit
plans (See note 1(k)).
The table below sets forth the plan’s funded status and amounts
recognized in the balance sheets at December 31, 2001 and 2002.
2 0 0 1 2 0 0 2 2 0 0 2Retirement benefit obligation ¥ (6,940) ¥ (7,438) $ (61,983)
Plan assets of fair value 4,958 5,416 45,133
Unfunded retirement benefit obligation (1,982) (2,022) (16,850)
Unrecognized actuarial gain or loss 0 267 2,225
Allowance for severance and pension benefits ¥ 1,982 ¥ 1,755 $ 14,625
The components of net periodic benefit cost for the years ended
December 31, 2001 and 2002 were as follows:
2 0 0 1 2 0 0 2 2 0 0 2Service cost ¥ 585 ¥ 615 $ 5,125
Interest cost 136 141 1,175
Expected return on plan assets (38) (41) (342)
Amortization of net transition obligation 762 - -
Amortization of actuarial gain or loss - (0) (0)
Net periodic pension cost ¥ 1,445 ¥ 715 $ 5,958
$¥Yen U.S. Dollars(millions) (thousands)
19
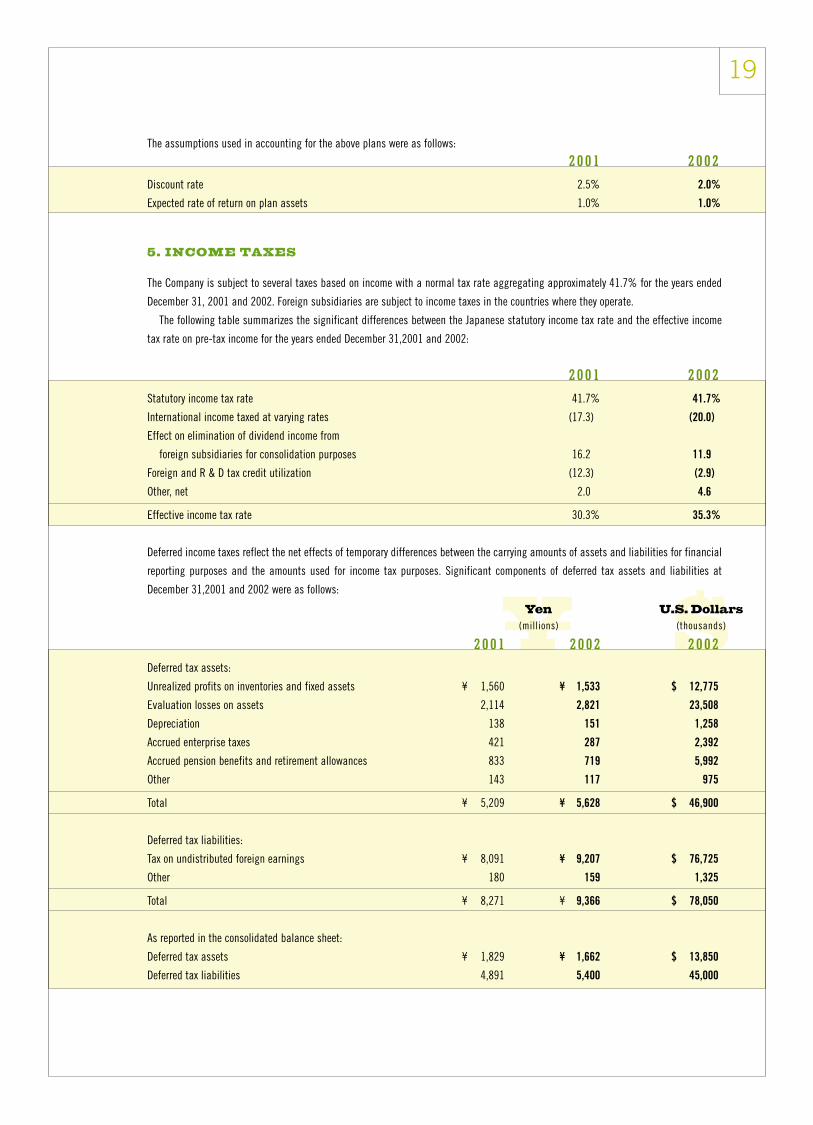
The assumptions used in accounting for the above plans were as follows:
2 0 0 1 2 0 0 2Discount rate 2.5% 2.0%
Expected rate of return on plan assets 1.0% 1.0%
5. INCOME TAXES
The Company is subject to several taxes based on income with a normal tax rate aggregating approximately 41.7% for the years ended
December 31, 2001 and 2002. Foreign subsidiaries are subject to income taxes in the countries where they operate.
The following table summarizes the significant differences between the Japanese statutory income tax rate and the effective income
tax rate on pre-tax income for the years ended December 31,2001 and 2002:
2 0 0 1 2 0 0 2Statutory income tax rate 41.7% 41.7%
International income taxed at varying rates (17.3) (20.0)
Effect on elimination of dividend income from
foreign subsidiaries for consolidation purposes 16.2 11.9
Foreign and R & D tax credit utilization (12.3) (2.9)
Other, net 2.0 4.6
Effective income tax rate 30.3% 35.3%
Deferred income taxes reflect the net effects of temporary differences between the carrying amounts of assets and liabilities for financial
reporting purposes and the amounts used for income tax purposes. Significant components of deferred tax assets and liabilities at
December 31,2001 and 2002 were as follows:
2 0 0 1 2 0 0 2 2 0 0 2Deferred tax assets:
Unrealized profits on inventories and fixed assets ¥ 1,560 ¥ 1,533 $ 12,775
Evaluation losses on assets 2,114 2,821 23,508
Depreciation 138 151 1,258
Accrued enterprise taxes 421 287 2,392
Accrued pension benefits and retirement allowances 833 719 5,992
Other 143 117 975
Total ¥ 5,209 ¥ 5,628 $ 46,900
Deferred tax liabilities:
Tax on undistributed foreign earnings ¥ 8,091 ¥ 9,207 $ 76,725
Other 180 159 1,325
Total ¥ 8,271 ¥ 9,366 $ 78,050
As reported in the consolidated balance sheet:
Deferred tax assets ¥ 1,829 ¥ 1,662 $ 13,850
Deferred tax liabilities 4,891 5,400 45,000

20
6. SHAREHOLDERS’ EQUITY AND PER SHARE DATA
The amended Japanese Commercial Code (the “Code”) enacted effective from October 1, 2001 provides that an amount equivalent to at
least 10% of cash dividends paid and other cash outlays, resulting from appropriations of retained earning with respect to each annual
period, be appropriated to the legal reserve until total of such reserve and additional paid-in capital equals 25% of the stated capital. As
of December 31, 2002, the total of the legal reserve of ¥3,812 million ($31,767 thousand) which is included in retained earnings at
December 31, 2002, and additional paid-in capital, already reached 25% of the stated capital. The Code also provides that additional
paid-in capital and the legal reserve up to 25% of the stated capital are not available for cash dividends but may be used to reduce a
capital deficit or may be capitalized. The paid-in capital and legal reserve exceeding 25% of the stated capital are available for dividends
or purchase of treasury stock upon approval of shareholders’ meeting.
In addition, the Code eliminates the stated par value of the Company’s outstanding shares, which resulted in all outstanding shares
having no par value as of October 1, 2001.
The Code also provides that all share issuances after September 30, 2001 will be of shares with no par value. Prior to the date on
which the Amendment came into effect, the Company’s shares had a par value of ¥50.
Year-end cash dividends are approved by the shareholders after the end of each fiscal year. Semi-annual interim cash dividends are
declared by the Board of Directors after the end of each interim six-month period. Such dividends are payable to shareholders of record
at the end of each fiscal year or interim six-month period.
In accordance with the Code, these dividends and the related appropriations of retained earnings have not been reflected in the finan-
cial statements at the end of such fiscal year. However, dividends per share shown in the accompanying consolidated statements of
income reflect dividends applicable to the respective fiscal year. Net income per share is computed based on the weighted average
number of shares of common stock outstanding.
On September 24, 2002, semi-annual interim cash dividends (¥35 or $0.29 per share) of ¥1,578 million ($13,150 thousand) were paid
to shareholders of record at June 30, 2002. On March 28, 2003, the shareholders approved the declaration of cash dividends (¥35 or $0.29
per share) totaling ¥1,577 million ($13,142 thousand) and payments of bonuses to directors and statutory auditors totaling ¥149 million
($1,242 thousand).
7. DERIVATIVE FINANCIAL INSTRUMENTS
The Company enters into forward exchange contracts and forward precious metal contracts as a normal part of risk management efforts.
As a result, the Company is exposed to risk of credit-related losses in the event of nonperformance of counterparties to foreign exchange
contracts and precious metal contracts. Management believes such risks are minor because of the high credit worthiness of the counter-
parties and such financial instruments have not been held for trading purpose. Following is a summary of derivative financial instruments
which are currently held by the Company.
The Company uses foreign exchange forward contracts to hedge the risk of changes in foreign exchange rates substantially associated
with accounts receivable and payable denominated in foreign currencies. Gains and losses explicitly deferred, arising from contracts
related to future trade transactions, are insignificant.
Forward precious metal contracts are used by the Company to hedge the risk of changes in market prices resulting from purchase of
precious metals as raw materials for motor products. The contracted amounts outstanding at December 31, 2001 were ¥81 million. The
estimated fair values at December 31, 2001 were ¥90 million. There were no outstanding forward precious metal contracts at December
31, 2002.
8. CONTINGENT LIABILITIES
As of December 31, 2002, there were no significant reportable contingent liabilities.
2002 Notes to Consolidated Financial StatementsMABUCHI MOTOR CO., LTD. & CONSOLIDATED SUBSIDIARIES

¥ $Yen U.S. Dollars(millions) (thousands)
21
9. SEGMENT INFORMATION
The Company and consolidated subsidiaries manufacture and sell small electric motors, parts and equipment used for production
purposes. Substantially all of the consolidated net sales and operating income are generated from a broad range of motor products. The
information on net sales, operating income and assets by geographic area, and overseas sales is summarized as follows:
Segment Information by Geographic Area
2 0 0 1 2 0 0 2 2 0 0 2Net sales:
Japan
Outside customers ¥ 23,772 ¥ 24,857 $ 207,141
Intersegment 43,721 50,018 416,817
Total 67,493 74,875 623,958
Asia
Outside customers 54,122 64,379 536,492
Intersegment 42,983 47,875 398,958
Total 97,105 112,254 935,450
U.S.A.
Outside customers 12,467 11,971 99,759
Intersegment 2 1 8
Total 12,469 11,972 99,767
Europe
Outside customers 14,768 15,149 126,242
Intersegment 0 10 83
Total 14,768 15,159 126,325
Corporate and elimination (86,706) (97,903) (815,858)
Consolidated ¥ 105,129 ¥ 116,357 $ 969,642
Operating Income:
Japan ¥ 10,081 ¥ 12,902 $ 107,517
Asia 10,474 15,226 126,883
U.S.A. 560 467 3,892
Europe 538 259 2,158
Corporate and elimination 426 269 2,242
Consolidated ¥ 22,079 ¥ 29,123 $ 242,692
Assets:
Japan ¥ 64,003 ¥ 68,639 $ 571,992
Asia 99,930 100,270 835,584
U.S.A. 6,074 5,349 44,575
Europe 5,942 5,725 47,708
Corporate and elimination 84,380 65,005 541,708
Consolidated ¥ 260,329 ¥ 244,988 $ 2,041,567
The amount of corporate assets included in “Corporate and elimination” is ¥135,276 million in 2001 and ¥115,963 million ($966,358
thousand) in 2002, which comprises principally cash, short-term investments and investment securities.

¥ $Yen U.S. Dollars(millions) (thousands)
22
Overseas Sales
2 0 0 1 2 0 0 2 2 0 0 2Overseas Sales
U.S.A. ¥ 12,830 ¥ 12,624 $ 105,200
Europe 14,768 15,187 126,558
Asia and Other 64,975 76,600 638,334
Total ¥ 92,573 ¥ 104,411 $ 870,092
Net Sales 105,129 116,357 969,642
% of Overseas Sales to Net Sales 88.1% 89.7% 89.7%
Overseas sales are the total of exports by the Company and sales by consolidated overseas subsidiaries.
2002 Notes to Consolidated Financial StatementsMABUCHI MOTOR CO., LTD. & CONSOLIDATED SUBSIDIARIES
232002 Independent Auditors’ Report
To the Board of Directors of Mabuchi Motor Co., Ltd.
We have audited the consolidated balance sheets of Mabuchi Motor Co., Ltd. and consolidated subsidiaries as of December
31, 2002 and 2001, and the related consolidated statements of income, shareholders’ equity, and cash flows for the years
then ended, all expressed in yen. Our audits were made in accordance with auditing standards, procedures and practices
generally accepted and applied in Japan and, accordingly, included such tests of the accounting records and other auditing
procedures as we considered necessary in the circumstances.
In our opinion, the consolidated financial statements referred to above, expressed in yen, present fairly the financial
position of Mabuchi Motor Co., Ltd. and consolidated subsidiaries at December 31, 2002 and 2001, and the results of their
operations and their cash flows for the years then ended, in conformity with accounting principles and practices generally
accepted in Japan, applied on a consistent basis.
As described in Note 1(c),(e),(k)and(l) to the consolidated financial statements, Mabuchi Motor Co., Ltd. and consolidated
subsidiaries adopted new accounting standards for transactions denominated in foreign currencies, financial instruments
and employees’ retirement benefits in the preparation of their consolidated financial statements for the year ended
December 31, 2001.
The U.S. dollar amounts in the accompanying consolidated financial statements with respect to the year ended December
31, 2002 are presented solely for the convenience of the reader. Our audit also included the translation of yen amounts into
U.S. dollar amounts and, in our opinion, such translation has been made on the basis described in Note 1(a) to the
consolidated financial statements.
Shin Nihon & Co.
Tokyo, Japan
March 28, 2003
See note 1 (a) to the consolidated financial statements which explains the basis of preparing the consolidated financial
statements of Mabuchi Motor Co., Ltd. under Japanese accounting principles and practices.

242002 Board of Directors / Corporate Directory
BOARD OF DIRECTORS
As of March 28, 2003
CHAIRMANTakaichi Mabuchi
PRESIDENTShinji Kamei
MANAGING DIRECTORNobuyo Habuchi
DIRECTORSSun Zuei CheSeiya NakanishiYasuo UeharaShunroku NishimuraYoshinori Sugimoto
STATUTORY AUDITORSKiyoshi IwakuraChiaki KajiwaraIchiro AndoYuzaburo Nagase
CONSOLIDATED SUBSIDIARIESAs of December 31, 2002
MABUCHI INDUSTRY CO., LTD. 19 Sam Chuk St., San Po KongKowloon, Hong KongTel: 852-2328-5575Fax: 852-2352-5266
MABUCHI TAIWAN CO., LTD.6/F No.3 Sec.1 Tun Hwa South Rd.Taipei, TaiwanTel: 886-2-2579-0155Fax: 886-2-2570-6535
MABUCHI MOTOR TAIWAN LTD.No.66 Kaifa Rd., N.E.P.Z.Kaohsiung, TaiwanTel: 886-7-362-1111Fax: 886-7-361-9111
MABUCHI MOTOR DALIAN LTD.No.41 Harbin Rd., Dalian Economic and Technical Development ZoneChinaTel: 86-411-761-1111Fax: 86-411-761-2900
MABUCHI MOTOR WAFANGDIAN LTD.Laohutun TownWafangdian City, Liaoning ProvinceChinaTel: 86-411-537-0241Fax: 86-411-537-0291
MABUCHI MOTOR (JIANGSU) CO., LTD.No.1 Liuxu Rd., SonglingEconomic and Technical DevelopmentZoneWujiang City, Jiangsu Province, ChinaTel: 86-512-6345-1111Fax: 86-512-6345-0438
MABUCHI MOTOR (MALAYSIA) SDN. BHD.Plot 15, Kanthan Industrial Estate31200 Chemor, Perak, MalaysiaTel: 60-5-201-1888Fax: 60-5-201-2288
MABUCHI MOTOR VIETNAM LTD.No.28, Bienhoa Industrial Zone 2Long Binh Ward, Bienhoa CityDongnai Province, VietnamTel: 84-61-836711Fax: 84-61-836712
MABUCHI PRECISION INDUSTRIES LTD.1087 Hinata-cho,Tatebayashi-shiGunma-ken, 374-0076, JapanTel: 81-276-72-1941Fax: 81-276-72-1943
MABUCHI PRECISION INDUSTRIES HONG KONG LTD.19 Sam Chuk St., San Po KongKowloon, Hong KongTel: 852-2328-5575Fax: 852-2352-1008
DONGGUAN MABUCHI MOTOR EQUIPMENT CO., LTD.No.16 Tianbao Rd., Dongzong Rd.Dongguan City, Guangdong ProvinceChinaTel: 86-769-2256985Fax: 86-769-2256984
MABUCHI MOTOR AMERICA CORP.3001 West Big Beaver Rd., Suite 520Troy, MI 48084 U.S.A.Tel: 1-248-816-3100Fax: 1-248-816-3242
MABUCHI MOTOR (SINGAPORE) PTE. LTD.111 North Bridge Rd., #12-05Peninsula Plaza, Singapore 179098Tel: 65-6339-9991Fax: 65-6339-9091
MABUCHI MOTOR (EUROPE) GmbHHahnstrasse 38, 60528Frankfurt/Main, F.R.GermanyTel: 49-69-6690220Fax: 49-69-66902229
NON-CONSOLIDATED SUBSIDIARIESAs of December 31, 2002
MABUCHI REAL ESTATE CO., LTD.
TAIWAN MABUCHI (HONG KONG) CO., LTD.
MABUCHI MOTOR (SHANGHAI) CO., LTD.
CORPORATE DIRECTORY
252002 Investor Information
INVESTOR INFORMATION
As of March 31, 2003
Corporate Headquarters
MABUCHI MOTOR CO., LTD.
430 Matsuhidai, Matsudo-shi
Chiba-ken 270-2280, Japan
Tel: 81-47-384-1111
Fax: 81-47-389-5299
http://www.mabuchi-motor.co.jp
Ordinary General Meeting of
Shareholders
The Ordinary General Meeting of
Shareholders will be held at the end of
March in Matsudo.
Independent Accountants
Shin Nihon & Co. (Member Firm of Ernst
& Young) Tokyo, Japan
Transfer Agent of Common Shares
Handling Office
UFJ Trust Bank Limited
Corporate Agency Department
10-11, Higashi-suna 7-chome, Koto-ku
Tokyo 137-8081, Japan
Tel: 81-3-5683-5111
Japanese Stock Exchange Listing
Tokyo Stock Exchange

%CORPOR ATE HEADQUARTERS
430 Matsuhidai, Matsudo-shi
Chiba-ken 270-2280, Japan
Tel: 81-47-384-1111
Fax: 81-47-389-5299
http://www.mabuchi-motor.co.jp
C H I B A - K E N , J A P A N K O W L O O N , H O N G K O N G T A I P E I ,
T A I W A N K A O H S I U N G , T A I W A N D A L I A N E C O N O M I C A N D
T E C H N I C A L D E V E L O P M E N T Z O N E , C H I N A L I A O N I N G
P R O V I N C E , C H I N A J I A N G S U P R O V I N C E , C H I N A P E R A K ,
M A L A Y S I A D O N G N A I P R O V I N C E , V I E T N A M G U N M A - K E N ,
J A P A N K O W L O O N , H O N G K O N G G U A N G D O N G P R O V I N C E
C H I N A T R O Y , M I C H I G A N U . S . A . S I N G A P O R E F R A N K F U R T ,
G E R M A N Y S H A N G H A I , C H I N A C H I B A - K E N , J A P A N
K O W L O O N , H O N G K O N G T A I P E I , T A I W A N K A O H S I U N G ,
T A I W A N D A L I A N E C O N O M I C A N D T E C H N I C A L D E V E L O P M E N T
Z O N E , C H I N A L I A O N I N G P R O V I N C E , C H I N A J I A N G S U
P R O V I N C E , C H I N A P E R A K , M A L A Y S I A D O N G N A I P R O V I N C E ,
V I E T N A M G U N M A - K E N , J A P A N K O W L O O N , H O N G K O N G
G U A N G D O N G P R O V I N C E C H I N A T R O Y , M I C H I G A N U . S . A .
S I N G A P O R E F R A N K F U R T