Embed Size (px)
Citation preview
The Mosaic Company February 2014

Click to edit Master title style
2
This presentation contains forward-looking statements within the meaning of the Private Securities Litigation Reform Act of 1995. Such statements include, but are not limited to, statements about the proposed acquisition and assumption of certain related liabilities of the Florida phosphate assets of CF Industries, Inc. (“CF”) and the ammonia supply agreements with CF; the benefits of the transactions with CF; future strategic plans and certain related liabilities and other statements about future financial and operating results. Such statements are based upon the current beliefs and expectations of The Mosaic Company's management and are subject to significant risks and uncertainties. These risks and uncertainties include but are not limited to risks and uncertainties arising from the possibility that the closing of the proposed phosphate assets acquisition may be delayed or may not occur, including delays arising from any inability to obtain governmental approvals of the transaction on the proposed terms and schedule and the ability to satisfy other closing conditions; difficulties with realization of the benefits of the transactions with CF, including the risks that the acquired assets may not be integrated successfully or that the cost or capital savings from the transactions may not be fully realized or may take longer to realize than expected, regulatory agencies might not take, or might delay, actions with respect to permitting or regulatory enforcement matters that are necessary for Mosaic to fully realize the benefits of the transactions including replacement of CF’s escrowed financial assurance funds, or the price of natural gas or ammonia changes to a level at which the natural gas based pricing under one of the long term ammonia supply agreements with CF becomes disadvantageous to Mosaic; customer defaults; the effects of our decisions to exit business operations or locations; the predictability and volatility of, and customer expectations about, agriculture, fertilizer, raw material, energy and transportation markets that are subject to competitive and other pressures and economic and credit market conditions; the level of inventories in the distribution channels for crop nutrients; changes in foreign currency and exchange rates; international trade risks; changes in government policy; changes in environmental and other governmental regulation, including greenhouse gas regulation, implementation of numeric water quality standards for the discharge of nutrients into Florida waterways or possible efforts to reduce the flow of excess nutrients into the Mississippi River basin or the Gulf of Mexico; further developments in judicial or administrative proceedings, or complaints that Mosaic's operations are adversely impacting nearby farms, business operations or properties; difficulties or delays in receiving, increased costs of or challenges to necessary governmental permits or approvals or increased financial assurance requirements; resolution of global tax audit activity; the effectiveness of the Company's processes for managing its strategic priorities; the ability of the Northern Promise joint venture among Mosaic, Ma'aden and SABIC to obtain project financing in acceptable amounts and upon acceptable terms, the future success of current plans for the joint venture and any future changes in those plans; adverse weather conditions affecting operations in Central Florida or the Mississippi River basin or the Gulf Coast of the United States, and including potential hurricanes, excess rainfall or drought; actual costs of various items differing from management's current estimates, including, among others, asset retirement, environmental remediation, reclamation or other environmental regulation, Canadian resources taxes and royalties, or the liabilities Mosaic is assuming in the proposed phosphate assets acquisition; brine inflows at Mosaic's Esterhazy, Saskatchewan, potash mine or other potash shaft mines; other accidents and disruptions involving Mosaic's operations, including potential mine fires, floods, explosions, seismic events or releases of hazardous or volatile chemicals, as well as other risks and uncertainties reported from time to time in The Mosaic Company's reports filed with the Securities and Exchange Commission. Actual results may differ from those set forth in the forward-looking statements.
Safe Harbor

Near-term Potash Market Outlook
54
30
35
40
45
50
55
60
Global MOP Shipments
2013 Incremental 2014F
+(3-5)
India:
2013 2014F
3.2 4.0 - 4.5
China: 11.0 11.6 - 12.0
Brazil: 8.2 8.5 - 8.8
Total: 54 57 - 59
…..
In m
illion
s to
nnes
Expecting record global potash shipments in 2014.
Expect price improvement in H2 2014 Source: Mosaic
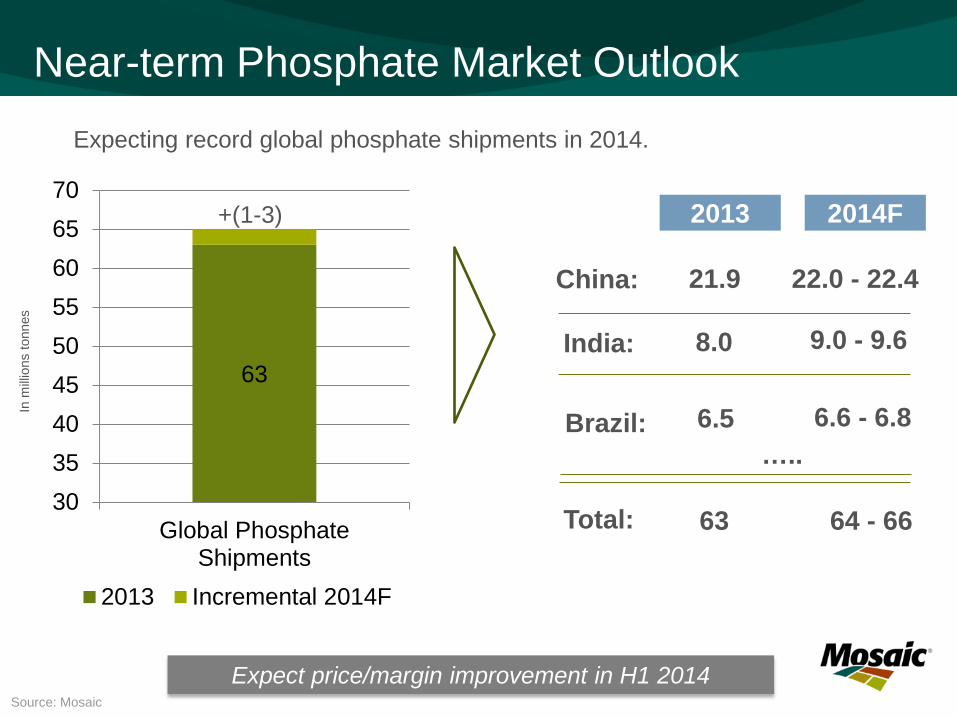
Near-term Phosphate Market Outlook
63
303540455055606570
Global PhosphateShipments
2013 Incremental 2014F
+(1-3)
In m
illion
s to
nnes
Expecting record global phosphate shipments in 2014.
Expect price/margin improvement in H1 2014
India:
2013 2014F
8.0 9.0 - 9.6
Brazil: 6.5 6.6 - 6.8
Total: 63 64 - 66
…..
China: 21.9 22.0 - 22.4
Source: Mosaic

Click to edit Master title style
5
Key Environmental Factors
Agricultural commodity pricing:
South American crop progress
Energy, bio-fuels and livestock prices
U.S. Prospective Plantings Report – 3/31/14
India P&K subsidy for 2014/15
Producer and channel inventories
Macro economic developments
5
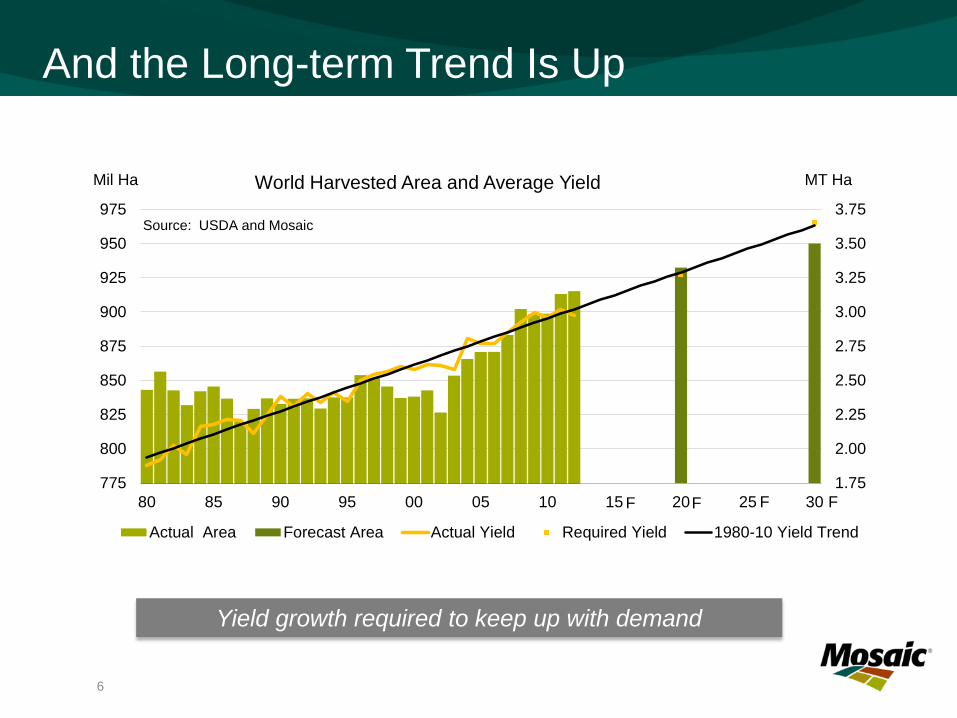
And the Long-term Trend Is Up
Yield growth required to keep up with demand
1.75
2.00
2.25
2.50
2.75
3.00
3.25
3.50
3.75
775
800
825
850
875
900
925
950
975
80 85 90 95 00 05 10 15 20 25 30
MT Ha Mil Ha
Source: USDA and Mosaic
World Harvested Area and Average Yield
Actual Area Forecast Area Actual Yield Required Yield 1980-10 Yield Trend
6
F F F F

What Differentiates Mosaic?

The Largest Potash and Phosphates Company
0.0 1.0 2.0 3.0 4.0 5.0 6.0 7.0 8.0
Mosaic
PotashCorp
Uralkali
Belaruskali
OCP
Israel Chemical
K+S
Yuntianhua
PhosAgro
Agrium
Mosaic's K2O production excludes Esterhazy tolling production Source: Mosaic, Fertecon
World's Largest P + K Companies
K2O P2O5
We help the world grow the food it needs.
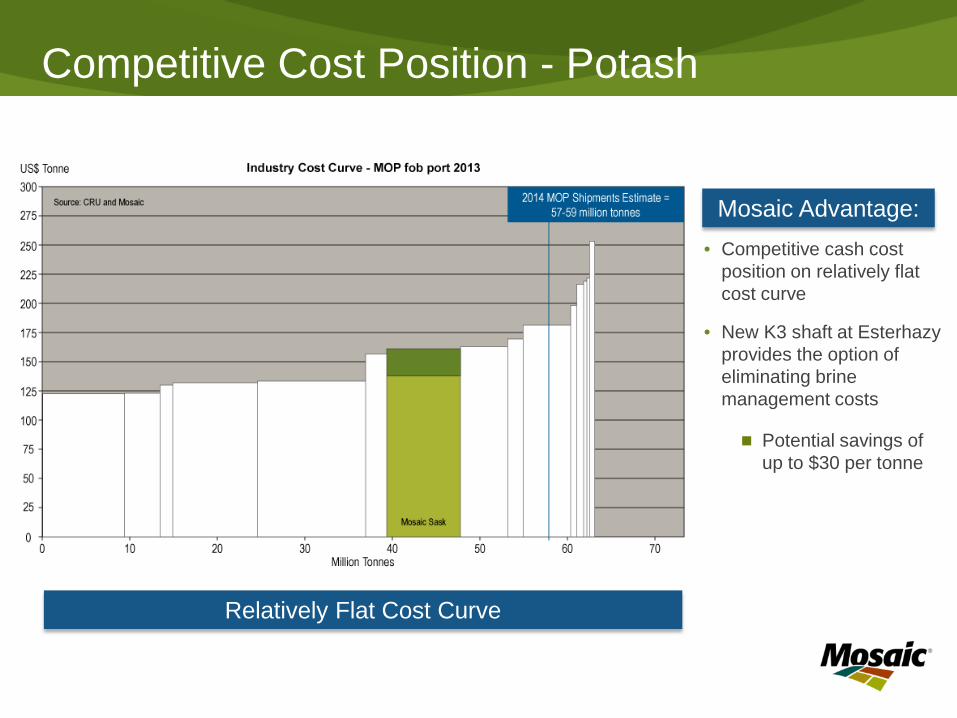
Competitive Cost Position - Potash
• Competitive cash cost position on relatively flat cost curve
• New K3 shaft at Esterhazy provides the option of eliminating brine management costs
Mosaic Advantage:
Relatively Flat Cost Curve
Potential savings of up to $30 per tonne

Strong Cost Position - Phosphates
• Vertically integrated with phosphate rock sources from Florida and Miski Mayo JV.
• Saudi Arabian JV is expected to be low cost with advantaged access to India
• CF phosphates business acquisition provides access to more phosphate rock and ability to realize significant synergies
• Long term ammonia supply agreement based on U.S. natural gas prices
Best Quartile Producer
Mosaic Advantage:
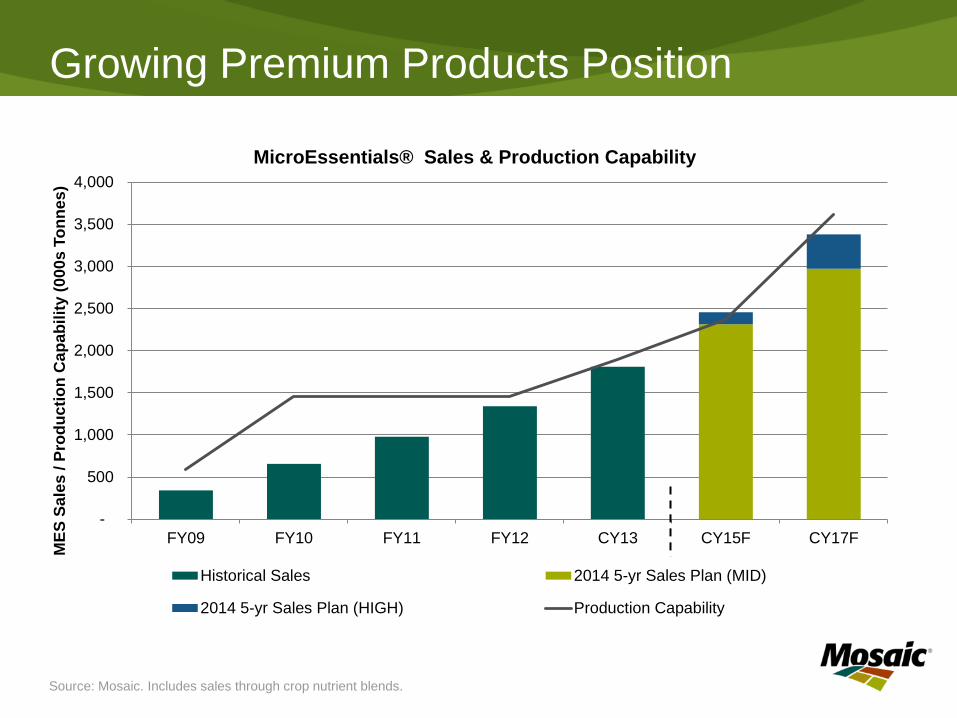
Growing Premium Products Position
Source: Mosaic. Includes sales through crop nutrient blends.
-
500
1,000
1,500
2,000
2,500
3,000
3,500
4,000
FY09 FY10 FY11 FY12 CY13 CY15F CY17F
MES
Sal
es /
Prod
uctio
n C
apab
ility
(000
s To
nnes
)
MicroEssentials® Sales & Production Capability
Historical Sales 2014 5-yr Sales Plan (MID)
2014 5-yr Sales Plan (HIGH) Production Capability

Diversified Customer Base
We ship product to approximately 40 countries with balanced exposure to North America and International
63%
37% 44%
56%
Calendar 2013
Sales by Product and Geography
Phosphates Potash
North America
International
Calendar 2013
Mosaic Product Shipments by Destination
Source: Fertecon & Mosaic
North America 51%
Latin America 15%
Asia 31%
Others 3%
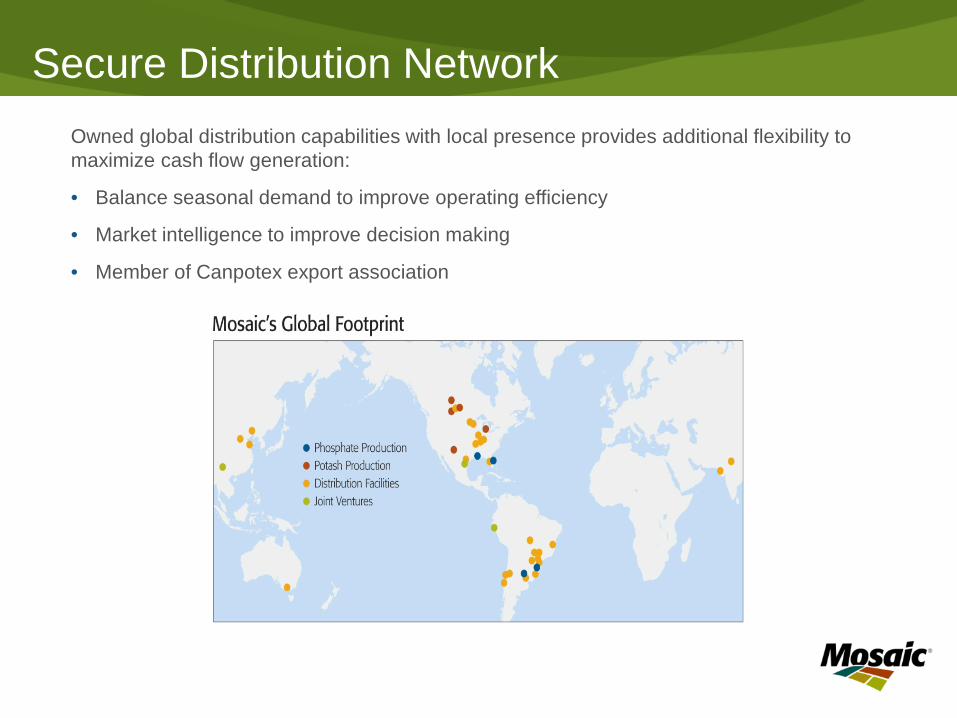
Secure Distribution Network Owned global distribution capabilities with local presence provides additional flexibility to maximize cash flow generation:
• Balance seasonal demand to improve operating efficiency
• Market intelligence to improve decision making
• Member of Canpotex export association

Mosaic’s Strategic and Cash Use Priorities

Our Strategic Priorities
+ =

Unchanged Cash Use Priorities
Maintain ratings & financial strength
Sustain assets & recurring dividend
Investments to drive organic growth
Opportunistic strategic investments
Return excess to shareholders

Cyclical Nature Provides Excellent Opportunities…
Buy CF Industries Phosphates
Business 300
400
500
600
700
11 12 13 14
$ MT Weekly DAP Prices
fob Tampa
Source: Fertecon

…Including Returning Capital to Shareholders
*Average repurchased to-date.; actual repurchase costs varies with market prices. Actual 2014 dividend payout may vary with outstanding share count.
$0
$500
$1,000
$1,500
$2,000
$2,500
2012 2013 2014F*Class A Share Repurchases Dividends
+ $1B Open Market
Authorization
$55 / Share
$46 / Share

Click to edit Master title style
19
Largest combined phosphate and potash producer in the world High quality assets in stable geographies
Geographically diversified – customers in approximately 40 countries
Strong balance sheet leaves us well positioned to capitalize on cyclical opportunities and strong secular trends
Optimizing asset portfolio for long-term value creation
Target optimal balance sheet by mid-2014 $1 billion share repurchase authorization
Experienced management team focused on execution and operational excellence
Investment Highlights

Market Outlook
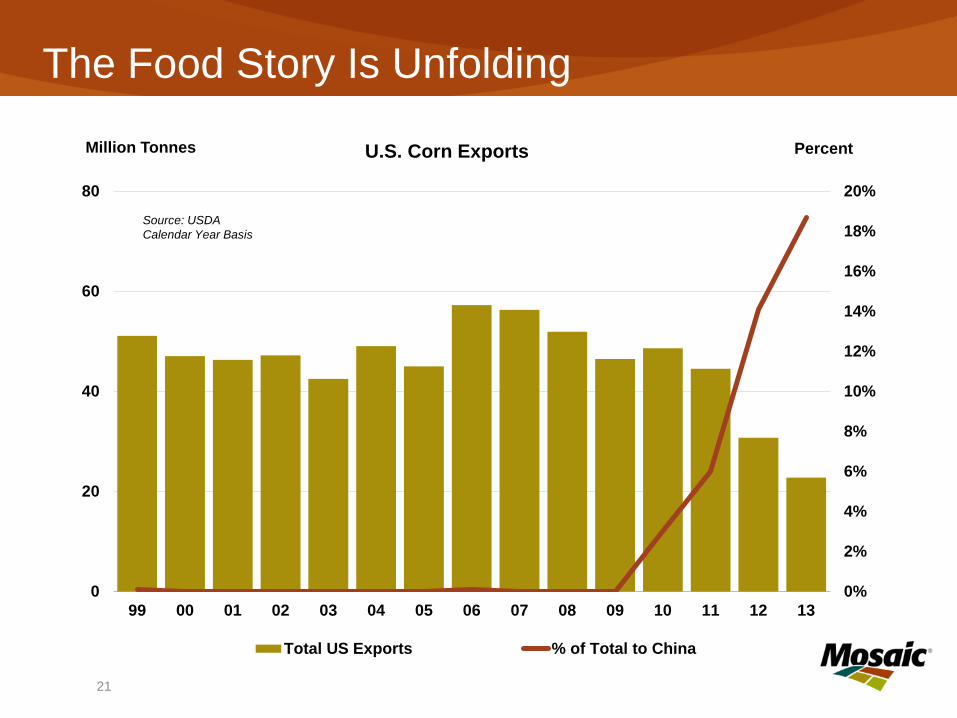
The Food Story Is Unfolding
21
0%
2%
4%
6%
8%
10%
12%
14%
16%
18%
20%
0
20
40
60
80
99 00 01 02 03 04 05 06 07 08 09 10 11 12 13
Percent Million Tonnes U.S. Corn Exports
Total US Exports % of Total to China
Source: USDA Calendar Year Basis
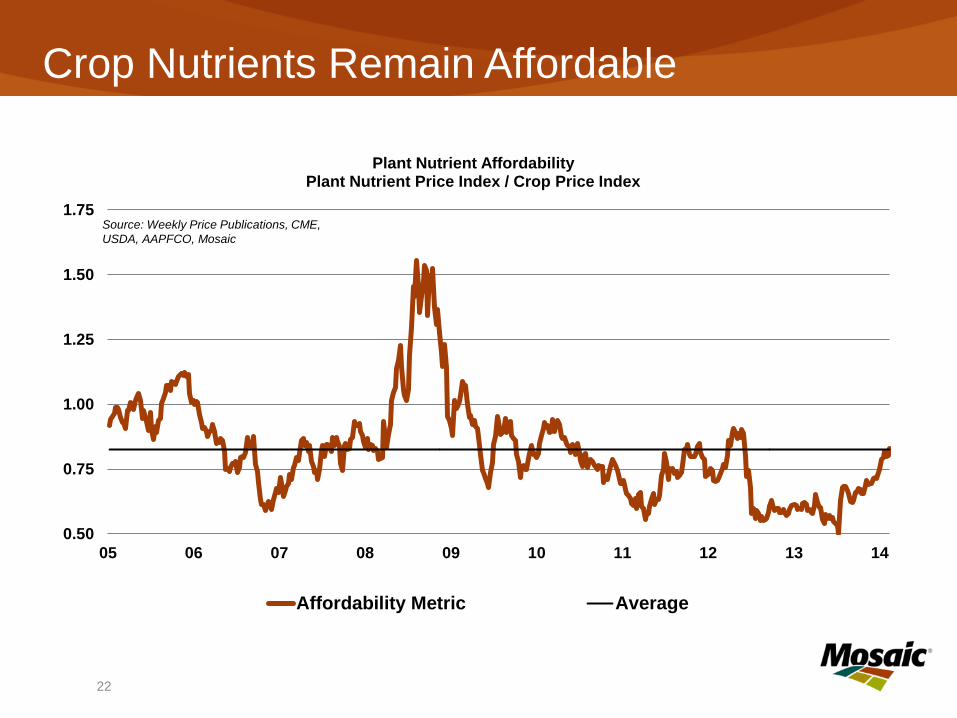
Crop Nutrients Remain Affordable
22
0.50
0.75
1.00
1.25
1.50
1.75
05 06 07 08 09 10 11 12 13 14
Plant Nutrient Affordability Plant Nutrient Price Index / Crop Price Index
Affordability Metric Average
Source: Weekly Price Publications, CME, USDA, AAPFCO, Mosaic

23
Global Phosphate Shipments by Region Million Tonnes DAP/MAP/TSP 2012 2013E
2014F Low*
2014F High* Commentary
China 21.2 21.9 22.0 22.4 Moderate growth - high analysis products capture phosphate growth and displace low analysis products.
India 10.0 8.0 9.0 9.6 Strong rebound expected due to an increase in farm use and a smaller drawdown of channel inventories this year.
Other Asia/Oceania 6.7 6.6 6.6 6.8 Demand is expected to hold steady or increase modestly in most countries.
Europe and FSU 4.4 4.4 4.4 4.6 Demand is expected to hold steady or increase modestly in most countries.
Brazil 5.7 6.5 6.6 6.8 Further moderate increase is forecasts following a step-up in shipments in 2013. Assumes no collapse of crop prices.
Other Latin America 2.8 2.9 2.9 3.0 Demand is expected to hold steady or increase modestly in most countries.
North America 8.8 9.1 8.7 8.9 Assumes U.S. corn acreage of 90-92 million in 2014 and steady application rates.
Other 3.6 3.8 3.9 4.1 Demand is expected to hold steady or increase modestly in most countries.
Total 63.2 63.1 64.1 66.1 Point estimate is in the top half of the range.
Source: Fertecon and Mosaic * Figures may not sum to total due to rounding

24
Global Potash Shipments by Region
Million Tonnes Muriate of Potash (KCl)
CY 2012
CY 2013E
2014F Low*
2014F High* Commentary
China 10.3 11.0 11.6 12.0 Net imports projected to increase from 5.9 million tonnes in 2013 to 6.4 million in 2014. Domestic production also expected to increase another 300,000 tonnes this year.
India 3.2 3.2 4.0 4.5 Significant rebound due to lower prices, decent on farm demand and leaner channel inventories. Import economics work even with a modest subsidy cut.
Indonesia/Malaysia 4.2 4.3 4.5 4.6 Moderate growth underpinned by decent, if not spectacular, palm oil prices and production economics.
Other Asia/Oceania 4.1 4.3 4.5 4.7 Incremental growth with downside risk in countries such as Thailand due to political/economic uncertainty.
Europe and FSU 10.3 10.5 11.3 11.7 Robust growth due to increases in NPK production for both export and domestic markets as well as improved on-farm direct application use especially in the FSU and Eastern Europe.
Brazil 7.9 8.2 8.5 8.8 Shipments remain strong, though weather concerns and deteriorating crop production economics pose risks to the forecast.
Other Latin America 1.6 1.8 1.9 1.9 Moderate incremental growth expected.
North America 8.1 9.0 8.9 9.2 Assumes U.S. corn acreage of 90-92 million in 2014 and steady to slightly higher application rates. Expecting strong spring sales.
Other 1.3 1.5 1.7 1.8 Moderate incremental growth expected.
Total 51.0 53.9 56.8 59.1 Our point estimate is in the lower half of the range.
Source: Fertecon and Mosaic * Figures may not sum to total due to rounding

Stable Long-term Supply and Demand Outlook
40%
50%
60%
70%
80%
90%
100%
0
10
20
30
40
50
60
70
80
90
2000 2004 2008 2012 2016 2020
Op RateMMT KClGlobal Potash Capacity, Production and Operating Rate
Most Likely Scenario
Capacity Production Op Rate
Potash Production, Capacity and Operating Rate Forecast
Operating rate
Mill
ion
tonn
es p
rodu
ct K
Cl
Capacity Production Operating Rate
Source: Mosaic
25

Positive Long-term Supply and Demand Outlook
65%
70%
75%
80%
85%
90%
95%
0
20
40
60
80
100
120
2000 2004 2008 2012 2016 2020
Op RateMMT Global Phosphate Capacity, Production and Opr RateMost Likely Scenario
Capacity Production Op Rate
P2O
5 operating rate Phosphate Production,
Capacity and Operating Rate Forecast
Mill
ion
tonn
es
Source: Mosaic
26

Recent Financial Results

0%
5%
10%
15%
20%
25%
-
500
1,000
1,500
2,000
2,500
3,000
3,500
4,000
Q12012
Q22012
Q32012
Q42012
Q12013
Q22013
Q32013
Q42013
Sales Volumes GM Rate
Volume First, Then Price and Margin
Expect price/margin improvement in H1 2014
Phosphates • In December
prices moved up
• Expect 2014 shipments to be 64-66 million tonnes
Source: Mosaic 28

0%
10%
20%
30%
40%
50%
60%
-
500
1,000
1,500
2,000
2,500
3,000
Q12012
Q22012
Q32012
Q42012
Q12013
Q22013
Q32013
Q42013
Sales Volumes GM Rate
Expect price improvement in H2 2014
Potash
Volume First, Then Price and Margin
• Expect gap to widen in Q1, upward price momentum second half of 2014
• Expect 2014
shipments to be 57-59 million tonnes
Source: Mosaic 29
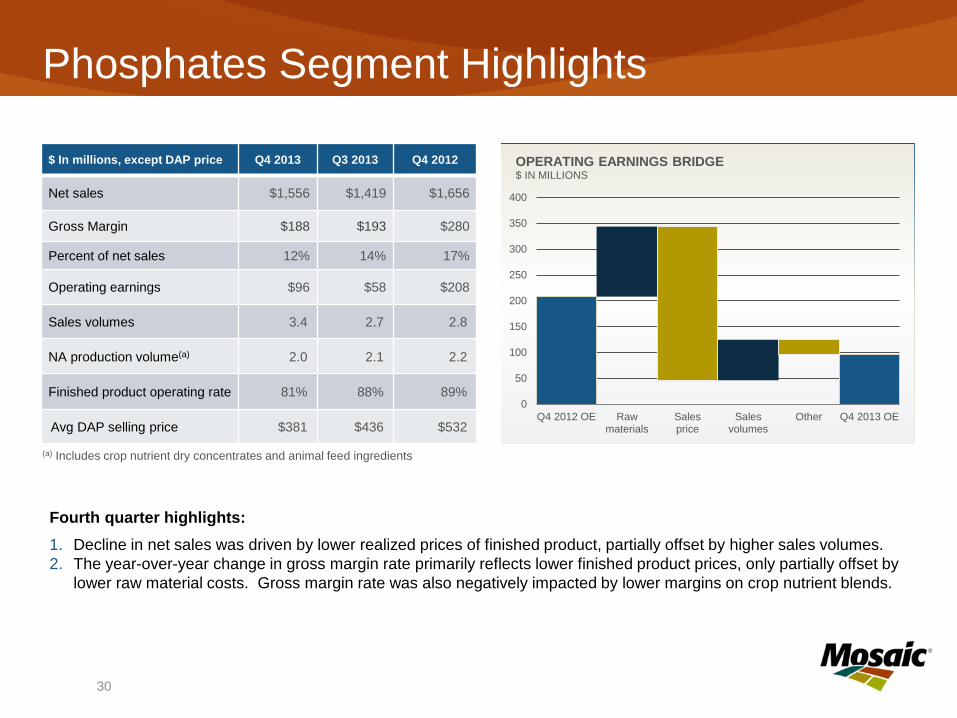
Phosphates Segment Highlights
Fourth quarter highlights: 1. Decline in net sales was driven by lower realized prices of finished product, partially offset by higher sales volumes. 2. The year-over-year change in gross margin rate primarily reflects lower finished product prices, only partially offset by
lower raw material costs. Gross margin rate was also negatively impacted by lower margins on crop nutrient blends.
$ In millions, except DAP price Q4 2013 Q3 2013 Q4 2012
Net sales $1,556 $1,419 $1,656
Gross Margin $188 $193 $280
Percent of net sales 12% 14% 17%
Operating earnings $96 $58 $208
Sales volumes 3.4 2.7 2.8
NA production volume(a) 2.0 2.1 2.2
Finished product operating rate 81% 88% 89%
Avg DAP selling price $381 $436 $532
(a) Includes crop nutrient dry concentrates and animal feed ingredients
0
50
100
150
200
250
300
350
400
Q4 2012 OE Rawmaterials
Salesprice
Salesvolumes
Other Q4 2013 OE
OPERATING EARNINGS BRIDGE $ IN MILLIONS
30
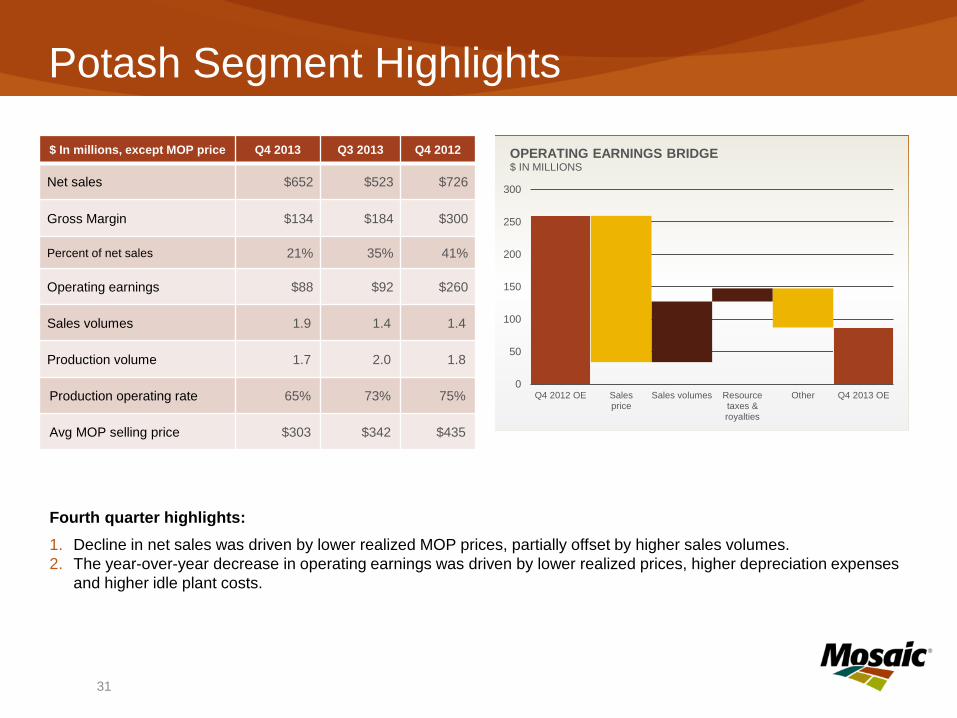
Potash Segment Highlights
Fourth quarter highlights: 1. Decline in net sales was driven by lower realized MOP prices, partially offset by higher sales volumes. 2. The year-over-year decrease in operating earnings was driven by lower realized prices, higher depreciation expenses
and higher idle plant costs.
$ In millions, except MOP price Q4 2013 Q3 2013 Q4 2012
Net sales $652 $523 $726
Gross Margin $134 $184 $300
Percent of net sales 21% 35% 41%
Operating earnings $88 $92 $260
Sales volumes 1.9 1.4 1.4
Production volume 1.7 2.0 1.8
Production operating rate 65% 73% 75%
Avg MOP selling price $303 $342 $435
0
50
100
150
200
250
300
Q4 2012 OE Salesprice
Sales volumes Resourcetaxes &royalties
Other Q4 2013 OE
OPERATING EARNINGS BRIDGE $ IN MILLIONS
31

Phosphate Raw Material Trends
32
$-
$50
$100
$150
$200
$250
Q12012
Q22012
Q32012
Q42012
Q12013
Q22013
Q32013
Q42013
Q12014F
Realized in Cost of Goods Sold Market Prices
$-
$100
$200
$300
$400
$500
$600
$700
$800
Q12012
Q22012
Q32012
Q42012
Q12013
Q22013
Q32013
Q42013
Q12014F
Realized Costs Market Prices
Ammonia Sulfur ($/tonne) ($/tonne)
1) Market ammonia prices are average prices based upon Tampa C&F as reported by Fertecon 2) Market sulfur prices are average prices based upon Tampa C&F as reported by Green Markets
2
2 1

Click to edit Master title style
33 33
Financial Guidance Summary
Phosphates Guidance – 2014 Q1 Sales volume 2.3 – 2.6 million tonnes Q1 DAP selling price $390 - $420 per tonne Q1 Gross margin rate in the upper teens Q1 Operating rate in the low 80 percent range
Potash Guidance – 2014 Q1 Sales volume 2.3 – 2.7 million tonnes Q1 MOP selling price $245-$275 per tonne Q1 Gross margin rate around the 30 percent range Q1 Operating rate mid 80 percent range
Canadian Resource Taxes and Royalties - 2014 $120 -$180 million
Brine Management – 2014 Approximately $200 million

Click to edit Master title style
34 34
Financial Guidance Summary
Corporate Guidance – 2014
Total SG&A - 2014 $350 - $400 million
Capital Expenditures - 2014 $1.0 billion to $1.3 billion
Effective Tax Rate - 2014 Mid to high 20 percent range