Embed Size (px)
Citation preview

AIFUL CORPORATION
ANNUAL REPORT 2002
AIFUL CORPORATION
ANNUAL REPORT 2002
The more pieces we add,the better the picture.
The more pieces we add,the better the picture.

AIFUL CORPORATION is a leader in Japan’s consumer finance industry. Since its establishment, the Companyhas striven to create value for all its stakeholders—customers, shareholders and employees—in line with its corporate philosophy of obtaining community support for all its activities. Over the years, AIFUL has expandedits operations, while ensuring that it continues to meet the expectations of all its customers.
In fiscal 2001, ended March 31, 2002, AIFUL served its more than two million customers through 1,592branches and a network of 35,904 cash dispensers and automated teller machines (ATMs). On a consolidatedbasis, the balance of loans outstanding at March 31, 2002, was ¥1,482,796 million ($11,148,842 thousand).
The Company is listed on the first sections of the Tokyo Stock Exchange (TSE) (Code: 8515) and the OsakaSecurities Exchange (OSE).
In March 2001, AIFUL acquired LIFE Co., Ltd., a leading Japanese consumer credit company. At March 31,2002, this subsidiary had 8,710,000 cardholders and 76,000 member merchants accepting its cards. This broadcustomer base and extensive marketing channel have allowed AIFUL to accelerate its drive to become a compre-hensive provider of financial services. The AIFUL Group comprises the parent company and seven consolidatedsubsidiaries, including LIFE, which are working together to expand the Group’s foundations in comprehensivefinancial services and build long-term asset value for AIFUL’s shareholders.
Percentage Thousands ofMillions of Yen Change U.S. Dollars
2002 2001 02/01 2002
For the Year: Total income ........................................................................... ¥ 400,014 ¥ 281,719 42.0% $ 3,007,624Total expenses ......................................................................... 338,166 189,145 78.8 2,542,601Income before income taxes and minority interests............. 61,848 92,574 -33.2 465,023Net income.............................................................................. 35,064 48,253 -27.3 263,639
At Year-End:Balance of loans outstanding ................................................. 1,482,796 1,261,042 17.6 11,148,842Installment accounts receivable ............................................. 120,756 86,642 39.4 907,940Total assets............................................................................... 2,029,634 1,865,537 8.8 15,260,406Long-term debt, including current portion thereof .............. 1,291,781 1,191,942 8.4 9,712,639Total shareholders’ equity ...................................................... 421,343 306,550 37.4 3,167,992Number of shares outstanding............................................... 93,376,000 84,876,000 10.0
PercentagePer Share Data: Yen Change U.S. Dollars
Net income.............................................................................. ¥390.00 ¥569.32 -31.5% $2.93Cash dividends........................................................................ 50.00 50.00 0.0 0.38
Notes: 1.The U.S. dollar amounts have been translated, for convenience only, at ¥133=$1, the approximate rate of exchange at March 29, 2002.2. Net income per share has been computed based on the weighted average number of shares outstanding during each period, after retroactive
adjustment for stock splits.
Contents
Noteworthy Events .................................................................. 1Message from the President ................................................... 2Special Feature......................................................................... 4Review of Operations ............................................................ 18Financial Section ................................................................... 23Board of Directors .................................................................. 68Investor Information...................................... inside back cover
Cautionary Remark Regarding Forward-Looking StatementsStatements made in this annual report with respect to AIFUL’s plans, strategies and beliefs and other statements that are not historical factsare forward-looking statements based on the assumptions and beliefs of the Company’s management in light of the information currentlyavailable to it and involve risks and uncertainties that may affect the Company’s future performance. Potential risks and uncertainties inAIFUL’s areas of business include, without limitation, social, economic and financial conditions.
PROFILE
CONSOLIDATED FINANCIAL HIGHLIGHTSAIFUL CORPORATION and Consolidated Subsidiaries
Years Ended March 31, 2002 and 2001

AIFUL CORPORATION Annual Report 2002 1
NOTEWORTHY EVENTS
First Quarter Second Quarter
Third Quarter Fourth Quarter
April 2, 2001 New Start for LIFE, Businext LaunchedLIFE started operating as a whollyowned subsidiary. BusinextCorporation, a joint venture withThe Sumitomo Trust & Banking Co.,Ltd., began offering financing ser-vices for small businesses.
June 4, 2001 Sanyo Shinpan Becomes WhollyOwned SubsidiarySanyo Shinpan Co, Ltd., a 100%-owned consumer credit and creditcard firm, became a wholly ownedsubsidiary.
November 8, 2001 LIFE Share Parcel TransferredThe Company transferred 4.12% ofits stake in LIFE to financial institu-tions with which it conducts trans-actions, to help LIFE obtain fundingmore easily.
November 27, 2001 AsTry Loan Services EstablishedAIFUL and Aozora Bank, Ltd.,jointly created AsTry Loan ServicesCorporation, a debt-servicing company that harnesses AIFUL’sexpertise in retail credit manage-ment and collections and AozoraBank’s sales network.
December 7, 2001 Employee Stock Options GrantedThe Company granted stock optionsto employees and directors toencourage them to boost revenuesand earnings.
January 27, 2002 Fixed Assets Transferred to SubsidiaryAIFUL transferred all its rental andcommercial property to MARUTOHCo., Ltd., a wholly owned subsidiary,as part of a drive to optimally allo-cate Group management resources.At the same time, AIFUL reclassifiedunused property as held for sale,cutting prices to reflect current market values.
March 20, 2002 Businext Buys Lending BusinessIn keeping with an expansionarydrive, Businext acquired the build-ing contractor lending operations of Misawa Homes Co., Ltd., for ¥3.7 billion.
August 25, 2001 New Shares IssuedAIFUL raised ¥87 billion through apublic offering of 3.5 million sharesand 5 million shares of commonstock in Japan and overseas, respec-tively. AIFUL used these funds toimprove its equity ratio, which haddeclined as a consequence of itsacquisition of LIFE, and reinforcethe Company’s financial position tosupport further business expansion.

AIFUL CORPORATION Annual Report 2002 2
MESSAGE FROM THE PRESIDENT
am pleased to report on our achievements in fiscal2001. During this period, we continued do our utmostto serve Japan’s ¥65 trillion consumer credit market,
while building value in line with our long-term manage-ment vision of becoming a comprehensive retail financialservices group.
Operating Environment In the final decade of the 20th century, Japan’s consumerfinance market tripled in size, to around ¥9 trillion. Underour medium-term management plan, we expect the marketto continue expanding, before flattening out at ¥13 trillionin 2010. As the market heads toward maturity, we arealready witnessing an intense battle for market share thatcrosses traditional business boundaries. For example,major consumer finance institutions are entering the con-sumer credit and credit card businesses and establishingjoint ventures with banks. Foreign players are entering theindustry through mergers and acquisitions (M&A).
The operating environment greatly affected our busi-ness performance during the year under review. We stroveto overcome unfavorable macroeconomic conditions andattract new customers for our unsecured loans. Despiteextensive advertising campaigns, centered on televisioncommercials, unsecured loan volume declined in the sec-ond half of the term, as personal consumption stagnatedamid concerns about Japan’s economic prospects. Baddebt write-offs continued to increase, owing to a surge inbankruptcies and record highs in the unemployment rate.History suggests that our results should recover in linewith a pickup in the economy, as new lending and badloans tend to fluctuate with the economy.
On the legal front, in June 2003 the Japanese govern-ment plans to once again review the interest rate ceilingunder the Distributions Law. The maximum interest rateunder this law has already been reduced from 40.004% to29.2% in response to concerns over the unethical collec-tion methods of some commercial lenders. AIFUL andother members of the consumer finance industry havecontinued to lobby lawmakers to enhance their under-standing of the sector, and are doing their best to eliminatethe collection problems that prompted the previous revision to the regulations.
I
Yoshitaka FukudaPresident and CEO

AIFUL CORPORATION Annual Report 2002 3
Management Strategy The medium-to-long-term management strategy of theAIFUL Group is to strengthen its foundations ahead of thematuration of the consumer finance market by becoming acomprehensive retail financial services provider.
To realize this goal, we are diversifying both our prod-uct lineup and distribution channels for securing cus-tomers. In addition, we are striving to become a leadingplayer as competition spills across traditional businessboundaries by prioritizing M&A and forming alliances thathelp us bolster Group competitiveness and brand value.
We did much in the year under review as part of ourstrategic drive to become a comprehensive retail finan-cial services provider. Our achievements included theacquisition of LIFE, a leading Japanese consumer creditcompany, and the establishment of a joint venture withSumitomo Trust & Banking to specialize in lending tomedium-risk small business owners and corporations.
Through our acquisition of LIFE, we expanded our cus-tomer base to more than 8 million people. Immediatelyafter the purchase, we swiftly implemented managementimprovements to enhance the AIFUL Group’s competitive-ness in the consumer credit market, while improvingLIFE’s performance.
Operating AchievementsTo complement our diversification strategies under ourcomprehensive retail financial services vision, we havealso focused on reinforcing LIFE’s management, launch-ing new businesses and forming partnerships with banksin the assurance field.
Under our product diversification strategy, we areemphasizing unsecured loans, home equity loans andsmall business loans, and developing products that meetcustomer needs. These offerings include loans that help tostreamline company cash flows.
Through our strategy of diversifying distribution chan-nels to attract more customers, we are working to improvecustomer convenience by developing the existing distribu-tion channels of Group companies and exploiting theprestige of the AIFUL brand in consumer finance. We aredoing this by forging alliances with companies in otherfields, pursuing M&A, offering Internet cashing andimplementing other new approaches.
Since taking over LIFE, we have concentrated onrevamping its poor earnings structure by building a high-return assets portfolio. These efforts led to LIFE posting¥2.4 billion in ordinary income just a year after bank-ruptcy. We intend to keep increasing LIFE’s profitability byallocating more resources to it so LIFE can become a high-earnings business in the consumer credit and other fields.Examples include shopping and cashing services underthe LIFE Credit Card and unsecured loans through theLIFE Play Card.
Future Challenges Competition between the major players, increased rivalrywith foreign firms and banks newly entering the markethave led to unprecedented competition in the consumerfinance industry. Through our acquisition of LIFE, wehave branched out from our roots in consumer financeand entered Japan’s ¥65 trillion consumer credit market.In our drive to become a leading player in this market, we are endeavoring to expand our customer base andbroaden the scope of our operations, while pursuing anM&A strategy covering consumer finance and credit firms.At the same time, we are pursuing synergies throughGroup management so that we can streamline operationalefficiency and more effectively deploy our resources togreatly reduce costs.
To achieve further progress in the consumer financemarket, we have prioritized the building of an AIFULGroup brand over the three years of our medium-termmanagement plan.
As we prepare to meet new challenges, we willurgently work to bolster LIFE’s profitability so it can helpdrive Group growth.
I look forward to your continuing support andencouragement in the year ahead.
Yoshitaka FukudaPresident and CEO
June 26, 2002

Interview with
President Yoshitaka Fukuda
AIFUL CORPORATION Annual Report 2002 4
SPECIAL FEATURE
Theme One: Operating Environment
Please outline your views on the consumerfinance market. Also, what are your growth targets in that market?
Q
Interview with
President Yoshitaka Fukuda

AIFUL CORPORATION Annual Report 2002 5
Around 10 years ago, the consumer finance mar-
ket was worth ¥3 trillion, or just 4.9% of the
consumer credit market. By 2000, it had
expanded to ¥9 trillion, accounting for 13.6% of the con-
sumer credit market. In the decade since Japan’s bubble
economy burst, apart from consumer finance, the only
growth has been in credit sales and credit cards. But the
companies in the latter two fields are relatively small, so I
believe that consumer finance players have been the big
winners amid these changes.
That said, growth is now stabilizing in the consumer
finance market, which has driven consumer credit expan-
sion to date. I think the consumer finance market will
mature over the next few years.
Our medium-term management plan assumes that
the rate of growth in the industry will decelerate over
the next two to three years as customers will probably
borrow less in response to the currently poor economic
conditions, and falling interest rates should lead to a
long-term slowdown in industry growth. In the medium-
to-long term, we think that the industry will grow until
2010, when the consumer finance market will be worth
¥13 trillion. The market should remain at that level
thereafter.
A
Overview of Japan’s Consumer Credit Market – The Breaking Down of Traditional Business Barriers
(As of the end of calendar 2000; Trillion of yen)
Source: Consumer Credit Market Statistics, Japan Consumer Credit Industry Association
Credit sales(Credit sales andcredit card companies)
(¥15.9)
Consumer finance
(¥49.2)
Credit card
(¥3.2)
Deposited collateral (¥13.5)
Installment credit
(¥12.6)
Consumer loans
(¥35.6)
Single payment (¥2.0)
Installment (¥1.2)
Single payment (¥0.7)
Installment (¥11.9)
Post offices and financial institutions (¥13.5)
Banks and other financial institutions (¥21.0)
Consumer finance companies (¥8.8)
Credit sales and credit card companies (¥5.3)
Other (¥0.5)

What do you think of the players newlyentering the consumer finance industry and the industry’s increasingly borderless nature?
AIFUL CORPORATION Annual Report 2002 6
SPECIAL FEATURE
Q
In terms of new entries, it would have been
unthinkable just a few years ago that banks
would form alliances with players in our
industry to start offering cashing services, creating such
companies as Mobit Co., Ltd., and At-Loan Co., Ltd. Fiscal
2001 saw the launch of the bank-owned Tokyo-Mitsubishi
Cash One Ltd.
Foreign institutions have also made inroads into the
Japanese consumer finance market. In 1998, for example,
General Electric Capital Corporation acquired Lake Co.,
Ltd., and deployed aggressive television commercial cam-
paigns aimed particularly at marketing secured loans. The
ING Group invested in consumer finance company NICE
Co., Ltd., while Ripplewood Holdings LLC invested in
Shinki Co., Ltd., the consumer finance arm of Shinsei
Bank, Limited, in which Ripplewood is a major investor.
Still, the player most in the spotlight has been Citigroup
Inc. for its consumer finance acquisitions strategy. Over
the past two years, Citigroup has bought a number of
small and medium-sized firms, such as AIC Corporation,
DIC Finance Corporation and Unimat LIFE Corporation
as part of efforts to build a top presence in the consumer
finance market in Japan.
Banks are focusing their consumer finance strategies
on accepting loan applications through unmanned lend-
ing centers, the Internet and fax services. But these setups
are merely sales support tools. It is impossible to provide
the comprehensive cashing services critical to consumer
finance if you do not maintain a branch network. The
keys to success in retail finance are a strong brand that
highlights a readiness to provide unsecured loans and a
solid branch network. Furthermore, we believe that the
risk pricing prospects are extremely limited at the 18%
interest rates that banks are offering.
Foreign institutions do, admittedly, have global
brand names. Nonetheless, they operate through Japanese
mid-tier consumer finance firms that they have acquired,
and those businesses still use their pre-acquisition names.
In other words, the foreign players have not unified their
brands.
The new entrants do not seem serious rivals to
Japan’s well-established, large consumer finance firms,
although bank- and foreign-owned companies do have
the potential to cultivate and reinvigorate the consumer
finance market.
A

AIFUL CORPORATION Annual Report 2002 7
Theme Two: New Customer Trends
How is the changing business environmentaffecting your new customer levels?
Q
In fiscal 2001, the number of new customers rose
just 2.0%, to 462,000 accounts, and we actually
posted a decline in the number of new cus-
tomers in the second half of the term, for the first time in
three years.
Our industry suffered an overall drop in new cus-
tomer numbers mainly because concerns over the econ-
omy’s prospects prompted people to refrain from borrow-
ing. Possible market saturation was less of a factor. During
the year, average worker incomes fell 1.2%, the first drop
in three years, which is largely why consumer confidence
has been weakened. In addition, the aggressive television
commercial campaigns that consumer finance firms
mounted from 1999, after lifting a voluntary ban on such
advertising, have become less effective.
Another factor—an internal one for AIFUL—is that
in the second half of fiscal 2001 we tightened lending to
constrain loan write-offs. Accordingly, only 71.8% of loan
applications in the second half of the fiscal year were suc-
cessful, compared with 74.8% in the first half of the fiscal
year. In addition, we moved away from “soft-sell” com-
mercials to those presenting more specifics and with
greater impact. Consumers did not like the new approach,
which likely contributed to the decrease in new loan
applications.
I think that our operating environment will remain
severe until corporate restructuring run their course and
unemployment begins to fall, leading to an improvement
in consumer confidence. Because of internal factors, I
believe it will be hard for us to raise the percentage of suc-
cessful loan applications in the current economic climate.
Still, we will return to running soft-sell commercials and
continue to improve customer service.
A

AIFUL CORPORATION Annual Report 2002 8
SPECIAL FEATURE
What are your reflections on AIFUL’Schange in marketing approach?
Q
Consumer finance marketing is “pull” oriented,
centering on television commercials, newspaper
advertising and signboards. Marketing tech-
niques have varied depending on the phase.
The first phase involved the use of branch networks.
For example, when Acom Co., Ltd., developed its auto-
mated lending machines the company was able to quickly
set up a nationwide network of unmanned lending cen-
ters. The increased convenience boosted new customer
numbers.
The next major development was in 1999, when the
ban on consumer finance advertising on prime-time televi-
sion was lifted. Promise Co., Ltd., ran an intensive soft-sell
commercial campaign that highlighted images of tradi-
tional Japan. We rolled out our commercial strategy after
that. Instead of taking Promise’s approach, we opted to pre-
sent AIFUL as a provider of peace of mind, with our com-
mercials showing employees dealing in person with cus-
tomers at our loan centers. This more personal technique
was a first in the domestic consumer finance industry, and
many viewers accepted the message of trustworthiness and
A reliability, propelling us to the top in terms of new
customer numbers.
Today, commercials seem to have lost much of their
original impact, indicating that we have overmarketed on
television. Our advertising and sales operations are cur-
rently working together to develop new products and the
next marketing phase.

AIFUL CORPORATION Annual Report 2002 9
Theme Three: Loan Write-Offs
How do you interpret loan write-off risks?Q
The state of the macroeconomy is an increasingly
significant factor in the current surge in loan
write-offs. Also, changes in the legal frame-
work have prompted more people to seek legal advice in
an attempt to avoid discharging their debt obligations.
At the macroeconomic level, unemployment rates
and loan write-offs correlate quite closely. A decade ago,
when the unemployment rate was 2%, loan write-offs
were 2.5%. Now, with unemployment at a record high of
5.6%, loan write-offs have risen to 4.1%. In other words, a
one percentage point increase in the unemployment rate
boosts loan write-offs approximately half a percentage
point.
The legal environment changed with the April 2001
introduction of the Code of Personal Bankruptcy Reha-
bilitation, which lifted a ban on attorney advertising. With
more attorneys becoming active in the bankruptcy field
ahead of the government’s scheduled June 2003 review of
the Distribution Law’s interest rate ceiling, we are seeing
more personal bankruptcies being declared. Such declara-
tions hit a record high of 160,000 in fiscal 2001.
A Personal bankruptcies will probably remain at a high
level until the 2003 revision, although the increasing num-
ber of loan write-offs owing to macroeconomic factors will
probably abate as the Japanese economy recovers. This
improvement, combined with revisions to AIFUL’s scoring
system, should lead to a gradual decline in loan write-offs
and delinquencies.

AIFUL CORPORATION Annual Report 2002 10
SPECIAL FEATURE
What are your views on changes to the legalframework for consumer finance?
Q
The government lowered the Distribution Law’s
interest rate ceiling in 2000 in response to social
uproar about the dubious collection practices
of some commercial lenders—which operate in a com-
pletely different industry to ours—concluding that high
interest rates were the cause of the problem. Neither
AIFUL nor other leading consumer finance firms had
engaged in contentious collection practices. Since then,
we have done our utmost to ensure that society does not
again confuse us with these commercial lenders. To
improve understanding of our industry’s position, we are
working with counterpart firms to maintain proactive dis-
closure through the media, approach lawmakers and act
through the Liaison Group of Consumer Finance
Companies, which is chaired by a Waseda University pro-
fessor. Through these efforts, we and other members of
our industry have been striving to convince the govern-
ment that further reinforcing interest rate regulations
would make no sense. While there is a risk that the gov-
ernment will cut the interest rate ceiling even further in
2003, we will continue to work with other firms in the
industry to prevent this happening.
A

AIFUL CORPORATION Annual Report 2002 11
Why did you decide to pursue a vision ofbecoming a comprehensive retail financial services provider?
Theme Four: Management Strategies for a New Operating Environment
As I mentioned earlier, we expect the rate of
growth in the consumer finance market to
decelerate, and then stabilize in the near
future. Nonetheless, we want to maintain and expand our
presence in the consumer finance market, while diversify-
ing our product lineup and customer acquisition chan-
nels. Four firms currently dominate the oligopolistic con-
sumer finance market. The need to seek new vehicles for
growth beyond this ¥9 trillion market underscored our
acquisition of LIFE and our creation of Businext, which
serves middle-risk business owners and corporations.
These moves have given us greater access to the ¥65 tril-
lion consumer credit market. In other words, we want to
build an overall capability in retail finance so we can
emerge as a winner from an inevitable restructuring of our
industry.
Q
A

AIFUL CORPORATION Annual Report 2002 12
SPECIAL FEATURE
What type of comprehensive retail financeplayer do you aim to become, and what areyour main priorities in launching Group management?
Q
The pursuit of efficiency through selective con-
centration is very popular at the present time.
We believe it is better to duplicate and dis-
perse our resources under our comprehensive retail
consumer finance vision.
Selective concentration seems critical for companies
facing stagnation in maturing industries. In our view, such
a policy would prevent us from seizing the opportunities
available to us by expanding beyond consumer finance
into the ¥65 trillion consumer credit market.
In the consumer credit market, the boundaries have
broken down between consumer finance, credit cards and
credit sales, with players scrambling for a share. Rather
than limiting our horizons, we are promoting “diffusion
and duplication” through M&A and alliances and doing
our utmost to broaden our operating base before the
battle for market share intensifies. That said, in our
next medium-term management plan we intend to har-
ness selective concentration principles in assessing the
profitability and efficiency of our expanded businesses.
A

AIFUL CORPORATION Annual Report 2002 13
AIFUL Group Business Activities – Diffusion and Duplication
“Super Dunk”business loan
guarantee partnershipwith The Daiwa Bank, Ltd.
Businext
Personal loanguarantee partnerships
with local banks,credit unions andcredit associations
Sinwa
Happy Credit Sanyo Shinpan
Cash Plaza
Consumer finance Credit sales and credit card Business loans
Hig
h ris
kLo
w r
isk
Credit card, installment creditaand guarantee partnershipsr

AIFUL CORPORATION Annual Report 2002 14
SPECIAL FEATURE
Why is brand image so important for AIFUL, and how are you deploying it?
Q
As a comprehensive retail finance player, we con-
sider the AIFUL brand an important tool in sig-
nificantly differentiating ourselves from the
competition as we expand into the consumer credit mar-
ket. The leading consumer finance firms have done much
to enhance their brands. Despite all that, they have not yet
altered the ratio of male customers to female customers,
which currently stands at 7:3. But if you look at credit card
companies, such as Credit Saison Co., Ltd., you see that
the ratio is fairly balanced. This implies that women do
not like to borrow from consumer finance firms, but are
quite happy to obtain cash on credit cards, such as the
LIFE Card.
Consumer credit firms have formed alliances with a
wide range of top companies to help secure new cus-
tomers, but AIFUL does not have access to such acquisition
channels. That is why improving the Group’s brand image
is central to our medium-term management plan goal of
successful expansion as we move beyond our consumer
finance roots.
The AIFUL Group is striving to reinforce its corporate
brand by holding monthly Groupwide brand meetings.
A These gatherings encompass debate over policies to
improve the clout of our television commercials or
sponsorship of sporting and other events as part of our
commitment to corporate citizenship.
One unique advantage we have over our consumer
finance rivals is the increased brand awareness we secured
by taking over leading consumer credit company LIFE.
Roughly half of LIFE’s customers are female, which is an
advantage other consumer finance firms do not enjoy.
This acquisition and other moves are part of our strategy
to increase overall Group brand value.

AIFUL CORPORATION Annual Report 2002 15
How did you create the revenues and earningsmodel you used to rebuild LIFE, and whatapproaches are you considering to further strengthenLIFE so it can deliver high returns?
Q
Following our takeover of LIFE, we reshuffled its
portfolio so it could provide high returns based
on stronger operating assets. The first step was
to have LIFE completely withdraw from the low-profit
automobile loan and home loan guarantee businesses
and focus on the high-return card cashing and consumer
finance businesses. Like AIFUL, LIFE offers loan card ser-
vices, so we had LIFE adopt our scoring system in that
area to allow it to achieve high growth in outstanding
loans. LIFE also has a card cashing business—in contrast
to AIFUL—so it is not so straightforward to apply our
expertise to help LIFE increase its usage rates and cashing
per customer. That said, LIFE has been able to expand its
customer base through alliances for the LIFE Card.
In areas outside the card cashing business, we trans-
ferred settlement authority from LIFE’s headquarters to its
branches. This has allowed LIFE to rapidly increase per-
item shopping sales, which offer high returns, thereby
enhancing profitability. In its first year of operations
under the AIFUL umbrella, LIFE has gone from bank-
ruptcy to ordinary income of ¥2.4 billion. Our target for
fiscal 2002 is ordinary income of ¥8.0 billion.
Over the next two to three years, through our initia-
tives we are aiming for LIFE to build solid earnings foun-
dations. The goal thereafter is for LIFE to expand its core
credit sales and credit card businesses. In credit cards, we
want LIFE to secure more large merchants and expand its
customer base, while diversifying its settlement approaches
and usage channels to build value by becoming more
attractive, thereby increasing its capacity utilization.
A
LIFE’s Complete Rehabilitation only One Year after Acquisitionand Looking to Dominate the Credit Sales and Credit Card Businesses
Notes: 1. ’s consolidated accounts.2. LIFE’s figures are on a receivables basis that includes receivables dropped from the balance sheet through securitization.
Fiscal 2000 Fiscal 2001 Fiscal 2002(Acquisition) (Results) (Targets)
Card membership (Thousands) 7,480 8,710 9,780Receivables (Millions of yen) 606,313 612,509 687,641Loans outstanding (Millions of yen) 196,559 250,903 312,550
79,824 101,076Ordinary income 2,404 8,000

AIFUL CORPORATION Annual Report 2002 16
SPECIAL FEATURE
Please describe your efforts to increase the efficiency and profitability of your business processes.
Q
To achieve success in the consumer credit market,
the AIFUL Group pursues the benefits possible
from the organic synergies between all Group
members.
We are cultivating sales synergies by having all Group
members diversify their product lineups and customer
distribution channels. For example, all Group companies
market AIFUL’s secured loans and take advantage of LIFE’s
credit card system to issue credit cards. In these and other
ways we are ensuring that Group companies use resources
more efficiently.
In terms of cost synergies, we have already trans-
ferred the back office operations of Happy Credit
Corporation, Sinwa Co., Ltd., and Sanyo Shinpan Co.,
Ltd., to AIFUL’s headquarters. A single advertising com-
pany produces all the AIFUL Group’s television commer-
cials, which has allowed us to maintain advertising vol-
ume at a lower cost.
We are building systems synergies by jointly devel-
oping and using new setups. A good example of this is an
operating center that we plan to open in October 2002.
AThis facility will centralize everything from applications to
collections. Within a very short time frame, all Group com-
panies will transfer their loans and claims management to
this new center, thereby cutting costs considerably. By tak-
ing a Group approach to developing and sharing products
and systems, we are seeking to bolster Group profitability.
Through such endeavors, we seek a consolidated return on
assets of more than 3.0%.

AIFUL CORPORATION Annual Report 2002 17
Please outline your corporate citizenship efforts.Q
We sponsor a variety of sports events throughout
Japan as part of our contribution to society.
In fiscal 2001, we sponsored the AIFUL
Cup Golf Tournament 2001, which was held at the
Ajigasawa Country Club in July 2001 and was the Japan
Golf Tour Organization’s 16th event for the year. The
Ajigasawa Athletics Association helped run the tournament,
and we sought other ways to involve the local community.
AIFUL also sponsored the 11th Fukuchiyama
Marathon in Kyoto Prefecture, sanctioned by the Japan
Association of Athletics Federations. This annual event is
one of the few in Japan to attract around 10,000 runners,
and has increasingly become a favorite among amateur
athletes.
Also in fiscal 2001, we sponsored the International
Judo Federation’s World Judo Championships, held in
Munich, Germany. More than 670 judoka from 90 nations
competed at this event, which entertained countless fans
around the globe.
AOur social involvement extends beyond the sponsor-
ship of sporting events. For example, we support group
and individual volunteers through the Volunteer Heartful
Prize and will continue to support community activities
in keeping with the spirit of the United Nations’ Inter-
national Year of Volunteers 2001.
AIFUL plans to continue seeking as many opportuni-
ties as possible to interact with society through a variety
of activities—centered on sports events—in line with its
corporate philosophy of obtaining community support
for its operations.

AIFUL CORPORATION Annual Report 2002 18
REVIEW OF OPERATIONS
he Company has been pursuing strategies to
diversify its product lineup and customer market-
ing channels in keeping with its vision of becom-
ing a provider of comprehensive retail financial services.
Our product diversification strategy encompasses
meeting the sophisticated needs of our customers by
developing derivatives for unsecured loans, home equity
loans and small business loans.
We are diversifying our distribution channels and
enhancing convenience to attract more customers by
forming partnerships with companies in other industries,
pursuing M&A, engaging in bank assurance and offering
cashing services over the Internet.
In fiscal 2001, these efforts helped boost the balance
of loans outstanding at year-end 13.3%, to ¥1,313.7 bil-
lion. The number of customer accounts was up 5.8%, at
2,244,283 accounts.
Unsecured Loans
At the end of the first half of the fiscal year, the number of
new unsecured loans had climbed 11.1% compared with
the previous corresponding period, to 245,000 accounts,
reflecting the impact of an aggressive television commer-
cial campaign. In the second half of the period, the com-
mercials were less effective, as customers refrained from
borrowing in response to worsening economic conditions.
The number of new unsecured loans decreased 6.7% year-
on-year in the second half of the period, to 216,000
accounts. At the end of fiscal 2001, therefore, the number
of new unsecured loans rose just 2.0%, to 462,000
accounts, compared with the end of the previous fiscal
year. The number of new accounts declined, owing to
changing employment patterns among the young, an
unfavorable macroeconomic environment and the
Company’s tightened lending controls.
The average yield on unsecured loans outstanding
decreased 0.3 percentage point compared with the pre-
vious term, to 25.7%, as we lowered interest rates for cus-
tomers with high creditworthiness in response to
intensified competition and increased larger loans as a
proportion of total lending. Unsecured loans outstanding
at year-end averaged ¥472,000 per customer, up 5.2%.
These factors resulted in a 10.6% rise in unsecured
loans outstanding at year-end, to a record high of
¥1,019,293 million, with the number of unsecured loan
accounts at year-end gaining 5.1%, to 2,155,000 accounts.
Home Equity Loans
We launched home equity loans in 1985, and are cur-
rently researching the home equity loans business in the
United States. In contrast to unsecured loans, where write-
offs are increasing, the write-off ratio for home equity
loans in fiscal 2001 remained low, at just over 1%, under-
lining the advantage of property-secured lending.
AIFUL
T

AIFUL CORPORATION Annual Report 2002 19
Another key factor in the low write-off rate was that
AIFUL limited the ratio of unsecured loans to customers
in Tokyo, Nagoya, Osaka and Fukuoka to 30% of the
nationwide total, as home prices have fluctuated in those
four major cities. We distributed the balance among areas
where land prices are much more stable. Approximately
half our home equity loans use first mortgages. We also
reinforced stability by limiting about 80% of secured
loans to less than 70% of appraised collateral value.
At the end of the period under review, home equity
loans outstanding stood at ¥277,671 million, up 23.1%
from the end of the previous period. The number of
accounts also rose 23.1%, to 75,000 accounts. These fig-
ures show that secured loans are now an important factor
in AIFUL’s growth.
Small Business Loans
In this third major area, the average loan was relatively
low, at ¥1,190,000 per account. We focus on funding
small business owners with unsecured and secured loans,
after launching operations in this category in 1998 to take
advantage of rising discontent among small business own-
ers with regular loan providers and the increasing difficul-
ties the self-employed faced in obtaining finance as the
state of the Japanese economy worsened. We have built
our funding on solid assessment grounds.
At the end of fiscal 2001, small business loans out-
standing rose 37.1% from the end of the previous fiscal
year, to ¥16,726 million. The number of accounts
increased 37.6%, to 13,000 accounts.
Other Businesses
During the period under review, we pursued guarantee
partnerships with banks in line with our drive to diversify
our customer distribution channels and lending options.
Under these alliances, we screen and guarantee applicants
for bank loans and handle claims management, both on a
fee basis. At March 31, 2002, we had guarantee partner-
ships with six banks, with the value of guarantees totaling
¥2,700 million.
Small Business Loans
Home Equity Loans
Unsecured Loans
0201009998
Total Balance of Loans Outstanding
0
300,000
600,000
900,000
1,200,000
1,500,000
0
500
1,000
1,500
2,000
2,500
0201009998
Small Business Loans
Home Equity Loans
Unsecured Loans
Number of Customer Accounts
0
400
800
1,200
1,600
2,000
Unstaffed BranchesStaffed Branches
Unmanned Loan-ContractingMachines
(Millions of Yen) (Thousands)
0201009998
Number of Branches and UnsecuredLoan-Contracting Machines

AIFUL CORPORATION Annual Report 2002 20
REVIEW OF OPERATIONS
LIFE
his review of LIFE’s operations for fiscal 2001
focuses on our four basic strategies for that
subsidiary.
Strengthening Consumer Credit Operations
through Credit Cards
During the period under review, we continued to
strengthen LIFE’s credit card and credit sales operations.
The number of cardholders rose 1,230,000, to 8,710,000
customers. Cardholders increased their shopping and
cashing usage between 15% and 20%. The main driver of
this growth was an increase in the number of cards issued
on the back of stronger links with such leading retailers as
Aoyama Co., Ltd., which sells men’s apparel, and
DEODEO CORPORATION, a consumer electronics firm.
Another factor was the success of a card that features
members of the GLAY pop group. In addition, we made
LIFE’s cards more attractive by increasing loan limits
based on our credit expertise and expanded services to
cardholders by upgrading LIFE’s web site. LIFE’s stronger
financial position enhanced its standing among its busi-
ness partners, prompting them to more readily accept
LIFE’s cards.
In per-item shopping loans, the number of member
merchants accepting its cards increased about 3,000 dur-
ing the year under review, with average monthly purchases
increasing more than 30%, to over ¥10 billion. The yield
from these operations improved 0.5 percentage point.
Our reorganization of LIFE’s business structure was the
prime driver of this growth. For example, we transferred
considerable authority to branches, which helped clarify
standard yields when concluding merchant agreements
and allowed us to consolidate LIFE’s back-office opera-
tions. Another benefit was that branch employees were
better able to monitor merchants.
Revamping the Portfolio to Enhance Profitability
LIFE has stopped accepting new applications for auto-
mobile and home loans, as these businesses are unlikely
to become profitable. It is now concentrating its resources
on key areas that generate earnings, notably the LIFE Cash
Plaza loan card, credit card cashing services and install-
ment sales finance loans. Loans through the LIFE Cash
Plaza loan card increased 39.1% in the year under review,
reflecting the addition of new loan offices and the intro-
duction of AIFUL’s scoring system as well as other benefits
derived from the synergies arising from its association
with AIFUL. Card cashing advances jumped 23.2%, due to
more effective management, which boosted lending preci-
sion. Installment sales finance operations performed
solidly in the near absence of outstanding automobile
loans.
T

AIFUL CORPORATION Annual Report 2002 21
Personnel and Organizational Reforms
LIFE has instituted a performance-based employee remu-
neration system that balances the responsibilities under-
taken by branch managers and other executives with
incentives. On the organizational front, LIFE has elimi-
nated the knowledge gap between executives and employ-
ees in the field by ensuring the sharing of information at
strategic management meetings. In addition, LIFE has
strengthened top executives’ organizational controls in
keeping with efforts to bolster profitability centered on
installment sales finance loans.
Cost-Cutting
LIFE’s first step in cutting costs was to relocate branches
from buildings with high rents to more reasonably priced
premises. It also vacated one floor at its Tokyo headquar-
ters and streamlined work flows. These initiatives have
lowered annual running costs about ¥3.5 billion. LIFE
next focused on improving its collections structure by
adopting AIFUL’s expertise and installing new computer
systems. This endeavor greatly enhanced collections effi-
ciency and halved the number of employees needed for
such operations.
LIFE has also greatly reinforced its cost structure by
overhauling its sources of funding. In the first half of fiscal
2001, for example, it obtained ¥274.0 billion in funds
through high-cost nonrecourse loans. From October 2001,
however, LIFE switched to securitizing loans, thus lower-
ing the interest rate on ¥245.0 billion in funding to less
than 1%. LIFE also procured a total of ¥52.5 billion from
10 financial institutions with which it regularly does busi-
ness. As a result of these efforts, Rating and Investment
Information, Inc., assigned a BBB+ rating to LIFE immedi-
ately after rehabilitation procedures ended, which has
allowed the company to greatly diversify its sources of
funding.
LIFE’s Challenges
In the card business, LIFE is striving to make its offerings
even more attractive for customers, thereby building card-
holder numbers and usage rates. Growth strategies include
diversifying access channels, offering customer-specific
interest rates, diversifying repayment options and han-
dling collections more efficiently.
In the installment sales finance loans business, the
main efforts are targeted at greater organizational efficiency
to improve operating capacity and the cultivation of new
markets. LIFE has launched a special web site to increase
its attractiveness to merchants. The site offers an array of
information, such as information on popular products,
and provides timely merchant support services.
The objective of the LIFE Cash Plaza loan card is to
achieve high growth by continuing to strengthen lending
and expand the office network.

AIFUL CORPORATION Annual Report 2002 22
REVIEW OF OPERATIONS
OTHER GROUP COMPANIES
he AIFUL Group includes several other companies
that allow it to serve the entire consumer credit
market. They include consumer finance subsidiaries
Sinwa and Happy Credit. Another is Sanyo Shinpan, which
has refocused its business model from credit sales to con-
centrate on consumer finance. Other key Group members
are AsTry Loan Services, which is engaged in debt-servicing,
and Businext, which serves middle-risk small business own-
ers and corporations.
Happy Credit and Sinwa both offer unsecured loans
and draw on AIFUL’s lending expertise and branch net-
work to develop products that take advantage of the syn-
ergies with Group operations. They also aim to build new
business models and streamline costs to become non-
banks with a superior reputation for customer satisfac-
tion in the retail sector. At the end of fiscal 2001, Happy
Credit’s loans outstanding increased 19.6% compared
with the end of the previous fiscal year, to ¥32,428 mil-
lion, and the number of customer accounts increased
20.6%, to 105,000 accounts. Loans outstanding for Sinwa
jumped 25.5%, to ¥21,169 million, with the number of
customer accounts gaining 21.3%, to 57,000 accounts.
Sanyo Shinpan boosted its loans outstanding 5.1%, to
¥11,387 million, and the number of customer accounts
increased 8.3%, to 26,000 accounts.
At the end of the period under review, Businext’s
outstanding loans stood at ¥8,116 million, with 5,000
customer accounts. In March 2002, Businext acquired
¥3.7 billion in claims from Misawa Homes, helping
Businext become profitable that month. Nevertheless,
the operating environment was much harsher than ini-
tially expected. One critical factor in Businext’s operations
in fiscal 2001 was that small business owners and
corporations cut capital expenditure and refrained from
borrowing in response to the government’s economic
reform efforts.
Another development was that Businext used the
advertising approach that has been so successful for
AIFUL over the years in its unsecured loans business.
Unfortunately, this “pull” marketing approach attracted
more high-risk applicants and fewer medium-risk
clientele than envisaged.
Based on that experience, from the start of fiscal 2002
Businext has switched to a “push” marketing program
centered on visiting sales representatives who were part
of AIFUL’s claim acquisition from Misawa Homes, to
focus on cultivating business from fewer, higher quality
borrowing prospects.
T

AIFUL CORPORATION Annual Report 2002 23
FINANCIAL SECTION
Contents
Management’s Discussion and Analysis of Operations and Financial Condition ...................................... 24
Consolidated Balance Sheets ........................................................ 28Consolidated Statements of Income............................................ 30Consolidated Statements of Shareholders’ Equity ...................... 31Consolidated Statements of Cash Flows...................................... 32Notes to Consolidated Financial Statements............................... 34Independent Auditors’ Report ...................................................... 50Non-Consolidated Statements of Income ................................... 51Non-Consolidated Balance Sheets ............................................... 52Non-Consolidated Statements of Shareholders’ Equity ............. 54Notes to Non-Consolidated Financial Statements...................... 55Independent Auditors’ Report ...................................................... 65Non-Consolidated Six-Year Summary ........................................ 66

AIFUL CORPORATION Annual Report 2002 24
Management’s Discussion and Analysis of Operations and Financial ConditionAIFUL CORPORATION and Consolidated Subsidiaries
Consolidated Performance
Earnings In fiscal 2001, ended March 31, 2002, total income soared 42.0%,to ¥400,014 million ($3,008 million). Interest on loansaccounted for 89.8% of this amount, at ¥359,318 million ($2,702million). Aggregate interest on credit card shopping loans, per-item shopping loans and loan guarantees was ¥21,171 million($159 million), representing 5.3% of total income.
The increase in total income was primarily due to theinclusion of the operations of LIFE in the consolidated statementsof income from fiscal 2001. Prior to the fiscal year under review,that subsidiary’s figures were only reflected in the consolidatedbalance sheets.
Owing to the consolidation of LIFE’s operations, totalexpenses in fiscal 2001 jumped 78.8%, to ¥338,166 million($2,543 million).
This increase stemmed partly from extraordinary costs. Forexample, the Group posted a ¥31,241 million ($235 million) losson write-down of property, plant and equipment as a result of thesale, at market price, of AIFUL properties (excluding theheadquarters building) to MARUTOH, a real estate subsidiary.Another factor was the reclassification of unused real estate asproperty for sale, which contributed ¥2,147 million ($16 million)to the write-down of inventories.
In addition, AIFUL posted ¥4,235 million ($32 million) instock issue costs in August 2001.
Depreciation and amortization was ¥19,269 million ($145million), including ¥12,310 million ($93 million) to amortizegoodwill of newly acquired subsidiaries. This amount wassignificantly higher than in the previous term as the Group wrotedown ¥9,131 million ($69 million) in goodwill of LIFE in theconsolidated adjustment account to offset deferred tax assets inLIFE’s accounts and recognize losses carried forward from thatsubsidiary after bankruptcy. As a result, goodwill amortization ofLIFE in fiscal 2001 was ¥11,869 million ($89 million),comprising ¥2,738 million ($21 million) based on annualstraight-line amortization and the goodwill write-downmentioned above. Goodwill amortization of the Group’sconsumer finance subsidiaries was ¥441 million ($3 million).
As a result of these factors, income before income taxes andminority interests fell 33.2%, to ¥61,848 million ($465 million).Net income dropped 27.3%, to ¥35,064 million ($264 million).
AssetsAt the end of the period under review, total assets were up 8.8%from the end of the previous period, at ¥2,029,634 million($15,260 million). Total current assets rose 11.6%, to ¥1,871,400million ($14,071 million). Loans jumped 17.6%, to ¥1,482,796million ($11,149 million), with loans made by AIFULrepresenting 88.6% of that amount. Installment accountsreceivable surged 39.4%, to ¥120,756 million ($908 million).
Loan guarantees fell 24.2%, to ¥140,143 million ($1,054million), owing to LIFE’s withdrawal from the automobile and
home loan guarantee businesses. LIFE’s installment accountsreceivable included ¥153,158 million ($1,152 million) in off-balance sheet securitized loans and ¥89,550 million ($673million) in off-balance sheet securitized installment accountsreceivable.
Within property, plant and equipment, land declined 67.0%,to ¥15,163 million ($114 million). Buildings and structures weredown 16.3%, to ¥41,819 million ($314 million), due to the write-down of property mentioned previously.
Within investments and other assets, goodwill, net, dropped36.9%, to ¥23,240 million ($175 million), mainly as a result ofthe amortization of goodwill of LIFE. Deferred tax assets jumped133.2%, to ¥21,264 million ($160 million), reflecting theadoption of tax effect accounting for the loss carryforwards ofLIFE.
Liabilities Total current liabilities increased 5.8%, or ¥39,855 million ($300million), to ¥729,114 million ($5,482 million). This was mainlythe result of a 25.2% jump in the combined amount of short-termborrowings and current portion of long-term debt, to ¥498,763million ($3,750 million). Obligations under loan guarantees wasdown 24.2%, to ¥140,143 million ($1,054 million), to offsetinstallment accounts receivable.
Total long-term liabilities increased 0.8%, to ¥875,666million ($6,584 million). Long-term debt, less the current portionthereof, was up 0.6%, to ¥845,510 million ($6,357 million).
The Group aims to diversify its sources of funding to balancethe risks and costs of interest-bearing debt.
During the term, AIFUL issued ¥81,000 million ($609million) in bonds, ¥39,000 million ($293 million) in securitizedreal-estate assets and ¥50,000 million ($376 million) in asset-backed commercial paper. The Company also had commitmentsof ¥100,000 million ($752 million).
In October 2001, LIFE replaced its high-interest nonrecourseloans with securitizations that lowered the interest rate to lessthan 1%, thus removing ¥245,000 million ($1,842 million) fromthe accounts. Despite having filed for bankruptcy only a yearearlier, LIFE was able to secure ¥52,500 million ($395 million) infunds from a total of 10 financial institutions. It also obtained aBBB+ rating from Rating and Investment Information, which hasallowed that subsidiary to further diversify its funding sources.
Shareholders’ Equity AIFUL issued new shares in August 2001 to improve its equityratio, which had declined as a consequence of its acquisition ofLIFE. Thanks to the cooperation of investors, this issue raised¥87,048 million ($654 million), of which ¥43,528 million ($327million) was credited to common stock and ¥43,520 million($327 million) to paid-in capital. As a consequence, totalshareholders’ equity was ¥421,343 million ($3,168 million). Theconsolidated equity ratio was 20.8% and the return on assets(ROA) was 1.8%.

AIFUL CORPORATION Annual Report 2002 25
0
20,000
40,000
60,000
80,000
100,000
0
10
20
30
40
50
Income before Income Taxesand Minority Interests(Left Scale)
Ratio of Income before Income Taxesand Minority Interests to Total Income(Right Scale)
02010099980
800
1,600
2,400
3,200
4,000
400,000
800,000
1,200,000
1,600,000
2,000,000
0201009998
Small Business Loans
Secured Loans
Unsecured Loans
Number of Customer Accounts
0
Small Business Loans
Secured Loans
Unsecured Loans
Installment Accounts Receivable
Guarantees
0201009998
Total Balance of Loans Outstanding
Income before Income Taxesand Minority Interests
(Millions of Yen) (Thousands) (Millions of Yen) (%)
0
10,000
20,000
30,000
40,000
50,000
0
4
8
12
16
20
02010099980
80,000
160,000
240,000
320,000
400,000
0
20
40
60
80
100
02010099980
200
400
600
800
0201009998
Net Income Total ExpensesNet Income per Share
Net Income (Left Scale)Ratio of Net Income to Total Income (Right Scale)
Net Income per Share
Adjusted Net Income per Share Total Expenses (Left Scale)Ratio of Total Expenses to Total Income (Right Scale)
(Millions of Yen) (%) (Yen) (Millions of Yen) (%)
Note: Figures from 1998 to 2000 are on a non-consolidated basis. Figures for 2001 and 2002 are on a consolidated basis.

AIFUL CORPORATION Annual Report 2002 26
Management’s Discussion and Analysis of Operations and Financial ConditionAIFUL CORPORATION
Non-Consolidated Performance
EarningsIn fiscal 2001, interest on loans climbed 12.7%, to ¥296,034million ($2,226 million). This was the major factor in the increasein total income of 14.4%, which rose to ¥311,843 million($2,345 million).
Largely owing to a 10.6% increase in the balance of unsecuredloans at year-end, to ¥1,019,293 million ($7,664 million),interest on these loans increased 10.8%, to ¥249,088 million($1,873 million). At the end of the period under review, securedloans were 23.1% higher than at the end of the previous period, at¥277,671 million ($2,088 million), with interest on these loansclimbing 23.1%, to ¥43,054 million ($324 million).
At the end of the period, small business loans were up 37.1%from a year earlier, at ¥16,726 million ($126 million). Interestfrom these loans increased 34.7%, to ¥3,891 million ($29million).
Sales of property for sale totaled ¥2,824 million ($21 million),reflecting disposals in line with AIFUL’s decision to withdraw fromthe real estate business. Interest on loans to LIFE and othersubsidiaries skyrocketed 348.5%, to ¥3,633 million ($27 million),owing to the significant amount of loans to subsidiaries that wasused to replace high interest rate borrowing.
Total expenses were up 32.8%, to ¥239,189 million ($1,798million). One of the major factors in this change was a 24.0%jump in charge-offs and provision for doubtful loans, advances tosubsidiary and claims in bankruptcy, which rose to ¥67,931million ($511 million). Advertising expenses increased 13.1%, to¥19,274 million ($145 million), reflecting the mounting ofaggressive television commercial campaigns during the period.
Extraordinary expenses included, as explained in theconsolidated discussion and analysis, stock issue costs and a netloss on sales of property resulting from the disposal of property atmarket price and the reclassification of unused real estate asproperty for sale.
Consequently, income before income taxes fell 21.4%, to¥72,654 million ($546 million). Total income taxes were down22.0%, to ¥34,305 million ($258 million), because of theadoption of tax effect accounting. Net income fell 20.9%, to¥38,349 million ($288 million), while net income per sharedeclined 25.5%, to ¥426.54 ($3.21).
AssetsAt the end of fiscal 2001, total assets were up 9.7% comparedwith the end of the previous fiscal year, at ¥1,740,868 million($13,089 million). Total current assets increased 12.3%, to¥1,392,018 million ($10,466 million). This was mainly due to a13.3% increase in loans, to ¥1,313,690 million ($9,877 million).
The combined amount of land and buildings and structuresdeclined 62.8%, to ¥28,368 million ($213 million), owing tosales at market value to a subsidiary.
Total investments and other assets climbed 16.3%, to¥325,543 million ($2,448 million). Investments in and advancesto subsidiaries and associated companies were up 17.1%, to¥266,814 million ($2,006 million), principally as a result of theacquisitions of LIFE, Happy Credit and Sinwa.
Liabilities Total current liabilities climbed 16.7%, to ¥492,370 million($3,702 million), mainly as a result of a 20.8%, or ¥79,028million ($594 million), increase in the combined amount ofshort-term borrowings and current portion of long-term debt. Thisincluded repayments of ¥65,000 million ($489 million) in bondsand ¥6,000 million ($45 million) in medium-term notes. Totallong-term liabilities declined 3.9%, to ¥828,005 million ($6,226million).
AIFUL’s basic interest-bearing debt policy is to diversify itssources of financing, sourcing 40% directly and the rest indirectly.Long-term borrowings, including the current portion thereof,accounted for 97.7% of funding. To minimize interest rate risk,the Company has fixed interest on 65.4% of its borrowingsthrough fixed interest loans, interest rate caps and swaps.
During the term under review, AIFUL securitized its securedloans and established commitment lines to reduce funding costsand lower vulnerability to unforeseen developments.
Shareholders’ Equity At the end of fiscal 2001, total shareholders’ equity was ¥420,493million ($3,162 million), up 39.0%, or ¥117,892 million ($886million), from the end of fiscal 2000. The non-consolidatedequity ratio increased 5.1 percentage points, to 24.2%. This wasbecause the Company made a global offering of 8.5 millionshares in August 2001 to strengthen capitalization in light of theacquisition of LIFE, thereby raising ¥87,048 million ($654million). ROA declined 1.2 percentage points, to 2.3%, whilereturn on equity (ROE) fell 6.9 percentage points, to 10.6%,compared with the previous term.

AIFUL CORPORATION Annual Report 2002 27
0
400,000
800,000
1,200,000
1,600,000
2,000,000
02010099980
300,000
600,000
900,000
1,200,000
1,500,000
0
20
40
60
80
100
02010099980
100,000
200,000
300,000
400,000
500,000
0
5
10
15
20
25
0201009998
Balance of Borrowings (Left Scale)Ratio of Long-Term Debt to Total Borrowings (Right Scale)
Shareholders’ Equity (Left Scale)Shareholders’ Equity Ratio (Right Scale)
Total Assets Balance of Borrowings Total Shareholders’ Equity
(Millions of Yen) (Millions of Yen) (%) (Millions of Yen) (%)
0
10
20
30
40
50
0
1.0
2.0
3.0
4.0
5.0
02010099980
2,000
4,000
6,000
8,000
10,000
02010099980
400
800
1,200
1,600
2,000
0
200
400
600
800
1,000
0201009998
ROE (Left Scale)ROA (Right Scale)
Number of Branches (Left Scale)Balance of Loans Outstandingper Branch (Right Scale)
ROE/ROA Net Income per EmployeeNumber of Branches/Balance of Loans Outstanding per Branch
(%) (%) (Thousands of Yen) (Millions of Yen)
Note: Figures from 1998 to 2000 are on a non-consolidated basis. Figures for 2001 and 2002 are on a consolidated basis.

AIFUL CORPORATION Annual Report 2002 28
CONSOLIDATED BALANCE SHEETSAIFUL CORPORATION and Consolidated SubsidiariesMarch 31, 2002 and 2001
Thousands ofU.S. Dollars
Millions of Yen (Note 3)
2002 2001 2002
ASSETSCURRENT ASSETS:
Cash and cash equivalents ................................................................................... ¥ 139,126 ¥ 153,435 $ 1,046,060Time deposits (Note 9)......................................................................................... 1,632 2,056 12,271Loans (Notes 4 and 9) .......................................................................................... 1,482,796 1,261,042 11,148,842Installment accounts receivable (Notes 5 and 9)................................................ 120,756 86,642 907,940Loan guarantees (Note 6)..................................................................................... 140,143 184,778 1,053,707Other receivables................................................................................................... 16,113 23,138 121,150Allowance for doubtful loans and receivables .................................................... (92,117) (82,562) (692,609)Inventories (Notes 7 and 9) ................................................................................. 1,215 3,036 9,135Prepaid expenses ................................................................................................... 4,075 4,799 30,639Deferred tax assets (Note 12) ............................................................................... 9,971 12,865 74,970Other current assets (Note 9) ............................................................................... 47,690 27,840 358,571
Total current assets .......................................................................................... 1,871,400 1,677,069 14,070,676
PROPERTY, PLANT AND EQUIPMENT (Note 9):Land ....................................................................................................................... 15,163 45,956 114,008Buildings and structures ....................................................................................... 41,819 49,984 314,429Machinery and equipment ................................................................................... 11,375 12,071 85,526Construction in progress ...................................................................................... 25
Subtotal ............................................................................................................. 68,357 108,036 513,963Accumulated depreciation.................................................................................... (27,249) (32,156) (204,880)
Net property, plant and equipment ............................................................... 41,108 75,880 309,083
INVESTMENTS AND OTHER ASSETS:Investment securities (Notes 8 and 9) ................................................................. 9,028 8,232 67,880Investments in and advances to unconsolidated subsidiaries and associated companies (Note 13) ................................................................ 4,836 4,381 36,361
Claims in bankruptcy (Note 4) ............................................................................ 14,268 11,859 107,278Allowance for advances to an unconsolidated subsidiary and claims in bankruptcy ................................................................................... (17,220) (15,833) (129,474)
Goodwill, net ........................................................................................................ 23,240 36,835 174,737Software, net.......................................................................................................... 7,429 7,178 55,857Long-term loans receivable (less current portion).............................................. 8,727 8,809 65,617Lease deposits........................................................................................................ 10,898 10,944 81,940Long-term prepayments........................................................................................ 3,983 2,798 29,947Deferred tax assets (Note 12) ............................................................................... 21,264 9,120 159,880Deferred losses on hedging instruments, mainly interest rate swaps (Note 2 r.)............................................................. 22,931 20,091 172,414
Other assets (Note 9)............................................................................................ 7,742 8,174 58,210Total investments and other assets ................................................................ 117,126 112,588 880,647
TOTAL ....................................................................................................................... ¥2,029,634 ¥1,865,537 $15,260,406
See Notes to Consolidated Financial Statements.

AIFUL CORPORATION Annual Report 2002 29
Thousands ofU.S. Dollars
Millions of Yen (Note 3)
2002 2001 2002
LIABILITIES AND SHAREHOLDERS’ EQUITYCURRENT LIABILITIES:
Short-term borrowings (Note 9).......................................................................... ¥ 52,492 ¥ 47,323 $ 394,677Current portion of long-term debt (Note 9) ....................................................... 446,271 351,200 3,355,421Trade notes payable .............................................................................................. 9,580 13,048 72,030Trade accounts payable (Note 9) ......................................................................... 23,475 27,942 176,503Obligations under loan guarantees (Note 6) ...................................................... 140,143 184,778 1,053,707Income taxes payable............................................................................................ 16,892 25,861 127,008Accrued expenses................................................................................................... 9,147 7,135 68,774Other current liabilities (Notes 5 and 6)............................................................. 31,114 31,972 233,940
Total current liabilities .................................................................................... 729,114 689,259 5,482,060
LONG-TERM LIABILITIES:Long-term debt (less current portion) (Note 9).................................................. 845,510 840,742 6,357,218Liability for retirement benefits (Note 10).......................................................... 7,026 7,144 52,827Interest rate swaps (Note 2 r.) .............................................................................. 22,305 20,091 167,707Other long-term liabilities.................................................................................... 825 602 6,203
Total long-term liabilities................................................................................ 875,666 868,579 6,583,955
MINORITY INTERESTS ........................................................................................... 3,511 1,149 26,399
SHAREHOLDERS’ EQUITY (Notes 11 and 16):Common stock,
authorized, 224,000,000 shares;issued, 93,376,000 shares at March 31, 2002,84,876,000 shares at March 31, 2001 .............................................................. 83,317 39,789 626,444
Additional paid-in capital .................................................................................... 94,048 50,528 707,128Retained earnings.................................................................................................. 246,240 215,978 1,851,428Net unrealized gain (loss) on available-for-sale securities ................................. (216) 255 (1,625)Treasury stock, at cost ........................................................................................... (2,046) — (15,383)
Total shareholders’ equity ............................................................................... 421,343 306,550 3,167,992
TOTAL ....................................................................................................................... ¥2,029,634 ¥1,865,537 $15,260,406

CONSOLIDATED STATEMENTS OF INCOMEAIFUL CORPORATION and Consolidated Subsidiaries
Years Ended March 31, 2002 and 2001
AIFUL CORPORATION Annual Report 2002 30
Thousands ofU.S. Dollars
Millions of Yen (Note 3)
2002 2001 2002
INCOME:Interest on loans.................................................................................................... ¥359,318 ¥272,237 $2,701,639Interest on credit card shopping loans ................................................................ 6,742 — 50,692Interest on per-item shopping loans.................................................................... 10,353 — 77,842Interest on loan guarantees .................................................................................. 4,076 — 30,647Interest on deposits, securities and other ............................................................ 582 538 4,376Sales of property for sale ...................................................................................... 2,824 40 21,233Income from restaurant business and other........................................................ 1,247 1,303 9,376Recovery of loans previously charged off ............................................................ 5,715 3,510 42,970Other income ........................................................................................................ 9,157 4,091 68,849
Total income ..................................................................................................... 400,014 281,719 3,007,624
EXPENSES:Interest on borrowings ......................................................................................... 31,697 26,863 238,323Charge-offs and provision for doubtful loans, receivables, advances to an unconsolidated subsidiary and claims in bankruptcy ............................ 92,576 59,194 696,060
Salaries and other employees’ benefits ................................................................ 42,234 25,402 317,549Advertising expenses ............................................................................................. 26,846 17,653 201,850Rental expenses ..................................................................................................... 22,961 15,662 172,639Commissions and fees ......................................................................................... 19,667 10,791 147,872Depreciation and amortization............................................................................ 19,269 4,717 144,880Stock issue costs .................................................................................................... 4,235 — 31,842Loss on write-down of property, plant and equipment ..................................... 31,241 — 234,895Provision for accrued pension and severance costs (Note 10)........................... 1,353 1,992 10,173Charge for full amount of transitional obligations for retirement benefits ...... — 1,025 —Provision for retirement benefits to directors and corporate auditors .............. 114 72 857Other expenses ...................................................................................................... 45,973 25,774 345,661
Total expenses................................................................................................... 338,166 189,145 2,542,601
INCOME BEFORE INCOME TAXES AND MINORITY INTERESTS .................... 61,848 92,574 465,023
INCOME TAXES (Note 12):Current................................................................................................................... 36,293 46,204 272,880Deferred ................................................................................................................. (8,908) (1,833) (66,977)
Total income taxes............................................................................................ 27,385 44,371 205,903
MINORITY INTERESTS IN NET LOSS ................................................................... 601 50 4,519
NET INCOME ........................................................................................................... ¥ 35,064 ¥ 48,253 $ 263,639
U.S. Dollars Yen (Note 3)
AMOUNTS PER COMMON SHARE (Note 2 s.):
Net income............................................................................................................ ¥390.00 ¥569.32 $2.93Cash dividends applicable to the year ................................................................. 50.00 50.00 0.38
See Notes to Consolidated Financial Statements.

AIFUL CORPORATION Annual Report 2002 31
Thousands Millions of Yen
Net UnrealizedNumber of Shares Additional Gain (Loss) on Treasuryof Common Stock Common Paid-in Retained Available-for-sale Stock,
Issued Stock Capital Earnings Securities at Cost
BALANCE AT APRIL 1, 2000 ................................... 56,103 ¥39,752 ¥41,913 ¥171,238 000 ¥ (1)Net income............................................................ 48,253Cash dividends paid, ¥50 per share .................... (3,381)Bonuses to directors and corporate auditors ...... (132)Stock split (Note 11) ............................................ 28,052Acquisition of Sinwa Co., Ltd (Note 11). ........... 721 37 8,615Net unrealized gain on available-for-sale securities ................................ ¥ 255
Net decrease in treasury stock.............................. 1BALANCE AT MARCH 31, 2001.............................. 84,876 39,789 50,528 215,978 255 Nil
Adjustment of retained earnings for newly consolidated subsidiaries ........................ 166
Net income............................................................ 35,064Cash dividends paid, ¥50 per share .................... (4,881)Bonuses to directors and corporate auditors ...... (87)Issuance of common stock (Note 11) ................. 8,500 43,528 43,520Net unrealized loss on available-for-sale securities ................................ (471)
Net increase in treasury stock .............................. (2,046)BALANCE AT MARCH 31, 2002.............................. 93,376 ¥83,317 ¥94,048 ¥246,240 ¥(216) ¥(2,046)
Thousands of U.S. Dollars (Note 3)
Net UnrealizedAdditional Gain (Loss) on Treasury
Common Paid-in Retained Available-for-sale Stock,Stock Capital Earnings Securities at Cost
BALANCE AT MARCH 31, 2001.............................. $299,166 $379,910 $1,623,894 $1,917 NilAdjustment of retained earnings for newly consolidated subsidiaries ........................ 1,248
Net income............................................................ 263,639
Cash dividends paid, $0.38 per share ................ (36,699)
Bonuses to directors and corporate auditors ...... (654)
Issuance of common stock (Note 11)................... 327,278 327,218
Net unrealized loss on
available-for-sale securities ................................ (3,542)
Net increase in treasury stock ............................. $(15,383)
BALANCE AT MARCH 31, 2002.............................. $626,444 $707,128 $1,851,428 $(1,625) $(15,383)
See Notes to Consolidated Financial Statements.
CONSOLIDATED STATEMENTS OF SHAREHOLDERS’ EQUITYAIFUL CORPORATION and Consolidated Subsidiaries
Years Ended March 31, 2002 and 2001

CONSOLIDATED STATEMENTS OF CASH FLOWSAIFUL CORPORATION and Consolidated Subsidiaries
Years Ended March 31, 2002 and 2001
AIFUL CORPORATION Annual Report 2002 32
Thousands ofU.S. Dollars
Millions of Yen (Note 3)
2002 2001 2002
OPERATING ACTIVITIES:Income before income taxes and minority interests........................................... ¥ 61,848 ¥ 92,574 $ 465,023
Adjustments for:Income taxes—paid ....................................................................................... (45,268) (46,008) (340,361)Depreciation and amortization..................................................................... 19,269 4,717 144,880Increase in allowance for doubtful loans and receivables, advances to an unconsolidated subsidiary and claims in bankruptcy .......................... 10,640 6,463 80,000
Provision for accrued pension and severance costs and retirement benefits................................................................................ (118) 2,070 (887)
Stock issue costs ............................................................................................. 4,235 — 31,842Amortization of bonds issue costs ................................................................ 976 939 7,338Loss on write-down of investment securities ............................................... 707 1,531 5,316Loss on write-down of property, plant and equipment............................... 31,241 — 234,895Loss on sales of property, plant and equipment .......................................... 121 1,554 910Loss on disposal of property, plant and equipment .................................... 901 382 6,774
Changes in assets and liabilities:Increase in loans ................................................................................................ (221,754) (166,813) (1,667,323)Increase in installment accounts receivable and loan guarantees .................. (34,114) — (256,496)Decrease in other receivables............................................................................ 7,024 — 52,812Decrease (increase) in claims in bankruptcy ................................................... (2,409) 4,167 (18,113)Decrease (increase) in inventories.................................................................... 2,155 (297) 16,203Decrease in prepaid expenses ........................................................................... 528 434 3,970Increase in long-term prepayments .................................................................. (1,615) (530) (12,143)Increase in other current assets ......................................................................... (12,829) (3,538) (96,459)Increase (decrease) in other current liabilities................................................. (7,023) 4,702 (52,805)
Other—net............................................................................................................. 1,730 93 13,007
Total adjustments ....................................................................................... (245,603) (190,134) (1,846,640)
Net cash used in operating activities ......................................................... (183,755) (97,560) (1,381,617)
INVESTING ACTIVITIES:Capital expenditures ............................................................................................. (8,274) (5,868) (62,210)Decrease (increase) in loans................................................................................. (7,029) 5,495 (52,850)Purchases of investment securities....................................................................... (3,666) (19) (27,564)Proceeds from sale of investment in a subsidiary ............................................... 4,200 — 31,579Acquisitions of businesses (net of cash acquired) .............................................. — (48,547) —Increase in loans by acquisition of business ....................................................... — (22,095) —Decrease (increase) in investment in trust .......................................................... (1) 2,000 (8)Other—net............................................................................................................. 3,565 (443) 26,805
Net cash used in investing activities—(Forward) ..................................... (11,205) (69,477) (84,248)

AIFUL CORPORATION Annual Report 2002 33
Thousands ofU.S. Dollars
Millions of Yen (Note 3)
2002 2001 2002
Net cash used in investing activities—(Forward) ..................................... (11,205) (69,477) (84,248)
FINANCING ACTIVITIES:Net increase (decrease) in short-term borrowings .............................................. 5,168 (74,647) 38,857Proceeds from long-term debt (net of bonds issue costs) .................................. 525,491 641,688 3,951,060Repayments of long-term debt............................................................................. (426,105) (326,756) (3,203,797)Proceeds from public offering (net of stock issue costs) .................................... 82,814 — 622,662Cash dividends paid ............................................................................................. (4,881) (3,413) (36,699)Acquisition of treasury stock ................................................................................ (2,046) — (15,383)Proceeds from minority shareholders.................................................................. 70 1,200 526
Net cash provided by financing activities ................................................. 180,511 238,072 1,357,226
FOREIGN CURRENCY TRANSLATION ADJUSTMENTS ON CASH AND CASH EQUIVALENTS................................................................ 16 — 120
NET INCREASE (DECREASE) IN CASH AND CASH EQUIVALENTS ................ (14,433) 71,035 (108,519)
CASH AND CASH EQUIVALENTS OF NEWLY CONSOLIDATEDSUBSIDIARIES, BEGINNING OF YEAR .............................................................. 124 1,381 932
CASH AND CASH EQUIVALENTS, BEGINNING OF YEAR ................................ 153,435 81,019 1,153,647
CASH AND CASH EQUIVALENTS, END OF YEAR.............................................. ¥ 139,126 ¥ 153,435 $ 1,046,060
NONCASH INVESTING ACTIVITIES:During the year ended March 31, 2001, the Company acquired LIFE Co., Ltd., Sanyo Shinpan Co., Ltd., Businext Corporation, and Sinwa Co., Ltd. (“Sinwa”) as follows:Fair value of assets acquired.............................................................................. ¥417,519Cash paid for capital stock, less acquired cash and cash equivalents ............ 48,547Liabilities assumed ............................................................................................ 360,320Value of 721,500 common shares issued for Sinwa........................................ 8,652
See Notes to Consolidated Financial Statements.

NOTES TO CONSOLIDATED FINANCIAL STATEMENTSAIFUL CORPORATION and Consolidated Subsidiaries
Years Ended March 31, 2002 and 2001
AIFUL CORPORATION Annual Report 2002 34
The accompanying consolidated financial statements have been prepared in accordance with the provisionsset forth in the Japanese Securities and Exchange Law and its related accounting regulations, and inconformity with accounting principles and practices generally accepted in Japan, which are different incertain respects as to application and disclosure requirements of International Accounting Standards. Theconsolidated financial statements are not intended to present the financial position, results of operationsand cash flows in accordance with accounting principles and practices generally accepted in countries andjurisdictions other than Japan.
In preparing these consolidated financial statements, certain reclassifications and rearrangements havebeen made to the consolidated financial statements issued domestically in order to present them in a formwhich is more familiar to readers outside Japan.
Certain reclassifications have been made to the prior year’s consolidated financial statements toconform to the classifications used for the year ended March 31, 2002.
a. Consolidation – The consolidated financial statements as of March 31, 2002 include the accounts ofAIFUL CORPORATION (the “Company”) and its seven (five in 2001, including LIFE Co., Ltd. and SanyoShinpan Co., Ltd. for which only the balance sheets were consolidated at March 31, 2001) significant sub-sidiaries (together, the “Group”). The accounts of AsTry Loan Services Corporation and Marutoh KK arenewly consolidated for the year ended March 31, 2002. Consolidation of the remaining subsidiarieswould not have a material effect on the accompanying consolidated financial statements. Investments infour (five in 2001) unconsolidated subsidiaries and one (two in 2001) associated company are accountedfor on the cost basis. The effect on the consolidated financial statements of not applying the equitymethod is immaterial. Goodwill on acquisition of subsidiaries is amortized using the straight line methodover ten years. However, when the excess of cost over net assets of subsidiaries acquired is not material,it is charged to income when incurred. All significant intercompany balances and transactions have beeneliminated in consolidation. All material unrealized profit included in assets resulting from transactionswithin the Group is eliminated.
As for two subsidiaries, LIFE Co., Ltd. (“LIFE”) and Sanyo Shinpan Co., Ltd. (“Sanyo Shinpan”), whichare consumer-credit companies, only the balance sheets were consolidated for the year ended March 31,2001, since the constructive date of acquisition was March 31, 2001. On March 28, 2001, the Companyacquired all the shares of LIFE. On March 31, 2001, Sanyo Shinpan was a wholly-owned subsidiary ofLIFE. On June 4, 2001, the Company acquired all the shares of Sanyo Shinpan from LIFE, and SanyoShinpan became a directly owned subsidiary of the Company.
On November 19, 2001, the Company and Aozora Bank, Ltd. established AsTry Loan ServicesCorporation, a new joint corporation, which engages in management and collection services for variousspecified loans.
Marutoh KK, which engages in real estate lease management, has become financially influenced by theCompany.
b. Cash Equivalents – Cash equivalents are short-term investments that are readily convertible into cash andthat are exposed to insignificant risk of changes in value. Cash equivalents include time deposits and cer-tificates of deposit which mature or become due within three months of the date of acquisition.
c. Inventories – Inventories include property for sale, property for sale under construction and supplies.Property for sale is stated at the lower of cost or market, cost being determined by the specific identifica-tion method. Depreciation of property for sale currently rented is computed by the same method, asapplied to property, plant and equipment. Property for sale under construction is stated at cost, cost beingdetermined by the specific identification method. Supplies are stated at the most recent purchase price,which approximates cost determined by the first-in, first-out method.
1. BASIS OFPRESENTINGCONSOLIDATEDFINANCIALSTATEMENTS
2. SUMMARY OFSIGNIFICANTACCOUNTINGPOLICIES

AIFUL CORPORATION Annual Report 2002 35
d. Investment Securities – Held-to-maturity debt securities are reported at amortized cost and available-for-sale securities are reported at fair value, with unrealized gains and losses, net of applicable taxes,reported in a separate component of shareholders’ equity. The cost of securities sold is determined basedon the moving-average method. Non-marketable available-for-sale securities are stated at cost determinedby the moving-average method. For other than temporary declines in fair value, investment securities arereduced to net realizable value by a charge to income.
e. Property, Plant and Equipment – Property, plant and equipment are stated at cost. Depreciation iscomputed by the declining-balance method. The range of useful lives is from 3 to 50 years for buildingsand structures and from 2 to 20 years for machinery and equipment.
f. Software – Expenditures for the purchase of software, which meet certain future-tests, are capitalized assoftware and amortized by the straight-line method over the estimated useful lives of five years.
g. Liability for Retirement Benefits – The Company and certain of its consolidated subsidiaries have con-tributory and non-contributory funded pension plans covering substantially all employees.
The Group accounted for the net liability for retirement benefits based on projected benefit obligationsand plan assets at the balance sheet date.
Liability for retirement benefits to directors and corporate auditors are provided at the amount whichwould be required if they retired at each balance sheet date.
h. Allowances for Doubtful Accounts – The allowance for doubtful accounts is stated in amounts consid-ered to be appropriate based on the Group’s past credit loss experience and an evaluation of potentiallosses in the receivables outstanding.
i. Leases – All leases are accounted for as operating leases. Under Japanese accounting standards for leases,finance leases that deem to transfer ownership of the leased property to the lessee are to be capitalized,while other finance leases are permitted to be accounted for as operating lease transactions if certain “asif capitalized” information is disclosed in the notes to the lessee’s consolidated financial statements.
j. Income Taxes – The provision for income taxes is computed based on the pretax income included in theconsolidated statements of income. The asset and liability approach is used to recognize deferred tax assetsand liabilities for the expected future tax consequences of temporary differences between the carryingamounts and the tax bases of assets and liabilities. Deferred taxes are measured by applying currentlyenacted tax laws to the temporary differences.
k. Appropriations of Retained Earnings – Appropriations of retained earnings are reflected in the consoli-dated financial statements for the following year upon shareholders’ approval.
l. Foreign Currency Transactions – All short-term and long-term monetary receivables and payablesdenominated in foreign currencies are translated into Japanese yen at the exchange rates at the balancesheet date. The foreign exchange gains and losses from translation are recognized in the consolidatedstatements of income.
m. Interest on Loans – Interest on loans is recorded on an accrual basis. In accordance with the practiceprevailing in the industry, the Group records accrued interest to the extent that the realization of suchincome is considered to be certain.
n. Installment Revenue – Fees from customers and member stores applying the add-on method are gener-ally recorded collectively as unearned income when credit contracts become effective and are recognizedin equal installments over the lives of contracts. Fees from customers applying the remaining principalmethod or revolving method are generally recognized in equal installments over the lives of contracts.
No installment revenue is recorded in the consolidated statement of income for the year ended March31, 2001 since the constructive date of acquisition of the two consumer credit subsidiaries was March31, 2001.
o. Interest on Borrowings – Interest on financial liabilities is accounted for as operating expenses whileother interest is included in other expenses.
p. Stock Issue Costs – Stock issue costs are charged to income as incurred.q. Bonds Issue Costs – Bonds issue costs, which are included in other assets, are amortized ratably over
periods up to three years.

NOTES TO CONSOLIDATED FINANCIAL STATEMENTSAIFUL CORPORATION and Consolidated Subsidiaries
AIFUL CORPORATION Annual Report 2002 36
r. Derivatives and Hedging Activities – The Group uses derivative financial instruments to manage its expo-sures to fluctuations in interest rates. Interest rate swaps and caps are utilized by the Group to reduce inter-est rate risks. The Group does not enter into derivatives for trading or speculative purposes. The account-ing standard for derivative financial instruments requires that: a) all derivatives are recognized as eitherassets or liabilities and measured at fair value, and gains or losses on derivative transactions are recognizedin the consolidated statements of income, and b) for derivatives used for hedging purposes, if derivativesqualify for hedge accounting because of high correlation and effectiveness between the hedging instrumentsand the hedged items, gains or losses on derivatives are deferred until maturity of the hedged transactions.
The interest rate swaps and caps which qualify for hedge accounting and meet specific matching cri-teria are not remeasured at market value but the differential paid or received under the swap or capagreements is recognized and included in interest expense or income.
s. Per Share Information – The computation of net income per share is based on the weighted average num-ber of shares of common stock outstanding during each period retroactively adjusted for stock splits.The weighted average number of common shares used in the computation for the years ended March 31,2002 and 2001 was as follows:
Diluted net income per share is not presented because no dilutive securities were outstanding for theyears ended March 31, 2002 and 2001.
Cash dividends per share presented in the accompanying consolidated statements of income are divi-dends applicable to the respective years including dividends to be paid after the end of the year withoutgiving retroactive adjustment for any subsequent stock split.
The consolidated financial statements are stated in Japanese yen, the currency of the country in which theCompany is incorporated and operates. The translation of Japanese yen amounts into U.S. dollar amounts areincluded solely for the convenience of readers outside Japan and have been made at the rate of ¥133=$1,the approximate rate of exchange at March 29, 2002. Such translations should not be construed as repre-sentations that the Japanese yen amounts could be converted into U.S. dollars at that or any other rate.
Loans at March 31, 2002 and 2001 consisted of the following (before allowance for doubtful loans):
Thousands ofMillions of Yen U.S. Dollars
2002 2001 2002
Unsecured .......................................................................... ¥1,332,218 ¥1,167,837 $10,016,677Secured............................................................................... 278,893 227,601 2,096,940Small business loans ......................................................... 24,843 12,198 186,789
Subotal ..................................................................... 1,635,954 1,407,636 12,300,406 Off-balance sheet securitized loans.................................. (153,158) (146,594) (1,151,564)
Net ............................................................................ ¥1,482,796 ¥1,261,042 $11,148,842
Registered moneylenders are required to disclose the following information under the Non-BankBond Law.
Average Number of Shares2002 89,908,0622001 84,775,313
3. TRANSLATIONINTO U.S. DOLLARS
4. LOANS

AIFUL CORPORATION Annual Report 2002 37
Thousands ofMillions of Yen U.S. Dollars
2002 2001 2002
Loans in legal bankruptcy ..................................................... ¥16,457 ¥13,071 $123,737Nonaccrual loans ................................................................... 28,723 25,644 215,962Accruing loans contractually past due three months or more as to principal or interest payments ..................... 11,945 7,196 89,812
Restructured loans ................................................................. 37,729 34,002 283,677Total ................................................................................... ¥94,854 ¥79,913 $713,188
Loans in legal bankruptcy are loans in which accruals of interest are discontinued (excluding theportion recognized as bad debts), based on management’s judgment as to the collectibility of principal orinterest resulting from the past due payment of interest or principal and other factors. Allowance for claimsin bankruptcy is stated at such amount less net realizable value of collateral.
Nonaccrual loans are loans in which accruals of interest are discontinued and those other than loans inlegal bankruptcy and loans granting deferral of interest payment to the debtors in financial difficulties to assistthem in their recovery where such deferred payments are regularly received. Accruing loans contractually pastdue three months or more as to principal or interest payments are loans for which payments of principal orinterest have not been received for a period of three months or more beginning with the next business dayfollowing the last due date for such payments. Loans classified as loans in legal bankruptcy and nonaccrualloans are excluded from accruing loans contractually past due three months or more.
Restructured loans are loans on which creditors grant concessions (e.g., reduction of the stated interestrate, deferral of interest payment, extension of maturity date, waiver of the face amount, or other concessivemeasures) to the debtors in financial difficulties to assist them in their recovery and eventually enable themto pay creditors. Loans classified as loans in legal bankruptcy, nonaccrual loans and accruing loanscontractually past due three months or more are excluded.
The securitized loans, which were not recognized on the consolidated balance sheets, amounted to¥153,158 million ($1,151,564 thousand) and ¥146,594 million at March 31, 2002 and 2001, respectively.
At March 31, 2002, the Group had a balance related to revolving loan contracts of ¥1,326,652 million($9,974,827 thousand) whereby a commitment was set up for each loan customer and the Group wasobligated to advance funds up to a predetermined amount upon request. At March 31, 2002, the balance ofunadvanced commitments was ¥3,680,028 million ($27,669,383 thousand). The loan contract containsprovisions that allow the Group to reduce the contract amount of the commitment or refuse to advancefunds to loan customers under certain conditions.

NOTES TO CONSOLIDATED FINANCIAL STATEMENTSAIFUL CORPORATION and Consolidated Subsidiaries
AIFUL CORPORATION Annual Report 2002 38
Installment accounts receivable and unearned income, included in other current liabilities at March 31,2002 and 2001, consisted of the following:
Thousands ofMillions of Yen U.S. Dollars
2002 2001 2002
Unearned Unearned UnearnedReceivables Income Receivables Income Receivables Income
Credit card shopping loans .............. ¥ 61,687 ¥1,044 ¥ 63,490 ¥ 164 $ 463,812 $ 7,850Per-item shopping loans................... 148,592 6,283 142,798 1,968 1,117,233 47,241Other.................................................. 27 — 35 — 203 —
Subotal ..................................... 210,306 7,327 206,323 2,132 1,581,248 55,091
Off-balance sheet securitized installment accounts receivable ..... (89,550) — (119,681) — (673,308) —
Net ............................................ ¥120,756 ¥7,327 ¥ 86,642 ¥2,132 $ 907,940 $55,091
In addition, the Group has unearned income of ¥258 million ($1,940 thousand) and ¥201 million atMarch 31, 2002 and 2001, respectively, related to loans other than those shown in the above table.
The securitized installment accounts receivable, which were not recognized in the balance sheets,amounted to ¥89,550 million ($673,308 thousand) and ¥119,681 million at March 31, 2002 and 2001,respectively.
The Group, as guarantor, recorded loan guarantees as a contra account of obligations under loanguarantees. Unearned income relating to loan guarantees was ¥1,294 million ($9,279 thousand) and¥2,949 million at March 31, 2002 and 2001, respectively.
Inventories at March 31, 2002 and 2001 consisted of the following:
Thousands ofMillions of Yen U.S. Dollars
2002 2001 2002
Property for sale ..................................................................... ¥1,025 ¥1,175 $7,707Property for sale under construction .................................... — 1,622 —Supplies .................................................................................. 190 239 1,428
Total .............................................................................. ¥1,215 ¥3,036 $9,135
5. INSTALLMENTACCOUNTSRECEIVABLE
7. INVENTORIES
6. LOAN GUARANTEESAND OBLIGATIONSUNDER LOANGUARANTEES

AIFUL CORPORATION Annual Report 2002 39
8. INVESTMENTSECURITIES
Investment securities as of March 31, 2002 and 2001 consisted of the following:
Thousands ofMillions of Yen U.S. Dollars
2002 2001 2002
Current:Government and corporate bonds .................................... ¥ 269 ¥ — $ 2,023
Non-current:Marketable equity securities .............................................. ¥9,018 ¥7,942 $67,805Government and corporate bonds .................................... 10 290 75
Total .............................................................................. ¥9,028 ¥8,232 $67,880
Information on the marketable securities classified as available-for-sale at March 31, 2002 and 2001 isas follows:
Millions of Yen
2002
Unrealized Unrealized FairCost Gains Losses Value
Available-for-sale:Equity securities ....................................................... ¥6,679 ¥267 ¥842 ¥6,104Debt securities .......................................................... 270 — — 270
¥6,949 ¥267 ¥842 ¥6,374
Millions of Yen
2001
Unrealized Unrealized FairCost Gains Losses Value
Available-for-sale:Equity securities ....................................................... ¥5,773 ¥830 ¥591 ¥6,012Debt securities .......................................................... 280 1 — 281
¥6,053 ¥831 ¥591 ¥6,293
Thousands of U.S. Dollars
2002
Unrealized Unrealized FairCost Gains Losses Value
Available-for-sale:Equity securities ....................................................... $50,218 $2,008 $6,331 $45,895Debt securities .......................................................... 2,030 — — 2,030
$52,248 $2,008 $6,331 $47,925

NOTES TO CONSOLIDATED FINANCIAL STATEMENTSAIFUL CORPORATION and Consolidated Subsidiaries
AIFUL CORPORATION Annual Report 2002 40
Available-for-sale securities and held-to-maturity securities whose fair values are not readilydeterminable as of March 31, 2002 and 2001 were as follows:
Carrying AmountThousands of
Millions of Yen U.S. Dollars
2002 2001 2002
Available-for-sale equity securities........................................ ¥2,913 ¥1,930 $21,902Held-to-maturity securities.................................................... 9 9 68
Total .............................................................................. ¥2,922 ¥1,939 $21,970
Proceeds from sales of available-for-sale securities for the years ended March 31, 2002 and 2001 were¥1,517 million ($11,406 thousand) and ¥11 million, respectively. Gross realized gains on these sales,computed on the moving average cost method, were ¥140 million ($1,053 thousand) for the year endedMarch 31, 2002, and gross realized losses were ¥2 million ($15 thousand) and ¥5 million for the yearsended March 31, 2002 and 2001, respectively.
The carrying values of debt securities by contractual maturities for securities classified as available-for-sale and held-to-maturity at March 31, 2002 are as follows:
Thousands ofMillions of Yen U.S. Dollars
Available- Held-to- Available- Held-to-for-sale maturity for-sale maturity
Due within one year ....................................................... ¥260 ¥9 $1,955 $68Due after one year through five years ............................ 10 — 75 —
Short-term borrowings at March 31, 2002 and 2001 consisted of the following:9. SHORT-TERMBORROWINGS ANDLONG-TERM DEBT Thousands of
Millions of Yen U.S. Dollars
2002 2001 2002
Commercial paper, 0.7880% (0.828% to 0.912% at March 31, 2001) ............................ ¥15,000 ¥15,000 $112,782
Loans from banks, 0.8363% to 2.600% (1.12% to 3.0% at March 31, 2001)................................... 15,211 24,800 114,368
Loans from other financial institutions, 1.475% (1.6% to 2.45% at March 31, 2001)................................... 2,000 2,500 15,038
Other (principally from leasing and factoring companies), 2.5% to 3.3% (2.4% to 2.9% at March 31, 2001)............. 20,281 5,023 152,489
Total .............................................................................. ¥52,492 ¥47,323 $394,677

AIFUL CORPORATION Annual Report 2002 41
Long-term debt at March 31, 2002 and 2001 consisted of the following:
Thousands ofMillions of Yen U.S. Dollars
2002 2001 2002
Loans from banks, 1.0846% to 4.200%, due serially to 2007 (1.001% to 4.2%, due serially to 2006 at March 31, 2001) ............................ ¥ 463,160 ¥ 400,165 $ 3,482,406
Loans from other financial institutions, 1.750% to 4.200%, due serially to 2007 (1.6% to 2.45%, due serially to 2006 at March 31, 2001) ............................... 219,885 245,434 1,653,271
Syndicated loans, 2.5%, due 2004(2.1%, due 2004 at March 31, 2001) ................................. 46,667 70,000 350,880
Unsecured 2.6% yen straight bonds, due 2001 ................... — 6,000 —Unsecured 2.425% yen straight bonds, due 2002(2.35% to 2.425% at March 31, 2001) .............................. 10,000 40,000 75,188
Unsecured 1.5% to 3.2% yen straight bonds, due 2003 ..... 75,000 75,000 563,910Unsecured 2.0% to 2.53% yen straight bonds, due 2004... 135,000 135,000 1,015,037Unsecured 1.75% to 1.86% yen straight bonds, due 2005 (1.86% at March 31, 2001)................................................. 30,000 10,000 225,564
Unsecured 1.7% to 3.27% yen straight bonds, due 2006 (3.27% at March 31, 2001)................................................. 60,000 15,000 451,128
Unsecured 2.51% yen straight bonds, due 2007 ................. 20,000 20,000 150,376Unsecured 2.48% yen straight bonds, due 2008 ................. 15,000 — 112,782Unsecured 3.28% yen straight bonds, due 2009 ................. 8,000 8,000 60,150Unsecured 2.93% to 3.0% yen straight bonds, due 2010... 20,000 20,000 150,376Unsecured 3.65% Euro-yen straight bonds, due 2003........ 9,500 9,500 71,429Unsecured variable rate Euro-yen straight bonds, due 2006 (1.825% at March 31, 2002, 2.136% at March 31, 2001) ................................................ 15,000 15,000 112,782
Unsecured 1.73% medium-term notes, due 2002............... 3,000 3,000 22,556Unsecured variable rate medium-term notes, due 2002 (1.75% at March 31, 2002 and 2001)................................ 3,000 3,000 22,556
Unsecured 2.21% medium-term notes, due 2007............... 1,000 — 7,519Unsecured 3.0% medium-term notes, due 2008................. 3,000 3,000 22,556Unsecured 3.5% medium-term notes, due 2015................. 15,000 15,000 112,782Other (principally from leasing and factoring companies), 2.0% to 4.8%, due serially to 2008 (0.98% to 5.4%, due serially to 2006 at March 31, 2001) ............................ 139,569 98,843 1,049,391
Subtotal ........................................................................ 1,291,781 1,191,942 9,712,639
Less current portion ............................................................... (446,271) (351,200) (3,355,421)Long-term debt, less current portion ................................. ¥ 845,510 ¥ 840,742 $ 6,357,218
The Company has an interest rate swap agreement that effectively converts variable rate interest payableon ¥3,000 million ($22,556 thousand) of medium-term notes, due 2002, to a fixed rate of 1.75%.

NOTES TO CONSOLIDATED FINANCIAL STATEMENTSAIFUL CORPORATION and Consolidated Subsidiaries
AIFUL CORPORATION Annual Report 2002 42
The aggregate annual maturities of long-term debt at March 31, 2002 were as follows:
Year ending March 31 Thousands ofMillions of Yen U.S. Dollars
2003 ..................................................................................................... ¥ 446,271 $3,355,4212004 ..................................................................................................... 336,830 2,532,5562005 ..................................................................................................... 232,490 1,748,0452006 ..................................................................................................... 67,657 508,6992007 ..................................................................................................... 75,333 566,4142008 and thereafter ............................................................................. 133,200 1,001,504
Total ............................................................................................ ¥1,291,781 $9,712,639
At March 31, 2002, the following assets were pledged as collateral for short-term borrowings and long-term debt (including current portion of long-term debt):
Thousands ofMillions of Yen U.S. Dollars
Time deposits ....................................................................................... ¥ 351 $ 2,639Loans .................................................................................................... 559,827 4,209,226Installment accounts receivable.......................................................... 50,918 382,842Property for sale................................................................................... 153 1,150Investment securities ........................................................................... 413 3,105Property, plant and equipment, net of accumulated depreciation ...................................................... 2,744 20,632
Other assets .......................................................................................... 2 15Total ............................................................................................ ¥614,408 $4,619,609
Related liabilities:Short-term borrowings.................................................................... ¥ 20,210 $ 151,955Long-term debt (including current portionof long-term debt)......................................................................... 497,083 3,737,466
Trade accounts payable................................................................... 274 2,060Total ............................................................................................ ¥517,567 $3,891,481
In addition, if requested by lending financial institutions the Group has committed to pledge collateral forloans other than those shown in the above table. At March 31, 2002, related liabilities for which lendingfinancial institutions can request the Group to pledge collateral consisted of the following:
Thousands ofMillions of Yen U.S. Dollars
Short-term borrowings................................................................... ¥ 5,211 $ 39,180Long-term debt (including current portion of long-term debt) .... 140,257 1,054,564
Total ....................................................................................... ¥145,468 $1,093,744
At March 31, 2002, other current assets amounting to ¥6,764 million ($50,857 thousand) werepledged as collateral for the interest rate swap contracts.

AIFUL CORPORATION Annual Report 2002 43
The Company and certain of its consolidated subsidiaries have contributory and non-contributoryfunded pension plans covering substantially all employees. Under the pension plans, employees ter-minating their employment are, in most circumstances, entitled to pension payments based on theiraverage pay during their employment, length of service and certain other factors. If the termination isinvoluntary, employees are usually entitled to larger payments than in the case of voluntary termination.
The liability for retirement benefits includes retirement benefits to directors and corporate auditorsof ¥1,068 million ($8,030 thousand) and ¥954 million at March 31, 2002 and 2001, respectively.
The liability for employees’ retirement benefits at March 31, 2002 and 2001 consisted of the following:
Thousands ofMillions of Yen U.S. Dollars
2002 2001 2002
Projected benefit obligation.................................................. ¥ 19,542 ¥ 18,361 $146,932Fair value of plan assets ......................................................... (12,350) (11,424) (92,857)Unrecognized prior service cost ............................................ 1,394 — 10,481Unrecognized actuarial loss .................................................. (2,628) (747) (19,759)
Net liability ..................................................................... ¥ 5,958 ¥ 6,190 $ 44,797
The components of net periodic benefit costs for the years ended March 31, 2002 and 2001 were asfollows:
Thousands ofMillions of Yen U.S. Dollars
2002 2001 2002
Service cost ............................................................................. ¥1,373 ¥ 814 $10,323Interest cost ............................................................................ 528 125 3,970Expected return on plan assets .............................................. (291) (92) (2,188)Amortization of prior service cost......................................... (573) — (4,308)Recognized actuarial loss....................................................... 316 1,145 2,376
Net periodic benefit costs ............................................. ¥1,353 ¥1,992 $10,173
Assumptions used for the years ended March 31, 2002 and 2001 were set forth as follows:
2002 2001
Discount rate.......................................................... 2.5% to 3.0% 3.0%Expected rate of return on plan assets .................. 1.5% to 2.5% 3.0% to 3.5%Amortization period of prior service cost............. Full amount charged to —
income as incurredRecognition period of actuarial gain/loss:
Company ........................................................... Full amount charged to Full amount charged to income as incurred income as incurred
One consolidated subsidiary............................ 10 years 10 yearsAmortization period of — Full amount charged totransitional obligation......................................... income as incurred
10. RETIREMENT AND PENSION PLANS

NOTES TO CONSOLIDATED FINANCIAL STATEMENTSAIFUL CORPORATION and Consolidated Subsidiaries
AIFUL CORPORATION Annual Report 2002 44
Japanese companies are subject to the Japanese Commercial Code (the ‘‘Code’’) to which certainamendments became effective from October 1, 2001.
Prior to October 1, 2001, the Code required at least 50% of the issue price of new shares, with aminimum of the par value thereof, to be designated as stated capital as determined by resolution of theBoard of Directors. Proceeds in excess of amounts designated as stated capital were credited to additionalpaid-in capital. Effective October 1, 2001, the Code was revised and common stock par values wereeliminated resulting in all shares being recorded with no par value.
Prior to October 1, 2001, the Code also provided that an amount at least equal to 10% of the aggregateamount of cash dividends and certain other cash payments which are made as an appropriation of retainedearnings applicable to each fiscal period shall be appropriated and set aside as a legal reserve until suchreserve equals 25% of stated capital. Effective October 1, 2001, the revised Code allows for suchappropriations to be set aside as a legal reserve until the total additional paid-in capital and legal reserveequals 25% of stated capital. The excess of total additional paid-in capital and legal reserve over 25% of thestated capital can be available for dividends by resolution of the shareholders. The Company’s legal reserveamount, which is included in retained earnings, totals ¥1,566 million ($11,774 thousand) and ¥1,301million as of March 31, 2002 and 2001, respectively. Under the Code, companies may issue new commonshares to existing shareholders without consideration as a stock split pursuant to a resolution of the Boardof Directors. Prior to October 1, 2001, the amount calculated by dividing the total amount of shareholders’equity by the number of outstanding shares after the stock split could not be less than ¥1,000 for theCompany. The revised Code eliminated this restriction.
Prior to October 1, 2001, the Code imposed certain restrictions on the repurchase and use of treasurystock. Effective October 1, 2001, the Code eliminated these restrictions allowing companies to repurchasetreasury stock by a resolution of the shareholders at the general shareholders’ meeting and dispose of suchtreasury stock by resolution of the Board of Directors after March 31, 2002. The repurchased amount oftreasury stock cannot exceed the amount available for future dividends plus amount of stated capital,additional paid-in capital or legal reserve to be reduced in the case where such reduction was resolved at thegeneral shareholders’ meeting.
The Code permits companies to transfer a portion of additional paid-in capital and legal reserve tostated capital by resolution of the Board of Directors. The Code also permits companies to transfer aportion of unappropriated retained earnings, available for dividends, to stated capital by resolution of theshareholders.
Under the Code, the amount available for dividends is based on retained earning as recorded on theCompany’s books, subject to the approval of the shareholders and legal reserve requirements.
Dividends are approved by the shareholders at a meeting held subsequent to the fiscal year to whichthe dividends are applicable. Semiannual interim dividends may also be paid upon resolution of the Boardof Directors, subject to certain limitations imposed by the Code.
On May 22, 2000, the Company made a three-for-two stock split to shareholders of record on March31, 2000. As a result, the number of shares issued increased by 28,051,500 shares.
On June 1, 2000, the Company acquired all 650,000 shares of the common stock of Sinwa Co., Ltd. inexchange for 721,500 shares of the Company’s common stock, according to an agreement dated April 27,2000. On the exchange of common stock, ¥37 million and ¥4,398 million were credited to common stockand additional paid-in capital, respectively, based on the book value of the acquired net assets. In addition,effective June 1, 2000, the above shares were revalued at market in accordance with the purchase method ofaccounting which resulted in an increase to additional paid-in capital of ¥4,217 million.
At the Shareholders’ General Meeting held on June 27, 2001, the Company’s shareholders approvedthe following stock option plan for the Company’s directors and key employees.
11. SHAREHOLDERS’EQUITY

AIFUL CORPORATION Annual Report 2002 45
The plan provides for granting options to directors and key employees to purchase up to 223 thousandshares of the Company’s common stock. The options were granted to purchase common stock at the higherof 103% of the average fair market price for the month previous to the grant, or the fair market price at thetime of grant. The stock options are exercisable from July 1, 2003 to June 30, 2006. The Company plans toissue acquired treasury stock upon exercise of the stock options. The treasury stock will be purchased fromthe open market for a total consideration not to exceed ¥4,100 million ($30,827 thousand). No optionshave been granted at March 31, 2002.
On August 25, 2001, the Company issued 8,500 thousand shares of its common stock at ¥10,241($77) per share, for gross proceeds of approximately ¥87,048 million ($654,496 thousand). On theissuance of common stock, ¥43,528 million ($327,278 thousand) and ¥43,520 million ($327,218thousand) were credited to common stock and additional paid-in capital, respectively.
The Company and its domestic subsidiaries are subject to Japanese national and local income taxes which,in the aggregate, resulted in a normal effective statutory tax rate of approximately 41.9% for the years endedMarch 31, 2002 and 2001.
The tax effects of significant temporary differences and tax loss carryforwards which resulted in deferredtax assets and liabilities at March 31, 2002 and 2001 are as follows:
Thousands ofMillions of Yen U.S. Dollars
2002 2001 2002
Current deferred tax assets:Tax loss carryforwards ........................................................ — ¥ 229 —Provision for doubtful loans ............................................. ¥ 6,629 8,565 $49,842Enterprise tax payable ........................................................ 940 1,846 7,068Accrued bonuses................................................................. 1,145 937 8,609Charge-offs for doubtful loans .......................................... 1,058 516 7,955Other ................................................................................... 452 826 3,398
Total................................................................................. 10,224 12,919 76,872Less valuation allowance ................................................... (253) (53) (1,902)
Net ................................................................................... 9,971 12,866 74,970
Current deferred tax liabilities:Other ................................................................................... — 1 —
Net deferred tax assets................................................... ¥ 9,971 ¥12,865 $74,970
12. INCOME TAXES
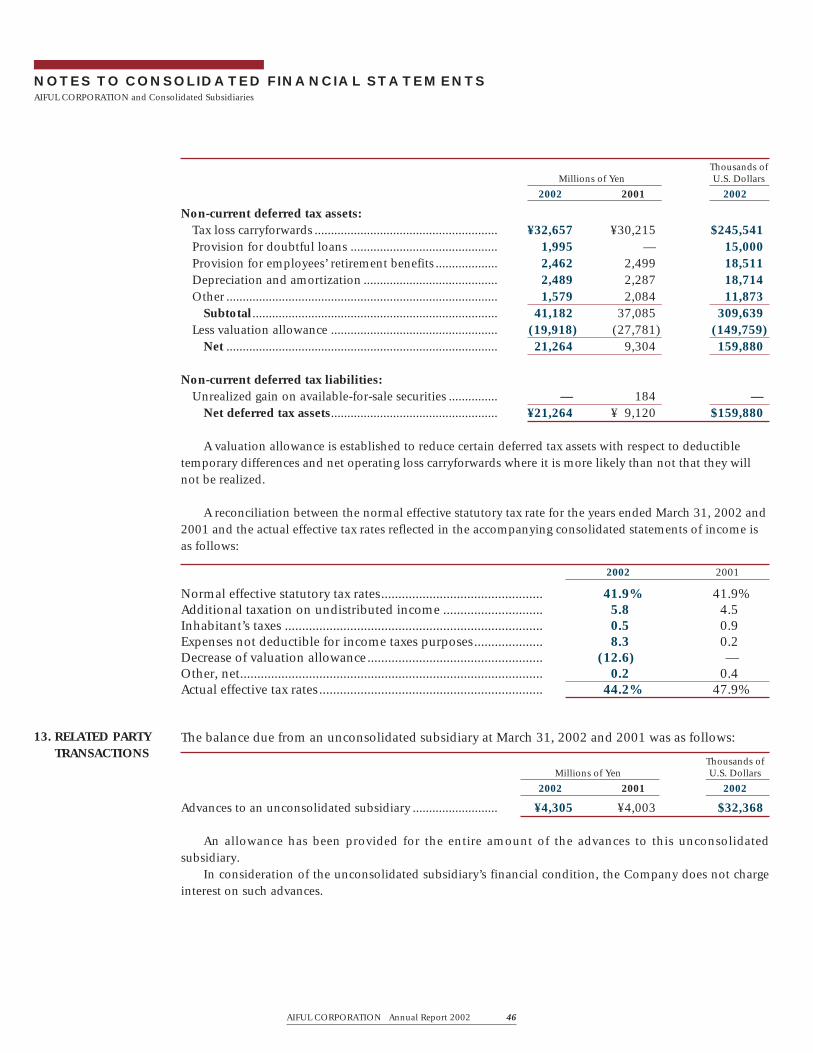
NOTES TO CONSOLIDATED FINANCIAL STATEMENTSAIFUL CORPORATION and Consolidated Subsidiaries
AIFUL CORPORATION Annual Report 2002 46
Thousands ofMillions of Yen U.S. Dollars
2002 2001 2002
Non-current deferred tax assets:Tax loss carryforwards ........................................................ ¥32,657 ¥30,215 $245,541Provision for doubtful loans ............................................. 1,995 — 15,000Provision for employees’ retirement benefits ................... 2,462 2,499 18,511Depreciation and amortization ......................................... 2,489 2,287 18,714Other ................................................................................... 1,579 2,084 11,873
Subtotal........................................................................... 41,182 37,085 309,639Less valuation allowance ................................................... (19,918) (27,781) (149,759)
Net ................................................................................... 21,264 9,304 159,880
Non-current deferred tax liabilities:Unrealized gain on available-for-sale securities ............... — 184 —
Net deferred tax assets................................................... ¥21,264 ¥ 9,120 $159,880
A valuation allowance is established to reduce certain deferred tax assets with respect to deductibletemporary differences and net operating loss carryforwards where it is more likely than not that they willnot be realized.
A reconciliation between the normal effective statutory tax rate for the years ended March 31, 2002 and2001 and the actual effective tax rates reflected in the accompanying consolidated statements of income isas follows:
2002 2001
Normal effective statutory tax rates............................................... 41.9% 41.9%Additional taxation on undistributed income ............................. 5.8 4.5Inhabitant’s taxes ........................................................................... 0.5 0.9Expenses not deductible for income taxes purposes.................... 8.3 0.2Decrease of valuation allowance................................................... (12.6) —Other, net........................................................................................ 0.2 0.4Actual effective tax rates ................................................................. 44.2% 47.9%
The balance due from an unconsolidated subsidiary at March 31, 2002 and 2001 was as follows:
Thousands ofMillions of Yen U.S. Dollars
2002 2001 2002
Advances to an unconsolidated subsidiary .......................... ¥4,305 ¥4,003 $32,368
An allowance has been provided for the entire amount of the advances to this unconsolidatedsubsidiary.
In consideration of the unconsolidated subsidiary’s financial condition, the Company does not chargeinterest on such advances.
13. RELATED PARTYTRANSACTIONS

AIFUL CORPORATION Annual Report 2002 47
14. LEASES The Group leases vehicles, computer equipment, furniture and fixtures, office space and other assets.
Total rental expense including lease payments under finance leases for the years ended March 31, 2002and 2001 were as follows:
Millions of Yen Thousands of U.S. Dollars
Total Lease Payments Total Lease PaymentsRental under Finance Rental under Finance
Expenses Leases Expenses Leases
Year Ended March 31:2002 ..................................... ¥22,961 ¥7,014 $172,639 $52,7372001 ..................................... 15,662 6,322
Pro forma information of leased property such as acquisition cost, accumulated depreciation,obligations under finance leases, depreciation expense, and interest expense of finance leases that do nottransfer ownership of the leased property to the lessee on an “as if capitalized” basis for the years endedMarch 31, 2002 and 2001 were as follows:
Thousands ofMillions of Yen U.S. DollarsMachinery and Machinery and
Equipment Equipment
2002 2001 2002
Acquisition cost...................................................................... ¥33,146 ¥30,213 $249,218Accumulated depreciation..................................................... 21,921 21,481 164,820
Net leased property........................................................ ¥11,225 ¥ 8,732 $ 84,398
Obligations under finance leases:
Thousands ofMillions of Yen U.S. Dollars
2002 2001 2002
Due within one year .............................................................. ¥ 6,086 ¥ 5,251 $ 45,759Due after one year.................................................................. 8,181 6,505 61,512
Total................................................................................. ¥14,267 ¥11,756 $107,271
Depreciation expense and interest expense, which are not reflected in the accompanying consolidatedstatements of income, computed under a declining-balance method and the interest method, respectivelyfor the years ended March 31, 2002 and 2001 were as follows:
Thousands ofMillions of Yen U.S. Dollars
2002 2001 2002
Depreciation expense............................................................. ¥6,704 ¥5,533 $50,406Interest expense...................................................................... 488 414 3,669

NOTES TO CONSOLIDATED FINANCIAL STATEMENTSAIFUL CORPORATION and Consolidated Subsidiaries
AIFUL CORPORATION Annual Report 2002 48
15. DERIVATIVES
The minimum rental commitments under noncancellable operating leases at March 31, 2002 and 2001were as follows:
Thousands ofMillions of Yen U.S. Dollars
2002 2001 2002
Due within one year ..................................................................... ¥15 ¥ 51 $113Due after one year......................................................................... 17 93 128
Total ........................................................................................ ¥32 ¥144 $241
The Group enters into interest rate swap and interest rate cap contracts as a means of managing its interestrate exposures on certain liabilities.
Such derivative transactions are entered into to hedge interest exposures incorporated within itsbusiness. Accordingly, market risk in these derivatives is theoretically offset by opposite movements in thevalue of hedged liabilities. The Group does not hold or issue derivatives for trading and speculativepurposes.
Because the counterparties to these derivatives are limited to major financial institutions, the Groupdoes not anticipate any losses arising from credit risk.
Derivative transactions entered into by the Group have been made in accordance with internal policies,which regulate the authorization and credit limit amount.
The fair value of the Group’s derivative financial instruments at March 31, 2001, other than those towhich hedge accounting is applied, is as follows:
Millions of Yen
2001
Notional UnrealizedAmount Fair Value Loss
Interest rate caps:Purchased interest rate caps .................................................... ¥1,500 ¥2 ¥24
The Group had no derivative instruments outstanding at March 31, 2002.Estimated fair values were obtained from banks.A portion of interest rate caps which either qualify for hedge accounting or meet specific matching
criteria is excluded from the disclosure of market value information.The notional amounts of derivatives which are shown in the above table do not represent the amounts
exchanged by the parties and do not measure the Group’s exposure to credit or market risk.

AIFUL CORPORATION Annual Report 2002 49
16. SUBSEQUENTEVENTS
17. SEGMENTINFORMATION
a. On May 27, 2002, the Board of Directors of the Company resolved to propose the following plan ofappropriation of retained earnings for the year ended March 31, 2002 for approval at the Shareholders’General Meeting held on June 26, 2002:
Thousands ofMillions of Yen U.S. Dollars
Cash dividends, ¥25 ($0.19) per share ........................................ ¥2,329 $17,511Bonuses to directors and corporate auditors................................ 103 774
b. At the Shareholders’ General Meeting held on June 26, 2002, the Company’s shareholders approved thepurchase of treasury stock for retirement and the related reduction of retained earnings. The Company isauthorized to repurchase up to 9 million shares of the Company’s common stock (aggregate amount of¥90,000 million ($676,692 thousand)) in the period from the closing of this Shareholders’ GeneralMeeting to that of the next Shareholders’ General Meeting.
c. On May 27, 2002, the Board of Directors resolved that the number of common shares the Company isauthorized to issue was increased from 224 million shares to 373.5 million shares. This resolution wasapproved at the Shareholders’ General Meeting held on June 26, 2002.
Most of the Group’s business is related to a single segment, lending. The Group does not operate outsideJapan. Accordingly, information about industry and geographic segments was not presented.

INDEPENDENT AUDITORS’ REPORT
AIFUL CORPORATION Annual Report 2002 50
To the Board of Directors and Shareholders ofAIFUL CORPORATION:
We have examined the consolidated balance sheets of AIFUL CORPORATION and consolidatedsubsidiaries as of March 31, 2002 and 2001, and the related consolidated statements of income,shareholders’ equity, and cash flows for the years then ended, all expressed in Japanese yen. Ourexaminations were made in accordance with auditing standards, procedures and practices generallyaccepted and applied in Japan and, accordingly, included such tests of the accounting records and suchother auditing procedures as we considered necessary in the circumstances.
In our opinion, the consolidated financial statements referred to above present fairly the financial positionof AIFUL CORPORATION and consolidated subsidiaries as of March 31, 2002 and 2001, and the results oftheir operations and their cash flows for the years then ended in conformity with accounting principles andpractices generally accepted in Japan applied on a consistent basis.
Our examinations also comprehended the translation of Japanese yen amounts into U.S. dollar amountsand, in our opinion, such translation has been made in conformity with the basis stated in Note 3. SuchU.S. dollar amounts are presented solely for the convenience of readers outside Japan.
June 26, 2002
DELOITTE TOUCHE TOHMATSUKyoto, Japan
SHIMBASHI & CO.Osaka, Japan

AIFUL CORPORATION Annual Report 2002 51
NON-CONSOLIDATED STATEMENTS OF INCOMEAIFUL CORPORATION
Years Ended March 31, 2002 and 2001
Thousands ofU.S. Dollars
Millions of Yen (Note 3)
2002 2001 2002
INCOME:Interest on loans.................................................................................................... ¥296,034 ¥262,581 $2,225,820Interest on deposits, securities and other ............................................................ 3,912 1,237 29,413Sales of property for sale ...................................................................................... 2,824 40 21,233Income from restaurant business and other........................................................ 1,247 1,303 9,376Recovery of loans previously charged off ............................................................ 3,779 3,325 28,414Other income ........................................................................................................ 4,047 4,067 30,428
Total income ..................................................................................................... 311,843 272,553 2,344,684
EXPENSES:Interest on borrowings ......................................................................................... 30,829 26,767 231,797Cost of sales of property for sale .......................................................................... 2,678 57 20,135Charge-offs and provision for doubtful loans, advances to subsidiary and claims in bankruptcy ................................................................................... 67,931 54,772 510,759
Salaries and other employees’ benefits ................................................................ 23,114 24,065 173,790Advertising expenses ............................................................................................. 19,274 17,043 144,917Rental expenses ..................................................................................................... 15,004 15,001 112,812Commissions and fees.......................................................................................... 9,723 10,463 73,105Supplies ................................................................................................................. 1,295 1,166 9,737Loss on write-down of investment securities ...................................................... 549 1,531 4,128Loss on write-down of inventories....................................................................... 2,195 103 16,504Depreciation and amortization............................................................................ 4,515 4,205 33,947Provision for accrued pension and severance costs ............................................ 369 1,982 2,774Charge for full amount of transitional obligations for retirement benefits ...... — 992 —Provision for retirement benefits to directors and corporate auditors .............. 111 67 835Stock issue costs .................................................................................................... 4,235 — 31,842Loss on sales of property, net ............................................................................... 31,185 1,552 234,474Other expenses ...................................................................................................... 26,182 20,312 196,857
Total expenses................................................................................................... 239,189 180,078 1,798,413
INCOME BEFORE INCOME TAXES....................................................................... 72,654 92,475 546,271
INCOME TAXES (Note 8):Current................................................................................................................... 35,001 45,011 263,166Deferred ................................................................................................................. (696) (1,048) (5,233)
Total income taxes............................................................................................ 34,305 43,963 257,933
NET INCOME ........................................................................................................... ¥ 38,349 ¥ 48,512 $ 288,338
U.S. Dollars Yen (Note 3)
AMOUNTS PER COMMON SHARE (Note 2 s.):
Net income............................................................................................................ ¥426.54 ¥572.38 $3.21Cash dividends applicable to the year ................................................................. 50.00 50.00 0.38
See Notes to Non-Consolidated Financial Statements.

NON-CONSOLIDATED BALANCE SHEETSAIFUL CORPORATION
March 31, 2002 and 2001
AIFUL CORPORATION Annual Report 2002 52
Thousands ofU.S. Dollars
Millions of Yen (Note 3)
2002 2001 2002
ASSETSCURRENT ASSETS:
Cash and cash equivalents ................................................................................... ¥ 93,255 ¥ 95,391 $ 701,165Time deposits ........................................................................................................ 138 378 1,038Loans (Notes 4 and 7) .......................................................................................... 1,313,690 1,159,734 9,877,369Allowance for doubtful loans............................................................................... (58,689) (45,115) (441,271)
Net loans ........................................................................................................... 1,255,001 1,114,619 9,436,098Inventories (Notes 5 and 7) ................................................................................. 680 2,454 5,113Prepaid expenses ................................................................................................... 3,495 4,172 26,278Deferred tax assets (Note 8) ................................................................................. 7,589 9,240 57,060Advances to associated company ......................................................................... — 200 —Other current assets (Note 7) ............................................................................... 31,860 12,763 239,549
Total current assets .......................................................................................... 1,392,018 1,239,217 10,466,301
PROPERTY, PLANT AND EQUIPMENT:Land ....................................................................................................................... 5,284 41,212 39,729Buildings and structures ....................................................................................... 23,084 35,146 173,564Machinery, vehicles and equipment .................................................................... 10,007 10,576 75,241Construction in progress ...................................................................................... — 25 —
Subtotal ............................................................................................................. 38,375 86,959 288,534Accumulated depreciation ................................................................................... (15,068) (19,569) (113,293)
Net property, plant and equipment ............................................................... 23,307 67,390 175,241
INVESTMENTS AND OTHER ASSETS:Investment securities (Notes 6 and 7) ................................................................. 6,539 4,888 49,165Investments in and advances to subsidiaries and associated companies .......... 266,814 227,805 2,006,120Claims in bankruptcy (Note 4) ............................................................................ 14,267 11,845 107,271Allowance for advances to subsidiary and claims in bankruptcy ...................... (17,220) (15,829) (129,474)Software, net.......................................................................................................... 2,354 2,365 17,699Long-term loans (less current portion) ............................................................... 8,671 8,706 65,195Lease deposits........................................................................................................ 8,652 8,549 65,053Long-term prepayments........................................................................................ 1,566 2,172 11,774Deferred tax assets (Note 8) ................................................................................. 4,348 1,645 32,692Deferred losses on hedging instruments, mainly interest rate swaps (Note 2 r.) .. 22,931 20,091 172,414Other assets ........................................................................................................... 6,621 7,566 49,782
Total investments and other assets ................................................................ 325,543 279,803 2,447,691
TOTAL ...................................................................................................................... ¥1,740,868 ¥1,586,410 $13,089,233
See Notes to Non-Consolidated Financial Statements.

AIFUL CORPORATION Annual Report 2002 53
Thousands ofU.S. Dollars
Millions of Yen (Note 3)
2002 2001 2002
LIABILITIES AND SHAREHOLDERS’ EQUITYCURRENT LIABILITIES:
Short-term borrowings (Note 7).......................................................................... ¥ 29,000 ¥ 32,500 $ 218,045Current portion of long-term debt (Note 7) ....................................................... 430,785 348,257 3,238,984Trade notes payable .............................................................................................. 3,572 3,774 26,857Trade accounts payable......................................................................................... 5,408 5,449 40,662Income taxes payable............................................................................................ 15,912 25,530 119,639Accrued expenses................................................................................................... 6,449 5,040 48,489Other current liabilities ........................................................................................ 1,244 1,345 9,354
Total current liabilities .................................................................................... 492,370 421,895 3,702,030
LONG-TERM LIABILITIES:Long-term debt (less current portion) (Note 7).................................................. 803,194 838,417 6,039,053Liability for retirement benefits (Note 2 g.) ........................................................ 2,395 3,061 18,007Interest rate swaps (Note 2 r.) .............................................................................. 22,305 20,091 167,707Other long-term liabilities.................................................................................... 111 345 834
Total long-term liabilities................................................................................ 828,005 861,914 6,225,601
CONTINGENT LIABILITIES (Note 11)
SHAREHOLDERS’ EQUITY (Notes 9 and 12):Common stock,authorized, 224,000,000 shares;issued, 93,376,000 shares at March 31, 2002and 84,876,000 shares at March 31, 2001 ........................................................ 83,317 39,789 626,444
Additional paid-in capital .................................................................................... 89,831 46,311 675,421Legal reserve .......................................................................................................... 1,566 1,301 11,774Retained earnings.................................................................................................. 248,086 214,969 1,865,308Net unrealized gain (loss) on available-for-sale securities ................................. (261) 231 (1,962)Treasury stock, at cost—220,585 shares in 2002 ................................................ (2,046) — (15,383)
Total shareholders’ equity ............................................................................... 420,493 302,601 3,161,602
TOTAL ....................................................................................................................... ¥1,740,868 ¥1,586,410 $13,089,233

NON-CONSOLIDATED STATEMENTS OF SHAREHOLDERS' EQUITYAIFUL CORPORATION
Years Ended March 31, 2002 and 2001
AIFUL CORPORATION Annual Report 2002 54
Thousands Millions of Yen
Net UnrealizedNumber of Additional Gain (Loss) on Treasury
Shares of Common Common Paid-in Legal Retained Available-for-sale Stock,Stock Issued Stock Capital Reserve Earnings Securities at Cost
BALANCE AT APRIL 1, 2000................................ 56,103 ¥39,752 ¥41,913 ¥ 952 ¥170,286 NilNet income ....................................................... 48,512Cash dividends paid, ¥50 per share................. (3,381)Transfer to legal reserve ................................... 349 (349)Bonuses to directors and corporate auditors ... (99)Stock split (Note 9)........................................... 28,052Acquisition of Sinwa Co., Ltd. (Note 9) .......... 721 37 4,398Net unrealized gain on available-for-sale securities ............................. ¥ 231
BALANCE AT MARCH 31, 2001 .......................... 84,876 39,789 46,311 1,301 214,969 231 NilNet income ....................................................... 38,349Cash dividends paid, ¥50 per share................. (4,880)Transfer to legal reserve ................................... 265 (265)Bonuses to directors and corporate auditors ... (87)Net increase in treasury stock (220,585 shares) (Note 9).............................. ¥(2,046)
Public offering (Note 9) ................................... 8,500 43,528 43,520Net unrealized loss on available-for-sale securities ............................. (492)
BALANCE AT MARCH 31, 2002 .......................... 93,376 ¥83,317 ¥89,831 ¥1,566 ¥248,086 ¥(261) ¥(2,046)
Thousands of U.S. Dollars (Note 3)
Net UnrealizedAdditional Gain (Loss) on Treasury
Common Paid-in Legal Retained Available-for-sale Stock,Stock Capital Reserve Earnings Securities at Cost
BALANCE AT MARCH 31, 2001 .......................... $299,166 $348,203 $ 9,782 $1,616,308 $1,737 Nil
Net income ....................................................... 288,338
Cash dividends paid, $0.38 per share.............. (36,692)
Transfer to legal reserve ................................... 1,992 (1,992)
Bonuses to directors and corporate auditors ... (654)
Net increase in treasury stock
(220,585 shares) (Note 9).............................. $(15,383)
Public offering (Note 9) ................................... 327,278 327,218
Net unrealized loss on
available-for-sale securities ............................. (3,699)
BALANCE AT MARCH 31, 2002 .......................... $626,444 $675,421 $11,774 $1,865,308 $(1,962) $(15,383)
See Notes to Non-Consolidated Financial Statements.

AIFUL CORPORATION Annual Report 2002 55
NOTES TO NON-CONSOLIDATED FINANCIAL STATEMENTSAIFUL CORPORATION
Years Ended March 31, 2002 and 2001
1. BASIS OFPRESENTING NON-CONSOLIDATEDFINANCIALSTATEMENTS
2. SUMMARY OFSIGNIFICANTACCOUNTINGPOLICIES
The accompanying non-consolidated financial statements of AIFUL CORPORATION (the “Company”)have been prepared from the Company’s non-consolidated financial statements issued for domesticreporting purposes in accordance with the provisions set forth in the Japanese Securities and Exchange Law.The Company maintains its accounts and records in accordance with the provisions set forth in theCommercial Code of Japan (the “Code”) and in conformity with accounting principles and practicesgenerally accepted in Japan, which are different in certain respects as to application and disclosurerequirements of International Accounting Standards. The non-consolidated financial statements are notintended to present the financial position and results of operations in accordance with accountingprinciples and practices generally accepted in countries and jurisdictions other than Japan.
As consolidated statements of cash flows and certain disclosures are presented in the consolidatedfinancial statements of the Company, non-consolidated statements of cash flows and certain disclosures arenot presented herein in accordance with accounting procedures generally accepted in Japan.
In preparing these non-consolidated financial statements, certain reclassifications and rearrangementshave been made to the Company’s non-consolidated financial statements issued domestically in order topresent them in a form which is more familiar to readers outside Japan.
Certain reclassifications have been made to the prior year’s non-consolidated financial statements toconform to the classifications used for the year ended March 31, 2002.
a. Non-Consolidation – The non-consolidated financial statements do not include the accounts of sub-sidiaries. Investments in subsidiaries and associated companies are stated at cost.
b. Cash Equivalents – Cash equivalents are short-term investments that are readily convertible into cash andthat are exposed to insignificant risk of changes in value.
Cash equivalents include time deposits and certificates of deposit which mature or become due withinthree months of the date of acquisition.
c. Inventories – Inventories include property for sale, property for sale under construction and supplies.Property for sale is stated at the lower of cost or market, cost being determined by the specific identifica-tion method. Depreciation of property for sale currently rented is computed by the same method, asapplied to property, plant and equipment. Property for sale under construction is stated at cost, cost beingdetermined by the specific identification method. Supplies are stated at the most recent purchase price,which approximates cost determined by the first-in, first-out method.
d. Investment Securities – Held-to-maturity debt securities are reported at amortized cost and available-for-sale securities are reported at fair value, with unrealized gains and losses, net of applicable taxes,reported in a separate component of shareholders’ equity. The cost of securities sold is determined basedon the moving-average method. Non-marketable available-for-sale securities are stated at cost determinedby the moving-average method. For other than temporary declines in fair value, investment securities arereduced to net realizable value by a charge to income.
e. Property, Plant and Equipment – Property, plant and equipment are stated at cost. Depreciation iscomputed by the declining-balance method. The range of useful lives is from 7 to 50 years (3 to 50years in 2001) for buildings and structures and from 2 to 20 years for machinery, vehicles and equipment.
f. Software – Expenditures for the purchase of software, which meet certain future-tests, are capitalized assoftware and amortized by the straight-line method over the estimated useful lives of five years.
g. Liability for Retirement Benefits - The Company has contributory and non-contributory funded pensionplans covering substantially all employees. Under the pension plans, employees terminating their employ-ment are, in most circumstances, entitled to pension payments based on their average pay during theiremployment, length of service and certain other factors. If the termination is involuntary, employees areusually entitled to larger payments than in the case of voluntary termination.
The Company accounted for the net liability for retirement benefits based on projected benefit oblig-ation and plan assets at the balance sheet date.

NOTES TO NON-CONSOLIDATED FINANCIAL STATEMENTSAIFUL CORPORATION
AIFUL CORPORATION Annual Report 2002 56
Liability for retirement benefits to directors and corporate auditors are provided at the amount whichwould be required if they retired at each balance sheet date.
The balances of retirement benefits include those to directors and corporate auditors in the amountof ¥1,056 million ($7,940 thousand) and ¥945 million for the years ended March 31, 2002 and 2001,respectively.
h. Allowances for Doubtful Loans – The allowance for doubtful accounts is stated in amounts consideredto be appropriate based on the Company’s past credit loss experience and an evaluation of potential lossesin the receivables outstanding.
i. Leases – All leases are accounted for as operating leases. Under Japanese accounting standards for leases,finance leases that deem to transfer ownership of the leased property to the lessee are to be capitalized,while other finance leases are permitted to be accounted for as operating lease transactions if certain “as ifcapitalized” information is disclosed in the notes to the lessee’s non-consolidated financial statements.
j. Income Taxes – The provision for income taxes is computed based on the pretax income included in thenon-consolidated statements of income. The asset and liability approach is used to recognize deferredtax assets and liabilities for the expected future tax consequences of temporary differences between the car-rying amounts and the tax bases of assets and liabilities. Deferred taxes are measured by applying currentlyenacted tax laws to the temporary differences.
k. Related Party Transactions – Related party transactions other than those with subsidiaries and associatedcompanies are not presented herein, as they are disclosed in the consolidated financial statements of theCompany.
l. Appropriations of Retained Earnings – Appropriations of retained earnings are reflected in the non-consolidated financial statements for the following year upon shareholders’ approval.
m. Foreign Currency Transactions – All short-term and long-term monetary receivables and payablesdenominated in foreign currencies are translated into Japanese yen at the exchange rates at the balancesheet date. The foreign exchange gains and losses from translation are recognized in the non-consolidatedstatements of income.
n. Interest on Loans – Interest on loans is recorded on an accrual basis. In accordance with the practiceprevailing in the industry, the Company records accrued interest to the extent that the realization of suchincome is considered to be certain.
o. Interest on Borrowings – Interest on financial liabilities is accounted for as operating expenses whileother interest is included in other expenses.
p. Stock Issue Costs – Stock issue costs are charged to income as incurred. q. Bonds Issue Costs – Bonds issue costs, which are included in other assets, are amortized ratably over
periods up to three years.r. Derivatives and Hedging Activities – The Company uses derivative financial instruments to manage its
exposures to fluctuations in interest rates. Interest rate swaps and caps are utilized by the Company toreduce interest rate risks. The Company does not enter into derivatives for trading or speculative purposes.The accounting standard for derivative financial instruments requires that: a) all derivatives are recognizedas either assets or liabilities and measured at fair value, and gains or losses on derivative transactions arerecognized in the non-consolidated statements of income, and b) for derivatives used for hedging pur-poses, if derivatives qualify for hedge accounting because of high correlation and effectiveness between thehedging instruments and the hedged items, gains or losses on derivatives are deferred until maturity of thehedged transactions.
The interest rate swaps and caps which qualify for hedge accounting and meet specific matching cri-teria are not remeasured at market value but the differential paid or received under the swap or capagreements is recognized and included in interest expense or income.

AIFUL CORPORATION Annual Report 2002 57
s. Per Share Information – The computation of net income per share is based on the weighted averagenumber of shares of common stock outstanding during each year, retroactively adjusted for stock splits.The weighted average number of common shares used in the computation for the years ended March 31,2002 and 2001 was as follows:
Diluted net income per share is not presented because no dilutive securities were outstanding for theyears ended March 31, 2002 and 2001.
Cash dividends per share presented in the accompanying non-consolidated statements of income aredividends applicable to the respective years including dividends to be paid after the end of the year with-out giving retroactive adjustment for any subsequent stock split.
The non-consolidated financial statements are stated in Japanese yen, the currency of the country in which theCompany is incorporated and operates. The translation of Japanese yen amounts into U.S. dollar amounts areincluded solely for the convenience of readers outside Japan and have been made at the rate of ¥133=$1,the approximate rate of exchange at March 29, 2002. Such translations should not be construed as represen-tations that the Japanese yen amounts could be converted into U.S. dollars at that or any other rate.
Loans at March 31, 2002 and 2001 consisted of the following (before allowance for doubtful loans):
Thousands ofMillions of Yen U.S. Dollars
2002 2001 2002
Unsecured ......................................................................... ¥1,019,293 ¥ 921,891 $7,663,857Secured............................................................................... 277,671 225,645 2,087,752Small business loans ......................................................... 16,726 12,198 125,760
Total ............................................................................ ¥1,313,690 ¥1,159,734 $9,877,369
Registered moneylenders are required to disclose the following information under the Non-BankBond Law.
Thousands ofMillions of Yen U.S. Dollars
2002 2001 2002
Loans in legal bankruptcy ..................................................... ¥16,457 ¥13,058 $123,737Nonaccrual loans ................................................................... 23,334 20,137 175,444Accruing loans contractually past due three months or more as to principal or interest payments ..................... 8,931 6,874 67,150
Restructured loans ................................................................. 29,305 23,814 220,338Total................................................................................. ¥78,027 ¥63,883 $586,669
Average Number of Shares2002 89,908,0622001 84,755,420
3. TRANSLATION INTO U.S. DOLLARS
4. LOANS

NOTES TO NON-CONSOLIDATED FINANCIAL STATEMENTSAIFUL CORPORATION
AIFUL CORPORATION Annual Report 2002 58
Loans in legal bankruptcy are loans in which accruals of interest are discontinued (excluding theportion recognized as bad debts), based on management’s judgment as to the collectibility of principal orinterest resulting from the past due payment of interest or principal and other factors. Allowances forclaims in bankruptcy are stated at such amount less net realizable value of collateral.
Nonaccrual loans are loans in which accruals of interest are discontinued and those other than loans inlegal bankruptcy and loans granting deferral of interest payment to the debtors in financial difficulties to assistthem in their recovery where such deferred payments are regularly received. Accruing loans contractually pastdue three months or more as to principal or interest payments are loans for which payments of principal orinterest have not been received for a period of three months or more beginning with the next business dayfollowing the last due date for such payments. Loans classified as loans in legal bankruptcy and nonaccrualloans are excluded from accruing loans contractually past due three months or more.
Restructured loans are loans on which creditors grant concessions (e.g., reduction of the stated interestrate, deferral of interest payment, extension of maturity date, waiver of the face amount, or other concessivemeasures) to the debtors in financial difficulties to assist them in their recovery and eventually enable themto pay creditors. Loans classified as loans in legal bankruptcy, nonaccrual loans and accruing loanscontractually past due three months or more are excluded.
At March 31, 2002, the Company had a balance related to revolving loan contracts of ¥1,023,875million ($7,698,308 thousand) whereby a commitment was set up for each loan customer, and theCompany was obligated to advance funds up to a predetermined amount upon request. At March 31, 2002,the balance of unadvanced commitments was ¥444,662 million ($3,343,323 thousand). The loan contractcontains provisions that allow the Company to reduce the contract amount of the commitment or refuse toadvance funds to loan customers under certain conditions.
Inventories at March 31, 2002 and 2001 consisted of the following:
Thousands ofMillions of Yen U.S. Dollars
2002 2001 2002
Property for sale ..................................................................... ¥668 ¥ 819 $5,023Property for sale under construction .................................... — 1,622 —Supplies .................................................................................. 12 13 90
Total................................................................................. ¥680 ¥2,454 $5,113
Disclosure of cost and fair value of marketable securities at March 31, 2002 and 2001 is not presentedherein, as such information is not required in non-consolidated financial statements.
Short-term borrowings at March 31, 2002 and 2001 consisted of the following:
Thousands ofMillions of Yen U.S. Dollars
2002 2001 2002
Commercial paper, 0.7880%(0.828% to 0.912% at March 31, 2001) ............................ ¥15,000 ¥15,000 $112,782
Loans from banks, 0.8363% to 1.1100%(1.12% to 2.375% at March 31, 2001) .............................. 12,000 15,000 90,225
Loans from other financial institutions, 1.475%(1.6% to 2.45% at March 31, 2001)................................... 2,000 2,500 15,038
Total................................................................................. ¥29,000 ¥32,500 $218,045
5. INVENTORIES
6. INVESTMENTSECURITIES
7. SHORT-TERMBORROWINGS ANDLONG-TERM DEBT

AIFUL CORPORATION Annual Report 2002 59
Long-term debt at March 31, 2002 and 2001 consisted of the following:
Thousands ofMillions of Yen U.S. Dollars
2002 2001 2002
Loans from banks, 1.0846% to 4.200%, due serially to 2007 (1.001% to 4.2%, due serially to 2006 at March 31, 2001) .... ¥ 420,031 ¥ 398,990 $ 3,158,128
Loans from other financial institutions, 1.750% to 4.200%, due serially to 2007 (1.9% to 4.7%, due serially to 2006 at March 31, 2001 ........... 219,047 245,434 1,646,970
Syndicated loans, 2.5%, due 2004 (1.7% to 2.6%, due 2004 at March 31, 2001).......................... 46,666 70,000 350,872
Unsecured 2.6% yen straight bonds, due 2001 .......................... — 6,000 —Unsecured 2.425% yen straight bonds, due 2002 (2.35% to 2.425%, due 2002 at March 31, 2001) ................... 10,000 40,000 75,188
Unsecured 1.5% to 3.2% yen straight bonds, due 2003 ............ 75,000 75,000 563,910Unsecured 2.0% to 2.53% yen straight bonds, due 2004.......... 135,000 135,000 1,015,037Unsecured 1.75% to 1.86% yen straight bonds, due 2005 (1.86%, due 2005 at March 31, 2001)...................................... 30,000 10,000 225,564
Unsecured 1.7% to 3.27% yen straight bonds, due 2006 (3.27% at March 31, 2001)........................................................ 60,000 15,000 451,128
Unsecured 2.51% yen straight bonds, due 2007 ........................ 20,000 20,000 150,376Unsecured 2.48% yen straight bonds, due 2008 ........................ 15,000 — 112,782Unsecured 3.28% yen straight bonds, due 2009 ........................ 8,000 8,000 60,150Unsecured 2.93% to 3.0% yen straight bonds, due 2010.......... 20,000 20,000 150,376Unsecured 3.65% Euro-yen straight bonds, due 2003............... 9,500 9,500 71,429Unsecured variable rate Euro-yen straight bonds, due 2006 (1.825% at March 31, 2002 and 2.136% at March 31, 2001) ... 15,000 15,000 112,782
Unsecured 1.73% medium-term notes, due 2002...................... 3,000 3,000 22,556Unsecured variable rate Euro-yen medium-term notes, due 2002 (1.75% at March 31, 2002 and 2001)...................... 3,000 3,000 22,556
Unsecured 2.21% medium-term notes, due 2007...................... 1,000 — 7,519Unsecured 3.0% medium-term notes, due 2008........................ 3,000 3,000 22,556Unsecured 3.5% medium-term notes, due 2015........................ 15,000 15,000 112,782Other (principally from leasing and factoring companies), 2.0% to 4.3%, due serially to 2008 (0.98% to 4.5%, due serially to 2006 at March 31, 2001) ................................... 125,735 94,750 945,376
Subtotal.................................................................................. 1,233,979 1,186,674 9,278,037Less current portion...................................................................... (430,785) (348,257) (3,238,984)
Long-term debt, less current portion ................................. ¥ 803,194 ¥ 838,417 $ 6,039,053
The Company has an interest rate swap agreement that effectively converts variable rate interest payableon ¥3,000 million ($22,556 thousand) of medium-term notes, due 2002, to a fixed rate of 1.75%.

NOTES TO NON-CONSOLIDATED FINANCIAL STATEMENTSAIFUL CORPORATION
AIFUL CORPORATION Annual Report 2002 60
The aggregate annual maturities of long-term debt at March 31, 2002 were as follows:
Year ending March 31 Thousands ofMillions of Yen U.S. Dollars
2003 ..................................................................................................... ¥ 430,785 $3,238,9842004 ..................................................................................................... 321,700 2,418,7972005 ..................................................................................................... 205,304 1,543,6392006 ..................................................................................................... 67,657 508,6992007 ..................................................................................................... 75,333 566,4142008 and thereafter ............................................................................. 133,200 1,001,504
Total ............................................................................................ ¥1,233,979 $9,278,037
At March 31, 2002, the following assets were pledged as collateral for short-term borrowings and long-termdebt (including current portion of long-term debt):
Thousands ofMillions of Yen U.S. Dollars
Loans .................................................................................................... ¥559,240 $4,204,813Investment securities ........................................................................... 153 1,150Property for sale................................................................................... 153 1,150
Total................................................................................................. ¥559,546 $4,207,113Related liabilities:
Long-term debt (including current portion of long-term debt)... ¥467,766 $3,517,038
In addition, if requested by lending financial institutions, the Company has committed to pledge collat-eral for loans other than those shown in the above table.
At March 31, 2002, related liabilities for which lending financial institutions can request the Company topledge collateral consisted of the following:
Thousands ofMillions of Yen U.S. Dollars
Short-term borrowings ........................................................................ ¥ 2,000 $ 15,038Long-term debt (including current portion of long-term debt) ....... 125,186 941,248
Total ............................................................................................ ¥127,186 $956,286
At March 31, 2002, other current assets, which were pledged as collateral for interest rate swap contracts,amounted to ¥6,764 million ($50,857 thousand).

AIFUL CORPORATION Annual Report 2002 61
8. INCOME TAXES The Company is subject to Japanese national and local income taxes which, in the aggregate, resulted in anormal effective statutory tax rate of approximately 41.9% for the years ended March 31, 2002 and 2001.
The tax effects of significant temporary differences which resulted in deferred tax assets and liabilities atMarch 31, 2002 and 2001 are as follows:
Thousands ofMillions of Yen U.S. Dollars
2002 2001 2002
Current deferred tax assets:Charge-offs for doubtful loans .......................................... ¥ 862 ¥ 516 $ 6,481Provision for doubtful loans ............................................. 4,896 6,164 36,812Unrecorded accrued interest on loans............................... — 122 —Accrued bonuses................................................................. 716 501 5,383Enterprise tax payable ........................................................ 888 1,839 6,677Other ................................................................................... 227 98 1,707
Current deferred tax assets ........................................... ¥7,589 ¥9,240 $57,060
Non-current deferred tax assets:Depreciation and amortization ......................................... ¥ 816 ¥ 402 ¥ 6,135Provision for doubtful loans ............................................. 1,995 — 15,000Provision for employees’ retirement benefits ................... 544 851 4,090Provision for retirement benefits to directors and corporate auditors ..................................................... 443 396 3,331
Unrealized loss on available-for-sale securities ................ 188 — 1,414Other ................................................................................... 362 163 2,722
Total................................................................................. 4,348 1,812 32,692
Non-current deferred tax liabilities:Unrealized gain on available-for-sale securities ............... — 167 —
Net deferred tax assets................................................... ¥4,348 ¥1,645 $32,692
A reconciliation between the normal effective statutory tax rate for the years ended March 31, 2002 and2001 and the actual effective tax rates reflected in the accompanying non-consolidated statements ofincome is as follows:
2002 2001
Normal effective statutory tax rates....................................................... 41.9% 41.9%Increase in tax rate resulting from:
Additional taxation on undistributed income................................. 4.7 4.4Other, net........................................................................................... 0.6 1.2
Actual effective tax rates.............................................................. 47.2% 47.5%

NOTES TO NON-CONSOLIDATED FINANCIAL STATEMENTSAIFUL CORPORATION
AIFUL CORPORATION Annual Report 2002 62
9. SHAREHOLDERS’EQUITY
Japanese companies are subject to the Japanese Commercial Code (the ‘‘Code’’) to which certain amendmentsbecame effective from October 1, 2001.
Prior to October 1, 2001, the Code required at least 50% of the issue price of new shares, with a mini-mum of the par value thereof, to be designated as stated capital as determined by resolution of the Board ofDirectors. Proceeds in excess of amounts designated as stated capital were credited to additional paid-incapital. Effective October 1, 2001, the Code was revised and common stock par values were eliminated result-ing in all shares being recorded with no par value.
Prior to October 1, 2001, the Code also provided that an amount at least equal to 10% of the aggregateamount of cash dividends and certain other cash payments which are made as an appropriation of retainedearnings applicable to each fiscal period shall be appropriated and set aside as a legal reserve until such reserveequals 25% of stated capital. Effective October 1, 2001, the revised Code allows for such appropriations tobe set aside as a legal reserve until the total additional paid-in capital and legal reserve equals 25% of statedcapital. The excess of total additional paid-in capital and legal reserve over 25% of the stated capital can beavailable for dividends by resolution of the shareholders. Under the Code, companies may issue new com-mon shares to existing shareholders without consideration as a stock split pursuant to a resolution of theBoard of Directors. Prior to October 1, 2001, the amount calculated by dividing the total amount of share-holders’ equity by the number of outstanding shares after the stock split could not be less than ¥1,000. Therevised Code eliminated this restriction.
Prior to October 1, 2001, the Code imposed certain restrictions on the repurchase and use of treasurystock. Effective October 1, 2001, the Code eliminated these restrictions allowing companies to repurchasetreasury stock by a resolution of the shareholders at the general shareholders’ meeting and dispose of suchtreasury stock by resolution of the Board of Directors after March 31, 2002. The repurchased amount of trea-sury stock cannot exceed the amount available for future dividend plus amount of stated capital, additionalpaid-in capital or legal reserve to be reduced in the case where such reduction was resolved at the generalshareholders’ meeting.
The Code permits companies to transfer a portion of additional paid-in capital and legal reserve to statedcapital by resolution of the Board of Directors. The Code also permits companies to transfer a portion of unap-propriated retained earnings, available for dividends, to stated capital by resolution of the shareholders.
Under the Code, the amount available for dividends is based on retained earning as recorded on theCompany’s books, subject to the approval of the shareholders and legal reserve requirements.
Dividends are approved by the shareholders at a meeting held subsequent to the fiscal year to which thedividends are applicable. Semiannual interim dividends may also be paid upon resolution of the Board ofDirectors, subject to certain limitations imposed by the Code.
On May 22, 2000, the Company made a three-for-two stock split to shareholders of record on March31, 2000. As a result, the number of shares issued increased by 28,051,500 shares.
On June 1, 2000, the Company acquired all 650,000 shares of the common stock of Sinwa Co., Ltd. inexchange for 721,500 shares of the Company’s common stock, according to an agreement dated April 27,2000. On the exchange of common stock, ¥37 million and ¥4,398 million were credited to common stockand additional paid-in capital, respectively, based on the book value of the acquired net assets. In addition,effective June 1, 2000, the above shares were revalued at market in accordance with the purchase method ofaccounting which resulted in an increase to additional paid-in capital of ¥4,217 million.
At the Shareholders’ General Meeting held on June 27, 2001, the Company’s shareholders approved thefollowing stock option plan for the Company’s directors and key employees.
The plan provides for granting options to directors and key employees to purchase up to 223 thousandshares of the Company’s common stock. The options were granted to purchase common stock at the higherof 103% of the average fair market price for the month previous to the grant, or the fair market price at thetime of grant. The stock options are exercisable from July 1, 2003 to June 30, 2006. The Company plans toissue acquired treasury stock upon exercise of the stock options. The treasury stock will be purchased fromthe open market for a total consideration not to exceed ¥4,100 million ($30,827 thousand). No options havebeen granted at March 31, 2002.

AIFUL CORPORATION Annual Report 2002 63
On August 25, 2001, the Company issued 8,500 thousand shares of its common stock at ¥10,241 ($77)per share, for gross proceeds of approximately ¥87,048 million ($654,496 thousand). On the issuance ofcommon stock, ¥43,528 million ($327,278 thousand) and ¥43,520 million ($327,218 thousand) were cred-ited to common stock and additional paid-in capital, respectively.
The Company leases vehicles, computer equipment, furniture and fixtures, office space and other assets.
Total rental expenses including lease payments under finance leases for the years ended March 31, 2002and 2001 were as follows:
Millions of Yen Thousands of U.S. Dollars
Total Lease Payments Total Lease PaymentsRental under Finance Rental under Finance
Expenses Leases Expenses Leases
Year Ended March 31:2002 ...................................... ¥15,004 ¥5,738 $112,812 $43,1432001 ...................................... 15,001 6,117
Pro forma information of leased property such as acquisition cost, accumulated depreciation,obligation under finance leases, depreciation expense, and interest expense of finance leases that do nottransfer ownership of the leased property to the lessee on an “as if capitalized” basis for the years endedMarch 31, 2002 and 2001 were as follows:
Thousands ofMillions of Yen U.S. Dollars
Machinery, Vehicles Machinery, Vehiclesand Equipment and Equipment
2002 2001 2002
Acquisition cost...................................................................... ¥26,570 ¥25,727 $199,774Accumulated depreciation..................................................... 18,586 18,933 139,744
Net leased property........................................................ ¥ 7,984 ¥ 6,794 $ 60,030
Obligations under finance leases:
Thousands ofMillions of Yen U.S. Dollars
2002 2001 2002
Due within one year .............................................................. ¥ 4,811 ¥4,390 $36,173Due after one year.................................................................. 5,792 5,139 43,549
Total................................................................................. ¥10,603 ¥9,529 $79,722
Depreciation expense and interest expense, which are not reflected in the accompanying non-consolidated statements of income, computed under a declining-balance method and the interest method,respectively, for the years ended March 31, 2002 and 2001 were as follows:
Thousands ofMillions of Yen U.S. Dollars
2002 2001 2002
Depreciation expense............................................................. ¥5,474 ¥5,360 $41,158Interest expense...................................................................... 339 388 2,549
10. LEASES

NOTES TO NON-CONSOLIDATED FINANCIAL STATEMENTSAIFUL CORPORATION
AIFUL CORPORATION Annual Report 2002 64
At March 31, 2002, contingent liabilities were ¥12,246 million ($92,075 thousand) of guarantees and simi-lar items of bank loans.
a. On May 27, 2002, the Board of Directors resolved to propose the following plan of appropriations ofretained earnings for the year ended March 31, 2002 for approval at the Shareholders’ General Meetingheld on June 26, 2002:
Thousands ofMillions of Yen U.S. Dollars
Cash dividends, ¥25 ($0.19) per share ........................................ ¥2,329 $17,511Bonuses to directors and corporate auditors................................ 103 774
b. At the Shareholders’ General Meeting held on June 26, 2002, the Company’s shareholders approved thepurchase of treasury stock for retirement and the related reduction of retained earnings. The Company isauthorized to repurchase up to 9 million shares of the Company’s common stock (aggregate amount of¥90,000 million ($676,692 thousand)) in the period from the closing of this Shareholders’ GeneralMeeting to that of the next Shareholders’ General Meeting.
c. On May 27, 2002, the Board of Directors resolved that the number of common shares the Company isauthorized to issue was increased from 224 million shares to 373.5 million shares. This resolution wasapproved at the Shareholders’ General Meeting held on June 26, 2002.
11. CONTINGENTLIABILITIES
12. SUBSEQUENTEVENTS

AIFUL CORPORATION Annual Report 2002 65
INDEPENDENT AUDITORS’ REPORT
To the Board of Directors and Shareholders ofAIFUL CORPORATION:
We have examined the non-consolidated balance sheets of AIFUL CORPORATION as of March 31, 2002and 2001, and the related non-consolidated statements of income and shareholders’ equity for the yearsthen ended, all expressed in Japanese yen. Our examinations were made in accordance with auditingstandards, procedures and practices generally accepted and applied in Japan and, accordingly, includedsuch tests of the accounting records and such other auditing procedures as we considered necessary in thecircumstances.
In our opinion, the non-consolidated financial statements referred to above present fairly the financialposition of AIFUL CORPORATION as of March 31, 2002 and 2001, and the results of its operations for theyears then ended in conformity with accounting principles and practices generally accepted in Japanapplied on a consistent basis.
Our examinations also comprehended the translation of Japanese yen amounts into U.S. dollar amountsand, in our opinion, such translation has been made in conformity with the basis stated in Note 3. SuchU.S. dollar amounts are presented solely for the convenience of readers outside Japan.
June 26, 2002
DELOITTE TOUCHE TOHMATSUKyoto, Japan
SHIMBASHI & CO.Osaka, Japan

NON-CONSOLIDATED SIX-YEAR SUMMARYAIFUL CORPORATION
AIFUL CORPORATION Annual Report 2002 66
Millions of Yen
2002 2001 2000
Results for the Fiscal Year: Total income ........................................................................ ¥ 311,843 ¥ 272,553 ¥ 239,200Total expenses ...................................................................... 239,189 180,078 154,490Income before income taxes ............................................... 72,654 92,475 84,710Income taxes ........................................................................ 35,001 45,011 42,399Deferred income taxes.......................................................... 696 1,048 1,793Net income .......................................................................... 38,349 48,512 44,104
At Year-End:Balance of loans outstanding ............................................. ¥ 1,313,690 ¥ 1,159,734 ¥1,001,080Total assets ........................................................................... 1,740,868 1,586,410 1,182,468Short-term borrowings ........................................................ 29,000 32,500 28,700Long-term debt, including current portion thereof ........... 1,233,979 1,186,674 863,469Total shareholders’ equity ................................................... 420,493 302,601 252,903
Per Share Data (Yen):Net income .......................................................................... ¥ 426 ¥ 572 ¥ 786
Adjusted for stock splits ................................................... — — 524Shareholders’ equity............................................................. 4,514 3,565 4,508
Adjusted for stock splits ................................................... — — 3,005Cash dividends .................................................................... 50 50 60
Adjusted for stock splits ................................................... — — 40
Other Data:Number of shares outstanding at year-end ........................ 93,376,000 84,876,000 56,103,000Number of customer accounts at year-end......................... 2,244,293 2,121,446 1,975,068Number of branches at year-end......................................... 1,601 1,529 1,311Number of employees at year-end ..................................... 3,576 3,477 3,263

AIFUL CORPORATION Annual Report 2002 67
Notes:1. Net income per share has been computed based on the weighted
average number of shares outstanding during each period, andshareholders’ equity per share is based on the number of sharesoutstanding at the end of each period.
2. Stock split (10 for 1) on August 1, 1996.3. Warrant exercised on September 27, 1996 (1,818,000 shares, ¥2,750).4. Stock split (2.5 for 1) on May 20, 1997.5. On June 18, 1997, by resolution of the Shareholders’ General Meeting,
the number of common shares issued was increased from 55 million to150 million.
6. Capital increased through issuance of shares by public offering on July30, 1997 (3,700,000 shares, ¥56,832).
7. On April 16, 1998, the Company issued 4,000,000 shares of commonstock in the amount of ¥33,084 million, in offshore transactions underregulations of the U.S. Securities Act of 1993 (“the Securities Act”), andin the United States in accordance with Rule 144A of the Securities Act.Of the total, ¥16,544 million and ¥16,540 million were credited tocommon stock and additional paid-in capital, respectively.
8. Stock split (1.2 for 1) on May 20, 1999.9. Stock split (1.5 for 1) on May 22, 2000.
10. Capital increased through issuance of shares by public offering onAugust 25, 2001 (8,500,000 shares, ¥10,241).
Millions of Yen
1999 1998 1997
¥ 205,536 ¥ 180,181 ¥ 150,176140,777 117,080 94,276
64,759 63,101 55,90036,311 38,097 33,095
— — —28,448 25,004 22,805
¥ 837,982 ¥ 702,446 ¥ 591,630996,524 876,727 724,314
58,900 98,000 39,548704,275 600,505 557,963203,749 146,255 93,055
¥ 611 ¥ 602 ¥ 1,548339 334 344
4,358 3,421 5,9572,421 1,901 1,324
60 60 1033 33 2
46,752,500 42,752,500 15,621,0001,822,261 1,706,030 1,530,094
1,009 807 6543,141 2,731 2,521

BOARD OF DIRECTORSAIFUL CORPORATION
As of June 26, 2002
AIFUL CORPORATION Annual Report 2002 68
President/Representative Director Yoshitaka Fukuda
Senior Managing Director/ Taichi Kawakita Restaurant & Entertainment DepartmentRepresentative Director
Senior Managing Directors Katsuhide Horiba General Manager – Finance Division
Guarantee Business Department
Sadatoshi Kobayashi Information Systems Department
Administration Office
Managing Director Yuji Kataoka General Manager – Personnel Division
Directors Yasutaka Fukuda Deputy General Manager – Finance Division
General Manager – Finance Department
Yoshimasa Nishimura Inspection Department
Koji Imada Administration Department
Credit Risk Management
Operations Department
Shintaro Hashima General Affairs Department
Legal Department
Takashi Koumoto General Manager – Accounting Department
Yoshinori Sogabe Public Relations Department
Masami Munetake General Manager – Management Planning Division
Yasuo Yanagibashi General Manager – Loan Business Division
Masayuki Sato
Hiroshi Abe General Manager – Business Management Department
Corporate Governance Department
Office of the President
Business Development Division
Kazumitsu Oishi
Takashi Noda
Standing Corporate Auditors Masanobu Hidaka
Tadao Mushiake
Yoshitaka Ebisuzaki
Corporate Auditor Yoshinobu Azuma

Corporate Name ........................................... AIFUL CORPORATION
Date of Establishment ................................. April 1967
Financial Year ............................................... April 1 to March 31
Independent Auditors.................................. Deloitte Touche Tohmatsu/Shimbashi & Co.
Transfer Agent and Registrar ...................... The Sumitomo Trust & Banking Co., Ltd.
Paid-in Capital.............................................. ¥83,317 million
Number of Shares of Common Stock........ Authorized: 224,000,000 shares
Issued and Outstanding: 93,376,000 shares
Number of Shareholders ............................. 7,857
Number of Employees ................................. 3,576
For further information and additional copies of this annual report, please contact:
Financial Headquarters
Investor Relations Section
Tokyo Office
Tokyo-Ekimae Bldg., 5th Floor, 1-5, Yaesu 2-chome, Chuo-ku, Tokyo 104-0028, Japan
http://www.ir-aiful.com
e-mail: [email protected]
Corporate Headquarters
381-1, Takasago-cho, Gojo-Agaru, Karasuma-Dori, Shimogyo-ku, Kyoto 600-8420, Japan
Phone: 075-201-2000
Common Stock Price Range
Fiscal year 2000 2000 2000 2000 2001 2001 2001 2001 2002 (1st) (2nd) (3rd) (4th) (1st) (2nd) (3rd) (4th) (1st)
High (¥) 12,450 12,450 10,460 10,370 11,400 12,150 11,140 8,710 9,290Low (¥) 8,840 8,840 8,430 8,040 8,850 9,550 8,380 6,680 7,130
*Stock split (1.5 for 1) on May 22, 2000.
Copyright © 2002 AIFUL CORPORATION
INVESTOR INFORMATIONAIFUL CORPORATION As of March 31, 2002