Embed Size (px)
Citation preview

This PDF is a selection from an out-of-print volume from the National Bureauof Economic Research
Volume Title: The Financing of Catastrophe Risk
Volume Author/Editor: Kenneth A. Froot, editor
Volume Publisher: University of Chicago Press
Volume ISBN: 0-226-26623-0
Volume URL: http://www.nber.org/books/froo99-1
Publication Date: January 1999
Chapter Title: The Moral Hazard of Insuring the Insurers
Chapter Author: James G. Bohn, Brian Hall
Chapter URL: http://www.nber.org/chapters/c7955
Chapter pages in book: (p. 363 - 390)

9 The Moral Hazard of Insuring the Insurers James G . Bohn and Brian J. Hall
9.1 Motivation
It has long been understood that insurance creates both benefits (risk reduc- tion) and costs (moral hazard-induced distortions to incentives). The existence of so many insurance contracts in the market suggests that, in a wide variety of cases, the benefits exceed the costs of insurance coverage. But what happens if the company providing insurance fails and is unable to pay off policyhold- ers? Presumably, there should be a market for insurance against insurance- company failure. But this just pushes the problem back a step. What if the in- surer of the insurer fails? If consumers desire genuine protection against risk, the market, with or without the government’s help, must figure out how to in- sure the insurers.
In the United States, the response to this problem has been the organization of quasi-governmental “guaranty funds” at the state level, each of which serves as the insurer of the insurance companies operating in that state. The state guaranty funds are implicitly backed by state governments, giving policyhold- ers reasonable certainty that their claims will be paid even if their insurance company becomes insolvent.
But, just as insurance distorts incentives to individuals, the second-level in- surance provided by the guaranty funds distorts the incentives of insurance companies. That is, guaranty-fund insurance creates incentives for insurance companies, especially those on the brink of failure, to engage in too much risk. But what form might this moral hazard take? Where might one look for evi-
James G. Bohn is an economist at the Board of Governors of the Federal Reserve System. Brian J. Hall is associate professor of business administration at the Harvard Business School and a faculty research fellow of the National Bureau of Economic Research.
The authors thank David Scharfstein, Christopher McGhee, Anne Gron, and Neil Doherty for helpful comments and Tom Gunderson for excellent research assistance.
363

364 James G. Bohn and Brian J. Hall
60 I
69 70 71 72 73 74 75 76 77 78 79 80 81 82 83 84 85 86 87 88 89 90 91 92 93 94 Year
Fig. 9.1 Number of property-casualty insurer insolvencies
dence of excessive risk? Does such evidence exist? These questions are the subject of this paper.
A major motivation for this study was a finding in previous research (Bohn and Hall 1995; Hall 1996) that the costs of resolving property-casualty insurance-company failures are surprisingly large. The total cost of resolving a property-casualty insurer failure’ is in the range of 100-120 percent of the company’s preinsolvency assets. This number is three to four times larger than analogous cost estimates of resolving depository-institution failures.2 More- over, both the number of property-casualty insurer insolvencies and the total costs of these insolvencies have risen in the last decade (see figs. 9.1 and 9.2). These large resolution costs suggest that the perverse incentives created by the guaranty-fund system may be large. That is, moral hazard may be an explana- tion for these large costs.
The starting point for our analysis is the parallel between deposit insurance and the insurance provided by guaranty funds, both of which provide second- level insurance against ins~lvency.~ The existence of (flat-rate) deposit insur- ance enables banks to engage in risky behavior without paying the appropriate
1. The total cost of resolving failures is equal to the costs of paying claims, plus the administra- tive costs of the liquidators and guaranty funds, minus recoveries from asset sales. Bohn and Hall (1995) found that the ratio of costs to preinsolvency assets was equal to one. Using an updated data set, Hall (1996) found this number to be about 1.2.
2. James (1991). Bovenzie and Murton (1988). and Barth, Bartholomew and Bradley (1991) all find that the net cost of resolving bank failures is about one-third of preinsolvency assets.
3. There are two main differences between the deposit-insurance and guaranty-fund systems. First, unlike the bank-insurance fund, the guaranty funds are not prefunded (assessments are levied after insolvencies occur since there is no “fund”). Second, the guaranty funds are operated at the state rather than the federal level. The guaranty-fund system is described in the next section.

365 The Moral Hazard of Insuring the Insurers
1400
1200
200
" 1979 1980 1981 1982 1983 1984 1985 1986 1987 1988 1989 1990 1991 1992 1993 1994
Year
Net Cost + Asw8amsnt.
Fig. 9.2 Aggregate net cost of resolving property-casualty insurer insolvencies and total guaranty fund assessments
price for their risk taking.4 Because depositors are insured against the risk of bank failure, they do not have incentives to monitor or discipline banks. Depos- its represent a risk-free, and adverse-selection-free, form of borrowing for banks. This enables even the riskiest of banks to borrow in capital markets. Indeed, by raising deposit rates by small amounts, banks were able to attract large amounts of deposits (made easier by an active brokered deposit market), which they then invested in risky 10ans.~ The existence of deposit insurance (albeit in combination with other factors) is widely believed to be the main cause of the savings-and-loan debacle, which in the end cost taxpayers approxi- mately $150 billion.
Although it has been much less studied by academics, the insurance pro- vided by guaranty funds creates similarly perverse incentives.6 Although insur- ance companies do not accept deposits, they do receive premiums. Since there is a lag between the time that premiums are received and the time that losses are paid out, attracting premiums is a way to borrow from policyholders. The key similarity between the two systems is that guaranty-fund insurance dimin- ishes the incentives of policyholders to monitor or discipline insurance compa- nies, just as deposit insurance decreases the incentives for depositors to moni- tor banks. Thus, the guaranty-fund system creates a peculiar way for insurance companies to borrow with little discipline from capital markets-by writing
4. For an analytic proof, see Menon (1977). 5 . For analysis of the savings-and-loan crisis and the perverse incentives created by deposit
6. Cummins (1988) analyzes how guaranty funds affect risk taking and how a risk-based pre- insurance, see Kane (1989).
mium structure can reduce the perverse incentives of guaranty funds.

366 James G. Bohn and Brian J. Hall
premiums. Consistent with this possibility, we find evidence of excessive pre- mium growth by property-casualty insurers in the years before insolvency. Moreover, this premium growth is more pronounced in long-tail lines, which have a long lag between premium payments and policyholder claims and there- fore represent a more attractive way for insurance companies to borrow from policyholders.
This paper proceeds as follows. In the next section, we provide some back- ground on the guaranty-fund system and describe the guaranty-fund rules. In the third section, we discuss the theory of how the guaranty funds create per- verse incentives for insurance companies, especially those on the brink of fail- ure. In the fourth section, we describe our data and present evidence on the degree of preinsolvency premium growth. In the fifth section, we disaggregate the premium growth into lines (e.g., personal property, corporate liability, etc.) and show that much of the fast growth in premiums is in long-tail lines. The sixth section contains some evidence on the relation between state regulatory resources and premium growth. The final section summarizes and contains ad- ditional discussion and interpretation of the results.
9.2 Guaranty Fund Background and Description of Rules
The guaranty-fund system was a response to a federal initiative in the late 1960s to establish a guaranty system for insurance companies similar to the FDIC.’ Worried about a federal government “takeover” of insurance-company regulation, the National Association of Insurance Commissioners (NAIC) proposed model legislation for the establishment of guaranty funds at the state level. By the early 1970s, about three-fourths of the states had adopted guaranty-fund provisions that were closely based on the NAIC’s model act. Most of the other states followed shortly thereafter.
Guaranty funds are generally nonprofit associations of all companies li- censed to write insurance within a state in lines covered by the guaranty fund. Insurance companies are required to be a part of the guaranty-fund system in order to obtain a license, The board of each guaranty fund is composed of representatives from member firms and from the state insurance commission- er’s office.
The state insurance departments, not the guaranty funds, are responsible for the regulation and oversight of insurance companies, which includes the pre- vention and detection of insurance-company insolvencies. Thus, involvement of the guaranty fund comes only after a company is declared to be insolvent, at which point the guaranty fund takes over the files of the failed insurer and pays the claims of policyholders.
In most cases, guaranty funds pay the full amount of policyholder claims in the same way that payment would be made by insurance companies. However,
7. Much of the material in this section is derived from Bohn and Hall (1993, Duncan (1987), and Epton and Bixby (1976).

367 The Moral Hazard of Insuring the Insurers
there are some caps and deductibles. In most states, and in most lines, the caps on the funds’ liability per claim are in the $300,000-$500,000 range. Thus, for the vast majority of claims, especially in personal lines, the caps are rarely binding. In addition, the deductibles are very small, ranging from $0.00 to $200 per claim, with most funds having a deductible of $100. Note also that, since guaranty funds pay only for the claims of the policyholders residing in their state, a failure of a multistate insurance company involves action on the part of multiple guaranty funds.
State insurance departments are responsible for the liquidation of the assets of the failed insurer. The proceeds of the liquidation are turned over to the guaranty funds to pay the claims of policyholders. Hall (1996) has shown, however, that, after paying all expenses related to the liquidation process, the state regulatory departments turn over an average of only thirty-seven cents for each dollar of preinsolvency assets. Thus, there is typically a large shortfall between the assets of the failed insurers and the obligations of the guaranty funds. The guaranty funds cover this shortfall by levying assessments against the solvent companies doing business in the state of the insolvent firms. The magnitude of assessments is directly proportional to a firm’s share of direct premiums written within a state in lines covered by the fund.* Thus, the size of assessments is not related to any measure of a company’s insolvency risk. Guaranty funds also make assessments to cover their administrative, legal, and other expenses.
Guaranty funds are not really funds since all but New York operate on a postassessment basis. That is, guaranty funds maintain no reserves and assess member insurance companies only after an insolvency O C C U ~ S . ~ In most states, the assessment amount is capped at 2 percent of premiums written per year, although some states maintain lower caps. In addition, most state regulations contain provisions that enable companies to partially offset assessments. For example, most states include the cost of assessments as a factor in determining premiums. In addition, many states allow insurers to recover a portion of their assessment with credits against their premium taxes, which shifts a portion of the costs of the insolvency to other state taxpayers.
9.3 Theory: Guaranty-Fund Insurance and Moral Hazard
We begin by thinking about an insurance company that is insolvent or nearly insolvent but still operating because it has not yet been “caught” by the regula- tors. The company is having trouble meeting its expenses because of misman-
8. Guaranty funds are typically organized into separate accounts covering broad lines of insur- ance. The most common form of organization has three separate accounts-workers’ compensa- tion, automobile, and “all other” types of insurance. However, different states operate as few as one or as many as six accounts.
9. New York State adopted guaranty-fund legislation in 1947. Unlike other funds, New York‘s operates on a preassessment basis. The state maintains a fund of $150-$200 million for the resolu- tion of insurance failures. Firms writing insurance in the state are assessed whenever the fund balance falls below the lower bound.

368 James G. Bohn and Brian J. Hall
agement, higher than expected losses, or some other circumstance. The man- agement of the firm would like the firm to continue operations. That is, the firm needs to find some cash in order to continue operating (and to pay its employees’ and executives’ salaries, among other things). There are three main options available to such a firm:
Option 1. The company could raise outside financing. However, if the market requires the company to pay something even close to the appropriate risk pre- mium, such financing would be extremely costly. In addition, such a company may not be able to raise any outside financing at all because of credit rationing (see Stiglitz and Weiss 1981). Moreover, the current owners of such a firm are likely to have some knowledge of the firm’s financial circumstances and are therefore reluctant to inject additional capital.
Option 2. The company could sell off some of its assets to raise cash.I0 How- ever, such an action may be very transparent to regulators since assets are fairly easy to measure and value (at least relative to liabilities) and such firms do not want to become noticed by the regulators. These firms have an incentive to behave in ways that increase their riskiness, but they must balance the benefits of engaging in risky behavior against the costs of increasing the probability of getting caught.
Option 3. The company could attract more premiums, perhaps at prices below expected costs. The key insight is that selling premiums is similar to taking out a loan; premium payments represent an immediate inflow of cash and require (probabalistic) payments to be made at a later date. However, because the guar- anty fund protects policyholders against insolvency risk, this type of “loan” (i.e., selling of premiums) is an adverse-selection-free form of finance. In order to borrow in this peculiar way, firms do not have to pay a large risk premium (because the guaranty funds protects the lenders, who in this case are the poli- cyholders); nor do insurance companies need to worry about being credit ra- tioned out of the market when they borrow in this way. Perhaps equally impor- tant, it seems likely that option 3 would be less transparent to regulators than option 2 (selling assets) since reserving (which involves the estimation of the liability created by a particular policy) is an inexact science. That is, if a com- pany needs cash and wants to game the system, it is likely to be easier to write more premiums and reduce its reported liabilities (by underestimating its future losses) than to sell off its assets, which are more easily measured by regulators.
To see why writing premiums is essentially borrowing money from policy- holders consider the following equation:
10. In related work, Hall (1996) presents evidence that the assets of many failed companies are of poor quality, which is consistent with this possibility.

369 The Moral Hazard of Insuring the Insurers
where P is premiums, C is costs, r is the interest rate, and L is losses. The left- hand side of the equation shows the revenues, net of the cost to operate the company, that a company generates during the year from writing premiums. Assuming for simplicity that all losses come in the subsequent period, the right-hand side shows the expectation of next-period losses at time t + 1. Com- petitive pressures, or, more precisely, a zero-profit condition, imply equality between the two in expectation. Note that, when a firm writes a policy, it essen- tially borrows premiums (net of costs), which it then pays back to policyhold- ers with interest.
This equation can be rewritten as:
The left-hand side is equal to borrowing by the insurance company, and the right-hand side is equal to the net present value of (collective) repayment by policyholders. Without guaranty-fund insurance, an insolvent or nearly insol- vent company’s repayments would be heavily discounted by lenders (policy- holders). In practice, this would mean that premium prices would have to be lowered substantially. However, the existence of guaranty-fund insurance re- moves the riskiness of “lending” to insurance companies, enabling them to borrow at something close to the risk-free rate. This implies that, because of guaranty-fund insurance, highly risky insurance companies should be able to increase their premiums (and, therefore, their cash flow) substantially with only small changes in premium prices.
As noted earlier, our story of how the guaranty-fund system affects the in- centives of insurance companies is very similar to models in the banking litera- ture about the moral hazard problems associated with deposit insurance. De- posit insurance enables banks, even risky ones, to borrow from depositors at the risk-free rate. The incentive to borrow at the risk-free rate and use the funds to make high-risk loans is especially attractive to poorly capitalized banks. Deposit insurance and limited liability combine to give the owners of the com- pany what is essentially a put option. For banks “at the money” or “out of the money” (insolvent or nearly insolvent), increasing the volatility of their eam- ings increases the value of the bank.
That same principle applies to insurance companies. The incentive to bor- row excessively from policyholders (attract premiums) and to use themoney to make risky investments (perhaps by writing high-risk policies andor under- reserving) is especially strong for insurance companies that are already insol- vent. Like the banks, they face “heads-I-win-tails-somebody-else-loses” in- centives. Indeed, Kane (1989) has argued that the combination of poorly capitalized banks, deposit insurance, and regulatory forbearance created what he termed savings-and-loan zombies, so-called because they sucked the life

370 James G. Bohn and Brian J. Hall
out of the healthy savings and loans by competing away their business with their aggressively risky behavior. This put the solvent savings and loans at risk, which in turn created more zombies. Although we do not test for this in our empirical section, our analysis of the incentives created by the guaranty funds suggests at least the possibility that the guaranty-fund system could create zombie insurance companies.
Finally, it should be noted that an extreme case of our story of how in- surance companies can game the guaranty-fund system is through a Ponzi scheme. In our previous story, insurance companies were gaming the system by maximizing the expected value of the company, which involved high risks since the downside is essentially capped at zero. Under a Ponzi scheme, even a company that has no hope of ever becoming solvent can play. A company can increase premium growth while writing negative net present value (NPV) policies. When the losses occur, the company can pay these claims by writing even more negative NPV policies. A company can then live to another day, with all the benefits to management that are associated with continued opera- tions. As is well known, however, all Ponzi schemes eventually fail. We come back to this issue in the final section, where the results are discussed and inter- preted.
9.4 Preinsolvency Premium Growth
One way to examine the moral hazard effects of guaranty-fund insurance is to analyze how company financial condition correlates with risk-taking behav- ior. Ideally, one could analyze whether exogenously determined poor financial conditions were associated with excessive premium growth and other types of risk-taking behavior. However, in addition to the difficulty in finding a good instrument for financial condition, even using uninstrumented capital ratios as a measure of financial condition may be problematic. If our measure of capital is quite noisy (because companies that are gaming the system are also able to manipulate their book-value measure of capital), then a correlation between truly low capital rates and game playing may be hard to detect. Moreover, if, in addition to those companies gaming the system, there are many responsible companies-companies with negative shocks to their capital positions behave conservatively in the next period in order to regain their preshock financial status (a type of mean reversion)-then it will be difficult to find evidence of gaming the system even if such evidence exists. Thus, although this approach (analyzing all companies in poor financial condition) has considerable merit, it also has potentially serious problems. We thus decided to take a different ap- proach.
Our approach is to examine the preinsolvency behavior of companies that become insolvent. While this approach does not represent a formal test proving causality between the guaranty fund and risk taking (measured by excessive premium growth in this case), it does have an obvious advantage: if game play- ing does exist and is serious enough to cause a significant number of insolven-
371 The Moral Hazard of Insuring the Insurers
cies, then one should be able to detect a pattern of excessive premium growth prior to insolvency in a sample of failed companies.
9.4.1 Data Description
Our sample consists of property-casualty insurance firms that failed between 1987 and 1995. The initial set of failed firms was assembled from Best’s Insur- ance Reports and the list of failures involving guaranty-fund activity provided by the National Conference of Insurance Guaranty Funds (see NCIGF 1991- 93). For each failed firm, we searched Best’s and LexdNexis for the date on which the firm was declared insolvent.” All our analysis was conducted at the firm rather than the group level. We define year t as the year in which the firm was found to be insolvent. Years prior to the year of failure are henceforth referred to as t - 1, the calendar year prior to the year in which the firm was found insolvent, t - 2, t - 3, and so forth.
The set of firms was then merged with accounting information from the National Association of Insurance Commissioners’s (NAIC) annual statement database. Firms that did not file annual statements in the three years prior to insolvency were omitted from the sample. Thus, we have information concern- ing the financial position and business mix of each active firm for the three- year period prior to assumption of management of the firm by regulators. There are 135 failed insurance companies in our sample.
9.4.2 Results
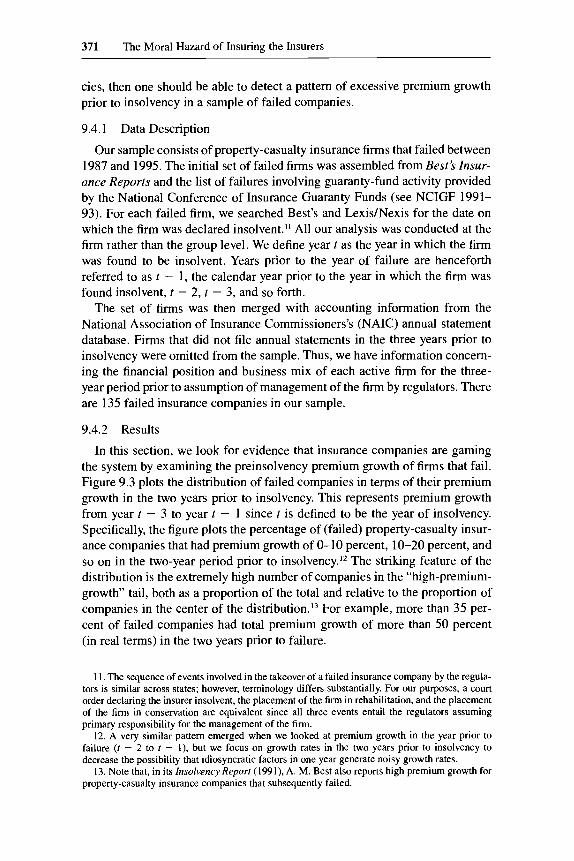
In this section, we look for evidence that insurance companies are gaming the system by examining the preinsolvency premium growth of firms that fail. Figure 9.3 plots the distribution of failed companies in terms of their premium growth in the two years prior to insolvency. This represents premium growth from year t - 3 to year t - 1 since t is defined to be the year of insolvency. Specifically, the figure plots the percentage of (failed) property-casualty insur- ance companies that had premium growth of 0-10 percent, 10-20 percent, and so on in the two-year period prior to insolvency.’* The striking feature of the distribution is the extremely high number of companies in the “high-premium- growth” tail, both as a proportion of the total and relative to the proportion of companies in the center of the di~tribution.’~ For example, more than 35 per- cent of failed companies had total premium growth of more than 50 percent (in real terms) in the two years prior to failure.
11. The sequence of events involved in the takeover of a failed insurance company by the regula- tors is similar across states; however, terminology differs substantially. For our purposes, a court order declaring the insurer insolvent, the placement of the firm in rehabilitation, and the placement of the firm in conservation are equivalent since all three events entail the regulators assuming primary responsibility for the management of the firm.
12. A very similar pattern emerged when we looked at premium growth in the year prior to failure (f - 2 to t - l), but we focus on growth rates in the two years prior to insolvency to decrease the possibility that idiosyncratic factors in one year generate noisy growth rates.
13. Note that, in its Insolvency Reporr (1991), A. M. Best also reports high premium growth for property-casualty insurance companies that subsequently failed.

372 James G. Bohn and Brian J. Hall
0.35 0.3 3 0.25 -
<dox 4 O l O J o x -Zoto-lox OIDlrn ?0l0sox 40OtoMX >loox d D t o M Jol*-2mc -totom l O t o ? m 901010% 50tolOOX
Pnmium G&
Fig. 9.3 Premium growth from year t - 3 to year t - 1,135 failed firms
0.35
0.3
< 6 0 % 4 0 10 -30% -20 lo -10% 0 lo 10% 20 10 30% 40 to 50% > 100% -50 10 40% -30 I 0 -20% -10 lo 0% 10 to 209- 30 to 40% 50 to 100De
Premium GroWh
I Failed Firms 0 Matching Firms
Fig. 9.4 Premium growth from year t - 3 to year t - 1,135 failed and 540 solvent firms matched by size and year
In order to determine whether the large percentage of high-growth firms in the failed sample is unusual, we compared our sample with a matched sample-on the basis of asset size and year failed. In order to reduce noise, we picked four matches (the two nearest larger and the two nearest smaller) for each of our 135 failed firms. The two-year premium-growth rates are plotted in figure 9.4. While the matched sample also contains a reasonably large num- ber of high-growth companies, presumably because these firms are relatively

373 The Moral Hazard of Insuring the Insurers
small by industry standards, the percentage of high-growth firms is less than half the percentage of high-growth companies in the failed sample. The evi- dence suggests that there is an unusually large percentage of firms that grew quickly prior to failure. This is consistent with the view that the incentives created by the guaranty funds are leading to moral-hazard-induced fast pre- mium growth.
9.5 Premium Growth and Business Composition
In the previous section, we showed that a disproportionate number of failed insurance companies had unusually high premium growth prior to failure. In this section, we disaggregate the premiums into line composition to determine which lines were associated with this growth. The key question is, If insurance companies are gaming the system, which lines are they likely to increase the most?
9.5.1 Long-Tail Lines
There are several reasons to suspect that insurance companies that seek to game the system are likely to use premium growth in long-tail lines. First, it is harder to estimate the future losses in long-tail lines precisely. Liability claims are less predictable than, for example, physical damage from automobile ac- cidents. While insurance companies normally find uncertainty about future losses an unattractive feature, it is a desirable characteristic for a company that wishes to game the system by underreserving. Second, the simple fact that long-tail lines create long-term borrowing opportunities for insurance- company garners makes premium growth in these lines attractive. The one thing desired by insurance companies that want to game the system is more time. Increasing premium growth in long-tail lines enables companies to buy that time.
9.5.2 Results
In order to test this possibility, we divided our failed sample into fast-growth (real premium growth of over 50 percent between year t - 3 and year t - 1) companies and slow-growth companies. We then looked at how the fraction of premiums in long-tail lines changed for the fast-growth firms relative to the slow-growth firms in a variety of lines of business. (The precise definitions of how we categorized the lines of business appears in the appendix.) The results are presented in table 9.1. The first three columns show the results for the forty- seven fast-growth companies. The fraction of premiums written in the specific line is shown for t - 3, then t - 1, followed by the change between the two years. The results are then repeated for the eighty-seven slow-growth firms in the next three columns.
The results indicate that fast-growth companies increased their fraction of premiums in long-tail lines from an average of about 31 percent to almost 70

374 James G. Bohn and Brian J. Hall
Table 9.1 Failed Firms Partitioned by Growth Rates"
Fast Fast Slow Slow Mean Mean Change Mean Mean Change
Line of Business t - 3 r - 1 in Fast r - 3 1 - I in Slow
% in long-tail lines 30.98 69.79 +38.81 62.56 59.84 -2.73
property 28.25 21.14 -7.10 18.69 16.78 -1.91
liability 14.53 40.00 +25.47 28.21 24.94 -3.27
property 41.51 12.79 -28.71 22.78 29.53 6.74
liability 15.70 26.05 + 10.35 30.31 28.74 -1.56
% in personal
% in personal
% in corporate
% in corporate
% in workers' compensation 13.61 9.74 -3.88 13.44 12.85 -.59
% in automobile 38.31 58.43 +20.12 40.38 36.01 -4.36
Statistical Tests of Changes
Change Change r-Test Wilcoxon in Fast in Slow (p-value) (p-value)
% in long-tail lines +38.81 -2.13 .0263 ,0396 % in personal property -7.10 -1.91 ,5089 ,603 1 % in personal liability + 25.47 -3.27 .0111 ,0041 % in corporate property -28.71 6.74 .0370 ,1691 % in corporate liability + 10.35 - 1.56 ,3962 ,7364 % in worker's compensation -3.88 -.59 ,2404 ,9762 % in automobile +20.12 -4.36 .0069 ,0193
'Includes forty-seven high-growth and eighty-seven low-growth failed firms.
percent. This represents a 39 percentage point increase in the share of business in long-tail lines. By contrast, the fraction of premiums in long-tail lines for the slow-growth firms was essentially unchanged, falling by about 3 percent- age points. Moreover, both a t-test and a Wilcoxon rank sum test, which are shown in the bottom portion of table 9.1, confirm that the differential change in the share between fast-growth firms (38.8 percent) and slow-growth firms (-2.7 percent) is statistically significant. The strong relative movement into long-tail lines for the potential garners (firms with fast premium growth) is therefore consistent with our theory that increasing long-tail lines is a desirable way to game the system.
In order to determine more precisely which lines fast-growth insurers are moving into, we adopt narrower definitions of the insurer's lines of business. The results are shown in the next six rows of table 9.1. First, the four combina- tions of personalkorporate and property/liability are considered. Then, work- ers' compensation and automobile are considered. Two results stand out. First,

375 The Moral Hazard of Insuring the Insurers
while there is some change in the lines of the fast-growth firms, none of the categories of lines change significantly for the slow-growth firms. Unlike the fast-growth companies, these slow-growth companies march forward toward insolvency with little aggregate change in the composition of their business.
Second, the primary reason for the increase in the fraction of premiums in long-tail lines for the fast-growth firms is the increase in personal, not corpo- rate, liability lines, as indicated by the aggregate 25 percentage point increase in the share in personal liability lines. There is only a 10 percent increase in the share of corporate-liability lines, and this change is not statistically differ- ent from the near-zero (- 1.6 percent) change in the corporate-liability share for the slow-growth firms.
There are at least two reasons why gaming firms may choose to increase growth in personal liability premiums rather than in corporate-liability premi- ums. First, losses in corporate-liability lines tend to be larger and are therefore more likely to exceed the guaranty-fund caps. Thus, corporate buyers of liabil- ity insurance may care about the solvency of insurers in a way that individual buyers do not. Second, corporate-insurance purchasers are likely to be better informed about the rules and the financial condition of the insurer than individ- ual purchasers of liability insurance. That is, the relative inability of individu- als who purchase liability insurance (which consists primarily of automobile- liability insurance) to learn about and understand the guaranty-fund rules may make growth in this category ideal for companies that want to game the guaranty-fund system. The large (20 percent) increase in the fraction of premi- ums in automobile for the fast-growth firms, shown in the last row, is consistent with this story.
In order to test the robustness of these basis results, we compared the fast- growth failed companies with a matched sample of fast-growth nonfailed (again, greater than 50 percent growth) companies. Each high-growth failed firm was matched by size and year with four high-growth healthy firms. The results, shown in table 9.2 and using the same procedure as in table 9.1, tell the same basic story. All the comparisons are basically the same, which is not surprising given that, like the slow-growth failed firms, the fast-growth non- failed firms show little change in any of the lines of business. The fact that potential gamers (fast-growth failed firms) increase their fraction of premiums in long-tail lines (especially personal liability) while a similar set of fast- growing nongaming firms does not strengthen the case that premium line changes of the gamers is unu~ua1.I~
As a final test, we compared the slow-growth failures with a matched set
14. If companies are gaming the system with fast premium growth, then, unless they are all Ponzi schemes, some companies should be expected to succeed ( k . , to gamble and remain sol- vent). Our ability to find a matched sample of fast-growing nonfailed firms is consistent with this story. That is, our sample of fast-growth nonfailures may include some “gamers” that succeed.

376 James G. Bohn and Brian J. Hall
Table 9.2 High-Growth Firms Partitioned by Failure”
Failed Failed Matched Matched Mean Mean Change Mean Mean Change in
Line of Business t - 3 f - 1 in Failed t - 3 1 - 1 Matched
% in long-tail lines 9% in personal
property % in personal
liability % in corporate
property % in corporate
liability % in workers’
compensation % in automobile
30.98 69.79 +38.81 45.21 48.40 +3.19
28.25 21.14 -7.10 26.42 24.64 -1.79
14.53 40.00 +25.47 17.86 19.21 + 1.35
41.51 12.79 -28.71 35.11 33.41 -1.71
15.70 26.05 +10.35 20.59 22.74 +2.15
13.61 9.74 -3.88 4.21 6.14 f1.93 38.31 58.43 +20.12 34.69 33.15 + .46
Statistical Tests of Changes
Change Change f-Test Wilcoxon in Failed in Matched (p-value) (p-value)
% in long-tail lines % in personal property % in personal liability
+38.81 +3.19 ,0483 ,0406 -7.10 - 1.79 ,4952 ,2984
+25.47 + 1.35 ,0160 ,0002 % in corporate property -28.71 -1.71 .0909 ,1042 % in corporate liability + 10.35 +2.15 ,555 1 .023 1 % in workers’ compensation -3.88 -1.93 ,0338 ,0514 % in automobile +20.12 f .46 ,0036 .o009
’Includes 47 high-growth failed firms and 187 high-growth solvent firms matched by the calendar year of the annual statement and assets in year t - 2.
(again, matched by size and year) of slow-growth nonfailures. Results of the comparison appear in table 9.3. Neither group showed any significant change in its line of busine~s,’~ so it is not surprising that the statistical tests showmo statistical differences between (the changes in) the two groups. Both the failed slow-growth and the nonfailed slow-growth companies seem to be marching forward with little change in their mixes, the former into insolvency, the latter into relative prosperity.
Finally, we used regression analysis to determine whether the relative changes in business composition hold controlling for various factors. We com- bine the samples of failed and matched firms from tables 9.2 and 9.3 to deter- mine whether the potential gamers (fast-growth failed firms) changed their business composition relative to nongamers. The change in the share of a firm’s
15. It has already been established in table 9.1 above that the slow-growth failed companies did not change their line mix significantly.

377 The Moral Hazard of Insuring the Insurers
Table 9.3 Slow-Growth Firms Partitioned by Failure"
Failed Failed Matched Matched Mean Mean Change Mean Mean Change in
Line of Business r - 3 t - 1 in Failed r - 3 t - 1 Matched
% in long-tail lines 62.56 59.84 -2.73 44.15 44.90 + .75 % in personal
% in personal
% in corporate
% in corporate
% in workers' compensation 13.44 12.85 -.59 6.00 6.06 + .06
% in automobile 40.38 36.01 -4.36 29.21 30.02 +.81
property 18.69 16.78 -1.91 30.66 29.76 - .90
liability 28.21 24.94 -3.27 15.42 16.61 +1.19
Property 22.78 29.53 6.74 31.89 32.63 + .72
liability 30.31 28.74 -1.56 22.03 20.98 -1.04
Statistical Tests of Changes
Change in Failed
Change r-Test in Matched (p-value)
% in long-tail lines -2.73 % in personal property -1.91 % in personal liability -3.27 % in corporate property f6.74 % in corporate liability ~ 1.56
- .59 % in automobile -4.36 % in workers' compensation
+.75 .4816 ~ .90 ,5533
+1.19 .4 149 + .72 ,3028 - 1.04 ,8227 + .06 ,6106 +.81 ,4177
Wilcoxon (p-value)
.8847 S380 ,5453 ,8102 ,1136 ,1098 ,2793
'Includes 87 slow-growth failed firms and 350 matching solvent firms matched by the calendar year of the annual statement and assets in year r ~ 2.
line of business was regressed on a constant, FAST (equals one if a fast-growth firm), FAILED (equals one if failed), and FASTFAIL, the interaction of FAST and FAILED. FASTFAIL is the coefficient of interest since this coefficient indicates how garners change their business composition relative to nongam- ers. We also included additional control variables, which are defined in the ap- pendix. An indicator for MUTUAL was included. ASSETS was included as a proxy for size, and LEVER, the ratio of liabilities to assets, was included to cap- ture the capital position of the firm.
The results, shown in tables 9.4 and 9.5, tell a similar story. In the specifica- tion with the change in the fraction of long-tail lines as the dependent variable, the coefficient on the interaction term FASTFAIL is positive and statistically significant, indicating a significant increase (about 39 percentage points) in the fraction of long-tail lines for potential garners. Moreover, as before, this in- crease is in personal liability and automobile lines, as indicated by the positive and significant coefficients on FASTFAIL in those two specifications. Con-

378 James G. Bohn and Brian J. Hall
Table 9.4 Change in Business Composition prior to Failure
Variable Long-Tail Lines Personal Property Personal Liability
INTERCEPT
FAST
FAILED
FASTFAIL
MUTUAL
ASSETS
LEVER
Adjusted R2
,0047 (.0256) .0282*
(.0165)
(.0473) .3899**
(.1801) ,0123
(.0153) .0737*
(.0439)
(.0503) ,0542
-.0313
-.0088
-.0194 (.0195)
(.0134)
(.0190)
(.078 1)
(.0142) - ,0305 (.0279) ,0257
-.0073
-.0145
- ,0436
-.0036
(.@W -.001
.0362** (.O 166) - .0057 (.0118)
-.0039 (.0511)
(.1094) - ,0030 (.0104)
(.03 18)
(.0303) ,0497
.2876***
-.0257
- ,0438
Note; Dependent variable is the change in the share of a firm’s business in each line between year t - 3 and year t - 1, where t = 0 is the year of insolvency. Sample contains 134 failed and 532 matched solvent firms. All independent variables are defined in the appendix. Heteroskedasticity- consistent standard errors are given in parentheses. *Significant at the 10 percent level. **Significant at the 5 percent level. ***Significant at the 1 percent level.
versely, when corporate liability is the dependent variable, the coefficient on FASTFAIL is positive, but the magnitude is small (0.08) and not close to being statistically significant. In sum, the results of tables 9.4 and 9.5 corroborate the findings of the earlier tables.
9.6 Regulatory Resources and Excessive Premium Growth
The final issue that we address is whether there is any evidence that a higher level of resource expenditures by state insurance regulators is effective in re- ducing the amount of excessive premium growth. To the extent that companies are gaming the system in the way we have described, one would expect that increased regulatory scrutiny, which is likely to be positively correlated with the state’s regulatory resources, would reduce the degree of game playing.
In order to test this idea, we employ a logit model with high growth as the dependent variable and various measures of regulatory resources as the explan- atory variables. As in the earlier sections, we define high-growth firms as those that increase premium growth by 50 percent or more between year t - 3 and year t - 1 . We also include the same control variables as in tables 9.4 and 9.5.
The measures of regulatory resources include BUDCOl and BUDC02, the state regulatory budget divided by the number of insurance companies in the

379 The Moral Hazard of Insuring the Insurers
Table 9.5 Change in Business Composition prior to Failure
Commercial Commercial Workers’ Variable Property Liability Compensation Automobile
INTERCEPT ,0203 - .0372* -.0010 .0370**
FAST -.0297* .0428*** .0203* -.0125 (.0240) (.0189) (.0108) (.O 179)
(.0159) (.0151) (.0110) (.0170) FAILED . O W - ,0068 - .0066 -.0450
(.0555) (.0230) (.0136) (.0596) FASTFAIL -.3280** ,0838 - .05 15* .2505***
(.1648) (.1379) (.0289) (.0895) MUTUAL -.0141 .0207* - ,0020 - .0046
(.0149) (.O 12 1) (.0042) (.0177) ASSETS p.0142 ,0706 ,0539 - ,0390
(.0366) (. 11 82) (.0472) (.0398) LEVER -.0162 ,0342 .Doll - ,0508
(.0510) (.0323) (.0200) (.0354) Adjusted R2 ,0374 ,0141 ,0153 ,0325
Note: Dependent variable is the change in the share of a firm’s business in each line between year r - 3 and year t - 1, where t = 0 is the year of insolvency. Sample contains 134 failed and 532 matched solvent firms. All independent variables are defined in the appendix. Heteroskedasticity- consistent standard errors are given in parentheses. *Significant at the 10 percent level. **Significant at the 5 percent level. ***Significant at the 1 percent level.
state (determined two ways; for precise definitions, see the appendix), and EXAMCOl and EXAMC02, the number of examiners in the state’s regulatory office divided by the number of companies (again, defined two ways). Greater regulatory resources may limit the ability of insurers to game the system. An increased number of examiners may make it more likely that regulators will be able to detect unusual activity by an insurer. Regulators can then either take action to curtail the activities of a firm or petition the court to declare the insurer insolvent and placed under state supervision. In most cases, the entity filing the petition of insolvency is the office of the insurance commissioner in an insurer’s state of domicile. Thus, the resources available to the commis- sioner in the state of domicile should have some effect on the ability of an insurer to game the guaranty fund.
The problem, of course, is that none of the measures of regulatory resources are exogenous. In particular, one might expect that an increase in insurance- company risk taking might lead to a greater need for regulatory resources. This biases the results against finding that more regulatory resources lead to lower game playing. Nevertheless, we believe that this exercise is worth doing to see if there is evidence of a regulatory effect in spite of this bias.
The results with the failed sample are shown in table 9.6. In all four cases, the coefficient on regulatory resources is negative, indicating that more re-

380 James G. Bohn and Brian J. Hall
Table 9.6 Logit Model of the Likelihood of Fast Premium Growth for Failed Property and Casualty Insurers
Model 1 Model 2 Model 3 Model 4
INTERCEPT
MUTUAL
ASSETS
LEVER
BUDCOI
BUDC02
EXAMCOI
EXAMC02
Pseudo R2
I ,0048 (S417)
-1.2641 (3476)
-24.5389** ( 1 1.90 10) - ,9775 (3233)
-5.7852** (2.7468)
,1169
1.0262* (S686)
(3529) -23.8942**
(1 1.8983) - 1.0433
(3228)
- 1.2363
1.5290** (6407)
-1.1423 (.n470)
- 20.8848* (1 1.4587) - 1.0532
(.n276)
-2.9895* (1.7026)
-6.0972** (2.7409)
,095 1 ,1288
1.49 1 O* * (.7285)
- 1.2244 (3601)
- 19.0954* (1 1.0735) -1.1231
(3156)
-2.5846 (1.7036)
,1050
Nore: Fast premium growth is defined as a 50 percent or greater real increase in direct premium writings between t - 3 and t - 1, where f = 0 is the year of insolvency. Dependent variable = 1 if company exhibited high growth in direct premium writings, 0 otherwise. N = 132 with 47 high- growth firms and 85 low-growth firms in each model. Independent variables are defined in the appendix. Asymptotic standard errors are given in parentheses. Excludes firms domiciled in Puerto Rico and U.S. territories. *Significant at the 10 percent level. **Significant at the 5percent level.
sources are associated with a decreased probability that the company is a high- growth gamer. Moreover, two of the coefficients are significant at the 5 percent confidence level, and one is significant at the 10 percent level. In terms of the implied magnitude of the effect, the coefficients imply that a 10 percent in- crease in the amount of budgetary resources is associated with approximately a 0.9 percent decrease in the probability that the firm is high growth (model 1). Using model 3, the results indicate that a 10 percent increase in the number of examiners is associated with a 2 percent decrease in the probability that the firm is high growth. Thus, the magnitudes of the coefficients imply a modest, but not insignificant, effect.
The same tests are then repeated for the nonfailed sample. These results are shown in table 9.7. The coefficients on the budgetary variables are again nega- tive, but, as expected, the effects are smaller in magnitude.I6 Moreover, none
16. The effect of a change in regulatory resources on the likelihood of a solvent firm falling into the fast-growth category is about one-fifth as large as it is for the corresponding model using failed firms.

381 The Moral Hazard of Insuring the Insurers
Table 9.7 Logit Model of the Likelihood of Fast Premium Growth for the Matched Set of Solvent Property and Casualty Insurers
Model 1 Model 2 Model 3 Model 4
INTERCEPT
MUTUAL
ASSETS
LEVER
BUDCOI
BUDC02
EXAMCOI
EXAMC02
Pseudo R2
.5620*** (.2083)
- 1.3015*** (.2739)
- 19.8502*** (5.4194) - 1.0957***
(.3818) - 1.2001 (1.5740)
,1276
.5270** (.2 197)
-1.2939*** (.2747)
- 19.7396*** (5.4325) - 1.1231***
(.3813)
-.2637 (.9450)
1269
.5893*** (.2148)
- 1.2952*** (.2734)
- 19.6684*** (5.40 16) 1.1020*** (.3813)
-.5244 (S619)
,1281
.5513** (.2255)
(.2740) - 19.7042***
(5.4087) - 1.1245* **
(.3791)
- 1.2956***
-.1340 (.2944) ,1271
Nore: Fast growth is defined as a 50 percent or greater real increase in direct premium writings between t - 3 and t ~ 1, where t = 0 is the year of insolvency. Dependent variable = 1 if company exhibited high growth in direct premium writings, 0 otherwise. N = 526 with 186 high-growth firms and 340 low-growth firms in each model. Independent variables are defined in the appendix. Asymptotic standard errors are given in parentheses. Excludes firms domiciled in h e r t o Rico and U.S. territories. **Significant at the 5 percent level. ***Significant at the 1 percent level.
are statistically significant. These results should be interpreted with the caveat that they are weak and are biased in the direction of not finding a relation between regulatory resources and game playing. Nevertheless, taken together, the results suggest that more regulatory resources may be effective in curbing excessive premium growth by firms attempting to game the guaranty-fund system.
9.7 Summary and Conclusion
The savings-and-loan and commercial banking crisis of the late 1980s and 1990s led to a large literature on the moral hazard effects of deposit insurance. Research on the moral hazard of the guaranty-fund system-the moral hazard of insuring the insurers-pales in comparison. This paper is an attempt to fill that gap.
We first explain the mechanism through which the guaranty-fund system may create moral hazard and then describe how this moral hazard might mani- fest itself in terms of insurance-company behavior. We start with a parallel

382 James G. Bohn and Brian J. Hall
between bank deposit insurance and guaranty-fund insurance, both of which provide second-level insurance against the failure of the relevant financial in- stitution. Just as deposit insurance enables banks to borrow at the risk-free rate from insured depositors, guaranty-fund insurance enables insurance compa- nies to borrow at (approximately) the risk-free rate from policyholders. The key insight is that premium payments are similar to borrowed funds since there is a lag, which is particularly long in long-tail lines, between premium pay- ments and policyholder claims. Thus, we argue that one way that insurance com- panies can game the guaranty-fund system is through a peculiar type of borrow- ing-fast premium growth.
The patterns that emerge in the data are consistent with this story. More than one-third of insolvent property-casualty insurance companies had very high premium growth in the two years prior to failure. And, as might be expected if companies are gaming the system in the way we have described, this premium growth was more pronounced in long-tail than in short-tail lines. Moreover, the increase in long-tail lines was driven by personal liability lines-where the guaranty-fund caps are less likely to be binding-rather than corporate- liability lines. Finally, it was shown that excessive premium growth was less pronounced in states that had greater regulatory resources. Taken together, the results are strikingly consistent with the moral hazard story that we have de- scribed.
Despite this, it is possible that the risky insurance-company behavior that we have documented would have occurred even without the guaranty-fund sys- tem. For example, it may be the case that insurance companies take advantage of buyers who are relatively uninformed about the financial condition of the firm. Thus, insurance companies may be able to game the system by increasing premium growth to these “credit-insensitive” buyers. Indeed, this story is con- sistent with the evidence that premium growth was more pronounced in per- sonal lines than in corporate lines; it seems likely that individuals are less informed than corporations about the financial condition of insurance com- panies.
Although our analysis reveals some striking patterns consistent with guaranty-fund-induced moral hazard, it is clear that additional research is needed to establish the extent to which the risky behavior documented in this paper is caused by the existence of the guaranty-fund system. One potential direction for future research is to make use of the state variation in guaranty- fund caps. Although this variation is not large, such an approach has the poten- tial to provide a purer test of the proposition that guaranty-fund insurance cre- ates moral hazard. In addition, if good insurance-company data can be found for the 1960s, another possibility is to compare insurance-company behavior before and after the introduction of the guaranty-fund system. Finally, as dis- cussed in section 9.4, yet another approach is to start with the set of all insur- ance companies and then analyze how firm financial conditions influence firm risk taking.

383 The Moral Hazard of Insuring the Insurers
Additional research is also needed to increase our understanding of the na- ture and degree of insurance-company risk taking. This study has considered only one type of moral hazard-excessive premium growth. Our understand- ing of the incentive effects of insurance-company regulation would be greatly increased by an investigation of other ways in which insurance companies en- gage in excessively risky behavior.
Appendix
Business Mix Definitions
Personal property = Farmowner’s and homeowner’s multiple peril,
Personal liability = Automobile liability. Corporate property
automobile physical damage.
= Commercial multiple peril, fire, allied lines, earth- quake, aircraft, inland and ocean marine, financial guarantee lines.
Corporate liability = Workers’ compensation, medical malpractice, products and other liability, accident and health Lines.
Long-tail lines = Personal and corporate-liability lines and financial guarantee lines.
Automobile = Automobile liability and automobile physical damage.
Workers’ compensation = Workers’ compensation.
Data Definitions
FAST = FAST = 1 if the direct premiums written by the insurer in- creased by more than 50 percent in real terms in the two years prior to insolvency, that is, between year t - 3 and year t - 1.
FASTFAIL = FASTFAIL = 1 if FAST = 1 and the firm became insolvent in year t , 0 otherwise.
MUTUAL = MUTUAL = 1 if the firm has a mutual form of ownership, 0 otherwise.
ASSETS = The assets of the firm in billions of 1994 dollars on the annual statement filed on 31 December of year t - 3, where year t is the year of insolvency.
= The ratio of liabilities to assets of the firm on 31 December of year t - 3, where t is the year the firm was found insolvent.
= The budget of the insurance commission in the state of domi- cile divided by the number of firms domiciled in that state. In- surance commission budget is for the year 1990, and the num-
LEVER
BUDCOl

384 James G. Bohn and Brian J. Hall
ber of firms domiciled in the state is taken from Best 5 Solvency Study-Property/Casualty.
EXAMCOl = The number of examiners employed by the insurance commis- sion in the state of domicile divided by the number of firms domiciled in that state. The number of examiners is for the year 1990, and the number of firms domiciled in the state is taken from Best 5 Solvency Study-Property/Casualty.
= Same as BUDCOl with the exception that the number of firms domiciled in the state was obtained from the 1990 demograph- ics file of the NAIC annual statement database.
EXAMC02 = Same as EXAMCOl with the exception that the number of firms domiciled in the state was obtained from the 1990 demo- graphics file of the NAIC annual statement database.
BUDCO2
References
Barth, J., P. Bartholmew, and M. Bradley. 1991. Determinants of thrift resolution costs.
A. M. Best. Various years. Best’s solvency study-property/casualty. Oldwick, N.J. Journal of Finance 45:73 1-54.
. Various years. Best’s insurance reports. Oldwick, N.J.
. 1991. Insolvency report. Oldwick, N.J. Bohn, James G., and Brian J. Hall. 1995. Property and casualty solvency funds as a tax
and social insurance system. Working Paper no. 5206. Cambridge, Mass.: National Bureau of Economic Research, August.
Bovenzie, J., and A. Murton. 1988. Resolution costs and bank failures. FDIC Banking Review 1 : 1-1 3.
Cummins, J. David. 1988. Risk-based premiums for insurance guarantee funds. Journal of Finance 43:823-39.
Duncan, M. 1987. Property-liability post assessment guaranty funds. In Issues in insur- ance (4th ed.), ed. Everett D. Randall. Malvern, Pa.: American Institute for Property and Liability Underwriters.
Epton, B., and R. Bixby. 1976. Insurance guaranty funds: A reassessment. DePaul Law Review 25:227-63.
Hall, Brian J. 1996. Regulatory free cash flow and the high cost of insurance company failures. Discussion Paper no. 1782. Harvard Institute of Economic Research, Sep- tember.
James, Christopher M. 1991. The losses realized in bank failures. Journal of Finance
Kane, Edward J. 1989. The S&L insurance mess: How did it happen? Washington, D.C.: Urban Institute Press.
Merton, Robert C. 1977. An analytic derivation of the cost of deposit insurance and loan guarantees: An application of modem option pricing theory. Journal of Banking and Finance 1 :3-1 I .
National Conference of Insurance Guaranty Funds (NCIGF). 199 1-93. Assessment and financial information. Indianapolis.
Stiglitz, Joseph, and Andrew Weiss. 1981. Credit rationing in markets with imperfect information. American Economic Review 71:393-410.
46: 1223-42.

385 The Moral Hazard of Insuring the Insurers
Comment Christopher M. McGhee
The Bohn and Hall paper provides a clear exposition on an important aspect of the risk-management issues that one needs to try to understand when think- ing about the insurance industry.
There are essentially two main parts of Hall and Bohn’s thesis. First, when insurance companies are on the brink of insolvency, they raise cash the cheap- est way they can. For insurance companies, this means that they write more premium and that this growth is concentrated in long-tail personal lines classes, especially personal automobile liability. Intuitively, this seems logical, and the data that Hall and Bohn present is reasonably convincing. A point that is not examined in the paper, but that also seems likely, is that, given that these companies operate in a competitive marketplace (a safe assumption in the United States), they can do this only by cutting prices. There is a reasonable, if not high, probability that they do this at prices that are too low. It would be helpful to attempt to ascertain if this speeds and/or deepens the insurance company’s insolvency. It seems plausible that it would at least deepen the insol- vency. If one were to discover that insurance companies, in fact, generate new business by cutting prices, then it would be interesting to try and see what effect insurance market cycles might have on the data. The point is simply that, if prices are high relative to risk at a given point in time, companies engaging in this “inappropriate” behavior might get away with it for a longer period of time than if the market were soft. Said another way, one might expect to see a lag in the insolvency rate relative to the period of rapid premium growth under these circumstances. It is also clear that, if the business is being “bought” by these companies by cutting prices, this complicates Hall’s and Bohn’s analysis significantly, as one needs to know whether consumers are credit insensitive or, conversely, whether they are willing to take the increased credit risk if they get enough price discount.
The second main part of the thesis posits how insurance companies can con- vince consumers to pay them premium, that is, effectively loan them the use of their premium dollars. The authors suggest that the presence of state guar- anty funds makes these consumers less credit sensitive than they would other- wise be if no guaranty fund existed. The authors conclude that the rapid pre- mium growth of many insurers, particularly in long-tail lines for private individuals, in the two years preceding their insolvency suggests that this is true. On this point, I am less convinced as there are other possibilities that could explain the data.
Let me pose an alternative explanation. One could categorize buyers of in- surance in many different ways, but, here, I suggest that we categorize and rank them into four categories on the basis of their credit sensitivity (or rather lack of it), as follows.
Christopher M. McGhee is a managing director of Marsh and McLennan Securities Corpora- tion, the investment banking subsidiary of Marsh and McLennan Companies.

386 James G. Bohn and Brian J. Hall
The first group would be those individuals who are not credit sensitive with respect to the premiums that they pay for insurance. One can come up with at least three reasons why this might be true. First, the consumer thinks of insur- ance premiums as a tax (as might be the case for mandatory automobile insur- ance) and as such tries only to get the cheapest premium. Second, this group may perceive that the credit risk is so small that it essentially does not matter. After all, these consumers might say, “I really care a lot only if the insurance company won’t pay when I have a loss, and the chances that I have a loss are so small that I don’t really think I’m going to have one. Otherwise I lose only my premium.” (But most consumers think that they “lose” their premium when they pay it anyway.) Consumers, one might guess, would think of this credit decision very differently than when they put their life savings in a bank. Cur- sory review of some of the data that Hall and others have provided suggests, in fact, that the expected value of the credit risk that consumers face when they lend to banks is an order of magnitude or two greater than when buying insur- ance policies. Finally, this group would include those who just do not know enough to think about credit risk-the truly credit-risk insensitive.
Our next three groups are all credit sensitive, but their judgments are influ- enced by different factors and information.
Our second group is credit sensitive, but these consumers’ own credit-risk evaluation is unaffected by the presence of guaranty funds. This is because they may not know that they exist. Indeed, this is not implausible when one considers that, in about half the states, insurance agents operate under a “gag” rule that enjoins them from telling their customers that a guaranty fund even exists. This group may rely instead on ratings from the rating agencies, and rating agencies may be slow to catch “misbehaving” insurers until it is too late.
Our third group of insurance buyers is also credit sensitive, but these con- sumers are affected by the presence of guaranty funds. Bohn and Hall suggest that consumers fall into this category. It bears considering, however, that in this group one might also include those individuals who do not know of the exis- tence of the guaranty funds explicitly but simply think that the government will pay if a failure occurs. It would be interesting to attempt to ascertain whether this perception varies depending on the cause of insolvency, that is, whether the insolvency is caused by a disaster (e.g., a humcane or an earth- quake) or by a “normal” insolvency. Note that there is a potentially important counterargument to critics of guaranty funds embedded here. That is, if people think that the government will step in to help them out in the event of a failure, and if they think this regardless of whether they know of the existence of guar- anty funds, then it could be argued that having the guaranty funds is beneficial because at least it provides a well understood and reasonably orderly process for handling the claims of insolvent companies.
Our fourth group of insurance consumers is made up of the most sophisti- cated buyers of insurance. Here, again, the presence or absence of guaranty funds has little to do with their buying decisions. This group knows that guar-

387 The Moral Hazard of Insuring the Insurers
anty funds exist. But they also know that limits apply on how much can be paid out from a guaranty fund. They are likely to be aware that, if they buy from an insurance company that then becomes insolvent and they then have to make a claim against the state guaranty fund, significant time delays in actually getting paid would almost certainly occur. Such time delays are not very palat- able to customers who have just suffered a large financial loss. Furthermore, this group may know that the state guaranty funds are unfunded and may not have confidence that the funds could pay one hundred cents on the dollar if a really large insolvency, or a series of insolvencies, occurred. Those in this group are likely to rely on the credit assessment of rating agencies and their own intermediaries for credit information. It is worth noting that a large per- centage of commercial insurance business is placed through insurance brokers. Brokers work for the insured and therefore may be more focused on protecting the interests of their clients than would insurance agents who are legal repre- sentatives of the insurance carrier.
These are our four groups. We might consider who falls into each of our four categories. Taking our fourth group first (our very sophisticated buyers), one might reasonably think that this includes many, if not most, buyers of com- mercial insurance.
The other three categories would presumably be composed predominately of private individuals buying personal lines coverages. I suspect that consum- ers who buy only automobile insurance are more likely to fall into category 1, our least-credit-sensitive group. I suspect this because one might guess that, if they have a mortgage, most home buyers are influenced by the lending institu- tion to use '%"-rated security or better, at least for their home loan, and thus are educated to at least some modest extent to be credit sensitive.
An insurance company with declining credit worthiness trying to rapidly grow its premium writings would presumably go after the less-sophisticated buyers of insurance in categories 1,2, and 3, with special emphasis on category 1, that is, our credit-insensitive group. The authors' data is consistent with this, as rapid premium growth was concentrated in the sale of personal automobile insurance.
Under my alternative explanation, only one of our four groups actually is sensitive to the presence of the guaranty funds, and it is possible that most of the rapid premium growth may not come from this group.
What matters, of course, is how much of the buying population falls into each of our categories. Bohn and Hall's analysis would be significantly ex- tended by attempting to measure the credit sensitivity of the insurance-buying population. Note that the fact that guaranty funds were created strongly sug- gests that many believe that a significant portion of the population is credit insensitive. The authors have acknowledged that further research on this sub- ject is needed. Nevertheless, the paper is an excellent start with regard to the public policy issues that the presence of guaranty funds create.
As a postscript, it may be instructive to note that the presence of moral haz-

388 James G. Bohn and Brian J. Hall
ard has been well understood in the reinsurance industry and that the reinsurers (the insurers of insurers) structure what they sell to respond to this risk. With- out going into any detail, I would simply note that, traditionally, reinsurers have effectively been selling long-term contracts, but with an annual right to review their deals, change the terms, or exit completely. In this review process, information gathering much beyond what is publicly available is taken into account. This gives the reinsurer powerful protection from being gamed over- time by an insurer. Note that this “behavior-regulation” effect is largely absent in guaranty funds. One might try to examine, therefore, whether the presence or absence of reinsurance correlates with insolvency.
Comment David Scharfstein
Insurance companies have long understood the concept of moral hazard-that insuring their clients against adverse events induces them to take less caution than they otherwise would. If James Bohn and Brian Hall are correct, as I think they are, insurance companies have learned a lesson from their clients. Insurance companies are themselves insured by state guaranty funds. The re- sult of “insuring the insurers,” according to Bohn and Hall, is that insurers become aggressive risk takers when they become financially distressed.
Bohn and Hall start by observing that insurers can increase revenues by offering insurance policies at more attractive premiums. Because they are in- sured by state guaranty funds, customers care little about whether the insurance company will have enough capital to pay any future claims. Thus, financially distressed insurers have an easy way of avoiding liquidation in the short run; they simply price low, increase premiums written, and use the income to pay off short-term loans. Of course, in the longer run, there will be claims against the insurers, and they will not have the capital to meet their obligations. In- stead, the guaranty funds foot the bill. The story is not too different from the savings-and-loan failures of the 1980s and the subsequent bailouts.
The paper marshals three pieces of evidence that together suggest that the description given above is a valid one. First, Bohn and Hall find that many property-and-casualty insurers failed after very high premium growth. Second, much of the premium growth is in long-tail lines, where there is much greater uncertainty about future losses. The greater uncertainty means that the insurer could get lucky and have limited losses. And, third, this risk-taking behavior is less pronounced in states where regulatory oversight is greater.
The first two facts alone are not enough to tell a compelling story that failed insurers game the system by taking excessive risk when they get into financial
David Scharfstein is the Dai-Ichi Kangyo Bank Professor of Management at the Sloan School of Management, Massachusetts Institute of Technology.

389 The Moral Hazard of Insuring the Insurers
trouble. The bankruptcy courts are littered with companies-financial and non- financial alike-that tookrisks and lost. For example, the airline People Express went bankrupt after a period of rapid growth. In the year that it went bank- rupt alone, its revenue grew by nearly 25 percent. It gambled, and it lost. It is the third fact-in combination with the other two-that convinces me that failed insurers were taking excessive risk; they gambled less when there was more regulatory oversight. This tells us that many of the insurers consciously exacer- bated the problem by using the state guaranty funds to subsidize their risk- taking behavior.
While Bohn and Hall have identified the moral hazard costs of the state guaranty fund, it is hard to go from their analysis to any claims about whether the system is worthwhile. Because the analysis looks only at the insurers that actually failed, we do not know anything about the insurers that were able to avoid distress owing to the guarantees of the fund. For example, absent a state guaranty fund, it would be difficult for an insurer with some unlucky large losses to get any new business or retain its old customers because of a fear that their claims would not be paid. The loss of these customers would exacerbate the problem and make it more likely that the insurer would not be able to pay. Default would be a self-fulfilling prophecy. This argument is similar to the rationale behind deposit insurance for banks.
To get some sense of the costs and benefits of state guaranty funds, it might be better to analyze the behavior of distressed or poorly performing insurers rather than just the failed insurers. The critical question is how these insurers respond to distress. Some will choose to take excessive risk and will fail; others will recover without taking excessive risk. Thus, one could estimate the frac- tion of insurers that accelerate premium growth (particularly in long-tail lines) after the onset of distress. And one could estimate the extent to which this is related to regulatory oversight and caps on guaranty funds. These estimates will give some sense of the extent to which state guaranty funds induce ineffi- ciencies.
Finally, it is worth thinking about how one could improve the current system. Ideally, just as there is risk-based deposit insurance, one would like insurers to pay risk-based insurance premiums; that is, less well-capitalized insurers should pay more into the state guaranty funds. In this way, insurers internalize at least some of the costs of taking excessive risk. However, the current system is the exact opposite of what one would want. The more highly capitalized, less risky insurers end up paying more to the state guaranty funds because they are forced to bail out their bankrupt competitors. One would hope that, just as the bank defaults led to changes in the way banks are regulated, the defaults of property and casualty insurers would also lead to changes in the way insurers are regulated.

This Page Intentionally Left Blank